Area Code 702 Map & Demographics
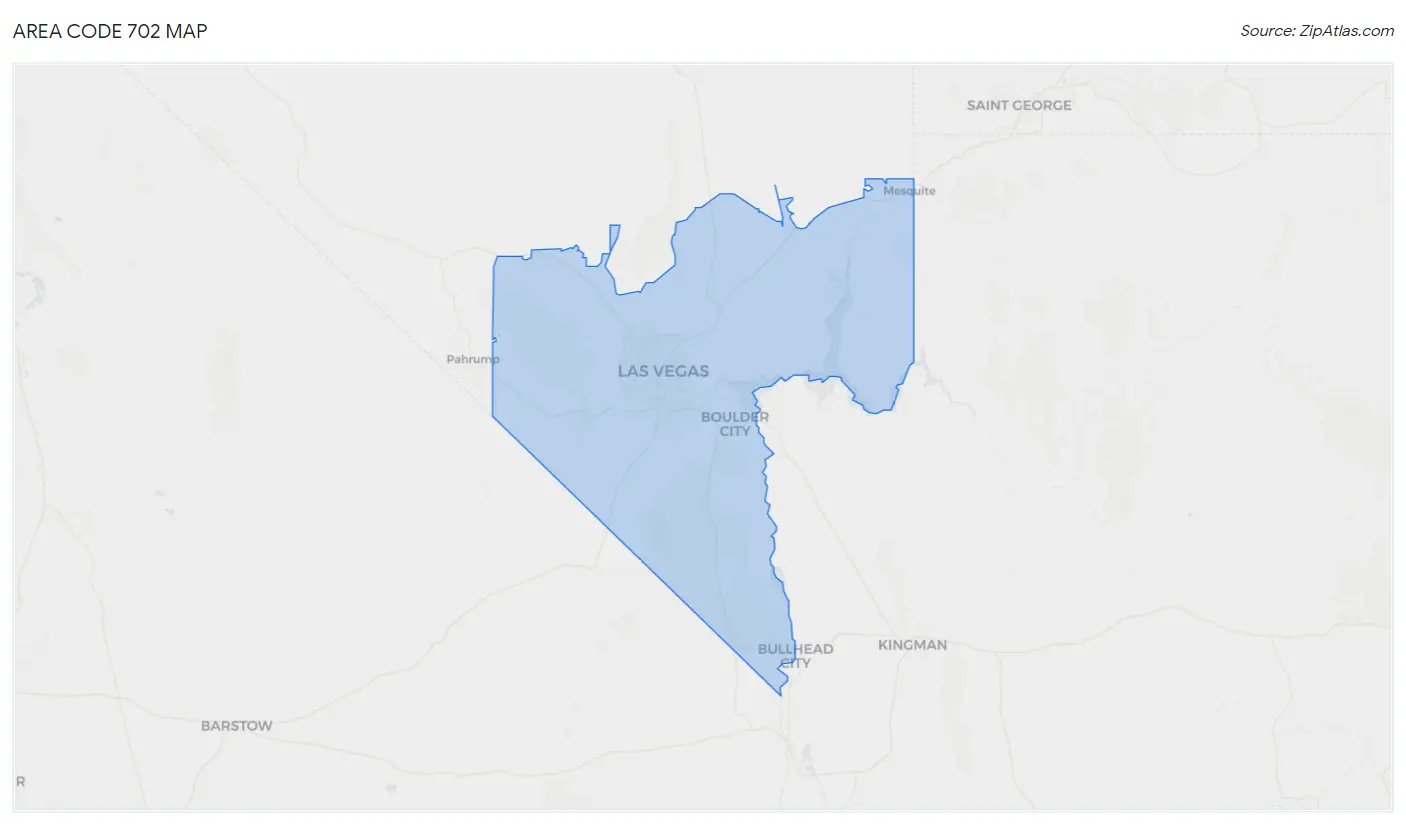
Area Code 702 Map
Area Code 702 Overview
$39,112
PER CAPITA INCOME
$87,218
AVG FAMILY INCOME
$75,399
AVG HOUSEHOLD INCOME
22.5%
WAGE / INCOME GAP [ % ]
77.5¢/ $1
WAGE / INCOME GAP [ $ ]
$11,099
FAMILY INCOME DEFICIT
33.14
INEQUALITY / GINI INDEX
2,285,657
TOTAL POPULATION
1,147,650
MALE POPULATION
1,138,007
FEMALE POPULATION
100.85
MALES / 100 FEMALES
99.16
FEMALES / 100 MALES
41.1
MEDIAN AGE
3.2
AVG FAMILY SIZE
2.6
AVG HOUSEHOLD SIZE
1,093,345
LABOR FORCE [ PEOPLE ]
59.8%
PERCENT IN LABOR FORCE
8.2%
UNEMPLOYMENT RATE
Income in Area Code 702
Income Overview in Area Code 702
Per Capita Income in Area Code 702 is $39,112, while median incomes of families and households are $87,218 and $75,399 respectively.
| Characteristic | Number | Measure |
| Per Capita Income | 2,285,657 | $39,112 |
| Median Family Income | 537,774 | $87,218 |
| Mean Family Income | 537,774 | $8,255,487 |
| Median Household Income | 840,826 | $75,399 |
| Mean Household Income | 840,826 | $7,363,713 |
| Income Deficit | 537,774 | $11,099 |
| Wage / Income Gap (%) | 2,285,657 | 22.45% |
| Wage / Income Gap ($) | 2,285,657 | 77.55¢ per $1 |
| Gini / Inequality Index | 2,285,657 | 33.14 |
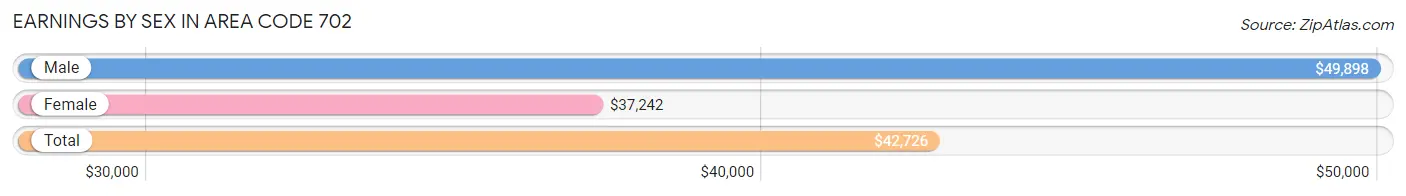
Earnings by Sex in Area Code 702
Average Earnings in Area Code 702 are $42,726, $49,898 for men and $37,242 for women, a difference of 25.4%.
| Sex | Number | Average Earnings |
| Male | 636,088 (53.6%) | $49,898 |
| Female | 549,504 (46.4%) | $37,242 |
| Total | 1,185,592 (100.0%) | $42,726 |
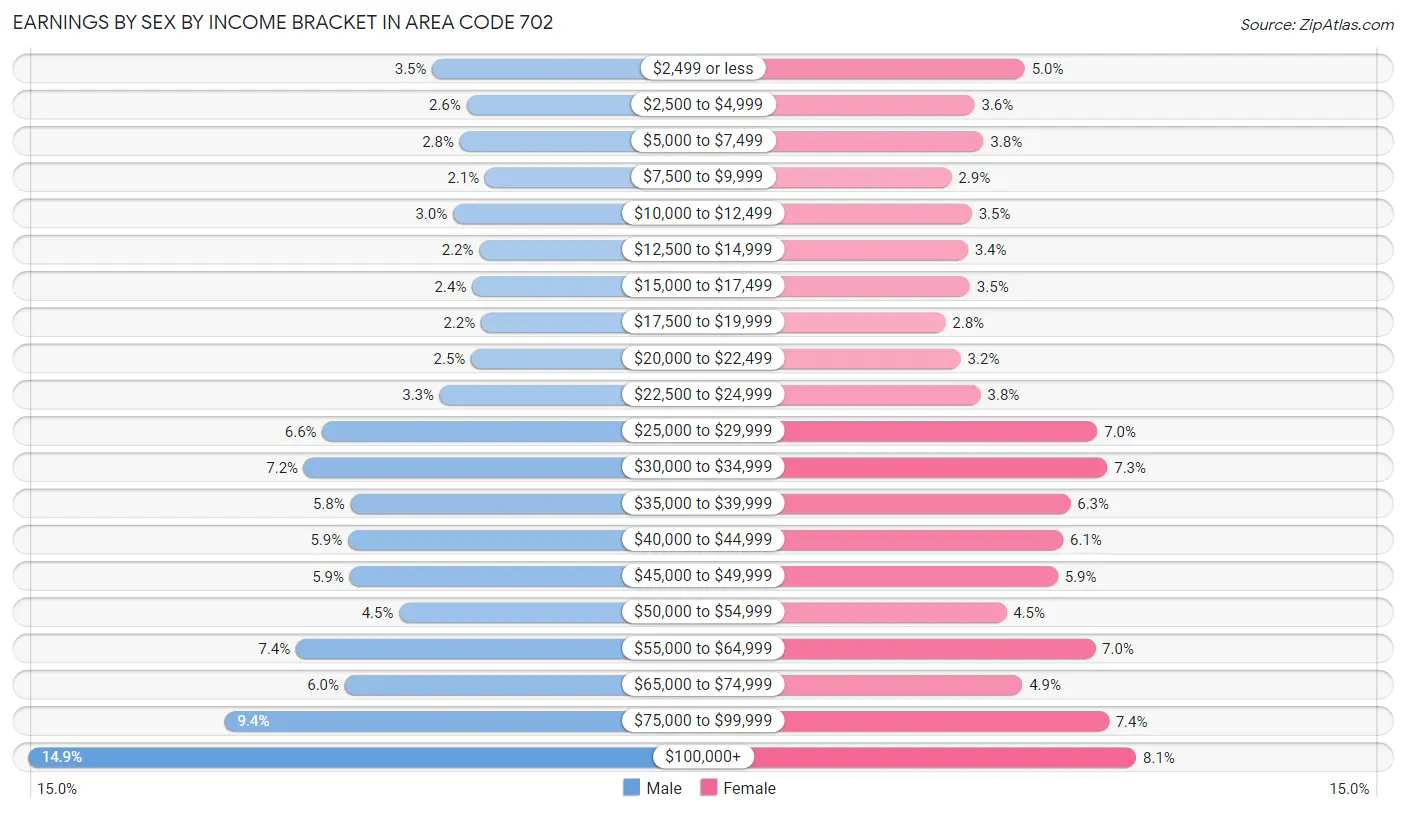
Earnings by Sex by Income Bracket in Area Code 702
The most common earnings brackets in Area Code 702 are $100,000+ for men (94,629 | 14.9%) and $100,000+ for women (44,698 | 8.1%).
| Income | Male | Female |
| $2,499 or less | 22,520 (3.5%) | 27,502 (5.0%) |
| $2,500 to $4,999 | 16,406 (2.6%) | 19,727 (3.6%) |
| $5,000 to $7,499 | 17,633 (2.8%) | 21,099 (3.8%) |
| $7,500 to $9,999 | 13,104 (2.1%) | 16,150 (2.9%) |
| $10,000 to $12,499 | 18,801 (3.0%) | 19,280 (3.5%) |
| $12,500 to $14,999 | 14,151 (2.2%) | 18,674 (3.4%) |
| $15,000 to $17,499 | 15,367 (2.4%) | 19,007 (3.5%) |
| $17,500 to $19,999 | 13,814 (2.2%) | 15,235 (2.8%) |
| $20,000 to $22,499 | 15,601 (2.5%) | 17,598 (3.2%) |
| $22,500 to $24,999 | 21,191 (3.3%) | 20,656 (3.8%) |
| $25,000 to $29,999 | 42,185 (6.6%) | 38,666 (7.0%) |
| $30,000 to $34,999 | 45,494 (7.1%) | 40,207 (7.3%) |
| $35,000 to $39,999 | 37,173 (5.8%) | 34,489 (6.3%) |
| $40,000 to $44,999 | 37,605 (5.9%) | 33,418 (6.1%) |
| $45,000 to $49,999 | 37,254 (5.9%) | 32,572 (5.9%) |
| $50,000 to $54,999 | 28,427 (4.5%) | 24,644 (4.5%) |
| $55,000 to $64,999 | 46,907 (7.4%) | 38,347 (7.0%) |
| $65,000 to $74,999 | 38,159 (6.0%) | 27,106 (4.9%) |
| $75,000 to $99,999 | 59,667 (9.4%) | 40,429 (7.4%) |
| $100,000+ | 94,629 (14.9%) | 44,698 (8.1%) |
| Total | 636,088 (100.0%) | 549,504 (100.0%) |
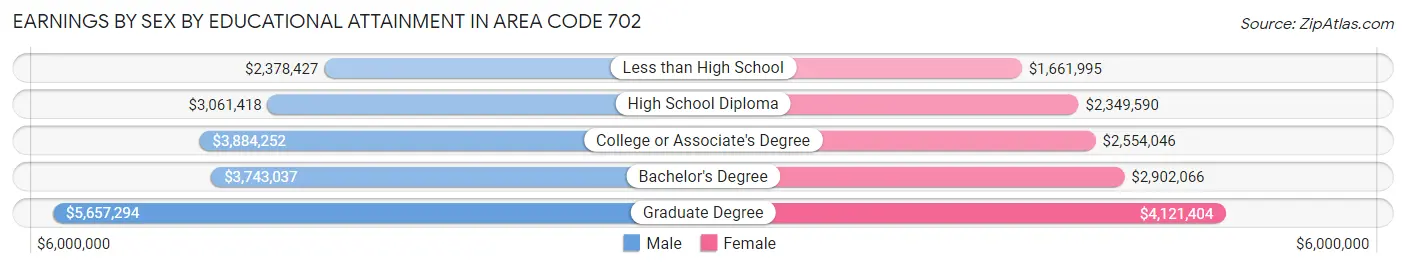
Earnings by Sex by Educational Attainment in Area Code 702
Average earnings in Area Code 702 are $3,991,472 for men and $2,902,808 for women, a difference of 27.3%. Men with an educational attainment of graduate degree enjoy the highest average annual earnings of $5,657,294, while those with less than high school education earn the least with $2,378,427. Women with an educational attainment of graduate degree earn the most with the average annual earnings of $4,121,404, while those with less than high school education have the smallest earnings of $1,661,995.
| Educational Attainment | Male Income | Female Income |
| Less than High School | $2,378,427 | $1,661,995 |
| High School Diploma | $3,061,418 | $2,349,590 |
| College or Associate's Degree | $3,884,252 | $2,554,046 |
| Bachelor's Degree | $3,743,037 | $2,902,066 |
| Graduate Degree | $5,657,294 | $4,121,404 |
| Total | $3,991,472 | $2,902,808 |
Family Income in Area Code 702
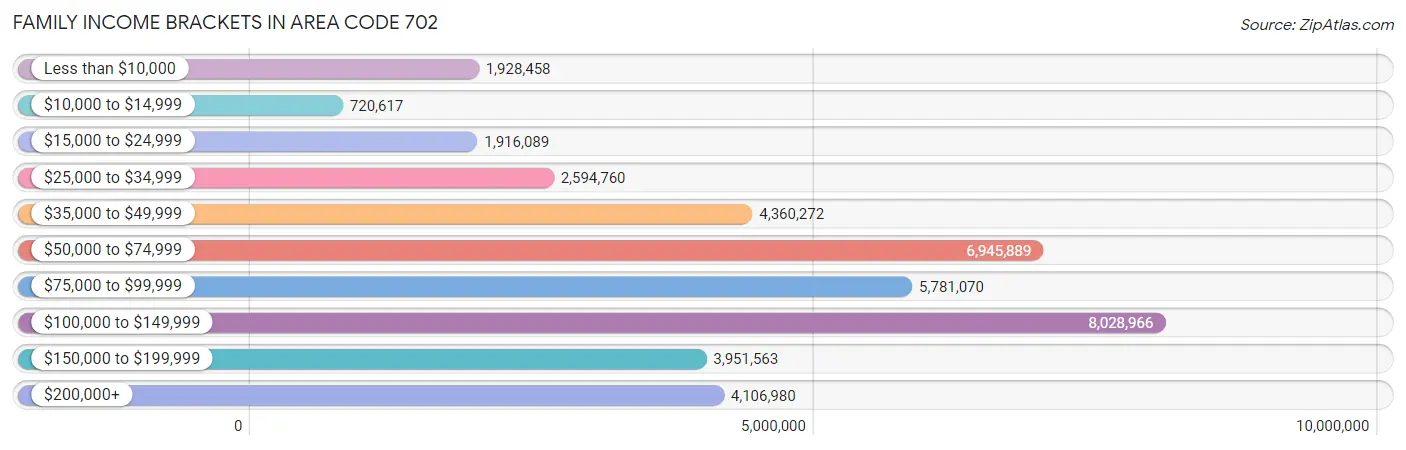
Family Income Brackets in Area Code 702
According to the Area Code 702 family income data, there are 8,028,966 families falling into the $100,000 to $149,999 income range, which is the most common income bracket and makes up 1,493.0% of all families. Conversely, the $10,000 to $14,999 income bracket is the least frequent group with only 720,617 families (134.0%) belonging to this category.
| Income Bracket | # Families | % Families |
| Less than $10,000 | 1,928,458 | 358.6% |
| $10,000 to $14,999 | 720,617 | 134.0% |
| $15,000 to $24,999 | 1,916,089 | 356.3% |
| $25,000 to $34,999 | 2,594,760 | 482.5% |
| $35,000 to $49,999 | 4,360,272 | 810.8% |
| $50,000 to $74,999 | 6,945,889 | 1,291.6% |
| $75,000 to $99,999 | 5,781,070 | 1,075.0% |
| $100,000 to $149,999 | 8,028,966 | 1,493.0% |
| $150,000 to $199,999 | 3,951,563 | 734.8% |
| $200,000+ | 4,106,980 | 763.7% |
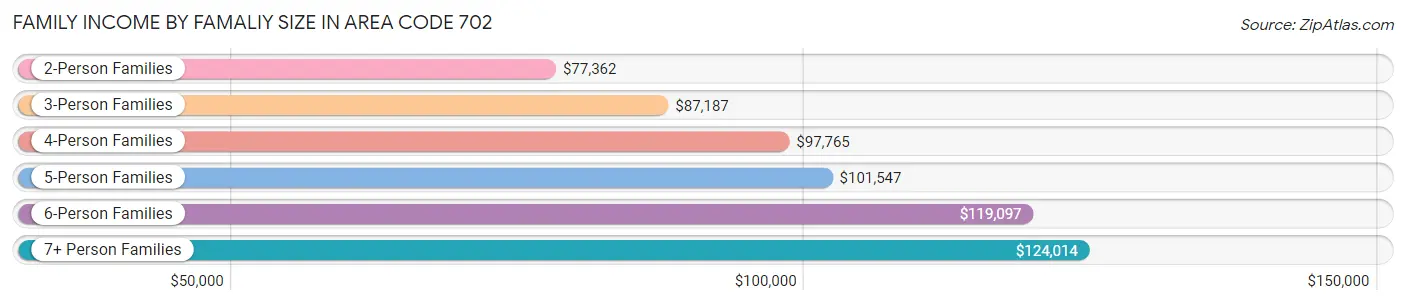
Family Income by Famaliy Size in Area Code 702
7+ person families (13,006 | 2.4%) account for the highest median family income in Area Code 702 with $124,014 per family, while 2-person families (242,057 | 45.0%) have the highest median income of $38,681 per family member.
| Income Bracket | # Families | Median Income |
| 2-Person Families | 242,057 (45.0%) | $77,362 |
| 3-Person Families | 118,262 (22.0%) | $87,187 |
| 4-Person Families | 93,395 (17.4%) | $97,765 |
| 5-Person Families | 50,113 (9.3%) | $101,547 |
| 6-Person Families | 20,941 (3.9%) | $119,097 |
| 7+ Person Families | 13,006 (2.4%) | $124,014 |
| Total | 537,774 (100.0%) | $87,218 |
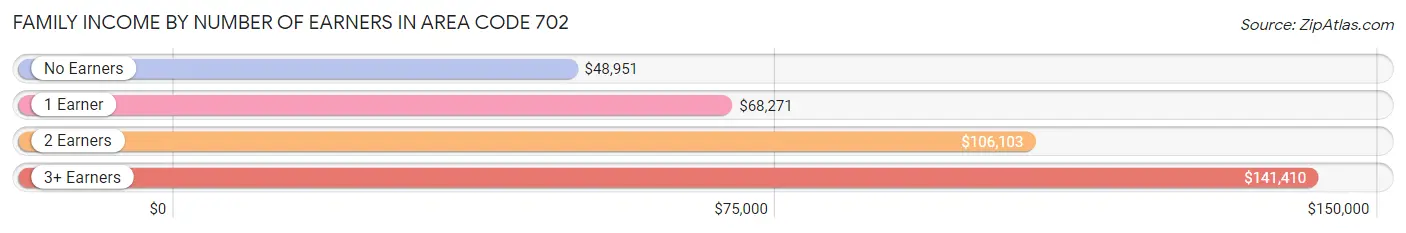
Family Income by Number of Earners in Area Code 702
The median family income in Area Code 702 is $87,218, with families comprising 3+ earners (68,135) having the highest median family income of $141,410, while families with no earners (80,917) have the lowest median family income of $48,951, accounting for 12.7% and 15.0% of families, respectively.
| Number of Earners | # Families | Median Income |
| No Earners | 80,917 (15.0%) | $48,951 |
| 1 Earner | 184,330 (34.3%) | $68,271 |
| 2 Earners | 204,392 (38.0%) | $106,103 |
| 3+ Earners | 68,135 (12.7%) | $141,410 |
| Total | 537,774 (100.0%) | $87,218 |
Household Income in Area Code 702
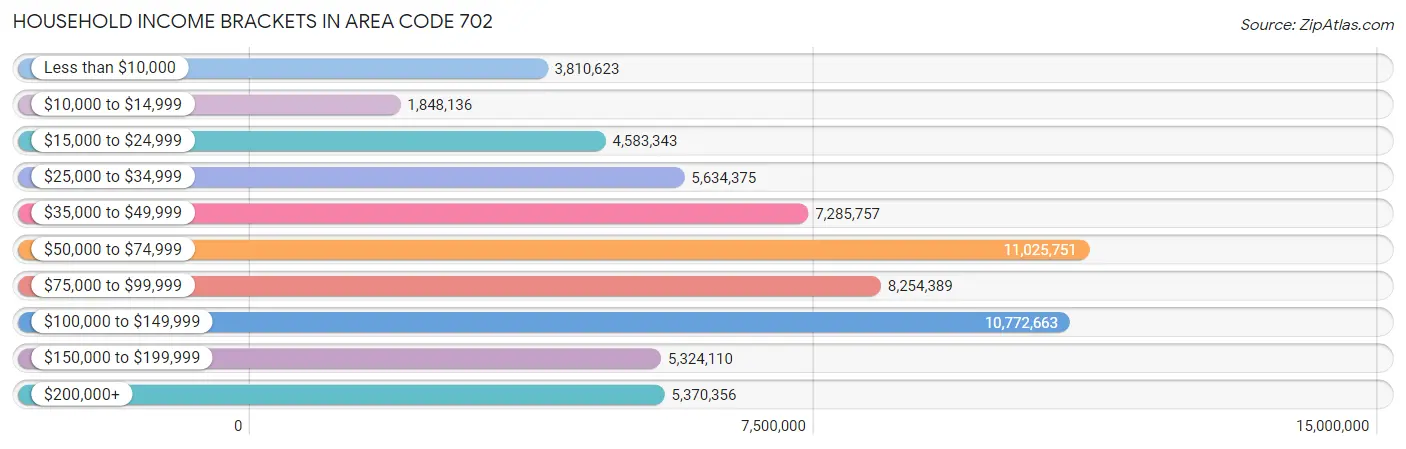
Household Income Brackets in Area Code 702
With 11,025,751 households falling in the category, the $50,000 to $74,999 income range is the most frequent in Area Code 702, accounting for 1,311.3% of all households. In contrast, only 1,848,136 households (219.8%) fall into the $10,000 to $14,999 income bracket, making it the least populous group.
| Income Bracket | # Households | % Households |
| Less than $10,000 | 3,810,623 | 453.2% |
| $10,000 to $14,999 | 1,848,136 | 219.8% |
| $15,000 to $24,999 | 4,583,343 | 545.1% |
| $25,000 to $34,999 | 5,634,375 | 670.1% |
| $35,000 to $49,999 | 7,285,757 | 866.5% |
| $50,000 to $74,999 | 11,025,751 | 1,311.3% |
| $75,000 to $99,999 | 8,254,389 | 981.7% |
| $100,000 to $149,999 | 10,772,663 | 1,281.2% |
| $150,000 to $199,999 | 5,324,110 | 633.2% |
| $200,000+ | 5,370,356 | 638.7% |
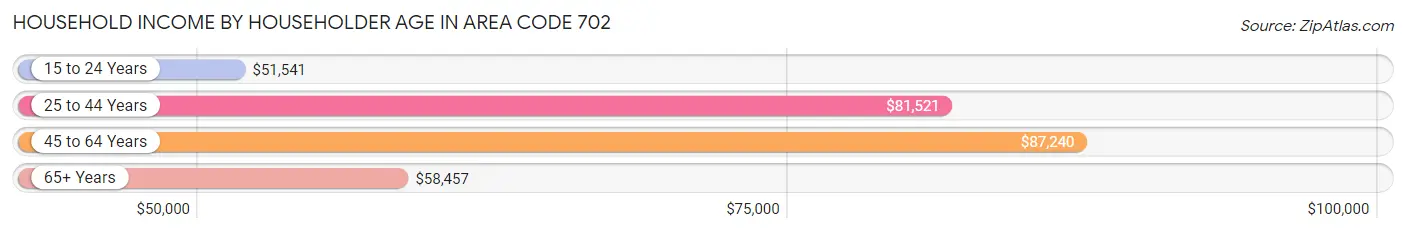
Household Income by Householder Age in Area Code 702
The median household income in Area Code 702 is $75,399, with the highest median household income of $87,240 found in the 45 to 64 years age bracket for the primary householder. A total of 309,839 households (36.8%) fall into this category. Meanwhile, the 15 to 24 years age bracket for the primary householder has the lowest median household income of $51,541, with 26,331 households (3.1%) in this group.
| Income Bracket | # Households | Median Income |
| 15 to 24 Years | 26,331 (3.1%) | $51,541 |
| 25 to 44 Years | 299,228 (35.6%) | $81,521 |
| 45 to 64 Years | 309,839 (36.8%) | $87,240 |
| 65+ Years | 205,428 (24.4%) | $58,457 |
| Total | 840,826 (100.0%) | $75,399 |
Poverty in Area Code 702
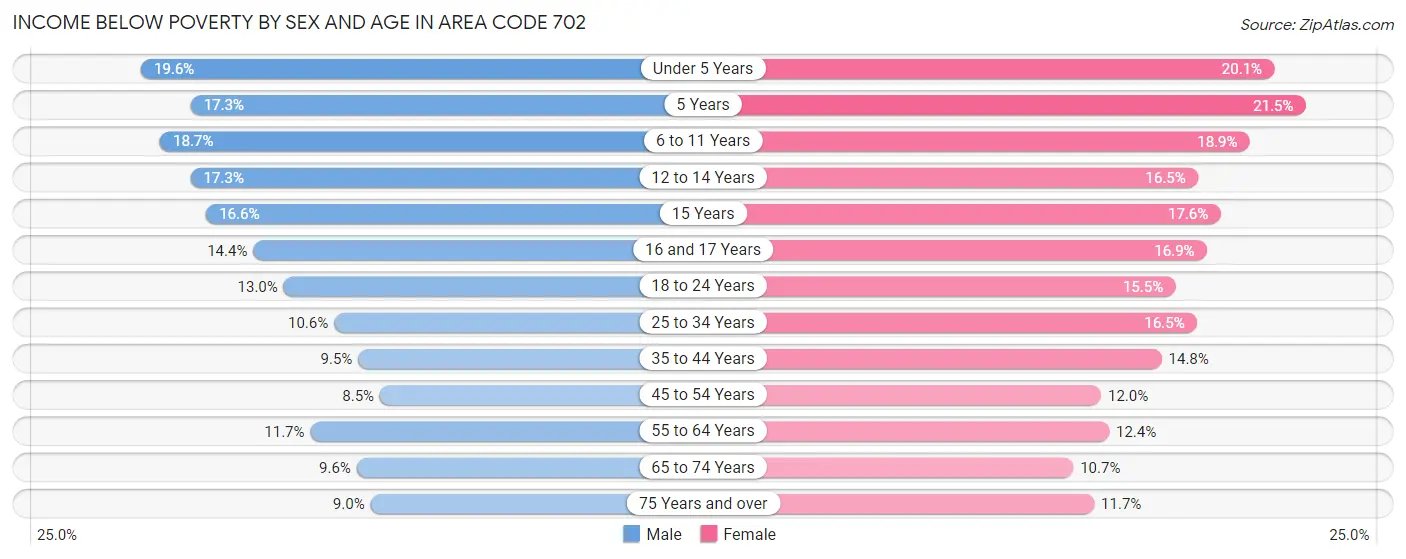
Income Below Poverty by Sex and Age in Area Code 702
With 12.0% poverty level for males and 14.7% for females among the residents of Area Code 702, under 5 year old males and 5 year old females are the most vulnerable to poverty, with 13,125 males (19.6%) and 2,932 females (21.5%) in their respective age groups living below the poverty level.
| Age Bracket | Male | Female |
| Under 5 Years | 13,125 (19.6%) | 12,918 (20.1%) |
| 5 Years | 2,450 (17.3%) | 2,932 (21.5%) |
| 6 to 11 Years | 16,437 (18.7%) | 15,781 (18.9%) |
| 12 to 14 Years | 8,072 (17.3%) | 7,318 (16.5%) |
| 15 Years | 2,367 (16.6%) | 2,705 (17.5%) |
| 16 and 17 Years | 4,435 (14.4%) | 4,750 (16.9%) |
| 18 to 24 Years | 12,447 (13.0%) | 14,242 (15.5%) |
| 25 to 34 Years | 17,736 (10.6%) | 27,034 (16.5%) |
| 35 to 44 Years | 15,187 (9.5%) | 23,108 (14.8%) |
| 45 to 54 Years | 12,851 (8.5%) | 17,600 (12.0%) |
| 55 to 64 Years | 15,920 (11.7%) | 16,875 (12.4%) |
| 65 to 74 Years | 9,727 (9.6%) | 12,017 (10.7%) |
| 75 Years and over | 5,475 (8.9%) | 8,619 (11.7%) |
| Total | 136,229 (12.0%) | 165,899 (14.7%) |
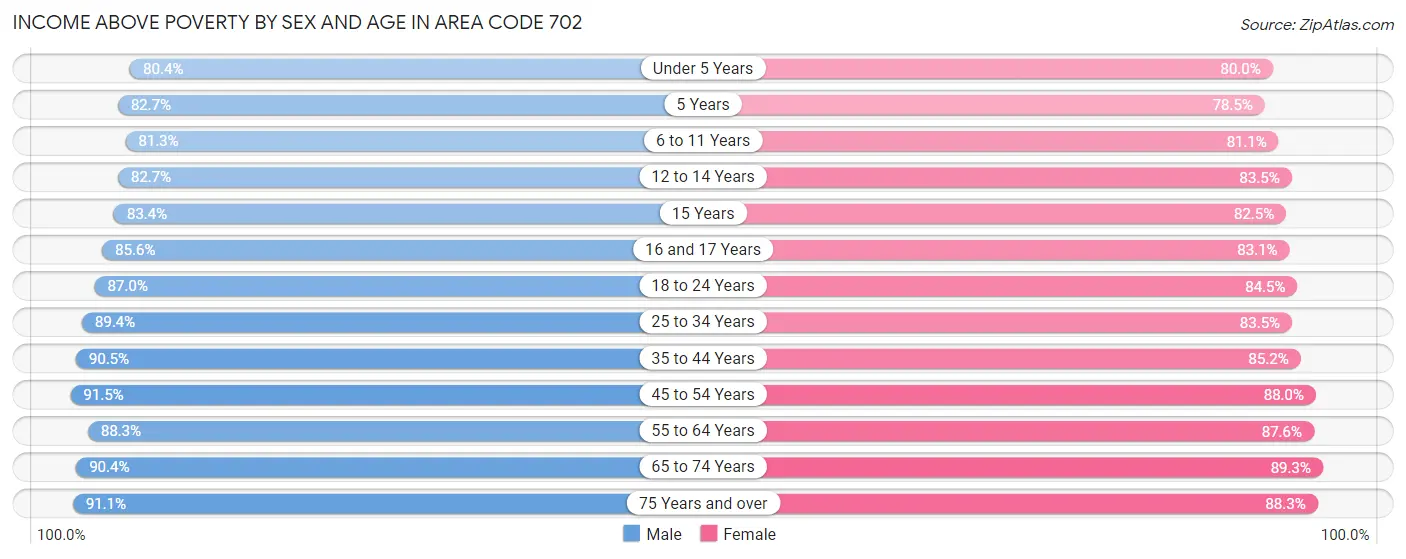
Income Above Poverty by Sex and Age in Area Code 702
According to the poverty statistics in Area Code 702, males aged 45 to 54 years and females aged 65 to 74 years are the age groups that are most secure financially, with 91.5% of males and 89.3% of females in these age groups living above the poverty line.
| Age Bracket | Male | Female |
| Under 5 Years | 53,824 (80.4%) | 51,502 (79.9%) |
| 5 Years | 11,721 (82.7%) | 10,702 (78.5%) |
| 6 to 11 Years | 71,435 (81.3%) | 67,672 (81.1%) |
| 12 to 14 Years | 38,581 (82.7%) | 37,001 (83.5%) |
| 15 Years | 11,916 (83.4%) | 12,711 (82.5%) |
| 16 and 17 Years | 26,376 (85.6%) | 23,318 (83.1%) |
| 18 to 24 Years | 83,472 (87.0%) | 77,900 (84.5%) |
| 25 to 34 Years | 148,960 (89.4%) | 137,243 (83.5%) |
| 35 to 44 Years | 144,269 (90.5%) | 132,576 (85.2%) |
| 45 to 54 Years | 138,094 (91.5%) | 128,729 (88.0%) |
| 55 to 64 Years | 119,713 (88.3%) | 119,211 (87.6%) |
| 65 to 74 Years | 91,651 (90.4%) | 99,880 (89.3%) |
| 75 Years and over | 55,708 (91.0%) | 64,997 (88.3%) |
| Total | 995,720 (88.0%) | 963,442 (85.3%) |
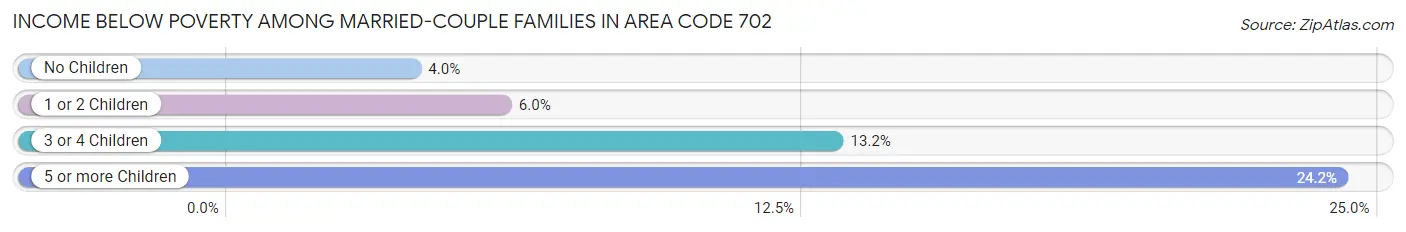
Income Below Poverty Among Married-Couple Families in Area Code 702
The poverty statistics for married-couple families in Area Code 702 show that 5.6% or 20,368 of the total 362,906 families live below the poverty line. Families with 5 or more children have the highest poverty rate of 24.2%, comprising of 668 families. On the other hand, families with no children have the lowest poverty rate of 4.0%, which includes 8,428 families.
| Children | Above Poverty | Below Poverty |
| No Children | 202,853 (96.0%) | 8,428 (4.0%) |
| 1 or 2 Children | 108,761 (94.0%) | 6,894 (6.0%) |
| 3 or 4 Children | 28,828 (86.8%) | 4,378 (13.2%) |
| 5 or more Children | 2,096 (75.8%) | 668 (24.2%) |
| Total | 342,538 (94.4%) | 20,368 (5.6%) |
Income Below Poverty Among Single-Parent Households in Area Code 702
According to the poverty data in Area Code 702, 11.3% or 6,480 single-father households and 22.4% or 26,309 single-mother households are living below the poverty line. Among single-father households, those with 5 or more children have the highest poverty rate, with 215 households (40.9%) experiencing poverty. Likewise, among single-mother households, those with 5 or more children have the highest poverty rate, with 1,068 households (60.1%) falling below the poverty line.
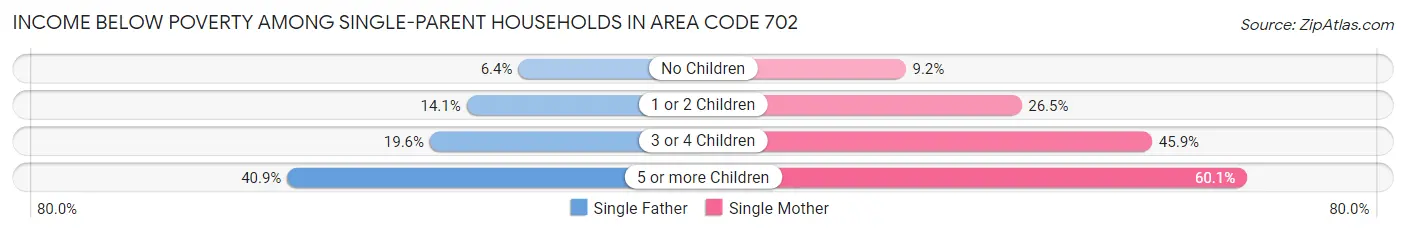
| Children | Single Father | Single Mother |
| No Children | 1,736 (6.4%) | 4,136 (9.2%) |
| 1 or 2 Children | 3,518 (14.1%) | 15,436 (26.5%) |
| 3 or 4 Children | 1,011 (19.6%) | 5,669 (45.9%) |
| 5 or more Children | 215 (40.9%) | 1,068 (60.1%) |
| Total | 6,480 (11.3%) | 26,309 (22.4%) |
Income Below Poverty Among Married-Couple vs Single-Parent Households in Area Code 702
The poverty data for Area Code 702 shows that 20,368 of the married-couple family households (5.6%) and 32,789 of the single-parent households (18.8%) are living below the poverty level. Within the married-couple family households, those with 5 or more children have the highest poverty rate, with 668 households (24.2%) falling below the poverty line. Among the single-parent households, those with 5 or more children have the highest poverty rate, with 1,283 household (55.7%) living below poverty.
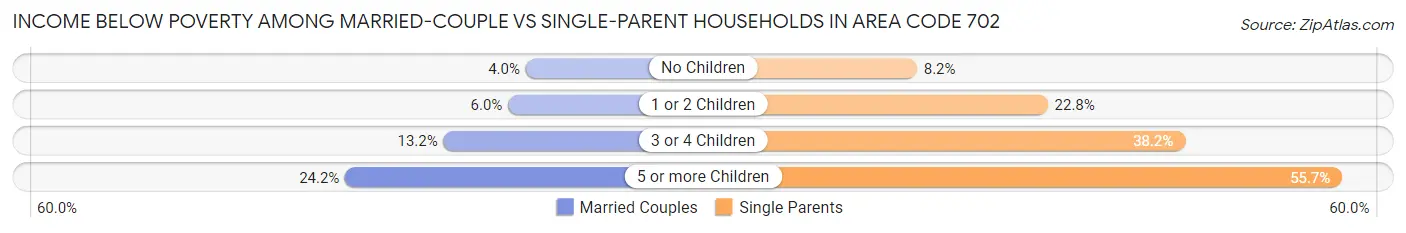
| Children | Married-Couple Families | Single-Parent Households |
| No Children | 8,428 (4.0%) | 5,872 (8.2%) |
| 1 or 2 Children | 6,894 (6.0%) | 18,954 (22.8%) |
| 3 or 4 Children | 4,378 (13.2%) | 6,680 (38.2%) |
| 5 or more Children | 668 (24.2%) | 1,283 (55.7%) |
| Total | 20,368 (5.6%) | 32,789 (18.8%) |
Race in Area Code 702
The most populous races in Area Code 702 are White / Caucasian (1,145,364 | 50.1%), Hispanic or Latino (729,321 | 31.9%), and Two or more Races (307,961 | 13.5%).
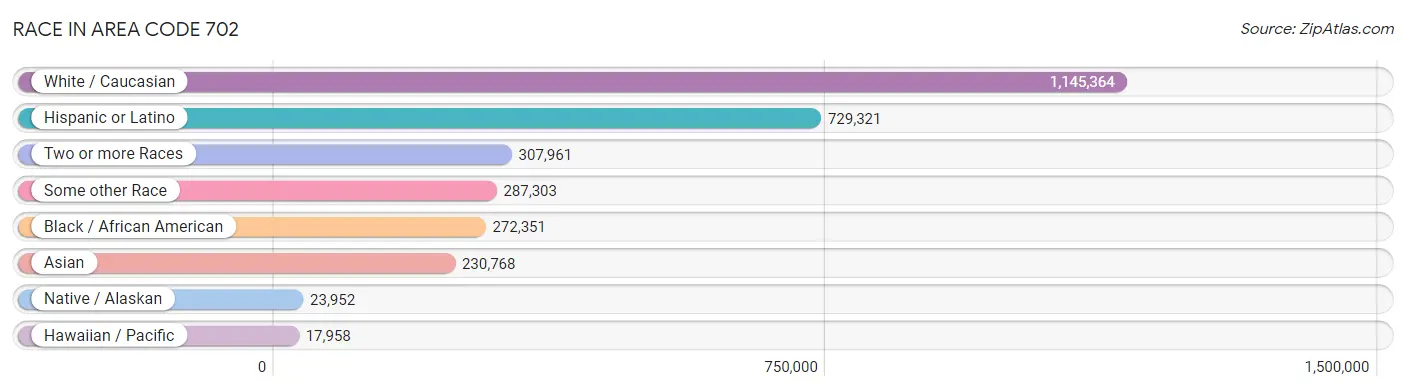
| Race | # Population | % Population |
| Asian | 230,768 | 10.1% |
| Black / African American | 272,351 | 11.9% |
| Hawaiian / Pacific | 17,958 | 0.8% |
| Hispanic or Latino | 729,321 | 31.9% |
| Native / Alaskan | 23,952 | 1.1% |
| White / Caucasian | 1,145,364 | 50.1% |
| Two or more Races | 307,961 | 13.5% |
| Some other Race | 287,303 | 12.6% |
| Total | 2,285,657 | 100.0% |
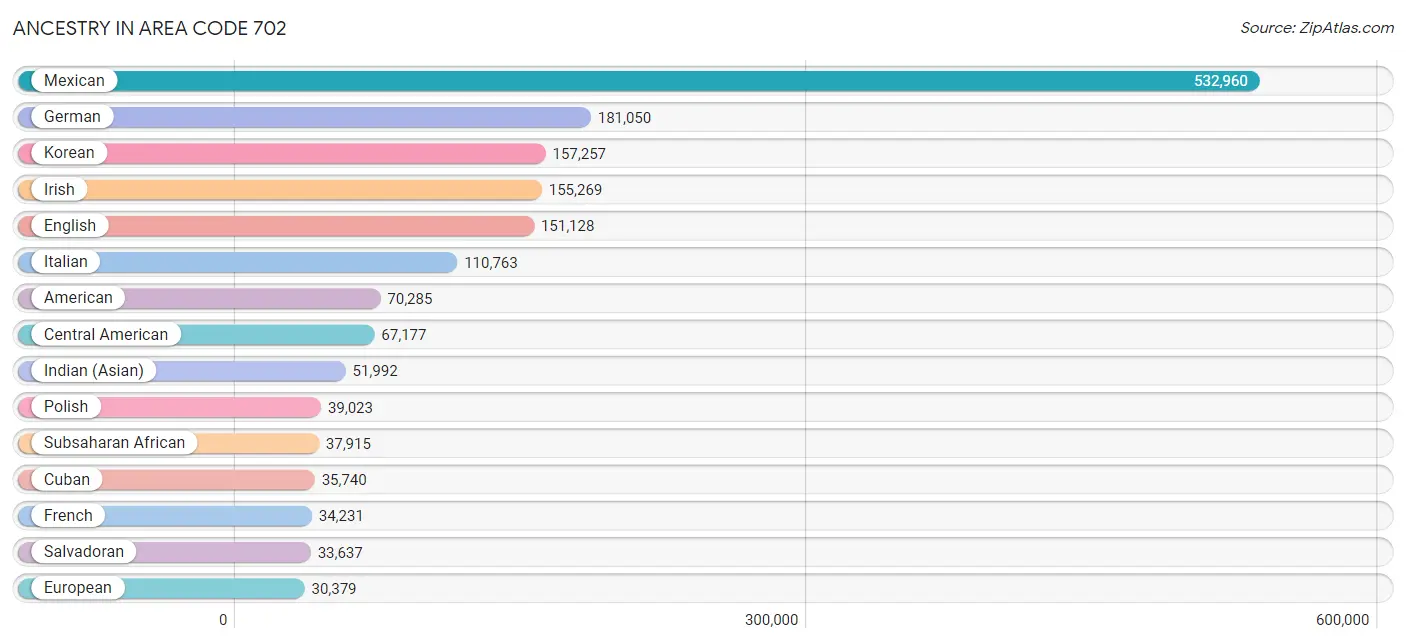
Ancestry in Area Code 702
The most populous ancestries reported in Area Code 702 are Mexican (532,960 | 23.3%), German (181,050 | 7.9%), Korean (157,257 | 6.9%), Irish (155,269 | 6.8%), and English (151,128 | 6.6%), together accounting for 51.5% of all Area Code 702 residents.
| Ancestry | # Population | % Population |
| Afghan | 401 | 0.0% |
| African | 20,792 | 0.9% |
| Alaska Native | 276 | 0.0% |
| Alaskan Athabascan | 7 | 0.0% |
| Albanian | 300 | 0.0% |
| Aleut | 25 | 0.0% |
| Alsatian | 5 | 0.0% |
| American | 70,285 | 3.1% |
| Apache | 2,275 | 0.1% |
| Arab | 12,463 | 0.5% |
| Arapaho | 28 | 0.0% |
| Argentinean | 3,612 | 0.2% |
| Armenian | 6,422 | 0.3% |
| Assyrian / Chaldean / Syriac | 351 | 0.0% |
| Australian | 972 | 0.0% |
| Austrian | 3,517 | 0.2% |
| Bahamian | 215 | 0.0% |
| Bangladeshi | 737 | 0.0% |
| Barbadian | 54 | 0.0% |
| Basque | 788 | 0.0% |
| Belgian | 1,496 | 0.1% |
| Belizean | 1,354 | 0.1% |
| Bermudan | 15 | 0.0% |
| Bhutanese | 26,271 | 1.1% |
| Blackfeet | 1,384 | 0.1% |
| Bolivian | 1,200 | 0.1% |
| Brazilian | 2,372 | 0.1% |
| British | 9,668 | 0.4% |
| British West Indian | 316 | 0.0% |
| Bulgarian | 1,662 | 0.1% |
| Burmese | 18,629 | 0.8% |
| Cajun | 217 | 0.0% |
| Cambodian | 276 | 0.0% |
| Canadian | 4,391 | 0.2% |
| Cape Verdean | 230 | 0.0% |
| Carpatho Rusyn | 22 | 0.0% |
| Celtic | 582 | 0.0% |
| Central American | 67,177 | 2.9% |
| Central American Indian | 3,460 | 0.2% |
| Cherokee | 7,436 | 0.3% |
| Cheyenne | 65 | 0.0% |
| Chickasaw | 347 | 0.0% |
| Chilean | 1,590 | 0.1% |
| Chinese | 147 | 0.0% |
| Chippewa | 425 | 0.0% |
| Choctaw | 1,786 | 0.1% |
| Colombian | 7,037 | 0.3% |
| Colville | 129 | 0.0% |
| Comanche | 451 | 0.0% |
| Costa Rican | 1,711 | 0.1% |
| Cree | 47 | 0.0% |
| Creek | 475 | 0.0% |
| Croatian | 2,369 | 0.1% |
| Crow | 23 | 0.0% |
| Cuban | 35,740 | 1.6% |
| Cypriot | 40 | 0.0% |
| Czech | 4,956 | 0.2% |
| Czechoslovakian | 1,357 | 0.1% |
| Danish | 9,970 | 0.4% |
| Delaware | 49 | 0.0% |
| Dominican | 4,326 | 0.2% |
| Dutch | 14,618 | 0.6% |
| Dutch West Indian | 57 | 0.0% |
| Eastern European | 4,509 | 0.2% |
| Ecuadorian | 2,807 | 0.1% |
| Egyptian | 1,476 | 0.1% |
| English | 151,128 | 6.6% |
| Estonian | 118 | 0.0% |
| Ethiopian | 12,182 | 0.5% |
| European | 30,379 | 1.3% |
| Fijian | 109 | 0.0% |
| Filipino | 2,299 | 0.1% |
| Finnish | 2,712 | 0.1% |
| French | 34,231 | 1.5% |
| French American Indian | 223 | 0.0% |
| French Canadian | 7,311 | 0.3% |
| German | 181,050 | 7.9% |
| German Russian | 250 | 0.0% |
| Ghanaian | 327 | 0.0% |
| Greek | 8,061 | 0.4% |
| Guamanian / Chamorro | 4,941 | 0.2% |
| Guatemalan | 16,691 | 0.7% |
| Guyanese | 112 | 0.0% |
| Haitian | 1,715 | 0.1% |
| Honduran | 5,561 | 0.2% |
| Hopi | 452 | 0.0% |
| Houma | 6 | 0.0% |
| Hungarian | 8,302 | 0.4% |
| Icelander | 422 | 0.0% |
| Indian (Asian) | 51,992 | 2.3% |
| Indonesian | 130 | 0.0% |
| Inupiat | 109 | 0.0% |
| Iranian | 5,305 | 0.2% |
| Iraqi | 1,059 | 0.1% |
| Irish | 155,269 | 6.8% |
| Iroquois | 454 | 0.0% |
| Israeli | 2,596 | 0.1% |
| Italian | 110,763 | 4.9% |
| Jamaican | 3,412 | 0.2% |
| Japanese | 2,103 | 0.1% |
| Jordanian | 305 | 0.0% |
| Kenyan | 323 | 0.0% |
| Kiowa | 138 | 0.0% |
| Korean | 157,257 | 6.9% |
| Laotian | 1,776 | 0.1% |
| Latvian | 516 | 0.0% |
| Lebanese | 3,461 | 0.2% |
| Liberian | 276 | 0.0% |
| Lithuanian | 2,847 | 0.1% |
| Luxembourger | 173 | 0.0% |
| Macedonian | 205 | 0.0% |
| Malaysian | 3,580 | 0.2% |
| Maltese | 343 | 0.0% |
| Menominee | 121 | 0.0% |
| Mexican | 532,960 | 23.3% |
| Mexican American Indian | 11,430 | 0.5% |
| Mongolian | 259 | 0.0% |
| Moroccan | 1,574 | 0.1% |
| Native Hawaiian | 20,676 | 0.9% |
| Navajo | 2,342 | 0.1% |
| Nepalese | 217 | 0.0% |
| New Zealander | 325 | 0.0% |
| Nicaraguan | 5,766 | 0.3% |
| Nigerian | 2,023 | 0.1% |
| Northern European | 1,919 | 0.1% |
| Norwegian | 20,884 | 0.9% |
| Okinawan | 74 | 0.0% |
| Osage | 223 | 0.0% |
| Ottawa | 9 | 0.0% |
| Paiute | 1,370 | 0.1% |
| Pakistani | 8,681 | 0.4% |
| Palestinian | 800 | 0.0% |
| Panamanian | 2,722 | 0.1% |
| Paraguayan | 105 | 0.0% |
| Pennsylvania German | 492 | 0.0% |
| Peruvian | 6,586 | 0.3% |
| Pima | 62 | 0.0% |
| Polish | 39,023 | 1.7% |
| Portuguese | 10,071 | 0.4% |
| Potawatomi | 165 | 0.0% |
| Pueblo | 489 | 0.0% |
| Puerto Rican | 25,094 | 1.1% |
| Puget Sound Salish | 33 | 0.0% |
| Romanian | 4,528 | 0.2% |
| Russian | 17,221 | 0.7% |
| Salvadoran | 33,637 | 1.5% |
| Samoan | 7,347 | 0.3% |
| Scandinavian | 6,464 | 0.3% |
| Scotch-Irish | 8,989 | 0.4% |
| Scottish | 27,641 | 1.2% |
| Seminole | 194 | 0.0% |
| Senegalese | 63 | 0.0% |
| Serbian | 3,379 | 0.2% |
| Shoshone | 416 | 0.0% |
| Sierra Leonean | 160 | 0.0% |
| Sioux | 1,100 | 0.1% |
| Slavic | 718 | 0.0% |
| Slovak | 2,139 | 0.1% |
| Slovene | 649 | 0.0% |
| Somali | 155 | 0.0% |
| South African | 448 | 0.0% |
| South American | 26,628 | 1.2% |
| South American Indian | 472 | 0.0% |
| Soviet Union | 18 | 0.0% |
| Spaniard | 10,249 | 0.4% |
| Spanish | 8,638 | 0.4% |
| Spanish American | 363 | 0.0% |
| Spanish American Indian | 34 | 0.0% |
| Sri Lankan | 16,606 | 0.7% |
| Subsaharan African | 37,915 | 1.7% |
| Sudanese | 183 | 0.0% |
| Swedish | 17,749 | 0.8% |
| Swiss | 6,086 | 0.3% |
| Syrian | 1,264 | 0.1% |
| Thai | 14,917 | 0.6% |
| Tlingit-Haida | 149 | 0.0% |
| Tohono O'Odham | 71 | 0.0% |
| Tongan | 513 | 0.0% |
| Trinidadian and Tobagonian | 685 | 0.0% |
| Turkish | 1,142 | 0.1% |
| U.S. Virgin Islander | 113 | 0.0% |
| Ugandan | 155 | 0.0% |
| Ukrainian | 4,532 | 0.2% |
| Uruguayan | 552 | 0.0% |
| Ute | 181 | 0.0% |
| Venezuelan | 3,000 | 0.1% |
| Vietnamese | 265 | 0.0% |
| Welsh | 9,330 | 0.4% |
| West Indian | 845 | 0.0% |
| Yakama | 5 | 0.0% |
| Yaqui | 279 | 0.0% |
| Yugoslavian | 1,760 | 0.1% |
| Yuman | 115 | 0.0% |
| Yup'ik | 72 | 0.0% |
| Zimbabwean | 93 | 0.0% | View All 195 Rows |
Immigrants in Area Code 702
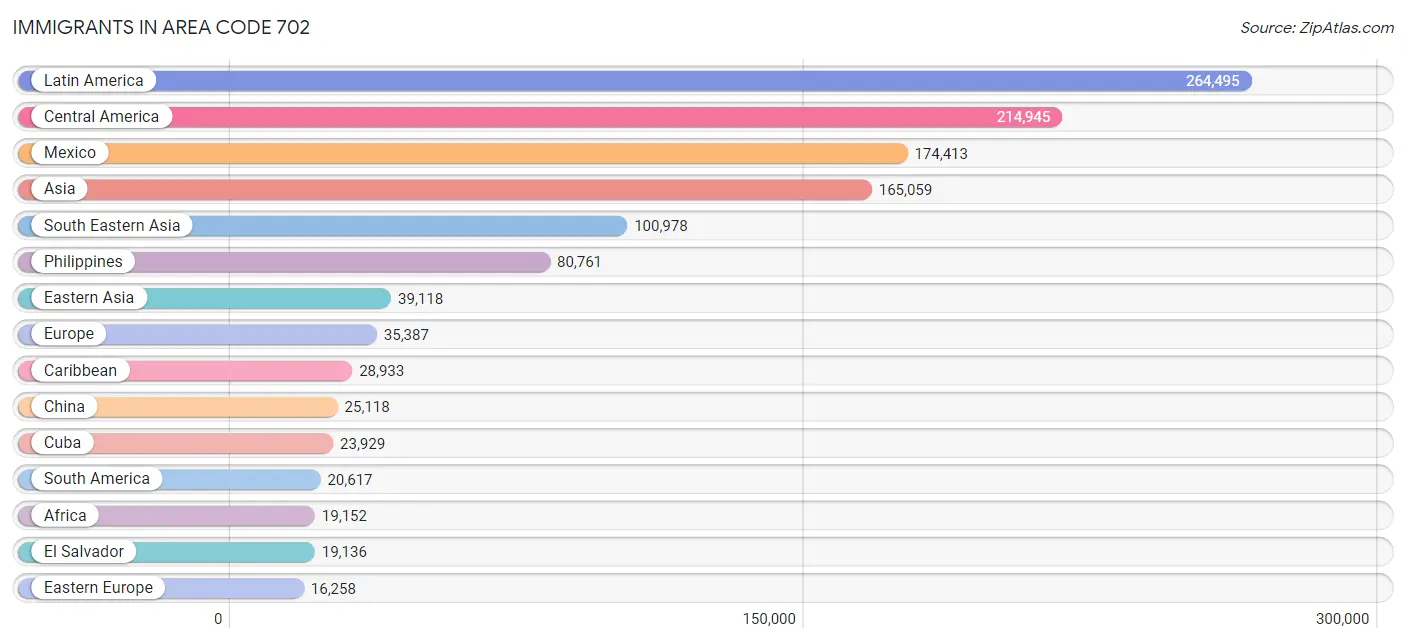
The most numerous immigrant groups reported in Area Code 702 came from Latin America (264,495 | 11.6%), Central America (214,945 | 9.4%), Mexico (174,413 | 7.6%), Asia (165,059 | 7.2%), and South Eastern Asia (100,978 | 4.4%), together accounting for 40.2% of all Area Code 702 residents.
| Immigration Origin | # Population | % Population |
| Afghanistan | 487 | 0.0% |
| Africa | 19,152 | 0.8% |
| Albania | 304 | 0.0% |
| Argentina | 2,618 | 0.1% |
| Armenia | 2,154 | 0.1% |
| Asia | 165,059 | 7.2% |
| Australia | 1,125 | 0.1% |
| Austria | 373 | 0.0% |
| Azores | 43 | 0.0% |
| Bahamas | 143 | 0.0% |
| Bangladesh | 159 | 0.0% |
| Barbados | 30 | 0.0% |
| Belarus | 159 | 0.0% |
| Belgium | 297 | 0.0% |
| Belize | 817 | 0.0% |
| Bolivia | 630 | 0.0% |
| Bosnia and Herzegovina | 1,455 | 0.1% |
| Brazil | 3,124 | 0.1% |
| Bulgaria | 1,470 | 0.1% |
| Cambodia | 871 | 0.0% |
| Cameroon | 144 | 0.0% |
| Canada | 8,535 | 0.4% |
| Caribbean | 28,933 | 1.3% |
| Central America | 214,945 | 9.4% |
| Chile | 968 | 0.0% |
| China | 25,118 | 1.1% |
| Colombia | 4,047 | 0.2% |
| Congo | 16 | 0.0% |
| Costa Rica | 976 | 0.0% |
| Croatia | 505 | 0.0% |
| Cuba | 23,929 | 1.1% |
| Czechoslovakia | 587 | 0.0% |
| Denmark | 436 | 0.0% |
| Dominica | 34 | 0.0% |
| Dominican Republic | 1,300 | 0.1% |
| Eastern Africa | 12,937 | 0.6% |
| Eastern Asia | 39,118 | 1.7% |
| Eastern Europe | 16,258 | 0.7% |
| Ecuador | 1,213 | 0.1% |
| Egypt | 1,060 | 0.1% |
| El Salvador | 19,136 | 0.8% |
| England | 3,039 | 0.1% |
| Eritrea | 937 | 0.0% |
| Ethiopia | 10,287 | 0.4% |
| Europe | 35,387 | 1.5% |
| Fiji | 451 | 0.0% |
| France | 1,613 | 0.1% |
| Germany | 4,683 | 0.2% |
| Ghana | 211 | 0.0% |
| Greece | 602 | 0.0% |
| Grenada | 18 | 0.0% |
| Guatemala | 10,891 | 0.5% |
| Guyana | 180 | 0.0% |
| Haiti | 680 | 0.0% |
| Honduras | 4,156 | 0.2% |
| Hong Kong | 2,454 | 0.1% |
| Hungary | 1,314 | 0.1% |
| India | 6,876 | 0.3% |
| Indonesia | 1,055 | 0.1% |
| Iran | 4,358 | 0.2% |
| Iraq | 1,352 | 0.1% |
| Ireland | 420 | 0.0% |
| Israel | 2,239 | 0.1% |
| Italy | 1,702 | 0.1% |
| Jamaica | 1,643 | 0.1% |
| Japan | 4,099 | 0.2% |
| Jordan | 409 | 0.0% |
| Kazakhstan | 198 | 0.0% |
| Kenya | 697 | 0.0% |
| Korea | 9,800 | 0.4% |
| Kuwait | 12 | 0.0% |
| Laos | 1,451 | 0.1% |
| Latin America | 264,495 | 11.6% |
| Latvia | 286 | 0.0% |
| Lebanon | 1,245 | 0.1% |
| Liberia | 198 | 0.0% |
| Lithuania | 276 | 0.0% |
| Malaysia | 646 | 0.0% |
| Mexico | 174,413 | 7.6% |
| Micronesia | 183 | 0.0% |
| Middle Africa | 353 | 0.0% |
| Moldova | 210 | 0.0% |
| Morocco | 891 | 0.0% |
| Nepal | 461 | 0.0% |
| Netherlands | 689 | 0.0% |
| Nicaragua | 3,395 | 0.2% |
| Nigeria | 1,294 | 0.1% |
| North Macedonia | 197 | 0.0% |
| Northern Africa | 2,483 | 0.1% |
| Northern Europe | 7,833 | 0.3% |
| Norway | 152 | 0.0% |
| Oceania | 3,270 | 0.1% |
| Pakistan | 1,175 | 0.1% |
| Panama | 1,117 | 0.1% |
| Peru | 5,107 | 0.2% |
| Philippines | 80,761 | 3.5% |
| Poland | 1,807 | 0.1% |
| Portugal | 430 | 0.0% |
| Romania | 2,119 | 0.1% |
| Russia | 2,596 | 0.1% |
| Saudi Arabia | 372 | 0.0% |
| Scotland | 627 | 0.0% |
| Senegal | 150 | 0.0% |
| Serbia | 633 | 0.0% |
| Sierra Leone | 88 | 0.0% |
| Singapore | 446 | 0.0% |
| Somalia | 186 | 0.0% |
| South Africa | 652 | 0.0% |
| South America | 20,617 | 0.9% |
| South Central Asia | 14,969 | 0.6% |
| South Eastern Asia | 100,978 | 4.4% |
| Southern Europe | 3,193 | 0.1% |
| Spain | 419 | 0.0% |
| Sri Lanka | 512 | 0.0% |
| Sudan | 238 | 0.0% |
| Sweden | 396 | 0.0% |
| Switzerland | 287 | 0.0% |
| Syria | 748 | 0.0% |
| Taiwan | 4,673 | 0.2% |
| Thailand | 5,420 | 0.2% |
| Trinidad and Tobago | 681 | 0.0% |
| Turkey | 712 | 0.0% |
| Uganda | 342 | 0.0% |
| Ukraine | 1,565 | 0.1% |
| Uruguay | 256 | 0.0% |
| Uzbekistan | 233 | 0.0% |
| Venezuela | 2,165 | 0.1% |
| Vietnam | 10,114 | 0.4% |
| West Indies | 210 | 0.0% |
| Western Africa | 2,310 | 0.1% |
| Western Asia | 9,743 | 0.4% |
| Western Europe | 7,972 | 0.4% |
| Yemen | 59 | 0.0% |
| Zaire | 131 | 0.0% |
| Zimbabwe | 287 | 0.0% | View All 135 Rows |
Sex and Age in Area Code 702
Sex and Age in Area Code 702
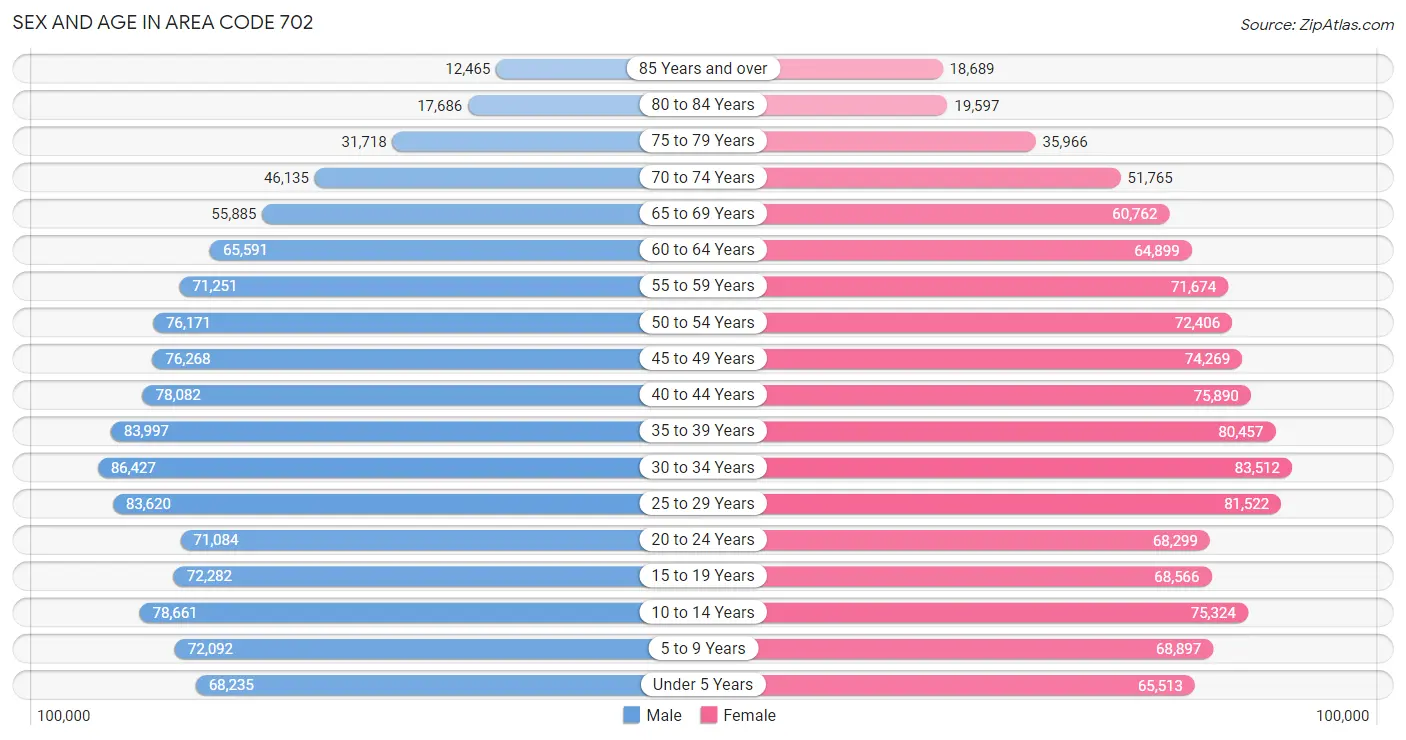
The most populous age groups in Area Code 702 are 30 to 34 Years (86,427 | 7.5%) for men and 30 to 34 Years (83,512 | 7.3%) for women.
| Age Bracket | Male | Female |
| Under 5 Years | 68,235 (5.9%) | 65,513 (5.8%) |
| 5 to 9 Years | 72,092 (6.3%) | 68,897 (6.0%) |
| 10 to 14 Years | 78,661 (6.9%) | 75,324 (6.6%) |
| 15 to 19 Years | 72,282 (6.3%) | 68,566 (6.0%) |
| 20 to 24 Years | 71,084 (6.2%) | 68,299 (6.0%) |
| 25 to 29 Years | 83,620 (7.3%) | 81,522 (7.2%) |
| 30 to 34 Years | 86,427 (7.5%) | 83,512 (7.3%) |
| 35 to 39 Years | 83,997 (7.3%) | 80,457 (7.1%) |
| 40 to 44 Years | 78,082 (6.8%) | 75,890 (6.7%) |
| 45 to 49 Years | 76,268 (6.7%) | 74,269 (6.5%) |
| 50 to 54 Years | 76,171 (6.6%) | 72,406 (6.4%) |
| 55 to 59 Years | 71,251 (6.2%) | 71,674 (6.3%) |
| 60 to 64 Years | 65,591 (5.7%) | 64,899 (5.7%) |
| 65 to 69 Years | 55,885 (4.9%) | 60,762 (5.3%) |
| 70 to 74 Years | 46,135 (4.0%) | 51,765 (4.5%) |
| 75 to 79 Years | 31,718 (2.8%) | 35,966 (3.2%) |
| 80 to 84 Years | 17,686 (1.5%) | 19,597 (1.7%) |
| 85 Years and over | 12,465 (1.1%) | 18,689 (1.6%) |
| Total | 1,147,650 (100.0%) | 1,138,007 (100.0%) |
Families and Households in Area Code 702
Median Family Size in Area Code 702
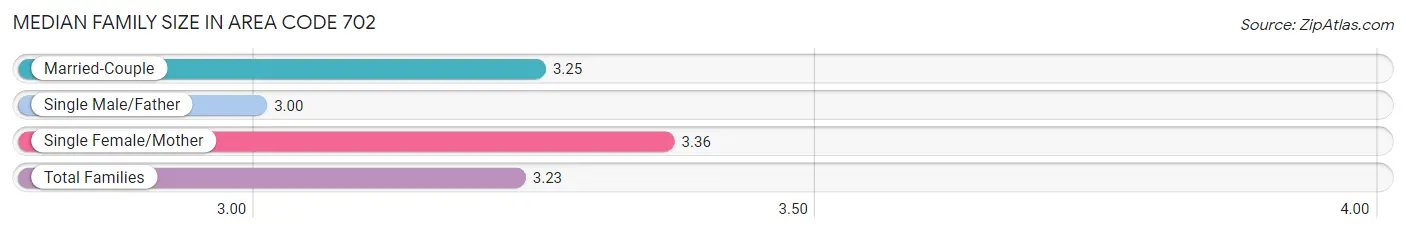
The median family size in Area Code 702 is 3.23 persons per family, with single female/mother families (117,295 | 21.8%) accounting for the largest median family size of 3.36486 persons per family. On the other hand, single male/father families (57,573 | 10.7%) represent the smallest median family size with 3.00 persons per family.
| Family Type | # Families | Family Size |
| Married-Couple | 362,906 (67.5%) | 3.25 |
| Single Male/Father | 57,573 (10.7%) | 3.00 |
| Single Female/Mother | 117,295 (21.8%) | 3.36 |
| Total Families | 537,774 (100.0%) | 3.23 |
Median Household Size in Area Code 702
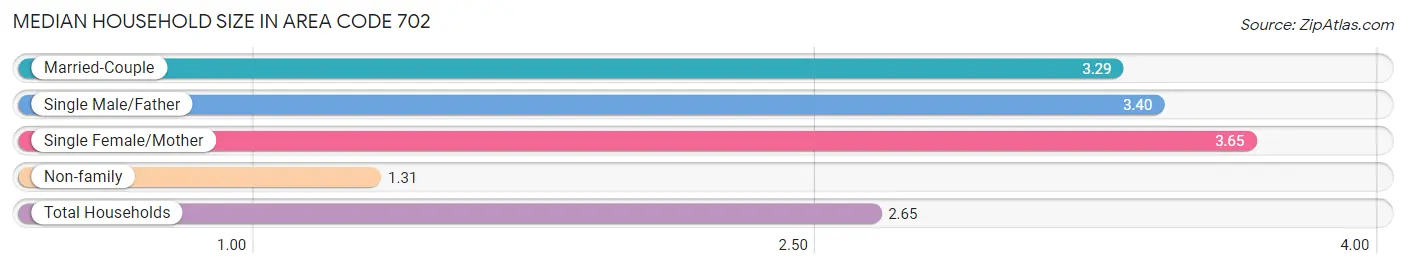
The median household size in Area Code 702 is 2.65 persons per household, with single female/mother households (117,295 | 14.0%) accounting for the largest median household size of 3.65055 persons per household. non-family households (303,052 | 36.0%) represent the smallest median household size with 1.31 persons per household.
| Household Type | # Households | Household Size |
| Married-Couple | 362,906 (43.2%) | 3.29 |
| Single Male/Father | 57,573 (6.9%) | 3.40 |
| Single Female/Mother | 117,295 (14.0%) | 3.65 |
| Non-family | 303,052 (36.0%) | 1.31 |
| Total Households | 840,826 (100.0%) | 2.65 |
Household Size by Marriage Status in Area Code 702
Out of a total of 840,826 households in Area Code 702, 537,774 (64.0%) are family households, while 303,052 (36.0%) are nonfamily households. The most numerous type of family households are 2-person households, comprising 218,473, and the most common type of nonfamily households are 1-person households, comprising 235,593.
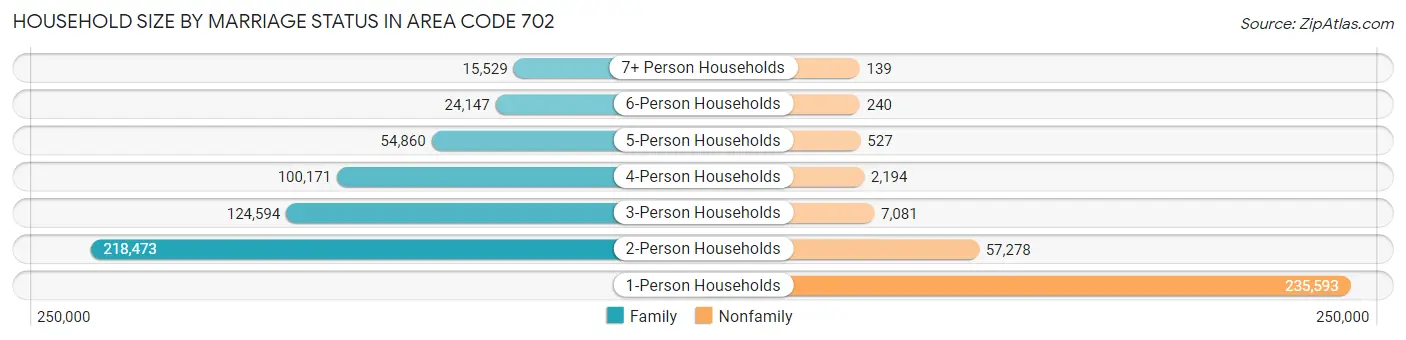
| Household Size | Family Households | Nonfamily Households |
| 1-Person Households | - | 235,593 (28.0%) |
| 2-Person Households | 218,473 (26.0%) | 57,278 (6.8%) |
| 3-Person Households | 124,594 (14.8%) | 7,081 (0.8%) |
| 4-Person Households | 100,171 (11.9%) | 2,194 (0.3%) |
| 5-Person Households | 54,860 (6.5%) | 527 (0.1%) |
| 6-Person Households | 24,147 (2.9%) | 240 (0.0%) |
| 7+ Person Households | 15,529 (1.8%) | 139 (0.0%) |
| Total | 537,774 (64.0%) | 303,052 (36.0%) |
Female Fertility in Area Code 702
Fertility by Age in Area Code 702
Average fertility rate in Area Code 702 is 49.6 births per 1,000 women. Women in the age bracket of 20 to 34 years have the highest fertility rate with 80.1 births per 1,000 women. Women in the age bracket of 20 to 34 years acount for 68.3% of all women with births.
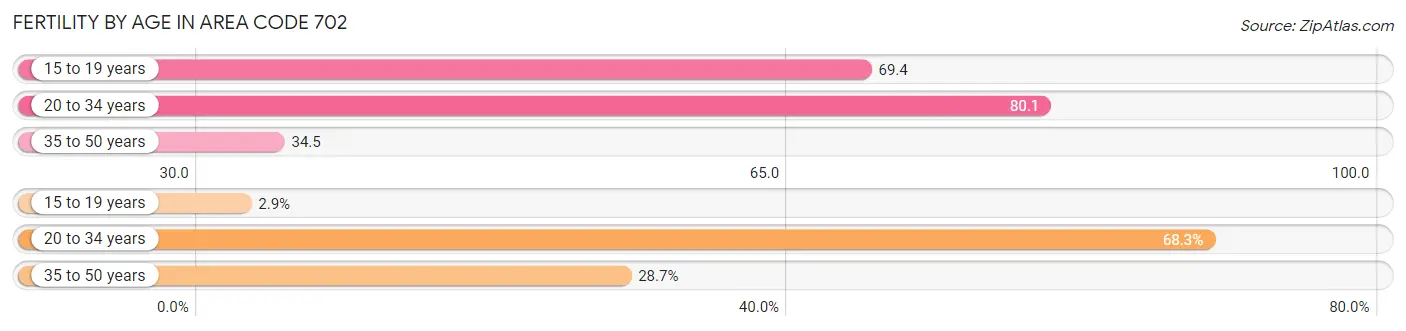
| Age Bracket | Women with Births | Births / 1,000 Women |
| 15 to 19 years | 796 (2.9%) | 69.4 |
| 20 to 34 years | 18,512 (68.3%) | 80.1 |
| 35 to 50 years | 7,780 (28.7%) | 34.5 |
| Total | 27,088 (100.0%) | 49.6 |
Fertility by Age by Marriage Status in Area Code 702
59.0% of women with births (27,088) in Area Code 702 are married. The highest percentage of unmarried women with births falls into 15 to 19 years age bracket with 98.9% of them unmarried at the time of birth, while the lowest percentage of unmarried women with births belong to 35 to 50 years age bracket with 38.9% of them unmarried.
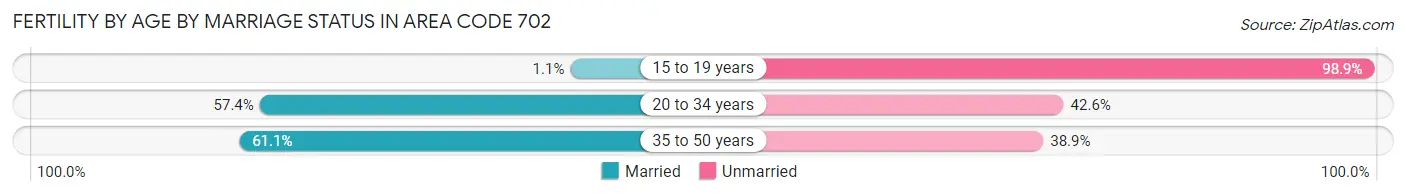
| Age Bracket | Married | Unmarried |
| 15 to 19 years | 9 (1.1%) | 787 (98.9%) |
| 20 to 34 years | 10,630 (57.4%) | 7,882 (42.6%) |
| 35 to 50 years | 4,754 (61.1%) | 3,026 (38.9%) |
| Total | 15,981 (59.0%) | 11,107 (41.0%) |
Fertility by Education in Area Code 702
Average fertility rate in Area Code 702 is 49.6 births per 1,000 women. Women with the education attainment of graduate degree have the highest fertility rate of 76.5 births per 1,000 women, while women with the education attainment of less than high school have the lowest fertility at 54.3 births per 1,000 women. Women with the education attainment of college or associate's degree represent 31.5% of all women with births.
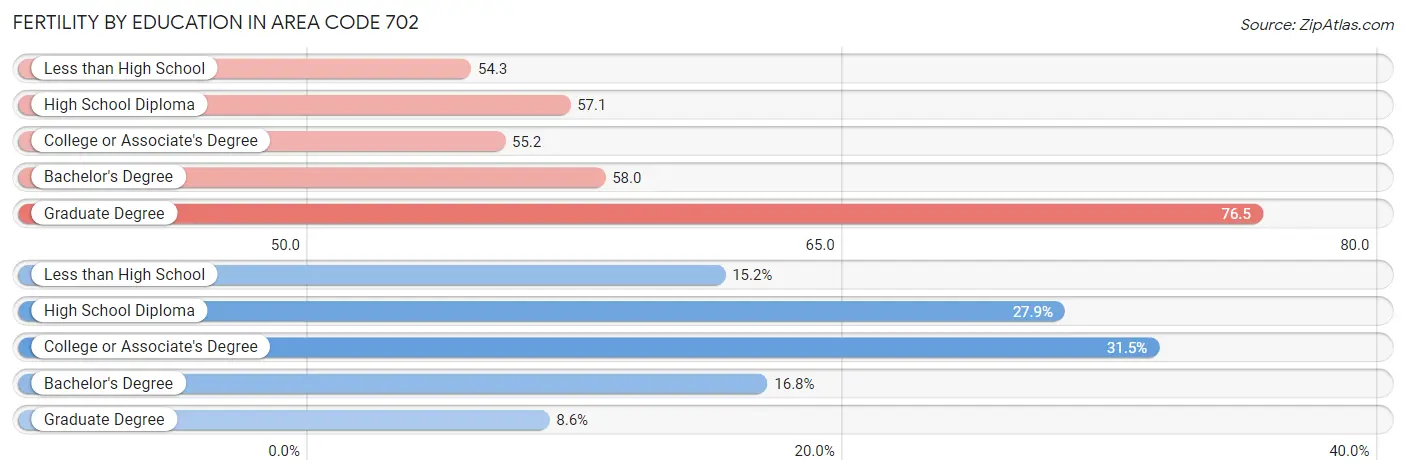
| Educational Attainment | Women with Births | Births / 1,000 Women |
| Less than High School | 4,119 (15.2%) | 54.3 |
| High School Diploma | 7,567 (27.9%) | 57.1 |
| College or Associate's Degree | 8,521 (31.5%) | 55.2 |
| Bachelor's Degree | 4,547 (16.8%) | 58.0 |
| Graduate Degree | 2,334 (8.6%) | 76.5 |
| Total | 27,088 (100.0%) | 49.6 |
Fertility by Education by Marriage Status in Area Code 702
41.0% of women with births in Area Code 702 are unmarried. Women with the educational attainment of bachelor's degree are most likely to be married with 66.2% of them married at childbirth, while women with the educational attainment of high school diploma are least likely to be married with 60.2% of them unmarried at childbirth.
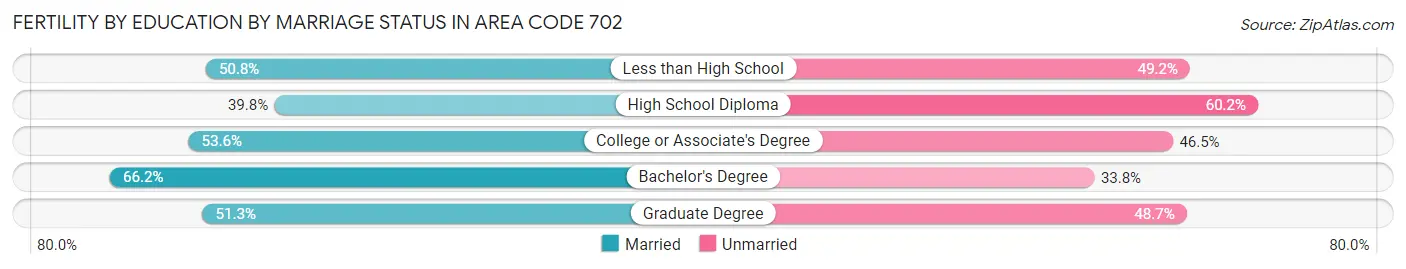
| Educational Attainment | Married | Unmarried |
| Less than High School | 2,091 (50.8%) | 2,028 (49.2%) |
| High School Diploma | 3,012 (39.8%) | 4,555 (60.2%) |
| College or Associate's Degree | 4,563 (53.5%) | 3,958 (46.5%) |
| Bachelor's Degree | 3,010 (66.2%) | 1,537 (33.8%) |
| Graduate Degree | 1,197 (51.3%) | 1,137 (48.7%) |
| Total | 15,981 (59.0%) | 11,107 (41.0%) |
Employment Characteristics in Area Code 702
Employment by Class of Employer in Area Code 702
Among the 1,046,536 employed individuals in Area Code 702, private company employees (785,684 | 75.1%), local government employees (67,080 | 6.4%), and self-employed (not incorporated) (55,997 | 5.3%) make up the most common classes of employment.
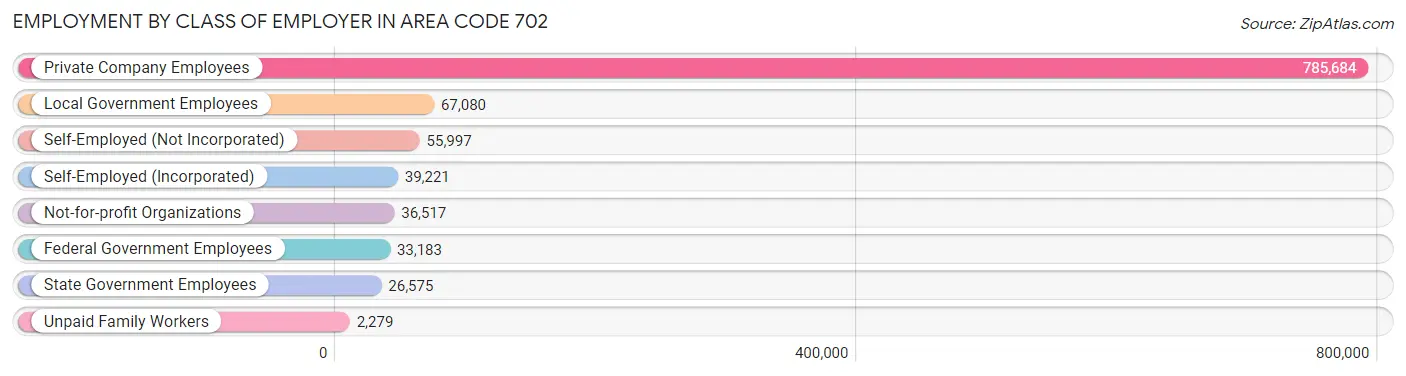
| Employer Class | # Employees | % Employees |
| Private Company Employees | 785,684 | 75.1% |
| Self-Employed (Incorporated) | 39,221 | 3.7% |
| Self-Employed (Not Incorporated) | 55,997 | 5.3% |
| Not-for-profit Organizations | 36,517 | 3.5% |
| Local Government Employees | 67,080 | 6.4% |
| State Government Employees | 26,575 | 2.5% |
| Federal Government Employees | 33,183 | 3.2% |
| Unpaid Family Workers | 2,279 | 0.2% |
| Total | 1,046,536 | 100.0% |
Employment Status by Age in Area Code 702
According to the labor force statistics for Area Code 702, out of the total population over 16 years of age (1,827,170), 59.8% or 1,093,379 individuals are in the labor force, with 8.2% or 89,329 of them unemployed. The age group with the highest labor force participation rate is 30 to 34 years, with 83.8% or 142,358 individuals in the labor force. Within the labor force, the 16 to 19 years age range has the highest percentage of unemployed individuals, with 1,329.1% or 579,341 of them being unemployed.
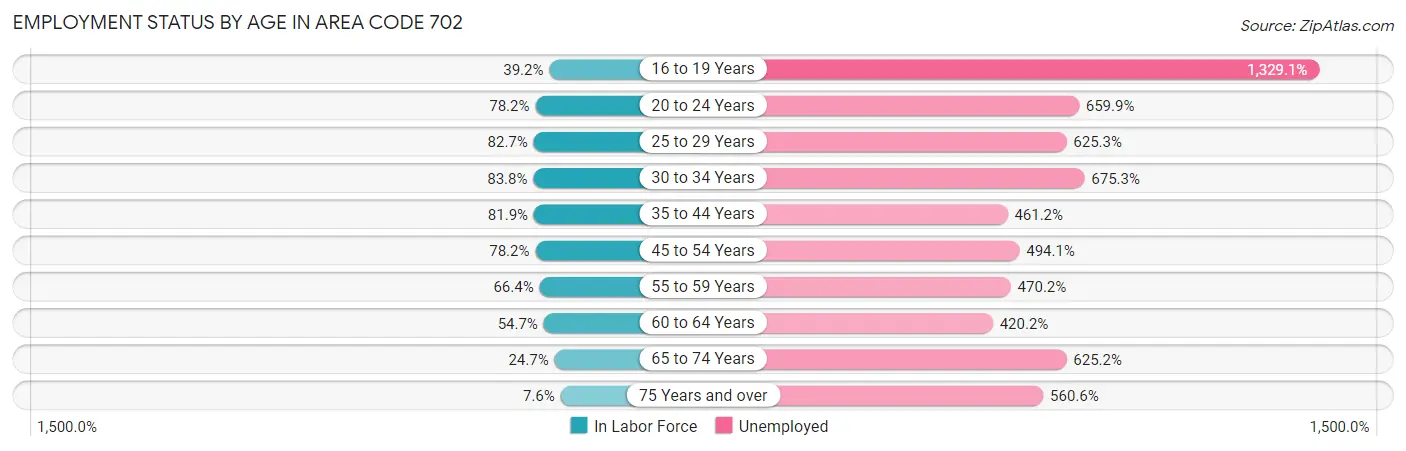
| Age Bracket | In Labor Force | Unemployed |
| 16 to 19 Years | 43,589 (39.2%) | 579,341 (1,329.1%) |
| 20 to 24 Years | 108,941 (78.2%) | 718,908 (659.9%) |
| 25 to 29 Years | 136,598 (82.7%) | 854,191 (625.3%) |
| 30 to 34 Years | 142,354 (83.8%) | 961,344 (675.3%) |
| 35 to 44 Years | 260,869 (81.9%) | 1,203,063 (461.2%) |
| 45 to 54 Years | 233,879 (78.2%) | 1,155,586 (494.1%) |
| 55 to 59 Years | 94,908 (66.4%) | 446,229 (470.2%) |
| 60 to 64 Years | 71,435 (54.7%) | 300,149 (420.2%) |
| 65 to 74 Years | 53,057 (24.7%) | 331,712 (625.2%) |
| 75 Years and over | 10,362 (7.6%) | 58,073 (560.6%) |
| Total | 1,093,345 (59.8%) | 89,318 (8.2%) |
Employment Status by Educational Attainment in Area Code 702
According to labor force statistics for Area Code 702, 73.9% of individuals (906,163) out of the total population between 25 and 64 years of age (1,226,036) are in the labor force, with 523.5% or 4,743,763 of them being unemployed. The group with the highest labor force participation rate are those with the educational attainment of bachelor's degree or higher, with 81.6% or 260,159 individuals in the labor force. Within the labor force, individuals with high school diploma education have the highest percentage of unemployment, with 613.3% or 1,497,636 of them being unemployed.
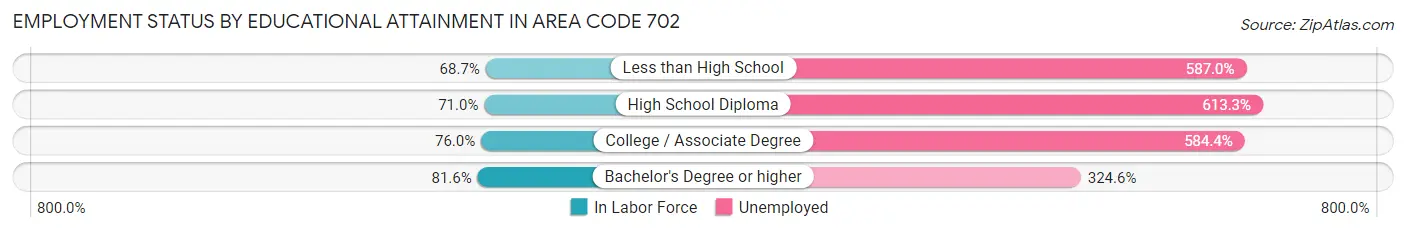
| Educational Attainment | In Labor Force | Unemployed |
| Less than High School | 115,651 (68.7%) | 988,209 (587.0%) |
| High School Diploma | 244,184 (71.0%) | 2,109,347 (613.3%) |
| College / Associate Degree | 299,974 (76.0%) | 2,307,293 (584.4%) |
| Bachelor's Degree or higher | 260,165 (81.6%) | 1,035,276 (324.6%) |
| Total | 906,186 (73.9%) | 6,418,298 (523.5%) |
Employment Occupations by Sex in Area Code 702
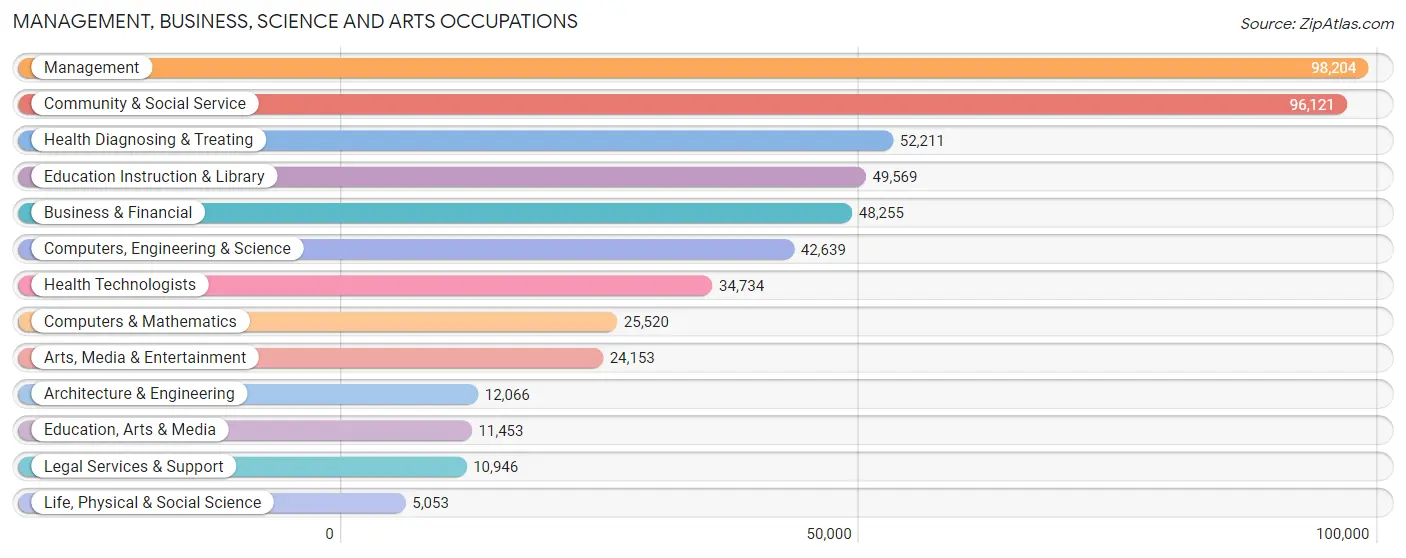
Management, Business, Science and Arts Occupations
The most common Management, Business, Science and Arts occupations in Area Code 702 are Management (98,204 | 9.2%), Community & Social Service (96,121 | 9.0%), Health Diagnosing & Treating (52,211 | 4.9%), Education Instruction & Library (49,569 | 4.7%), and Business & Financial (48,255 | 4.5%).
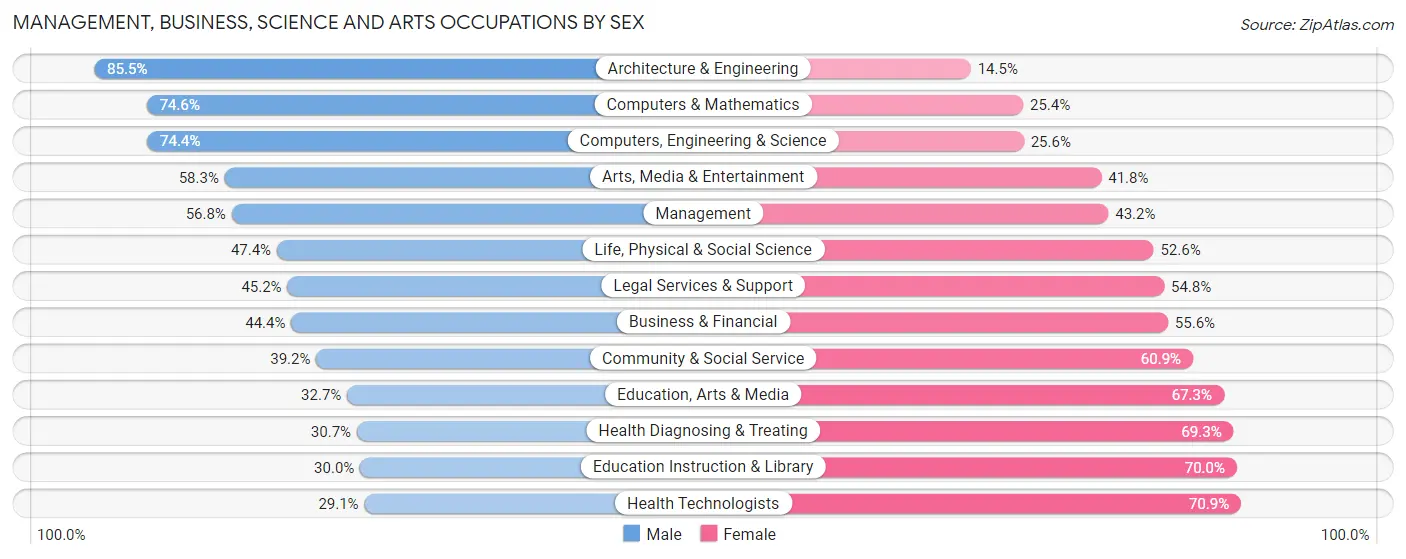
Management, Business, Science and Arts Occupations by Sex
Within the Management, Business, Science and Arts occupations in Area Code 702, the most male-oriented occupations are Architecture & Engineering (85.5%), Computers & Mathematics (74.6%), and Computers, Engineering & Science (74.4%), while the most female-oriented occupations are Health Technologists (70.9%), Education Instruction & Library (70.0%), and Health Diagnosing & Treating (69.3%).
| Occupation | Male | Female |
| Management | 55,783 (56.8%) | 42,421 (43.2%) |
| Business & Financial | 21,405 (44.4%) | 26,850 (55.6%) |
| Computers, Engineering & Science | 31,737 (74.4%) | 10,902 (25.6%) |
| Computers & Mathematics | 19,029 (74.6%) | 6,491 (25.4%) |
| Architecture & Engineering | 10,315 (85.5%) | 1,751 (14.5%) |
| Life, Physical & Social Science | 2,393 (47.4%) | 2,660 (52.6%) |
| Community & Social Service | 37,632 (39.2%) | 58,489 (60.9%) |
| Education, Arts & Media | 3,746 (32.7%) | 7,707 (67.3%) |
| Legal Services & Support | 4,944 (45.2%) | 6,002 (54.8%) |
| Education Instruction & Library | 14,873 (30.0%) | 34,696 (70.0%) |
| Arts, Media & Entertainment | 14,069 (58.3%) | 10,084 (41.7%) |
| Health Diagnosing & Treating | 16,020 (30.7%) | 36,191 (69.3%) |
| Health Technologists | 10,110 (29.1%) | 24,624 (70.9%) |
| Total (Category) | 162,577 (48.2%) | 174,853 (51.8%) |
| Total (Overall) | 570,920 (53.7%) | 492,397 (46.3%) |
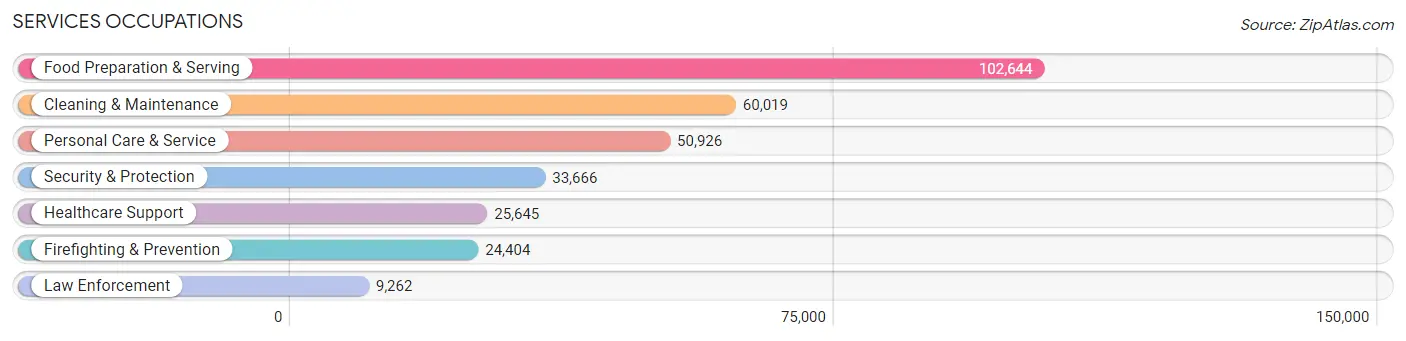
Services Occupations
The most common Services occupations in Area Code 702 are Food Preparation & Serving (102,644 | 9.7%), Cleaning & Maintenance (60,019 | 5.6%), Personal Care & Service (50,926 | 4.8%), Security & Protection (33,666 | 3.2%), and Healthcare Support (25,645 | 2.4%).
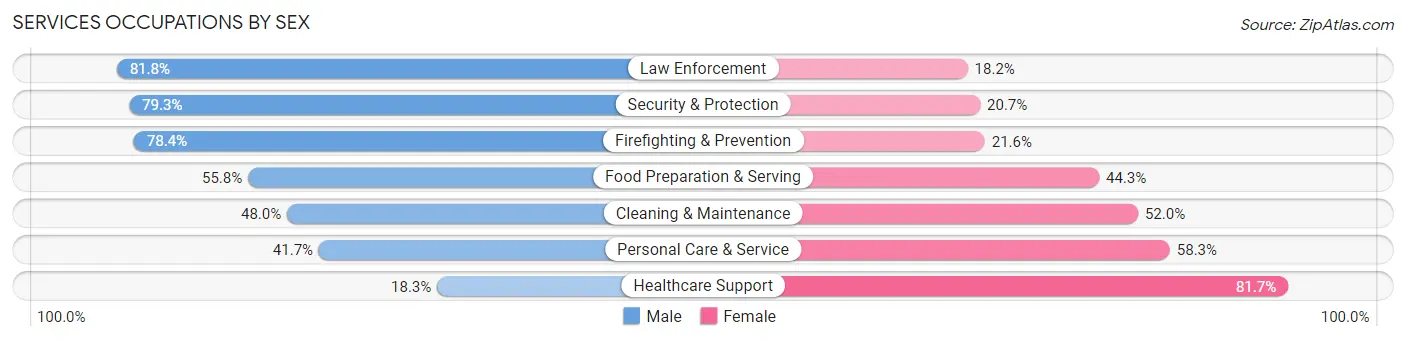
Services Occupations by Sex
Within the Services occupations in Area Code 702, the most male-oriented occupations are Law Enforcement (81.8%), Security & Protection (79.3%), and Firefighting & Prevention (78.4%), while the most female-oriented occupations are Healthcare Support (81.7%), Personal Care & Service (58.3%), and Cleaning & Maintenance (52.0%).
| Occupation | Male | Female |
| Healthcare Support | 4,697 (18.3%) | 20,948 (81.7%) |
| Security & Protection | 26,697 (79.3%) | 6,969 (20.7%) |
| Firefighting & Prevention | 19,124 (78.4%) | 5,280 (21.6%) |
| Law Enforcement | 7,573 (81.8%) | 1,689 (18.2%) |
| Food Preparation & Serving | 57,229 (55.7%) | 45,415 (44.3%) |
| Cleaning & Maintenance | 28,827 (48.0%) | 31,192 (52.0%) |
| Personal Care & Service | 21,244 (41.7%) | 29,682 (58.3%) |
| Total (Category) | 138,694 (50.8%) | 134,206 (49.2%) |
| Total (Overall) | 570,920 (53.7%) | 492,397 (46.3%) |
Sales and Office Occupations
The most common Sales and Office occupations in Area Code 702 are Office & Administration (126,115 | 11.9%), and Sales & Related (114,422 | 10.8%).
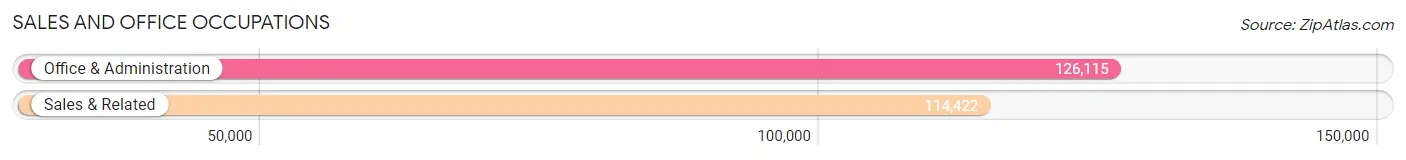
Sales and Office Occupations by Sex
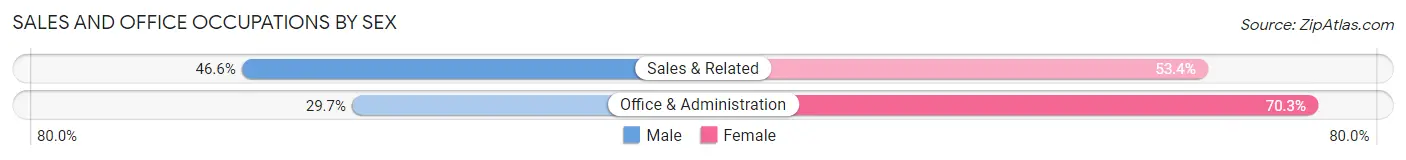
| Occupation | Male | Female |
| Sales & Related | 53,346 (46.6%) | 61,076 (53.4%) |
| Office & Administration | 37,402 (29.7%) | 88,713 (70.3%) |
| Total (Category) | 90,748 (37.7%) | 149,789 (62.3%) |
| Total (Overall) | 570,920 (53.7%) | 492,397 (46.3%) |
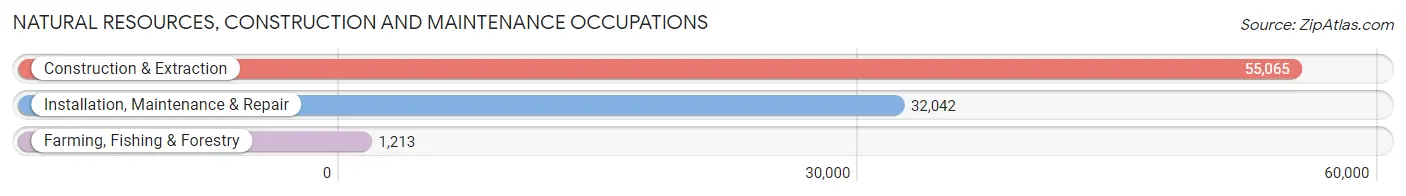
Natural Resources, Construction and Maintenance Occupations
The most common Natural Resources, Construction and Maintenance occupations in Area Code 702 are Construction & Extraction (55,065 | 5.2%), Installation, Maintenance & Repair (32,042 | 3.0%), and Farming, Fishing & Forestry (1,213 | 0.1%).
Natural Resources, Construction and Maintenance Occupations by Sex
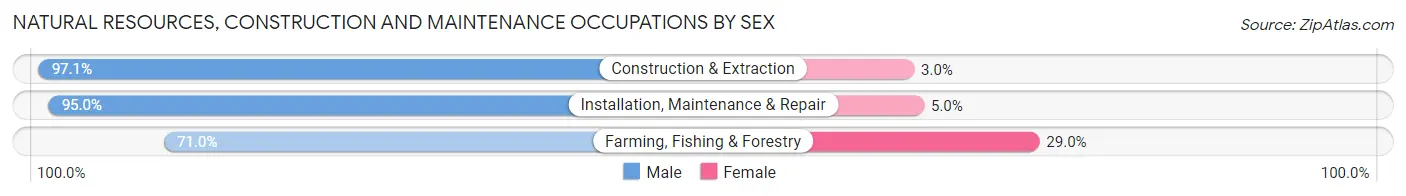
| Occupation | Male | Female |
| Farming, Fishing & Forestry | 861 (71.0%) | 352 (29.0%) |
| Construction & Extraction | 53,441 (97.1%) | 1,624 (2.9%) |
| Installation, Maintenance & Repair | 30,432 (95.0%) | 1,610 (5.0%) |
| Total (Category) | 84,734 (95.9%) | 3,586 (4.1%) |
| Total (Overall) | 570,920 (53.7%) | 492,397 (46.3%) |
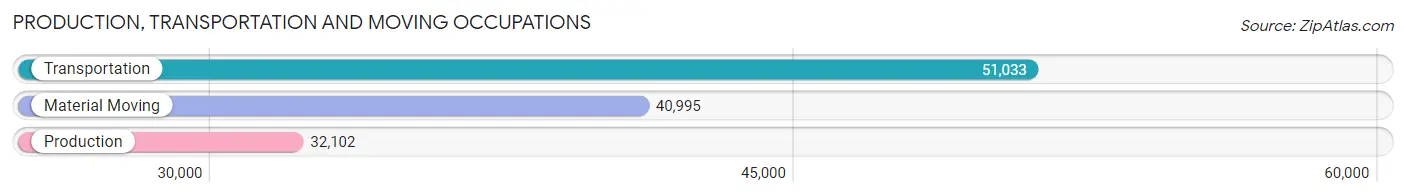
Production, Transportation and Moving Occupations
The most common Production, Transportation and Moving occupations in Area Code 702 are Transportation (51,033 | 4.8%), Material Moving (40,995 | 3.9%), and Production (32,102 | 3.0%).
Production, Transportation and Moving Occupations by Sex
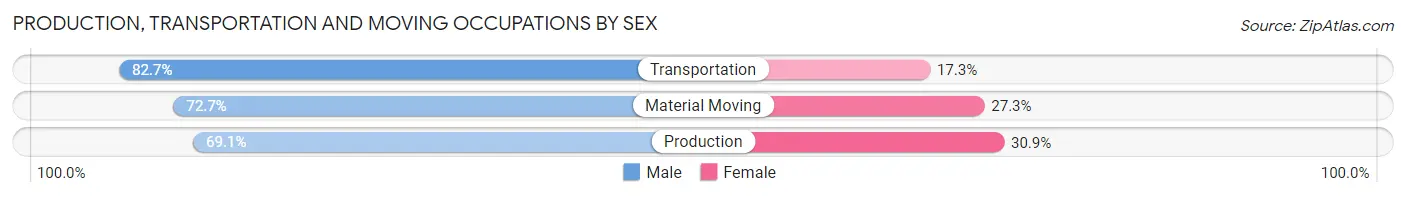
| Occupation | Male | Female |
| Production | 22,178 (69.1%) | 9,924 (30.9%) |
| Transportation | 42,191 (82.7%) | 8,842 (17.3%) |
| Material Moving | 29,798 (72.7%) | 11,197 (27.3%) |
| Total (Category) | 94,167 (75.9%) | 29,963 (24.1%) |
| Total (Overall) | 570,920 (53.7%) | 492,397 (46.3%) |
Employment Industries by Sex in Area Code 702
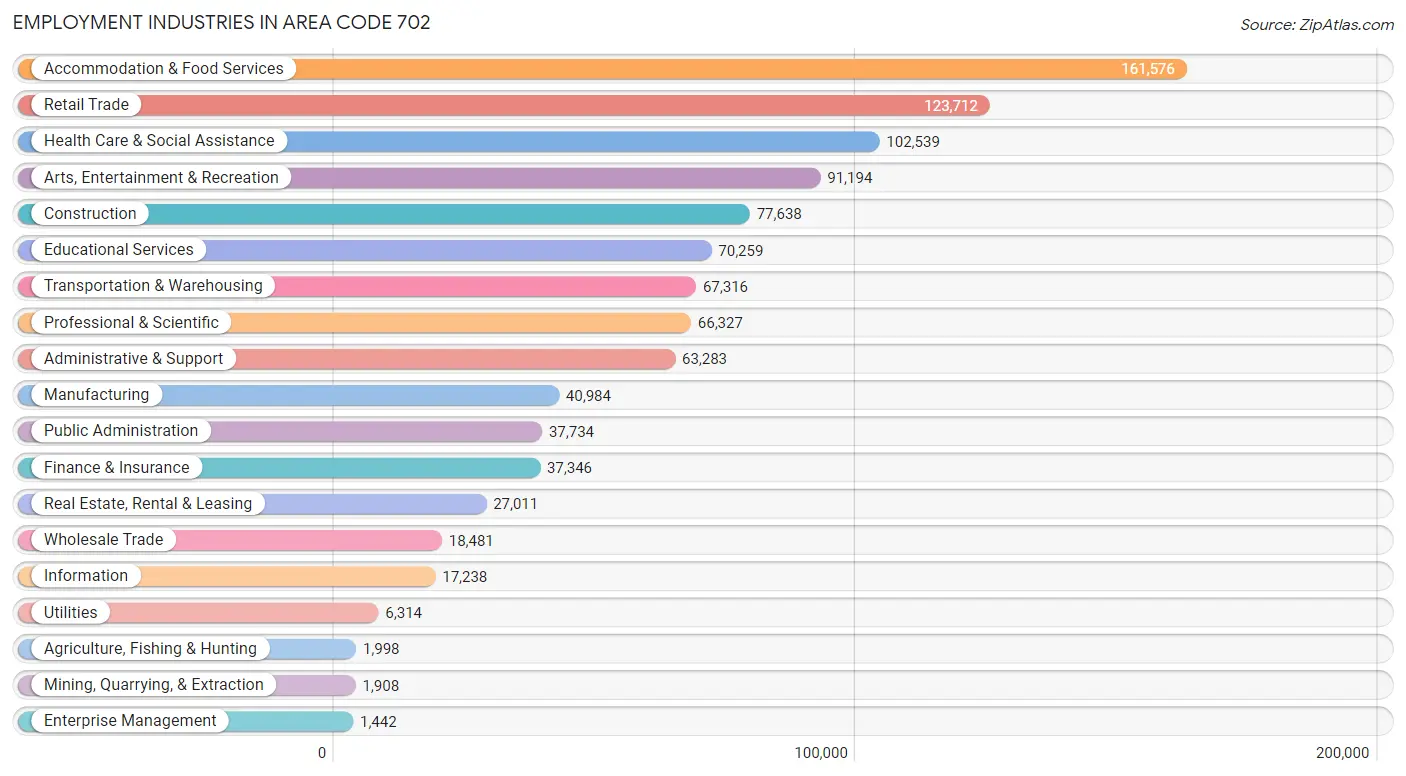
Employment Industries in Area Code 702
The major employment industries in Area Code 702 include Accommodation & Food Services (161,576 | 15.2%), Retail Trade (123,712 | 11.6%), Health Care & Social Assistance (102,539 | 9.6%), Arts, Entertainment & Recreation (91,194 | 8.6%), and Construction (77,638 | 7.3%).
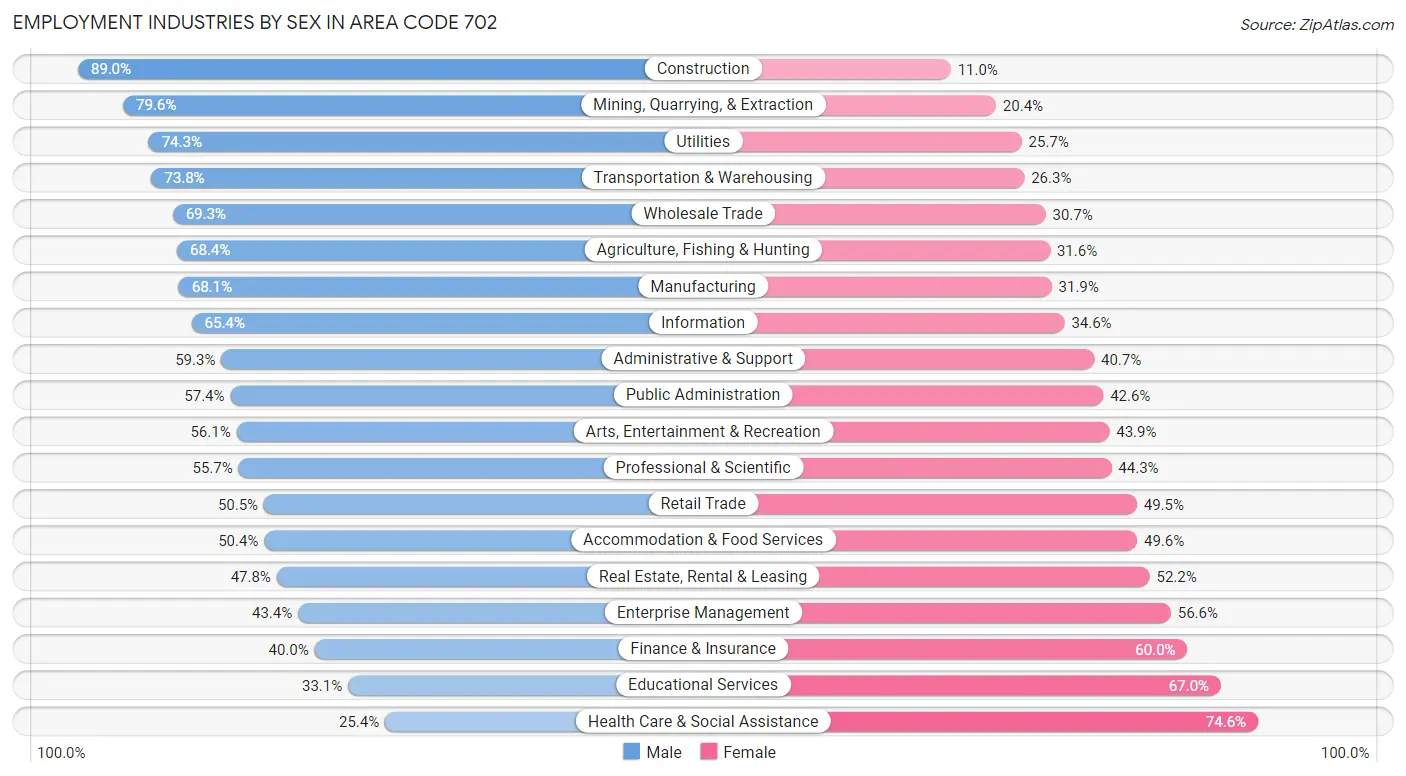
Employment Industries by Sex in Area Code 702
The Area Code 702 industries that see more men than women are Construction (89.0%), Mining, Quarrying, & Extraction (79.6%), and Utilities (74.3%), whereas the industries that tend to have a higher number of women are Health Care & Social Assistance (74.6%), Educational Services (66.9%), and Finance & Insurance (60.0%).
| Industry | Male | Female |
| Agriculture, Fishing & Hunting | 1,367 (68.4%) | 631 (31.6%) |
| Mining, Quarrying, & Extraction | 1,519 (79.6%) | 389 (20.4%) |
| Construction | 69,071 (89.0%) | 8,567 (11.0%) |
| Manufacturing | 27,900 (68.1%) | 13,084 (31.9%) |
| Wholesale Trade | 12,815 (69.3%) | 5,666 (30.7%) |
| Retail Trade | 62,429 (50.5%) | 61,283 (49.5%) |
| Transportation & Warehousing | 49,648 (73.8%) | 17,668 (26.3%) |
| Utilities | 4,691 (74.3%) | 1,623 (25.7%) |
| Information | 11,278 (65.4%) | 5,960 (34.6%) |
| Finance & Insurance | 14,930 (40.0%) | 22,416 (60.0%) |
| Real Estate, Rental & Leasing | 12,918 (47.8%) | 14,093 (52.2%) |
| Professional & Scientific | 36,954 (55.7%) | 29,373 (44.3%) |
| Enterprise Management | 626 (43.4%) | 816 (56.6%) |
| Administrative & Support | 37,524 (59.3%) | 25,759 (40.7%) |
| Educational Services | 23,224 (33.1%) | 47,035 (66.9%) |
| Health Care & Social Assistance | 26,037 (25.4%) | 76,502 (74.6%) |
| Arts, Entertainment & Recreation | 51,197 (56.1%) | 39,997 (43.9%) |
| Accommodation & Food Services | 81,432 (50.4%) | 80,144 (49.6%) |
| Public Administration | 21,664 (57.4%) | 16,070 (42.6%) |
| Total | 570,920 (53.7%) | 492,397 (46.3%) |
Education in Area Code 702
School Enrollment in Area Code 702
The most common levels of schooling among the 520,551 students in Area Code 702 are middle school (121,322 | 23.3%), high school (120,147 | 23.1%), and elementary school (109,327 | 21.0%).
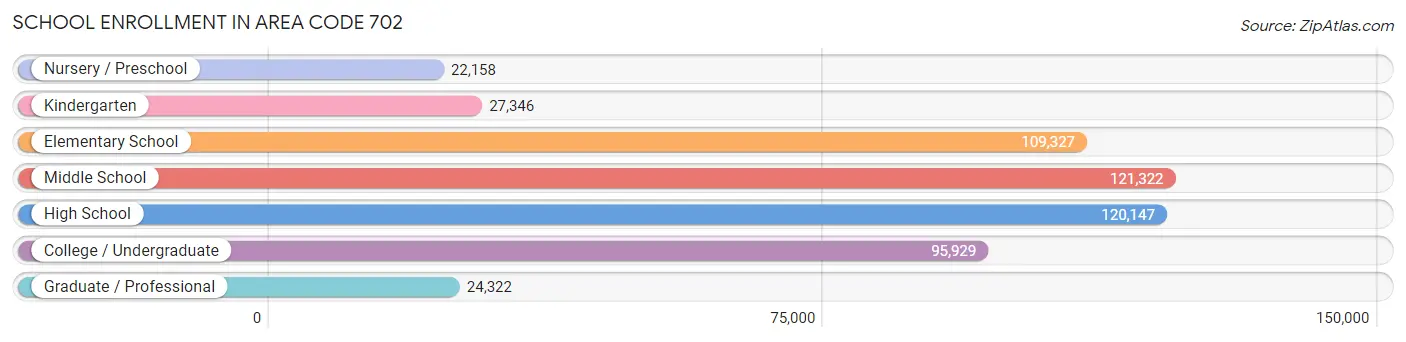
| School Level | # Students | % Students |
| Nursery / Preschool | 22,158 | 4.3% |
| Kindergarten | 27,346 | 5.2% |
| Elementary School | 109,327 | 21.0% |
| Middle School | 121,322 | 23.3% |
| High School | 120,147 | 23.1% |
| College / Undergraduate | 95,929 | 18.4% |
| Graduate / Professional | 24,322 | 4.7% |
| Total | 520,551 | 100.0% |
School Enrollment by Age by Funding Source in Area Code 702
Out of a total of 520,551 students who are enrolled in schools in Area Code 702, 67,991 (13.1%) attend a private institution, while the remaining 452,560 (86.9%) are enrolled in public schools. The age group of 3 to 4 year olds has the highest likelihood of being enrolled in private schools, with 6,763 (37.8% in the age bracket) enrolled. Conversely, the age group of 15 to 17 year olds has the lowest likelihood of being enrolled in a private school, with 78,893 (92.8% in the age bracket) attending a public institution.
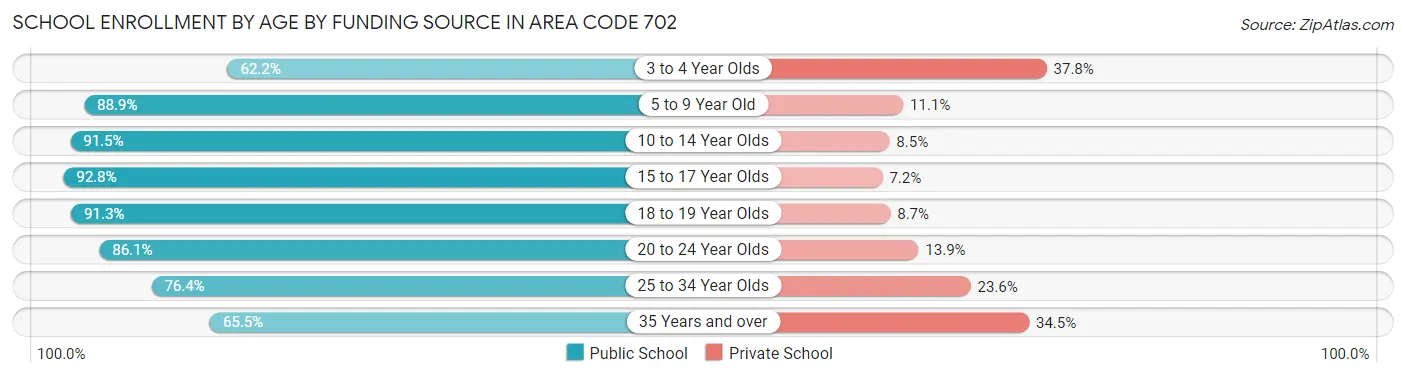
| Age Bracket | Public School | Private School |
| 3 to 4 Year Olds | 11,127 (62.2%) | 6,763 (37.8%) |
| 5 to 9 Year Old | 116,045 (88.9%) | 14,467 (11.1%) |
| 10 to 14 Year Olds | 136,331 (91.5%) | 12,698 (8.5%) |
| 15 to 17 Year Olds | 78,893 (92.8%) | 6,138 (7.2%) |
| 18 to 19 Year Olds | 27,536 (91.3%) | 2,617 (8.7%) |
| 20 to 24 Year Olds | 33,985 (86.1%) | 5,494 (13.9%) |
| 25 to 34 Year Olds | 26,981 (76.4%) | 8,347 (23.6%) |
| 35 Years and over | 21,688 (65.5%) | 11,441 (34.5%) |
| Total | 452,560 (86.9%) | 67,991 (13.1%) |
Educational Attainment by Field of Study in Area Code 702
Business (107,890 | 24.4%), education (47,975 | 10.9%), science & technology (45,271 | 10.3%), social sciences (33,280 | 7.5%), and arts & humanities (32,083 | 7.3%) are the most common fields of study among 441,364 individuals in Area Code 702 who have obtained a bachelor's degree or higher.
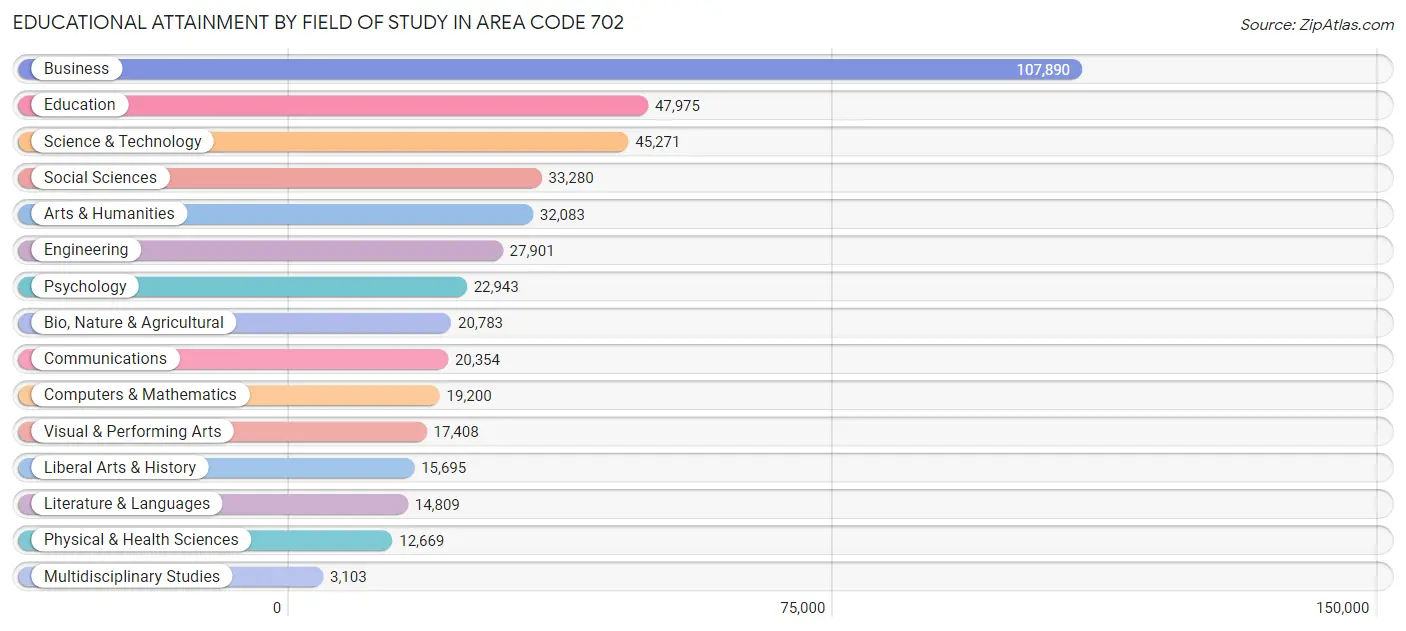
| Field of Study | # Graduates | % Graduates |
| Computers & Mathematics | 19,200 | 4.3% |
| Bio, Nature & Agricultural | 20,783 | 4.7% |
| Physical & Health Sciences | 12,669 | 2.9% |
| Psychology | 22,943 | 5.2% |
| Social Sciences | 33,280 | 7.5% |
| Engineering | 27,901 | 6.3% |
| Multidisciplinary Studies | 3,103 | 0.7% |
| Science & Technology | 45,271 | 10.3% |
| Business | 107,890 | 24.4% |
| Education | 47,975 | 10.9% |
| Literature & Languages | 14,809 | 3.4% |
| Liberal Arts & History | 15,695 | 3.6% |
| Visual & Performing Arts | 17,408 | 3.9% |
| Communications | 20,354 | 4.6% |
| Arts & Humanities | 32,083 | 7.3% |
| Total | 441,364 | 100.0% |
Transportation & Commute in Area Code 702
Vehicle Availability by Sex in Area Code 702
The most prevalent vehicle ownership categories in Area Code 702 are males with 2 vehicles (231,477, accounting for 40.9%) and females with 2 vehicles (189,232, making up 48.3%).
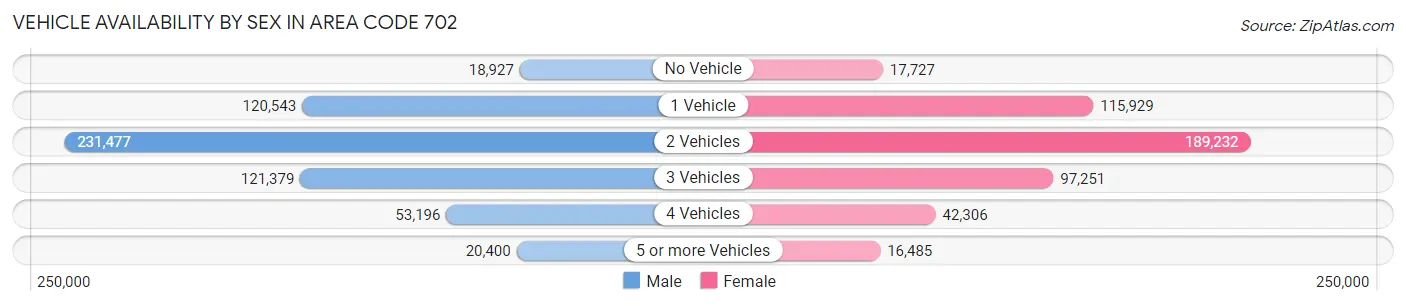
| Vehicles Available | Male | Female |
| No Vehicle | 18,927 (3.3%) | 17,727 (3.7%) |
| 1 Vehicle | 120,543 (21.3%) | 115,929 (24.2%) |
| 2 Vehicles | 231,477 (40.9%) | 189,232 (39.5%) |
| 3 Vehicles | 121,379 (21.4%) | 97,251 (20.3%) |
| 4 Vehicles | 53,196 (9.4%) | 42,306 (8.8%) |
| 5 or more Vehicles | 20,400 (3.6%) | 16,485 (3.4%) |
| Total | 565,922 (100.0%) | 478,930 (100.0%) |
Commute Time in Area Code 702
The most frequently occuring commute durations in Area Code 702 are 20 to 24 minutes (185,483 commuters, 19.5%), 30 to 34 minutes (177,654 commuters, 18.7%), and 15 to 19 minutes (150,914 commuters, 15.9%).
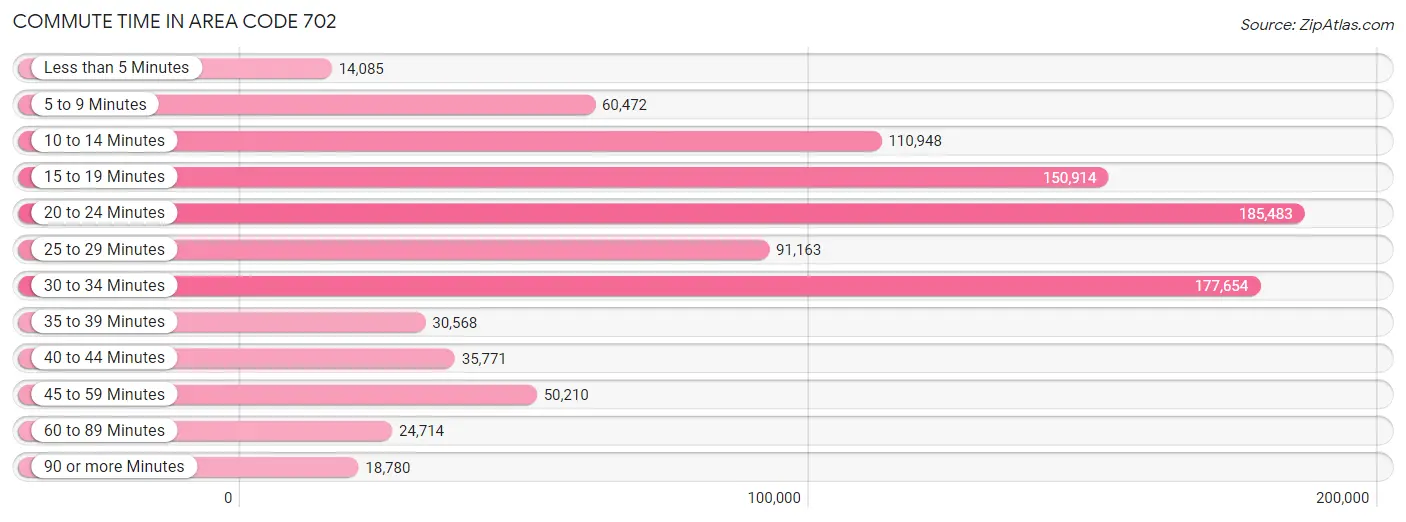
| Commute Time | # Commuters | % Commuters |
| Less than 5 Minutes | 14,085 | 1.5% |
| 5 to 9 Minutes | 60,472 | 6.4% |
| 10 to 14 Minutes | 110,948 | 11.7% |
| 15 to 19 Minutes | 150,914 | 15.9% |
| 20 to 24 Minutes | 185,483 | 19.5% |
| 25 to 29 Minutes | 91,163 | 9.6% |
| 30 to 34 Minutes | 177,654 | 18.7% |
| 35 to 39 Minutes | 30,568 | 3.2% |
| 40 to 44 Minutes | 35,771 | 3.8% |
| 45 to 59 Minutes | 50,210 | 5.3% |
| 60 to 89 Minutes | 24,714 | 2.6% |
| 90 or more Minutes | 18,780 | 2.0% |
Commute Time by Sex in Area Code 702
The most common commute times in Area Code 702 are 30 to 34 minutes (102,692 commuters, 19.7%) for males and 20 to 24 minutes (84,911 commuters, 19.7%) for females.
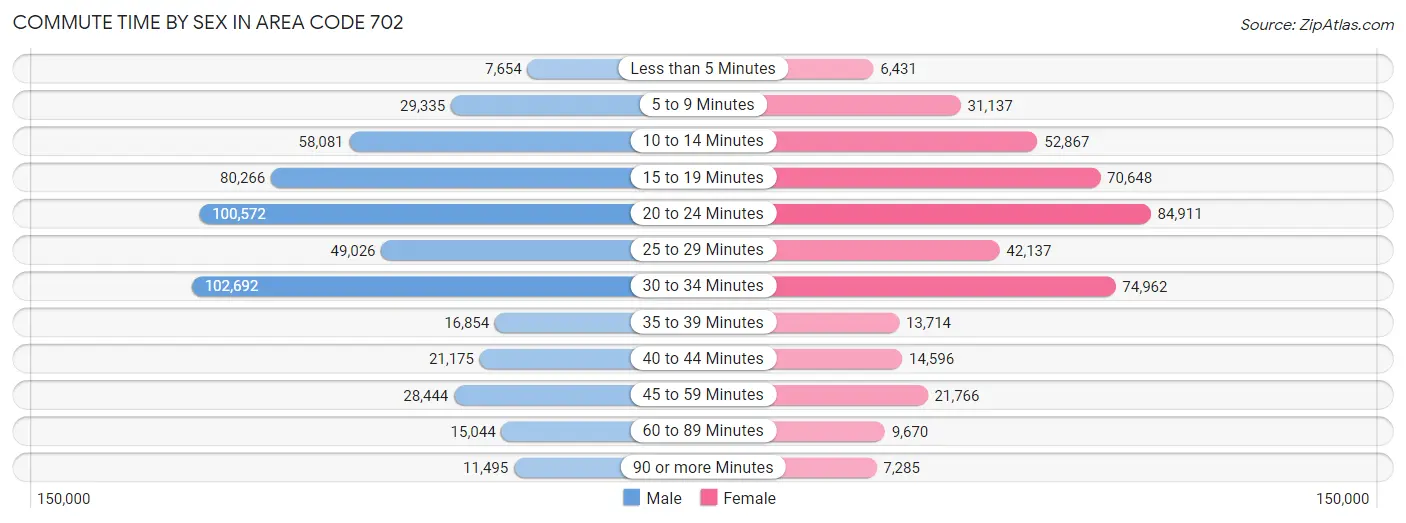
| Commute Time | Male | Female |
| Less than 5 Minutes | 7,654 (1.5%) | 6,431 (1.5%) |
| 5 to 9 Minutes | 29,335 (5.6%) | 31,137 (7.2%) |
| 10 to 14 Minutes | 58,081 (11.2%) | 52,867 (12.3%) |
| 15 to 19 Minutes | 80,266 (15.4%) | 70,648 (16.4%) |
| 20 to 24 Minutes | 100,572 (19.3%) | 84,911 (19.7%) |
| 25 to 29 Minutes | 49,026 (9.4%) | 42,137 (9.8%) |
| 30 to 34 Minutes | 102,692 (19.7%) | 74,962 (17.4%) |
| 35 to 39 Minutes | 16,854 (3.2%) | 13,714 (3.2%) |
| 40 to 44 Minutes | 21,175 (4.1%) | 14,596 (3.4%) |
| 45 to 59 Minutes | 28,444 (5.5%) | 21,766 (5.1%) |
| 60 to 89 Minutes | 15,044 (2.9%) | 9,670 (2.2%) |
| 90 or more Minutes | 11,495 (2.2%) | 7,285 (1.7%) |
Time of Departure to Work by Sex in Area Code 702
The most frequent times of departure to work in Area Code 702 are 7:00 AM to 7:29 AM (54,659, 10.5%) for males and 7:00 AM to 7:29 AM (53,769, 12.5%) for females.
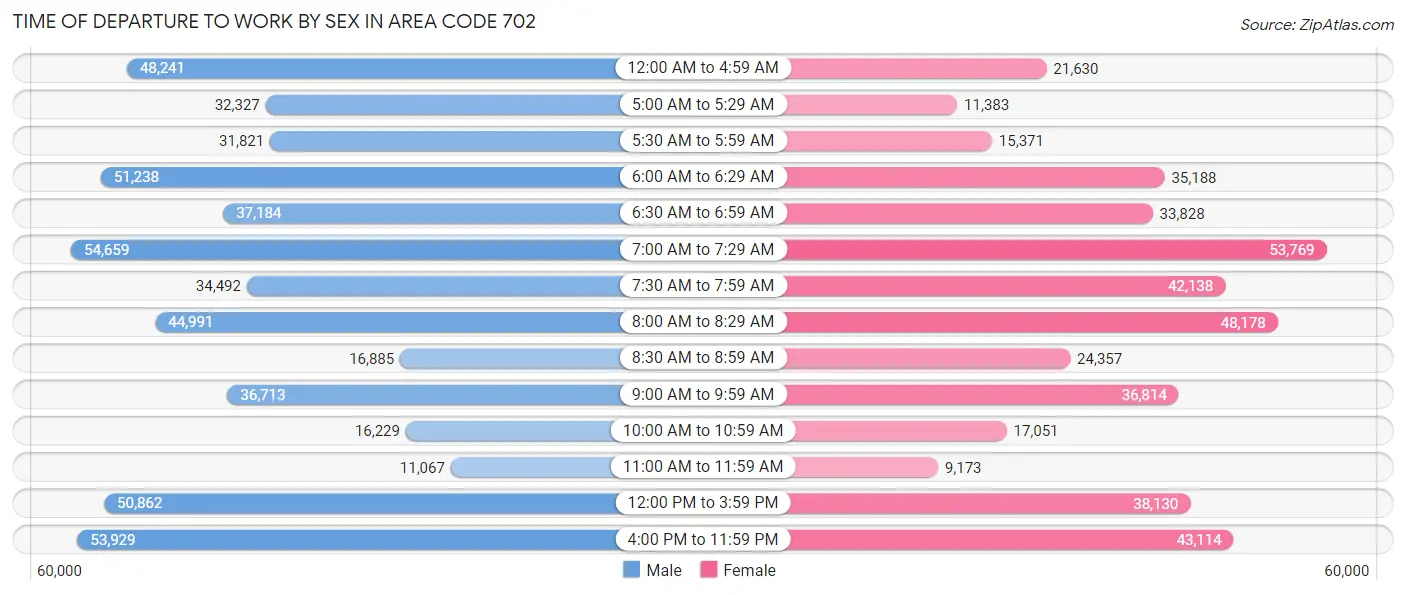
| Time of Departure | Male | Female |
| 12:00 AM to 4:59 AM | 48,241 (9.3%) | 21,630 (5.0%) |
| 5:00 AM to 5:29 AM | 32,327 (6.2%) | 11,383 (2.6%) |
| 5:30 AM to 5:59 AM | 31,821 (6.1%) | 15,371 (3.6%) |
| 6:00 AM to 6:29 AM | 51,238 (9.8%) | 35,188 (8.2%) |
| 6:30 AM to 6:59 AM | 37,184 (7.1%) | 33,828 (7.9%) |
| 7:00 AM to 7:29 AM | 54,659 (10.5%) | 53,769 (12.5%) |
| 7:30 AM to 7:59 AM | 34,492 (6.6%) | 42,138 (9.8%) |
| 8:00 AM to 8:29 AM | 44,991 (8.6%) | 48,178 (11.2%) |
| 8:30 AM to 8:59 AM | 16,885 (3.2%) | 24,357 (5.7%) |
| 9:00 AM to 9:59 AM | 36,713 (7.0%) | 36,814 (8.6%) |
| 10:00 AM to 10:59 AM | 16,229 (3.1%) | 17,051 (4.0%) |
| 11:00 AM to 11:59 AM | 11,067 (2.1%) | 9,173 (2.1%) |
| 12:00 PM to 3:59 PM | 50,862 (9.8%) | 38,130 (8.9%) |
| 4:00 PM to 11:59 PM | 53,929 (10.4%) | 43,114 (10.0%) |
| Total | 520,638 (100.0%) | 430,124 (100.0%) |
Housing Occupancy in Area Code 702
Occupancy by Ownership in Area Code 702
Of the total 840,826 dwellings in Area Code 702, owner-occupied units account for 474,912 (56.5%), while renter-occupied units make up 365,914 (43.5%).
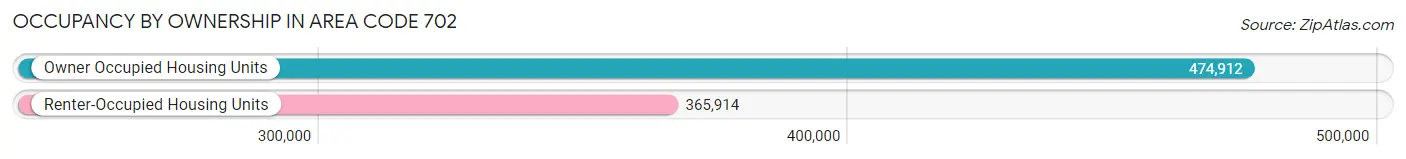
| Occupancy | # Housing Units | % Housing Units |
| Owner Occupied Housing Units | 474,912 | 56.5% |
| Renter-Occupied Housing Units | 365,914 | 43.5% |
| Total Occupied Housing Units | 840,826 | 100.0% |
Occupancy by Household Size in Area Code 702
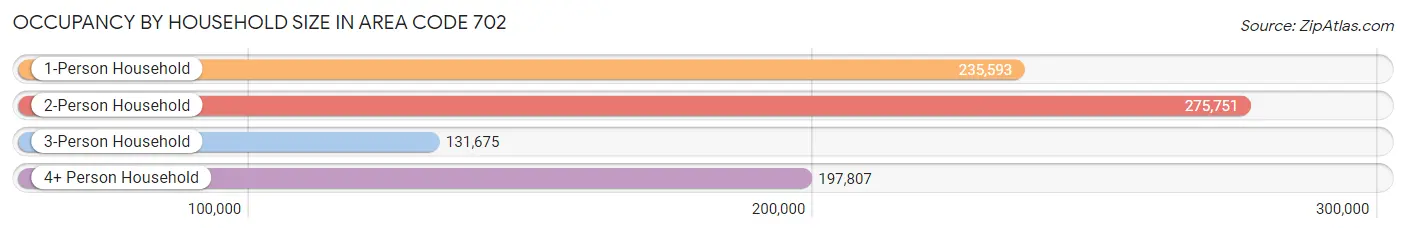
| Household Size | # Housing Units | % Housing Units |
| 1-Person Household | 235,593 | 28.0% |
| 2-Person Household | 275,751 | 32.8% |
| 3-Person Household | 131,675 | 15.7% |
| 4+ Person Household | 197,807 | 23.5% |
| Total Housing Units | 840,826 | 100.0% |
Occupancy by Ownership by Household Size in Area Code 702
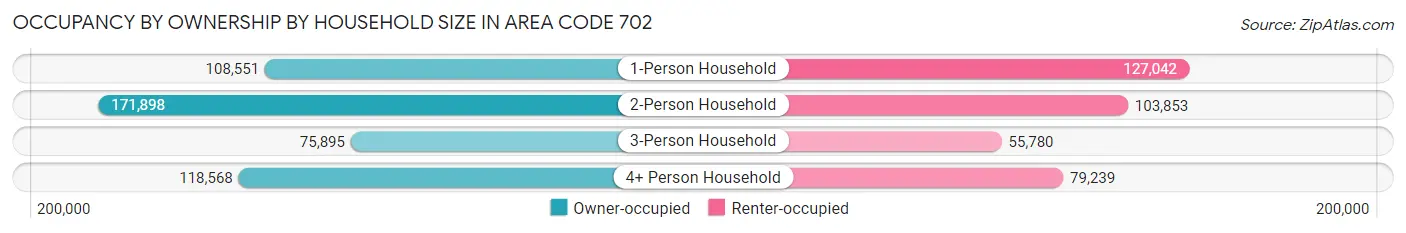
| Household Size | Owner-occupied | Renter-occupied |
| 1-Person Household | 108,551 (46.1%) | 127,042 (53.9%) |
| 2-Person Household | 171,898 (62.3%) | 103,853 (37.7%) |
| 3-Person Household | 75,895 (57.6%) | 55,780 (42.4%) |
| 4+ Person Household | 118,568 (59.9%) | 79,239 (40.1%) |
| Total Housing Units | 474,912 (56.5%) | 365,914 (43.5%) |
Occupancy by Educational Attainment in Area Code 702
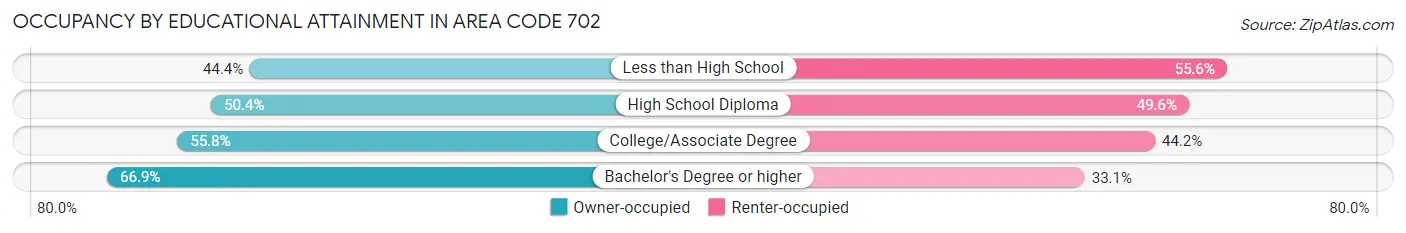
| Household Size | Owner-occupied | Renter-occupied |
| Less than High School | 41,579 (44.4%) | 52,083 (55.6%) |
| High School Diploma | 102,964 (50.4%) | 101,230 (49.6%) |
| College/Associate Degree | 164,833 (55.8%) | 130,730 (44.2%) |
| Bachelor's Degree or higher | 165,536 (66.9%) | 81,871 (33.1%) |
Occupancy by Age of Householder in Area Code 702
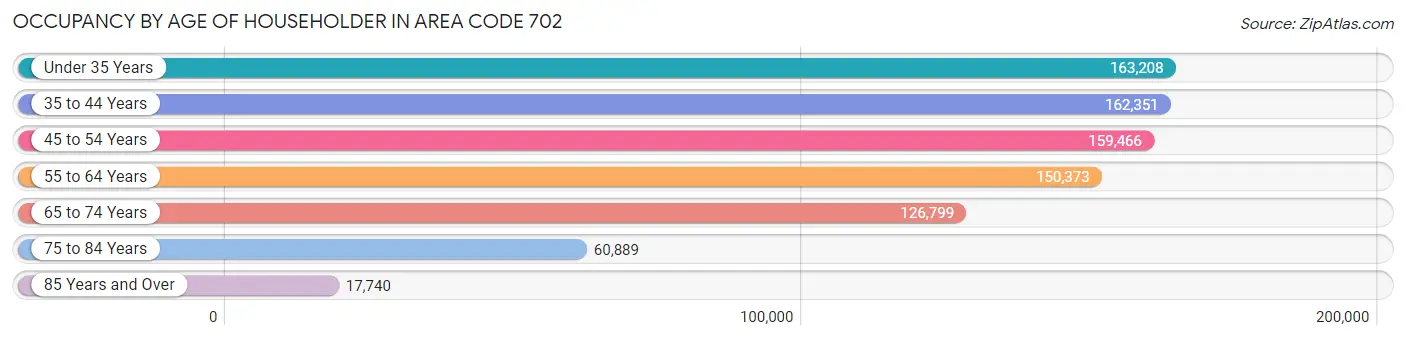
| Age Bracket | # Households | % Households |
| Under 35 Years | 163,208 | 19.4% |
| 35 to 44 Years | 162,351 | 19.3% |
| 45 to 54 Years | 159,466 | 19.0% |
| 55 to 64 Years | 150,373 | 17.9% |
| 65 to 74 Years | 126,799 | 15.1% |
| 75 to 84 Years | 60,889 | 7.2% |
| 85 Years and Over | 17,740 | 2.1% |
| Total | 840,826 | 100.0% |
Housing Finances in Area Code 702
Median Income by Occupancy in Area Code 702
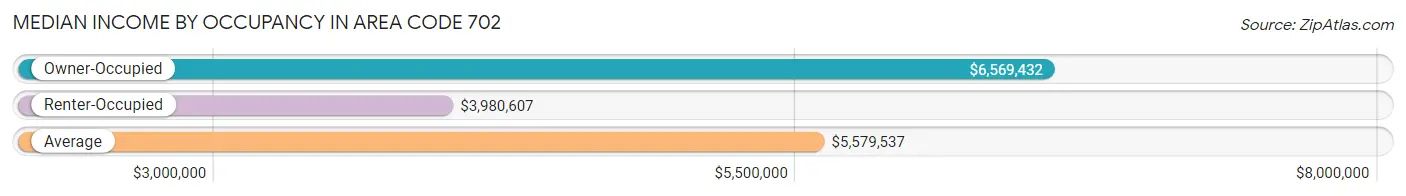
| Occupancy Type | # Households | Median Income |
| Owner-Occupied | 474,912 (56.5%) | $6,569,432 |
| Renter-Occupied | 365,914 (43.5%) | $3,980,607 |
| Average | 840,826 (100.0%) | $5,579,537 |
Occupancy by Householder Income Bracket in Area Code 702
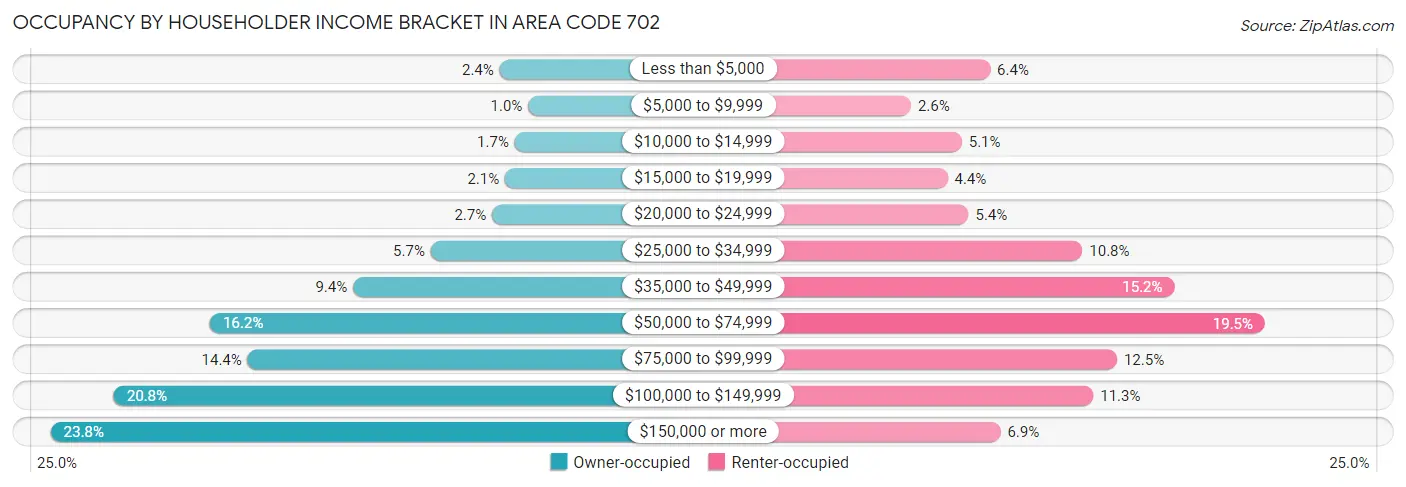
| Income Bracket | Owner-occupied | Renter-occupied |
| Less than $5,000 | 11,315 (2.4%) | 23,443 (6.4%) |
| $5,000 to $9,999 | 4,841 (1.0%) | 9,653 (2.6%) |
| $10,000 to $14,999 | 7,866 (1.7%) | 18,505 (5.1%) |
| $15,000 to $19,999 | 10,062 (2.1%) | 16,020 (4.4%) |
| $20,000 to $24,999 | 13,015 (2.7%) | 19,690 (5.4%) |
| $25,000 to $34,999 | 26,891 (5.7%) | 39,524 (10.8%) |
| $35,000 to $49,999 | 44,452 (9.4%) | 55,562 (15.2%) |
| $50,000 to $74,999 | 76,771 (16.2%) | 71,332 (19.5%) |
| $75,000 to $99,999 | 68,308 (14.4%) | 45,544 (12.4%) |
| $100,000 to $149,999 | 98,555 (20.7%) | 41,409 (11.3%) |
| $150,000 or more | 112,836 (23.8%) | 25,232 (6.9%) |
| Total | 474,912 (100.0%) | 365,914 (100.0%) |
Monthly Housing Cost Tiers in Area Code 702
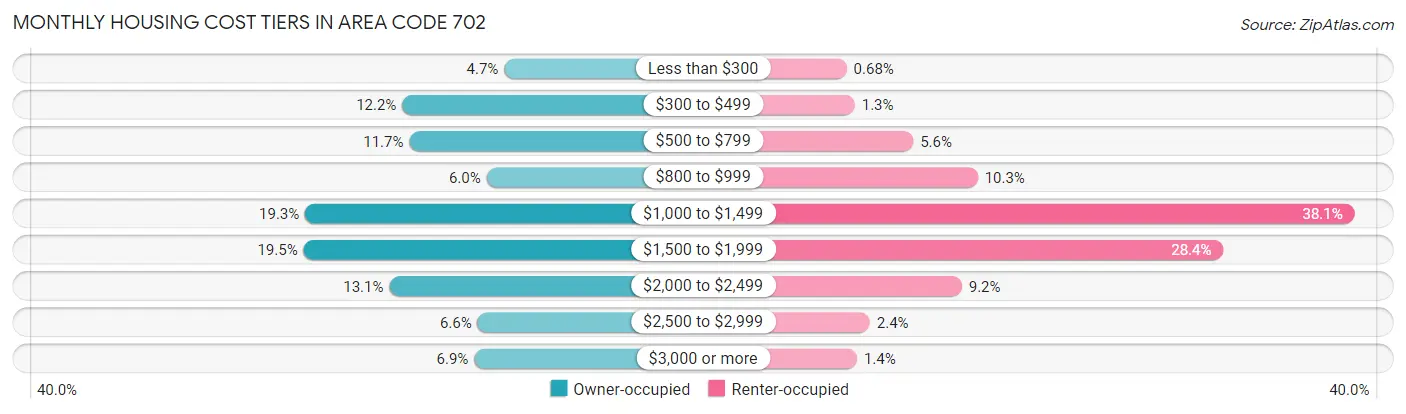
| Monthly Cost | Owner-occupied | Renter-occupied |
| Less than $300 | 22,232 (4.7%) | 2,486 (0.7%) |
| $300 to $499 | 57,893 (12.2%) | 4,673 (1.3%) |
| $500 to $799 | 55,428 (11.7%) | 20,418 (5.6%) |
| $800 to $999 | 28,409 (6.0%) | 37,811 (10.3%) |
| $1,000 to $1,499 | 91,866 (19.3%) | 139,349 (38.1%) |
| $1,500 to $1,999 | 92,428 (19.5%) | 103,977 (28.4%) |
| $2,000 to $2,499 | 62,384 (13.1%) | 33,525 (9.2%) |
| $2,500 to $2,999 | 31,538 (6.6%) | 8,739 (2.4%) |
| $3,000 or more | 32,734 (6.9%) | 5,252 (1.4%) |
| Total | 474,912 (100.0%) | 365,914 (100.0%) |
Physical Housing Characteristics in Area Code 702
Housing Structures in Area Code 702
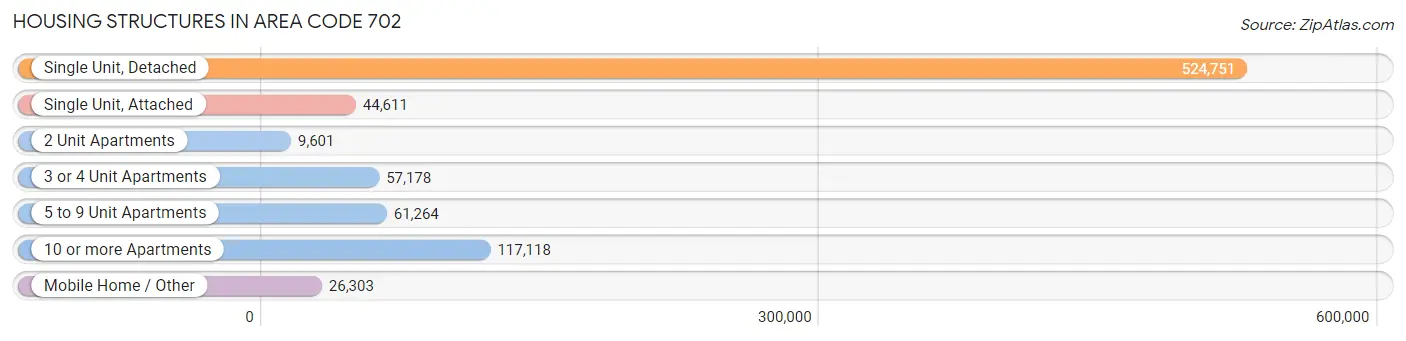
| Structure Type | # Housing Units | % Housing Units |
| Single Unit, Detached | 524,751 | 62.4% |
| Single Unit, Attached | 44,611 | 5.3% |
| 2 Unit Apartments | 9,601 | 1.1% |
| 3 or 4 Unit Apartments | 57,178 | 6.8% |
| 5 to 9 Unit Apartments | 61,264 | 7.3% |
| 10 or more Apartments | 117,118 | 13.9% |
| Mobile Home / Other | 26,303 | 3.1% |
| Total | 840,826 | 100.0% |
Housing Structures by Occupancy in Area Code 702
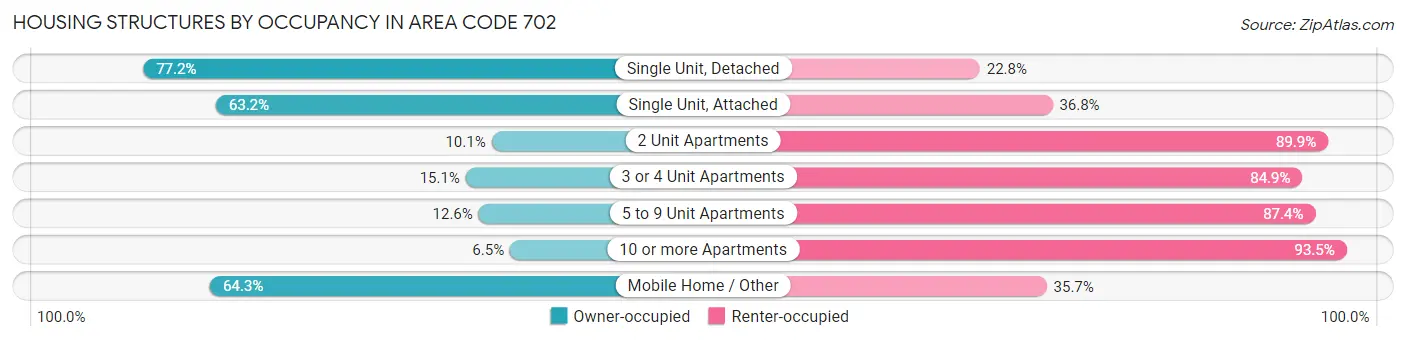
| Structure Type | Owner-occupied | Renter-occupied |
| Single Unit, Detached | 404,872 (77.2%) | 119,879 (22.8%) |
| Single Unit, Attached | 28,180 (63.2%) | 16,431 (36.8%) |
| 2 Unit Apartments | 971 (10.1%) | 8,630 (89.9%) |
| 3 or 4 Unit Apartments | 8,615 (15.1%) | 48,563 (84.9%) |
| 5 to 9 Unit Apartments | 7,707 (12.6%) | 53,557 (87.4%) |
| 10 or more Apartments | 7,655 (6.5%) | 109,463 (93.5%) |
| Mobile Home / Other | 16,912 (64.3%) | 9,391 (35.7%) |
| Total | 474,912 (56.5%) | 365,914 (43.5%) |
Housing Structures by Number of Rooms in Area Code 702
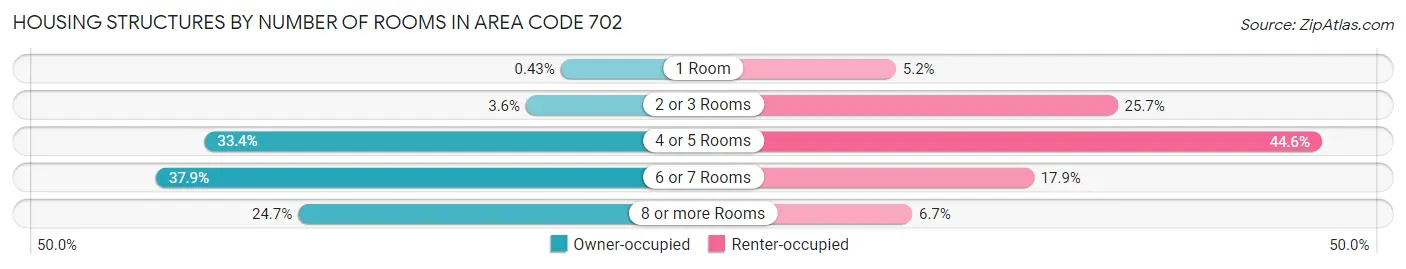
| Number of Rooms | Owner-occupied | Renter-occupied |
| 1 Room | 2,045 (0.4%) | 18,922 (5.2%) |
| 2 or 3 Rooms | 17,264 (3.6%) | 93,958 (25.7%) |
| 4 or 5 Rooms | 158,456 (33.4%) | 163,063 (44.6%) |
| 6 or 7 Rooms | 179,807 (37.9%) | 65,577 (17.9%) |
| 8 or more Rooms | 117,340 (24.7%) | 24,394 (6.7%) |
| Total | 474,912 (100.0%) | 365,914 (100.0%) |
Housing Structure by Heating Type in Area Code 702
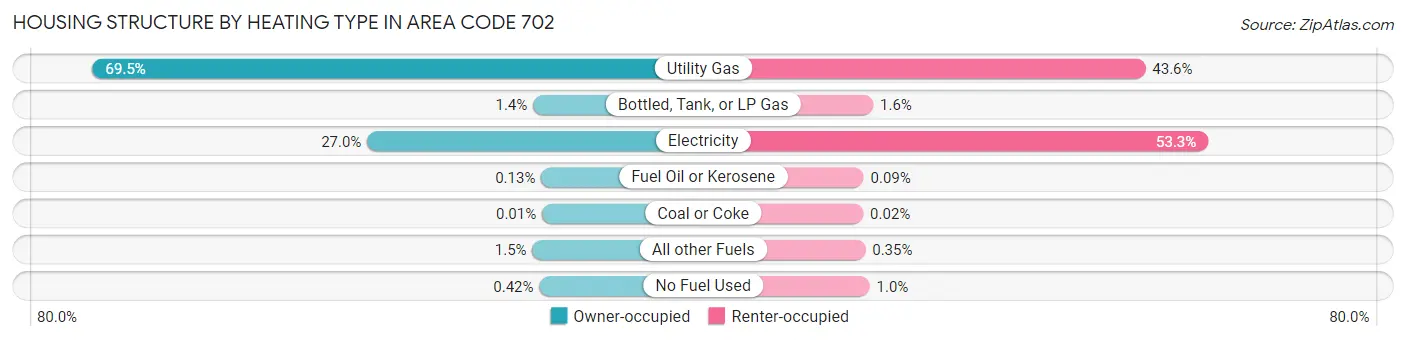
| Heating Type | Owner-occupied | Renter-occupied |
| Utility Gas | 330,102 (69.5%) | 159,682 (43.6%) |
| Bottled, Tank, or LP Gas | 6,603 (1.4%) | 5,678 (1.5%) |
| Electricity | 128,424 (27.0%) | 195,164 (53.3%) |
| Fuel Oil or Kerosene | 603 (0.1%) | 313 (0.1%) |
| Coal or Coke | 61 (0.0%) | 83 (0.0%) |
| All other Fuels | 7,114 (1.5%) | 1,296 (0.4%) |
| No Fuel Used | 2,005 (0.4%) | 3,698 (1.0%) |
| Total | 474,912 (100.0%) | 365,914 (100.0%) |
Household Vehicle Usage in Area Code 702
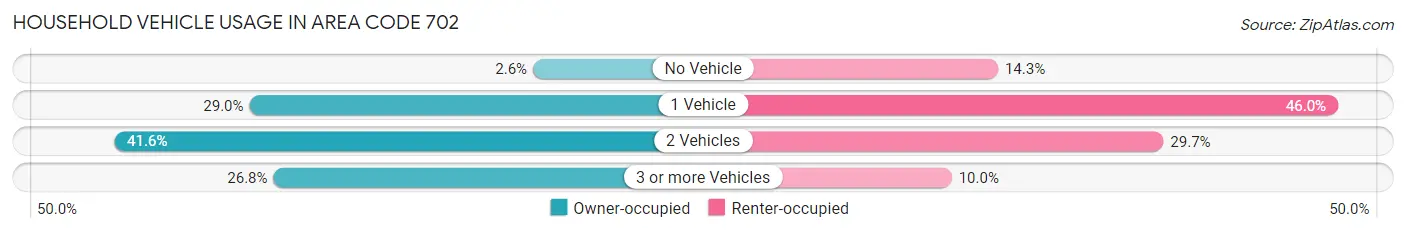
| Vehicles per Household | Owner-occupied | Renter-occupied |
| No Vehicle | 12,099 (2.5%) | 52,271 (14.3%) |
| 1 Vehicle | 137,843 (29.0%) | 168,388 (46.0%) |
| 2 Vehicles | 197,776 (41.6%) | 108,786 (29.7%) |
| 3 or more Vehicles | 127,194 (26.8%) | 36,469 (10.0%) |
| Total | 474,912 (100.0%) | 365,914 (100.0%) |
Real Estate & Mortgages in Area Code 702
Real Estate and Mortgage Overview in Area Code 702
| Characteristic | Without Mortgage | With Mortgage |
| Housing Units | 149,296 | 325,616 |
| Median Property Value | $25,509,900 | $26,702,500 |
| Median Household Income | $5,289,293 | $86,506 |
| Monthly Housing Costs | $37,594 | $31,880 |
| Real Estate Taxes | $137,077 | $11,111 |
Property Value by Mortgage Status in Area Code 702
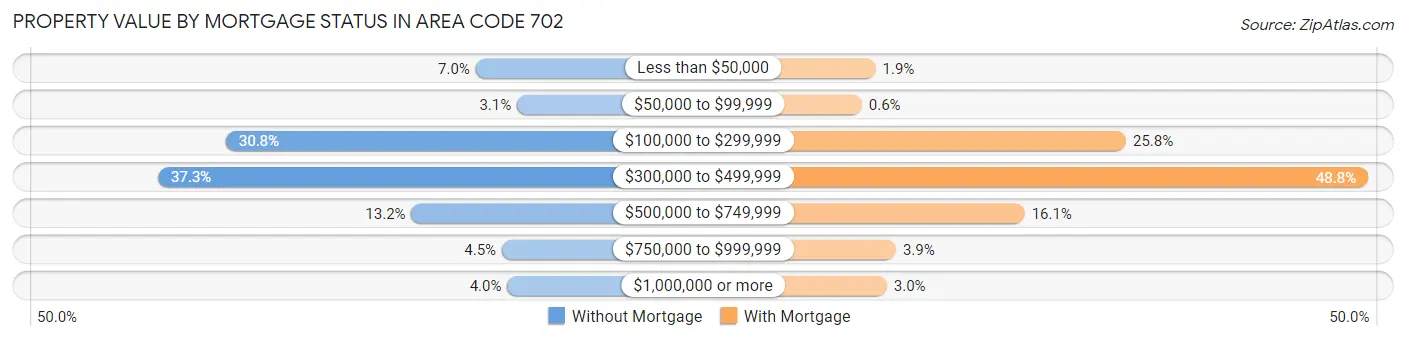
| Property Value | Without Mortgage | With Mortgage |
| Less than $50,000 | 10,513 (7.0%) | 6,219 (1.9%) |
| $50,000 to $99,999 | 4,630 (3.1%) | 1,955 (0.6%) |
| $100,000 to $299,999 | 46,023 (30.8%) | 83,864 (25.8%) |
| $300,000 to $499,999 | 55,685 (37.3%) | 158,900 (48.8%) |
| $500,000 to $749,999 | 19,650 (13.2%) | 52,443 (16.1%) |
| $750,000 to $999,999 | 6,775 (4.5%) | 12,536 (3.8%) |
| $1,000,000 or more | 6,020 (4.0%) | 9,699 (3.0%) |
| Total | 149,296 (100.0%) | 325,616 (100.0%) |
Household Income by Mortgage Status in Area Code 702
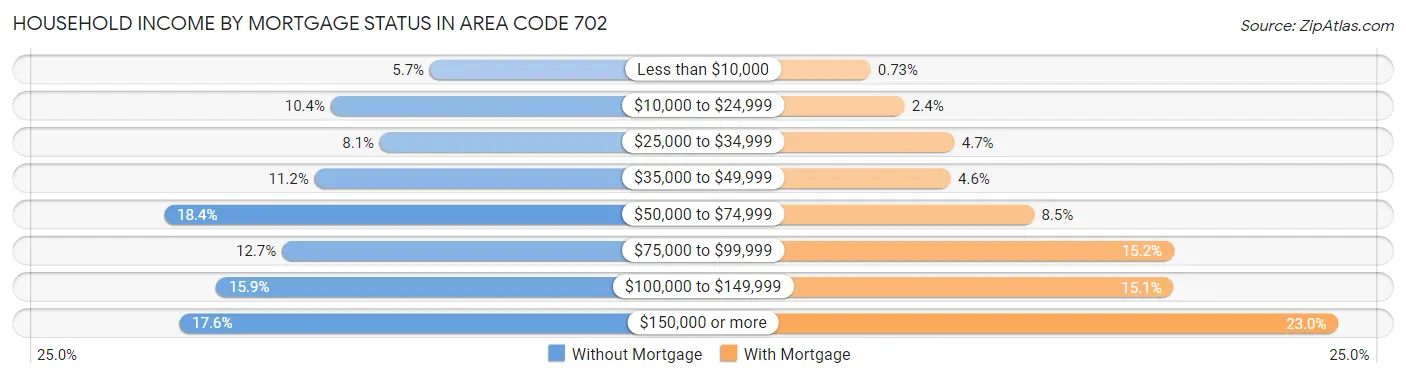
| Household Income | Without Mortgage | With Mortgage |
| Less than $10,000 | 8,508 (5.7%) | 2,370 (0.7%) |
| $10,000 to $24,999 | 15,557 (10.4%) | 7,648 (2.4%) |
| $25,000 to $34,999 | 12,063 (8.1%) | 15,386 (4.7%) |
| $35,000 to $49,999 | 16,710 (11.2%) | 14,828 (4.5%) |
| $50,000 to $74,999 | 27,408 (18.4%) | 27,742 (8.5%) |
| $75,000 to $99,999 | 19,018 (12.7%) | 49,363 (15.2%) |
| $100,000 to $149,999 | 23,702 (15.9%) | 49,290 (15.1%) |
| $150,000 or more | 26,330 (17.6%) | 74,853 (23.0%) |
| Total | 149,296 (100.0%) | 325,616 (100.0%) |
Property Value to Household Income Ratio in Area Code 702
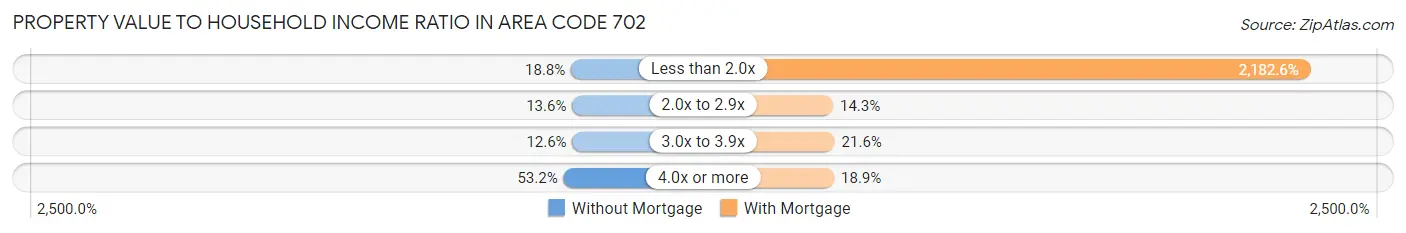
| Value-to-Income Ratio | Without Mortgage | With Mortgage |
| Less than 2.0x | 27,987 (18.8%) | 7,106,811 (2,182.6%) |
| 2.0x to 2.9x | 20,289 (13.6%) | 46,399 (14.2%) |
| 3.0x to 3.9x | 18,739 (12.6%) | 70,244 (21.6%) |
| 4.0x or more | 79,485 (53.2%) | 61,500 (18.9%) |
| Total | 149,296 (100.0%) | 325,616 (100.0%) |
Real Estate Taxes by Mortgage Status in Area Code 702
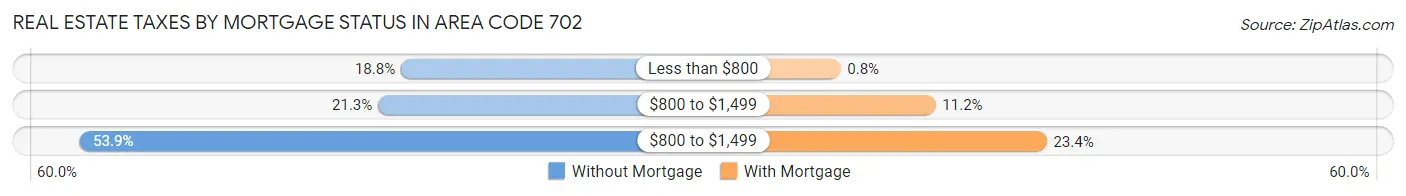
| Property Taxes | Without Mortgage | With Mortgage |
| Less than $800 | 27,999 (18.8%) | 2,606 (0.8%) |
| $800 to $1,499 | 31,736 (21.3%) | 36,526 (11.2%) |
| $800 to $1,499 | 80,486 (53.9%) | 76,156 (23.4%) |
| Total | 149,296 (100.0%) | 325,616 (100.0%) |
Health & Disability in Area Code 702
Health Insurance Coverage by Age in Area Code 702
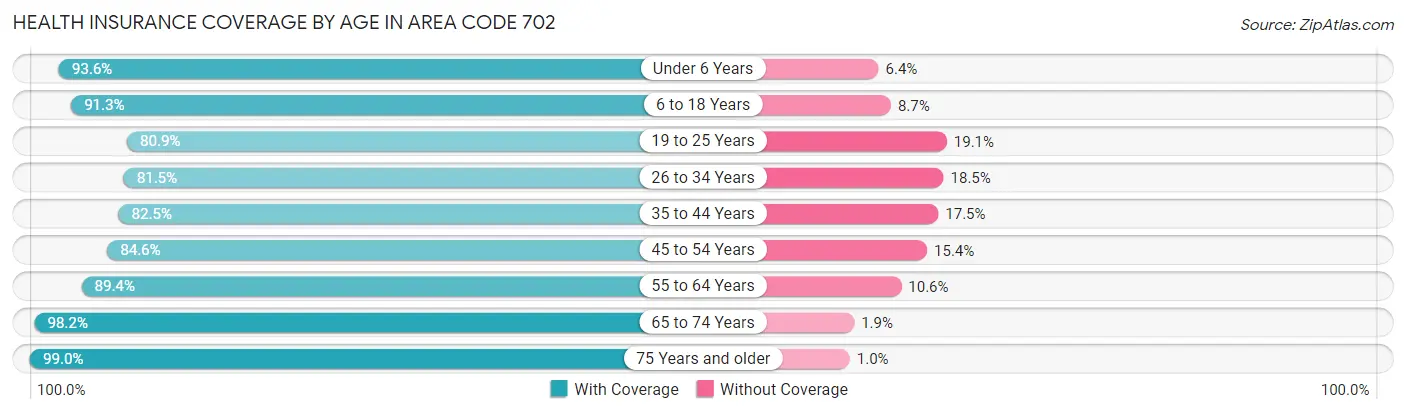
| Age Bracket | With Coverage | Without Coverage |
| Under 6 Years | 151,581 (93.6%) | 10,362 (6.4%) |
| 6 to 18 Years | 349,066 (91.3%) | 33,280 (8.7%) |
| 19 to 25 Years | 155,487 (80.9%) | 36,788 (19.1%) |
| 26 to 34 Years | 240,407 (81.5%) | 54,627 (18.5%) |
| 35 to 44 Years | 257,612 (82.5%) | 54,809 (17.5%) |
| 45 to 54 Years | 250,930 (84.6%) | 45,806 (15.4%) |
| 55 to 64 Years | 242,784 (89.4%) | 28,916 (10.6%) |
| 65 to 74 Years | 209,328 (98.2%) | 3,947 (1.8%) |
| 75 Years and older | 133,401 (99.0%) | 1,398 (1.0%) |
| Total | 1,990,596 (88.1%) | 269,933 (11.9%) |
Health Insurance Coverage by Citizenship Status in Area Code 702
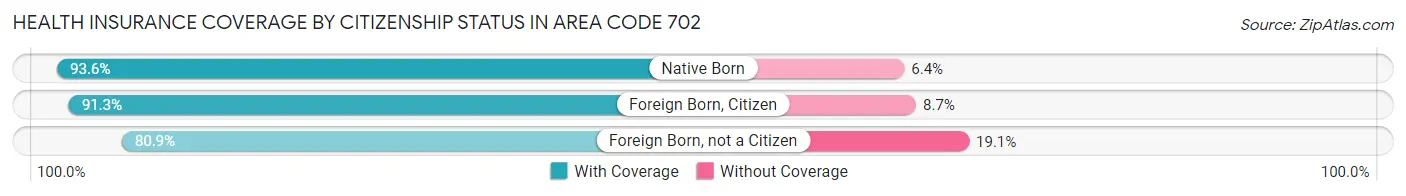
| Citizenship Status | With Coverage | Without Coverage |
| Native Born | 151,581 (93.6%) | 10,362 (6.4%) |
| Foreign Born, Citizen | 349,066 (91.3%) | 33,280 (8.7%) |
| Foreign Born, not a Citizen | 155,487 (80.9%) | 36,788 (19.1%) |
Health Insurance Coverage by Household Income in Area Code 702
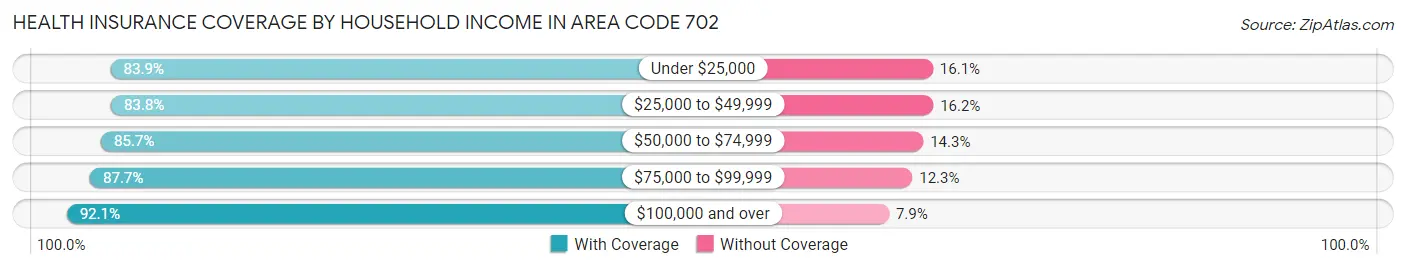
| Household Income | With Coverage | Without Coverage |
| Under $25,000 | 206,532 (83.9%) | 39,732 (16.1%) |
| $25,000 to $49,999 | 315,605 (83.8%) | 60,952 (16.2%) |
| $50,000 to $74,999 | 332,817 (85.7%) | 55,632 (14.3%) |
| $75,000 to $99,999 | 295,395 (87.7%) | 41,369 (12.3%) |
| $100,000 and over | 835,849 (92.1%) | 71,687 (7.9%) |
Public vs Private Health Insurance Coverage by Age in Area Code 702
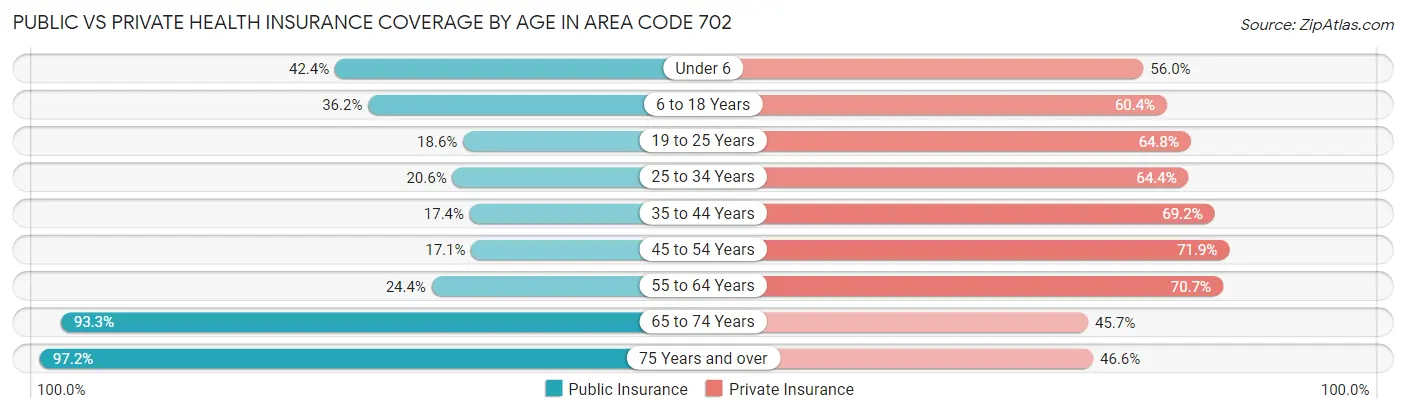
| Age Bracket | Public Insurance | Private Insurance |
| Under 6 | 68,610 (42.4%) | 90,663 (56.0%) |
| 6 to 18 Years | 138,476 (36.2%) | 230,761 (60.4%) |
| 19 to 25 Years | 35,768 (18.6%) | 124,532 (64.8%) |
| 25 to 34 Years | 60,707 (20.6%) | 189,928 (64.4%) |
| 35 to 44 Years | 54,219 (17.3%) | 216,098 (69.2%) |
| 45 to 54 Years | 50,698 (17.1%) | 213,340 (71.9%) |
| 55 to 64 Years | 66,394 (24.4%) | 192,184 (70.7%) |
| 65 to 74 Years | 198,953 (93.3%) | 97,483 (45.7%) |
| 75 Years and over | 130,954 (97.2%) | 62,854 (46.6%) |
| Total | 804,779 (35.6%) | 1,417,843 (62.7%) |
Disability Status by Sex by Age in Area Code 702
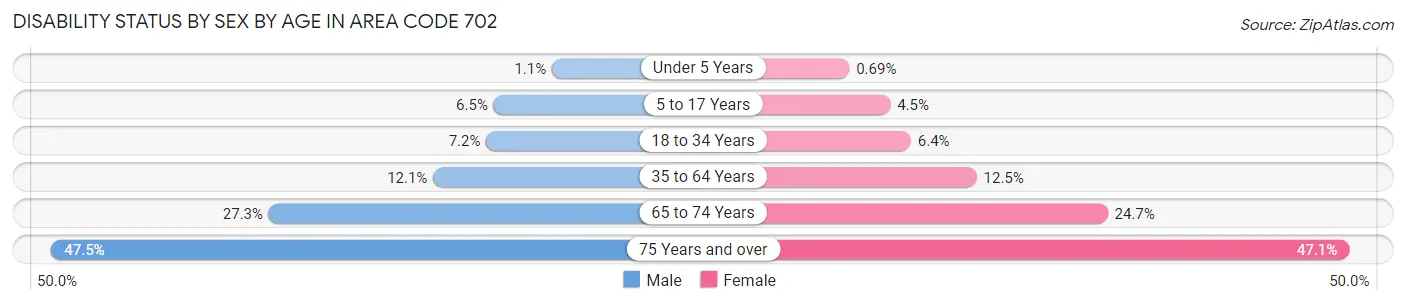
| Age Bracket | Male | Female |
| Under 5 Years | 719 (1.1%) | 453 (0.7%) |
| 5 to 17 Years | 12,641 (6.5%) | 8,425 (4.5%) |
| 18 to 34 Years | 18,470 (7.1%) | 16,416 (6.4%) |
| 35 to 64 Years | 53,544 (12.1%) | 54,740 (12.5%) |
| 65 to 74 Years | 27,706 (27.3%) | 27,589 (24.7%) |
| 75 Years and over | 29,067 (47.5%) | 34,657 (47.1%) |
Disability Class by Sex by Age in Area Code 702
Disability Class: Hearing Difficulty
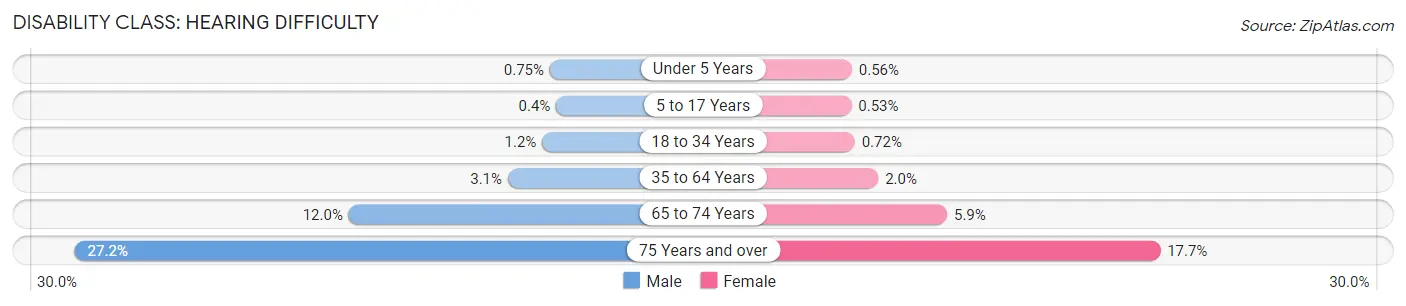
| Age Bracket | Male | Female |
| Under 5 Years | 509 (0.7%) | 368 (0.6%) |
| 5 to 17 Years | 782 (0.4%) | 986 (0.5%) |
| 18 to 34 Years | 3,043 (1.2%) | 1,855 (0.7%) |
| 35 to 64 Years | 13,679 (3.1%) | 8,895 (2.0%) |
| 65 to 74 Years | 12,116 (11.9%) | 6,554 (5.9%) |
| 75 Years and over | 16,647 (27.2%) | 13,052 (17.7%) |
Disability Class: Vision Difficulty
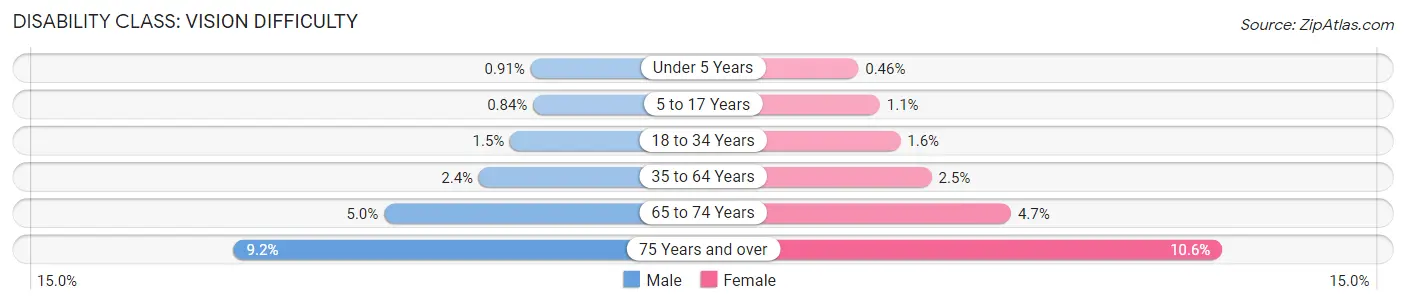
| Age Bracket | Male | Female |
| Under 5 Years | 619 (0.9%) | 299 (0.5%) |
| 5 to 17 Years | 1,639 (0.8%) | 1,988 (1.1%) |
| 18 to 34 Years | 3,827 (1.5%) | 4,164 (1.6%) |
| 35 to 64 Years | 10,410 (2.4%) | 10,947 (2.5%) |
| 65 to 74 Years | 5,058 (5.0%) | 5,266 (4.7%) |
| 75 Years and over | 5,615 (9.2%) | 7,797 (10.6%) |
Disability Class: Cognitive Difficulty
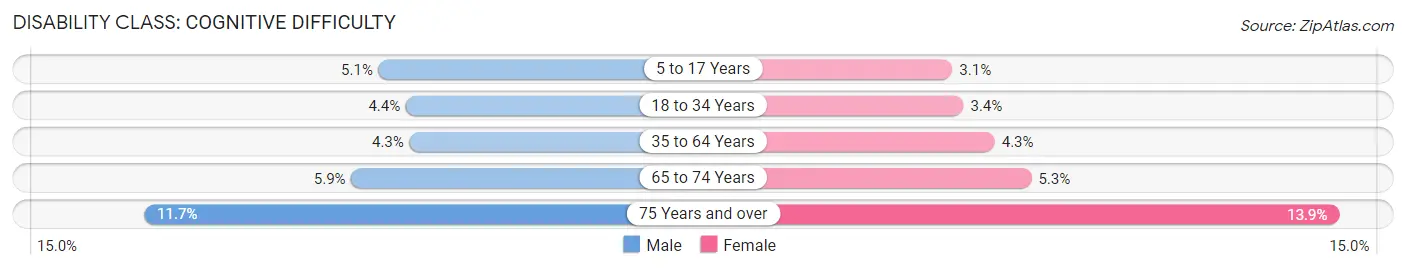
| Age Bracket | Male | Female |
| 5 to 17 Years | 10,069 (5.1%) | 5,788 (3.1%) |
| 18 to 34 Years | 11,320 (4.4%) | 8,683 (3.4%) |
| 35 to 64 Years | 18,992 (4.3%) | 18,660 (4.3%) |
| 65 to 74 Years | 5,980 (5.9%) | 5,906 (5.3%) |
| 75 Years and over | 7,140 (11.7%) | 10,198 (13.9%) |
Disability Class: Ambulatory Difficulty
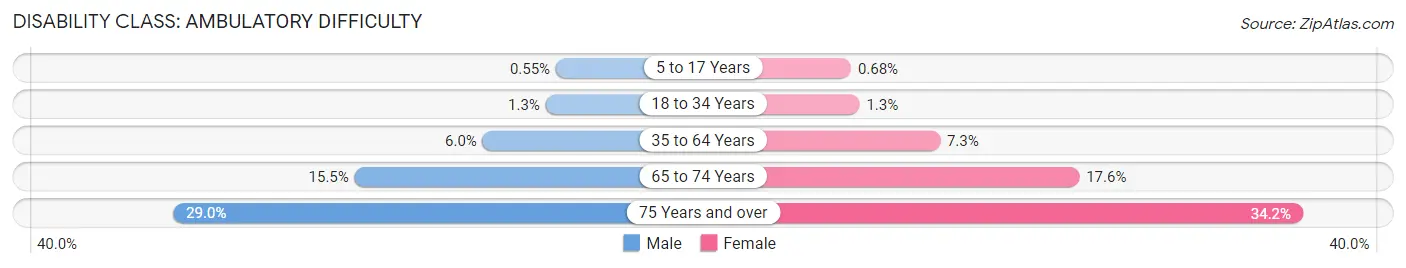
| Age Bracket | Male | Female |
| 5 to 17 Years | 1,067 (0.5%) | 1,271 (0.7%) |
| 18 to 34 Years | 3,390 (1.3%) | 3,342 (1.3%) |
| 35 to 64 Years | 26,563 (6.0%) | 31,902 (7.3%) |
| 65 to 74 Years | 15,716 (15.5%) | 19,727 (17.6%) |
| 75 Years and over | 17,724 (29.0%) | 25,199 (34.2%) |
Disability Class: Self-Care Difficulty
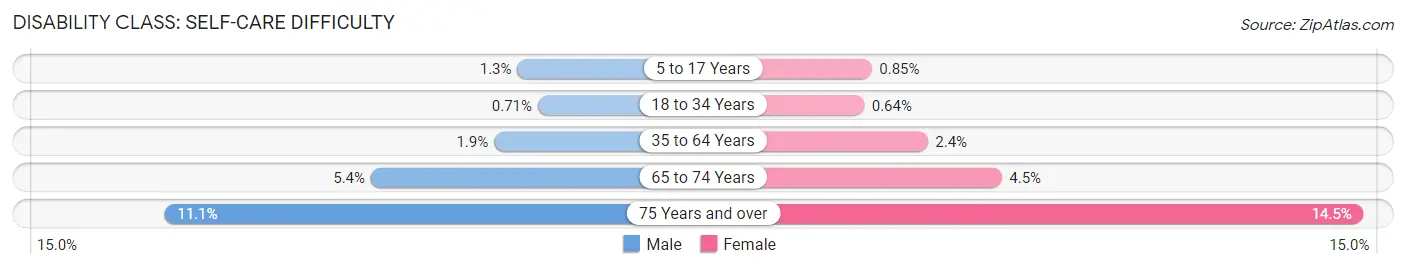
| Age Bracket | Male | Female |
| 5 to 17 Years | 2,503 (1.3%) | 1,594 (0.9%) |
| 18 to 34 Years | 1,836 (0.7%) | 1,641 (0.6%) |
| 35 to 64 Years | 8,555 (1.9%) | 10,563 (2.4%) |
| 65 to 74 Years | 5,436 (5.4%) | 5,002 (4.5%) |
| 75 Years and over | 6,797 (11.1%) | 10,696 (14.5%) |
Technology Access in Area Code 702
Computing Device Access in Area Code 702
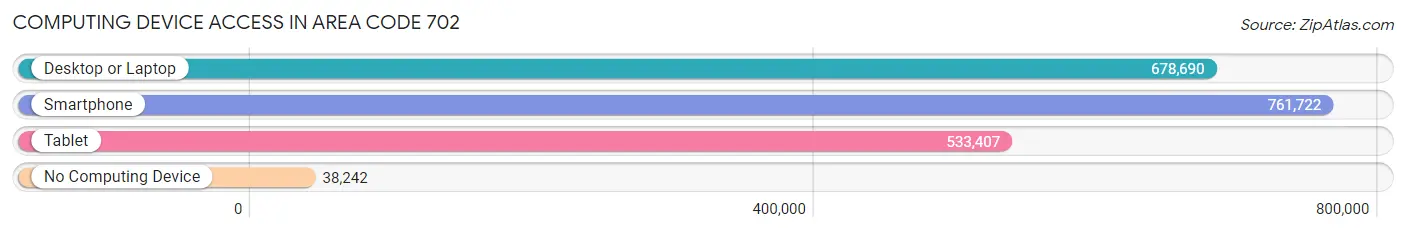
| Device Type | # Households | % Households |
| Desktop or Laptop | 678,690 | 80.7% |
| Smartphone | 761,722 | 90.6% |
| Tablet | 533,407 | 63.4% |
| No Computing Device | 38,242 | 4.5% |
| Total | 840,826 | 100.0% |
Internet Access in Area Code 702
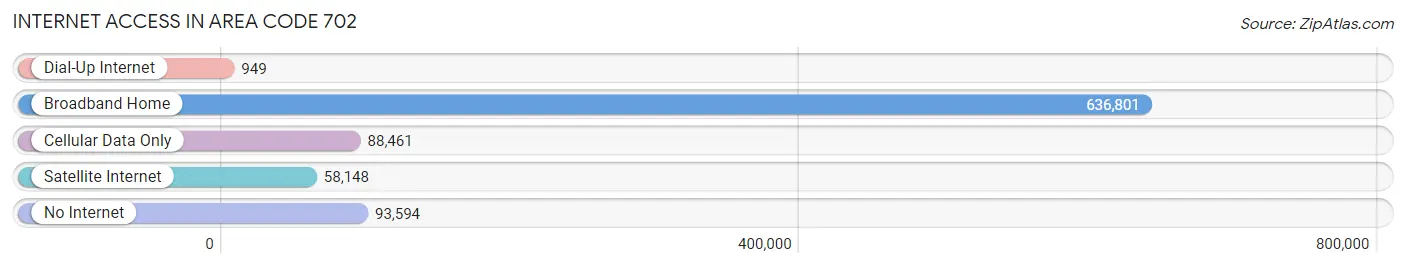
| Internet Type | # Households | % Households |
| Dial-Up Internet | 949 | 0.1% |
| Broadband Home | 636,801 | 75.7% |
| Cellular Data Only | 88,461 | 10.5% |
| Satellite Internet | 58,148 | 6.9% |
| No Internet | 93,594 | 11.1% |
| Total | 840,826 | 100.0% |
Area Code 702 Summary
Geography
Area code 702 is located in the state of Nevada and covers the Las Vegas metropolitan area. It is bordered by area codes 442 and 760 to the east, 775 to the north, and 928 to the west.
Social
Area code 702 is home to the world-famous Las Vegas Strip, which is known for its vibrant nightlife, entertainment, and gambling. The area is also home to a variety of cultural attractions, including the Las Vegas Natural History Museum, the Mob Museum, and the Neon Museum.
Economics
Area code 702 is a major economic hub in the state of Nevada. It is home to a variety of businesses, including casinos, hotels, restaurants, and retail stores. The area is also home to a number of major corporations, such as MGM Resorts International, Caesars Entertainment, and Wynn Resorts.
Demographics
Area code 702 is home to a diverse population. According to the U.S. Census Bureau, the population of the area is approximately 2.2 million people. The population is made up of a variety of ethnicities, including White (54.3%), Hispanic or Latino (25.2%), African American (9.2%), and Asian (7.2%).
Common Questions
What is Per Capita Income in Area Code 702?
Per Capita income in Area Code 702 is $39,112.
What is the Median Family Income in Area Code 702?
Median Family Income in Area Code 702 is $87,218.
What is the Median Household income in Area Code 702?
Median Household Income in Area Code 702 is $75,399.
What is Income or Wage Gap in Area Code 702?
Income or Wage Gap in Area Code 702 is 22.5%.
Women in Area Code 702 earn 77.5 cents for every dollar earned by a man.
What is Family Income Deficit in Area Code 702?
Family Income Deficit in Area Code 702 is $11,099.
Families that are below poverty line in Area Code 702 earn $11,099 less on average than the poverty threshold level.
What is Inequality or Gini Index in Area Code 702?
Inequality or Gini Index in Area Code 702 is 33.14.
What is the Total Population of Area Code 702?
Total Population of Area Code 702 is 2,285,657.
What is the Total Male Population of Area Code 702?
Total Male Population of Area Code 702 is 1,147,650.
What is the Total Female Population of Area Code 702?
Total Female Population of Area Code 702 is 1,138,007.
What is the Ratio of Males per 100 Females in Area Code 702?
There are 100.85 Males per 100 Females in Area Code 702.
What is the Ratio of Females per 100 Males in Area Code 702?
There are 99.16 Females per 100 Males in Area Code 702.
What is the Median Population Age in Area Code 702?
Median Population Age in Area Code 702 is 41.1 Years.
What is the Average Family Size in Area Code 702
Average Family Size in Area Code 702 is 3.2 People.
What is the Average Household Size in Area Code 702
Average Household Size in Area Code 702 is 2.6 People.
How Large is the Labor Force in Area Code 702?
There are 1,093,345 People in the Labor Forcein in Area Code 702.
What is the Percentage of People in the Labor Force in Area Code 702?
59.8% of People are in the Labor Force in Area Code 702.
What is the Unemployment Rate in Area Code 702?
Unemployment Rate in Area Code 702 is 8.2%.