Bergman, AR Map & Demographics
Bergman Map
Bergman Overview
$23,267
PER CAPITA INCOME
$66,071
AVG FAMILY INCOME
$58,977
AVG HOUSEHOLD INCOME
18.2%
WAGE / INCOME GAP [ % ]
81.8¢/ $1
WAGE / INCOME GAP [ $ ]
0.33
INEQUALITY / GINI INDEX
634
TOTAL POPULATION
320
MALE POPULATION
314
FEMALE POPULATION
101.91
MALES / 100 FEMALES
98.12
FEMALES / 100 MALES
35.3
MEDIAN AGE
3.4
AVG FAMILY SIZE
3.1
AVG HOUSEHOLD SIZE
315
LABOR FORCE [ PEOPLE ]
66.9%
PERCENT IN LABOR FORCE
1.0%
UNEMPLOYMENT RATE
Bergman Zip Codes
Bergman Area Codes
Income in Bergman
Income Overview in Bergman
Per Capita Income in Bergman is $23,267, while median incomes of families and households are $66,071 and $58,977 respectively.
| Characteristic | Number | Measure |
| Per Capita Income | 634 | $23,267 |
| Median Family Income | 164 | $66,071 |
| Mean Family Income | 164 | $72,313 |
| Median Household Income | 204 | $58,977 |
| Mean Household Income | 204 | $64,245 |
| Income Deficit | 164 | $0 |
| Wage / Income Gap (%) | 634 | 18.22% |
| Wage / Income Gap ($) | 634 | 81.78¢ per $1 |
| Gini / Inequality Index | 634 | 0.33 |
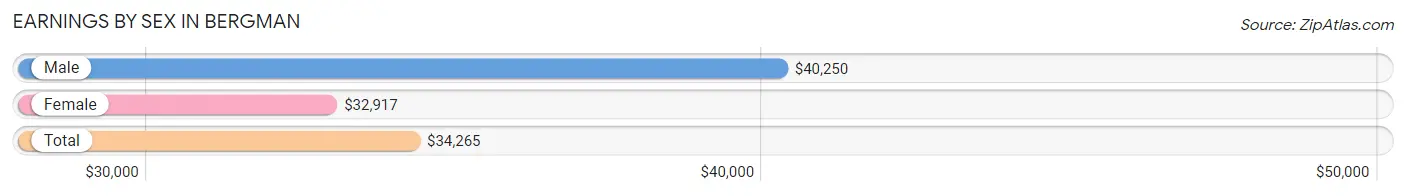
Earnings by Sex in Bergman
Average Earnings in Bergman are $34,265, $40,250 for men and $32,917 for women, a difference of 18.2%.
| Sex | Number | Average Earnings |
| Male | 145 (44.8%) | $40,250 |
| Female | 179 (55.2%) | $32,917 |
| Total | 324 (100.0%) | $34,265 |
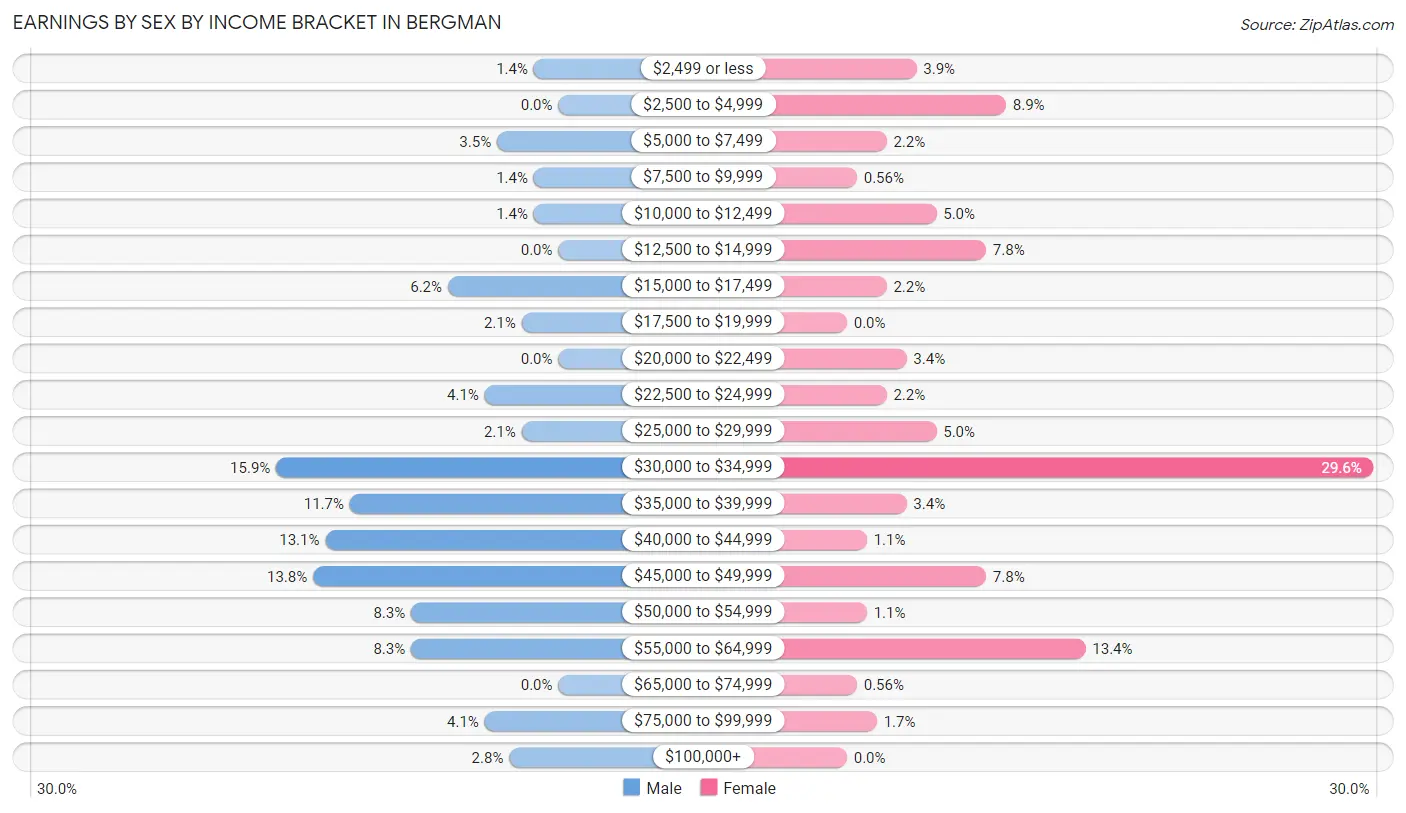
Earnings by Sex by Income Bracket in Bergman
The most common earnings brackets in Bergman are $30,000 to $34,999 for men (23 | 15.9%) and $30,000 to $34,999 for women (53 | 29.6%).
| Income | Male | Female |
| $2,499 or less | 2 (1.4%) | 7 (3.9%) |
| $2,500 to $4,999 | 0 (0.0%) | 16 (8.9%) |
| $5,000 to $7,499 | 5 (3.5%) | 4 (2.2%) |
| $7,500 to $9,999 | 2 (1.4%) | 1 (0.6%) |
| $10,000 to $12,499 | 2 (1.4%) | 9 (5.0%) |
| $12,500 to $14,999 | 0 (0.0%) | 14 (7.8%) |
| $15,000 to $17,499 | 9 (6.2%) | 4 (2.2%) |
| $17,500 to $19,999 | 3 (2.1%) | 0 (0.0%) |
| $20,000 to $22,499 | 0 (0.0%) | 6 (3.4%) |
| $22,500 to $24,999 | 6 (4.1%) | 4 (2.2%) |
| $25,000 to $29,999 | 3 (2.1%) | 9 (5.0%) |
| $30,000 to $34,999 | 23 (15.9%) | 53 (29.6%) |
| $35,000 to $39,999 | 17 (11.7%) | 6 (3.4%) |
| $40,000 to $44,999 | 19 (13.1%) | 2 (1.1%) |
| $45,000 to $49,999 | 20 (13.8%) | 14 (7.8%) |
| $50,000 to $54,999 | 12 (8.3%) | 2 (1.1%) |
| $55,000 to $64,999 | 12 (8.3%) | 24 (13.4%) |
| $65,000 to $74,999 | 0 (0.0%) | 1 (0.6%) |
| $75,000 to $99,999 | 6 (4.1%) | 3 (1.7%) |
| $100,000+ | 4 (2.8%) | 0 (0.0%) |
| Total | 145 (100.0%) | 179 (100.0%) |
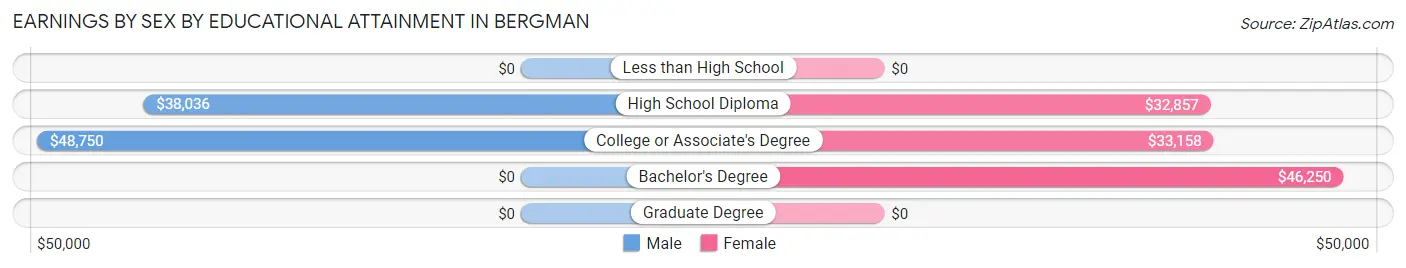
Earnings by Sex by Educational Attainment in Bergman
Average earnings in Bergman are $42,768 for men and $33,306 for women, a difference of 22.1%. Men with an educational attainment of college or associate's degree enjoy the highest average annual earnings of $48,750, while those with high school diploma education earn the least with $38,036. Women with an educational attainment of bachelor's degree earn the most with the average annual earnings of $46,250, while those with high school diploma education have the smallest earnings of $32,857.
| Educational Attainment | Male Income | Female Income |
| Less than High School | - | - |
| High School Diploma | $38,036 | $32,857 |
| College or Associate's Degree | $48,750 | $33,158 |
| Bachelor's Degree | - | - |
| Graduate Degree | - | - |
| Total | $42,768 | $33,306 |
Family Income in Bergman
Family Income Brackets in Bergman
According to the Bergman family income data, there are 64 families falling into the $50,000 to $74,999 income range, which is the most common income bracket and makes up 39.0% of all families.
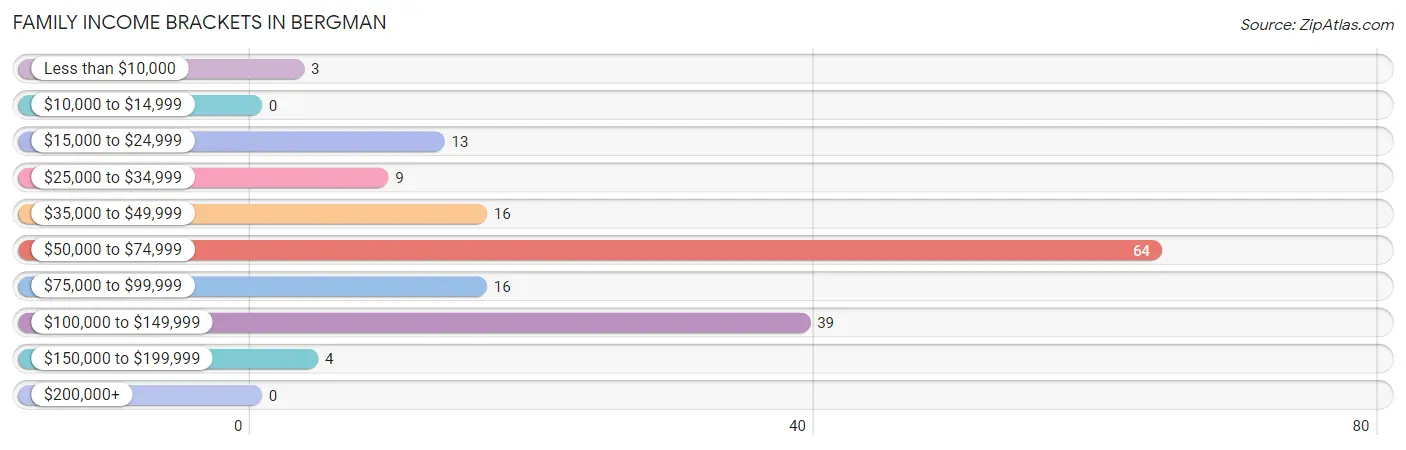
| Income Bracket | # Families | % Families |
| Less than $10,000 | 3 | 1.8% |
| $10,000 to $14,999 | 0 | 0.0% |
| $15,000 to $24,999 | 13 | 7.9% |
| $25,000 to $34,999 | 9 | 5.5% |
| $35,000 to $49,999 | 16 | 9.8% |
| $50,000 to $74,999 | 64 | 39.0% |
| $75,000 to $99,999 | 16 | 9.8% |
| $100,000 to $149,999 | 39 | 23.8% |
| $150,000 to $199,999 | 4 | 2.4% |
| $200,000+ | 0 | 0.0% |
Family Income by Famaliy Size in Bergman
3-person families (67 | 40.8%) account for the highest median family income in Bergman with $80,208 per family, while 2-person families (52 | 31.7%) have the highest median income of $28,750 per family member.
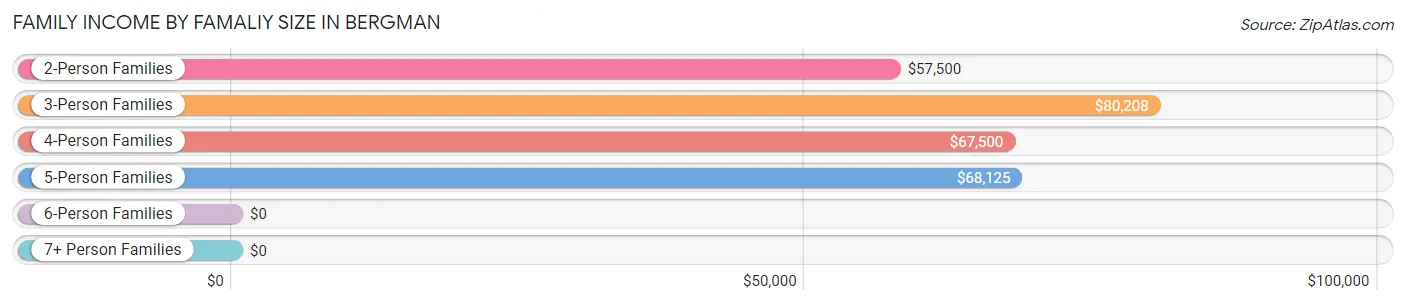
| Income Bracket | # Families | Median Income |
| 2-Person Families | 52 (31.7%) | $57,500 |
| 3-Person Families | 67 (40.8%) | $80,208 |
| 4-Person Families | 22 (13.4%) | $67,500 |
| 5-Person Families | 19 (11.6%) | $68,125 |
| 6-Person Families | 4 (2.4%) | $0 |
| 7+ Person Families | 0 (0.0%) | $0 |
| Total | 164 (100.0%) | $66,071 |
Family Income by Number of Earners in Bergman
The median family income in Bergman is $66,071, with families comprising 3+ earners (18) having the highest median family income of $81,667, while families with no earners (23) have the lowest median family income of $43,750, accounting for 11.0% and 14.0% of families, respectively.
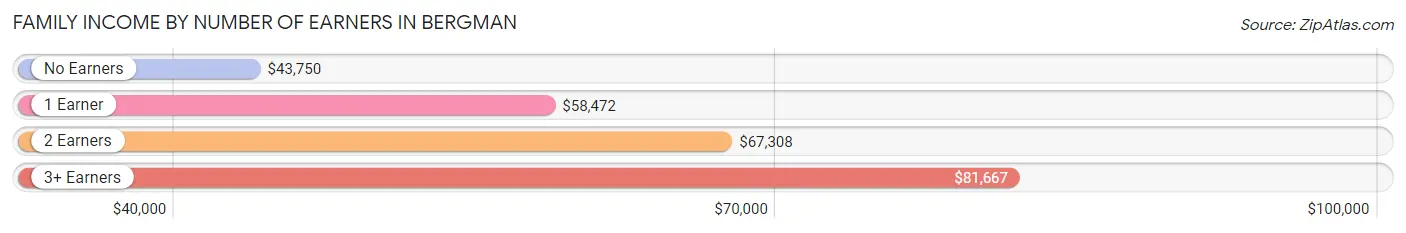
| Number of Earners | # Families | Median Income |
| No Earners | 23 (14.0%) | $43,750 |
| 1 Earner | 39 (23.8%) | $58,472 |
| 2 Earners | 84 (51.2%) | $67,308 |
| 3+ Earners | 18 (11.0%) | $81,667 |
| Total | 164 (100.0%) | $66,071 |
Household Income in Bergman
Household Income Brackets in Bergman
With 66 households falling in the category, the $50,000 to $74,999 income range is the most frequent in Bergman, accounting for 32.4% of all households.
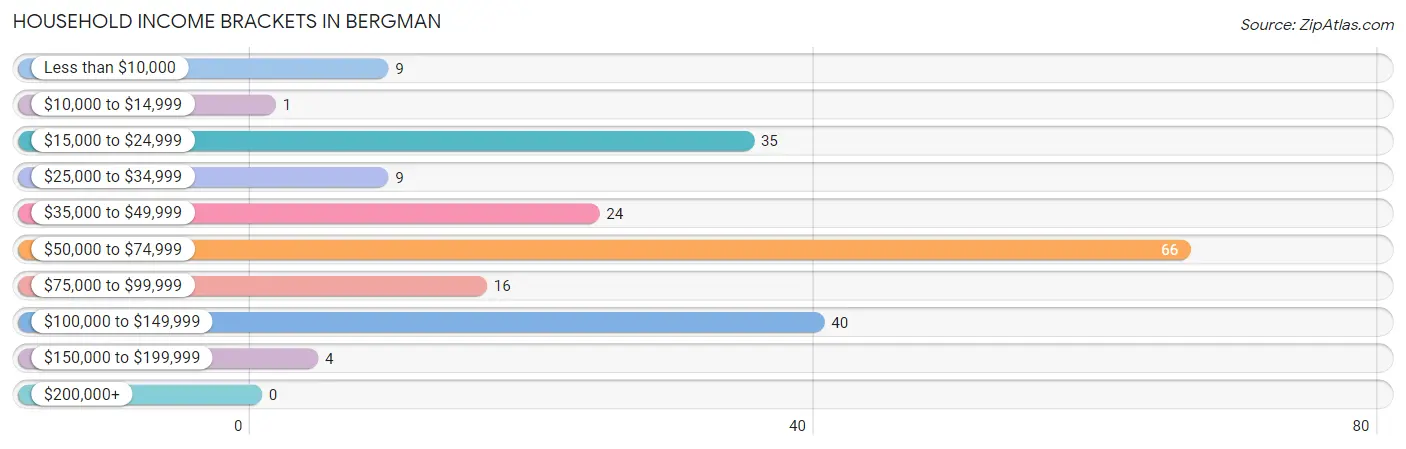
| Income Bracket | # Households | % Households |
| Less than $10,000 | 9 | 4.4% |
| $10,000 to $14,999 | 1 | 0.5% |
| $15,000 to $24,999 | 35 | 17.2% |
| $25,000 to $34,999 | 9 | 4.4% |
| $35,000 to $49,999 | 24 | 11.8% |
| $50,000 to $74,999 | 66 | 32.4% |
| $75,000 to $99,999 | 16 | 7.8% |
| $100,000 to $149,999 | 40 | 19.6% |
| $150,000 to $199,999 | 4 | 2.0% |
| $200,000+ | 0 | 0.0% |
Household Income by Householder Age in Bergman
The median household income in Bergman is $58,977, with the highest median household income of $66,875 found in the 45 to 64 years age bracket for the primary householder. A total of 87 households (42.6%) fall into this category.
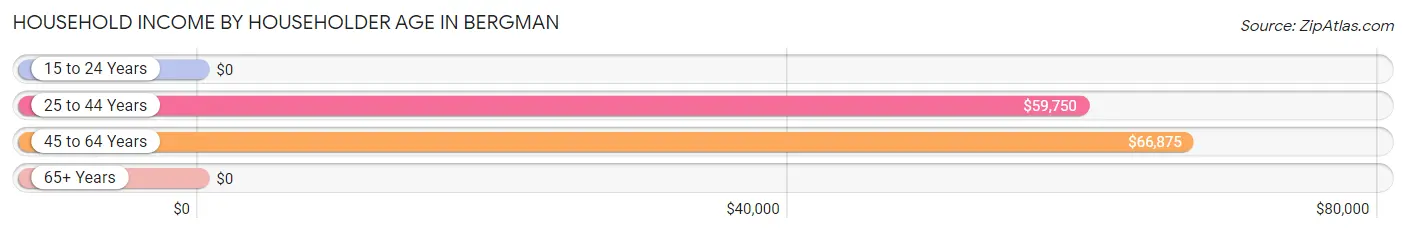
| Income Bracket | # Households | Median Income |
| 15 to 24 Years | 0 (0.0%) | $0 |
| 25 to 44 Years | 51 (25.0%) | $59,750 |
| 45 to 64 Years | 87 (42.6%) | $66,875 |
| 65+ Years | 66 (32.4%) | $0 |
| Total | 204 (100.0%) | $58,977 |
Poverty in Bergman
Income Below Poverty by Sex and Age in Bergman
With 7.1% poverty level for males and 11.0% for females among the residents of Bergman, under 5 year old males and 25 to 34 year old females are the most vulnerable to poverty, with 4 males (23.5%) and 18 females (34.6%) in their respective age groups living below the poverty level.
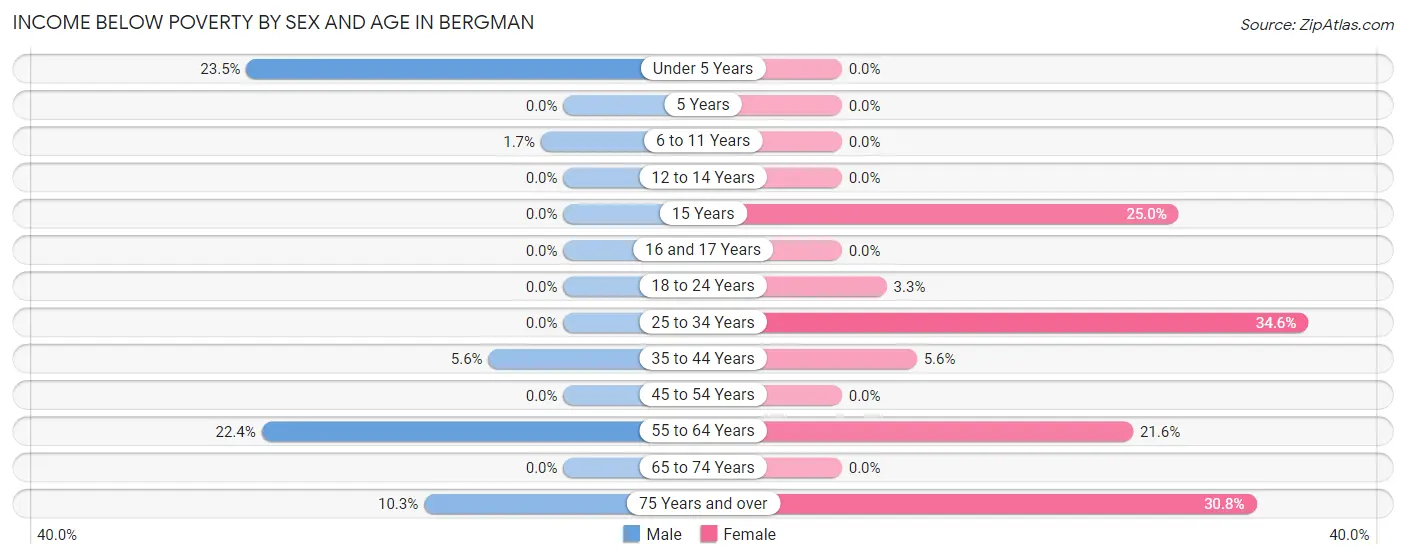
| Age Bracket | Male | Female |
| Under 5 Years | 4 (23.5%) | 0 (0.0%) |
| 5 Years | 0 (0.0%) | 0 (0.0%) |
| 6 to 11 Years | 1 (1.7%) | 0 (0.0%) |
| 12 to 14 Years | 0 (0.0%) | 0 (0.0%) |
| 15 Years | 0 (0.0%) | 2 (25.0%) |
| 16 and 17 Years | 0 (0.0%) | 0 (0.0%) |
| 18 to 24 Years | 0 (0.0%) | 1 (3.3%) |
| 25 to 34 Years | 0 (0.0%) | 18 (34.6%) |
| 35 to 44 Years | 1 (5.6%) | 1 (5.6%) |
| 45 to 54 Years | 0 (0.0%) | 0 (0.0%) |
| 55 to 64 Years | 13 (22.4%) | 8 (21.6%) |
| 65 to 74 Years | 0 (0.0%) | 0 (0.0%) |
| 75 Years and over | 3 (10.3%) | 4 (30.8%) |
| Total | 22 (7.1%) | 34 (11.0%) |
Income Above Poverty by Sex and Age in Bergman
According to the poverty statistics in Bergman, males aged 5 years and females aged under 5 years are the age groups that are most secure financially, with 100.0% of males and 100.0% of females in these age groups living above the poverty line.
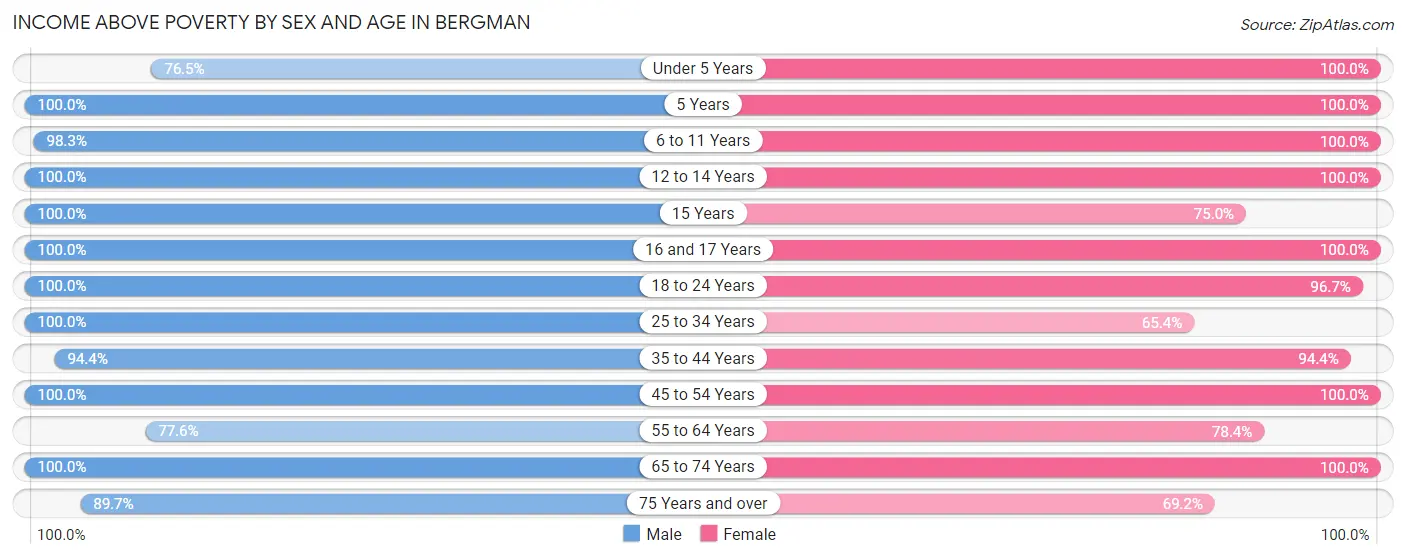
| Age Bracket | Male | Female |
| Under 5 Years | 13 (76.5%) | 13 (100.0%) |
| 5 Years | 3 (100.0%) | 2 (100.0%) |
| 6 to 11 Years | 59 (98.3%) | 26 (100.0%) |
| 12 to 14 Years | 4 (100.0%) | 12 (100.0%) |
| 15 Years | 2 (100.0%) | 6 (75.0%) |
| 16 and 17 Years | 4 (100.0%) | 7 (100.0%) |
| 18 to 24 Years | 18 (100.0%) | 29 (96.7%) |
| 25 to 34 Years | 42 (100.0%) | 34 (65.4%) |
| 35 to 44 Years | 17 (94.4%) | 17 (94.4%) |
| 45 to 54 Years | 35 (100.0%) | 64 (100.0%) |
| 55 to 64 Years | 45 (77.6%) | 29 (78.4%) |
| 65 to 74 Years | 18 (100.0%) | 28 (100.0%) |
| 75 Years and over | 26 (89.7%) | 9 (69.2%) |
| Total | 286 (92.9%) | 276 (89.0%) |
Income Below Poverty Among Married-Couple Families in Bergman
The poverty statistics for married-couple families in Bergman show that 5.5% or 7 of the total 128 families live below the poverty line. Families with 1 or 2 children have the highest poverty rate of 7.3%, comprising of 4 families. On the other hand, families with 3 or 4 children have the lowest poverty rate of 0.0%, which includes 0 families.
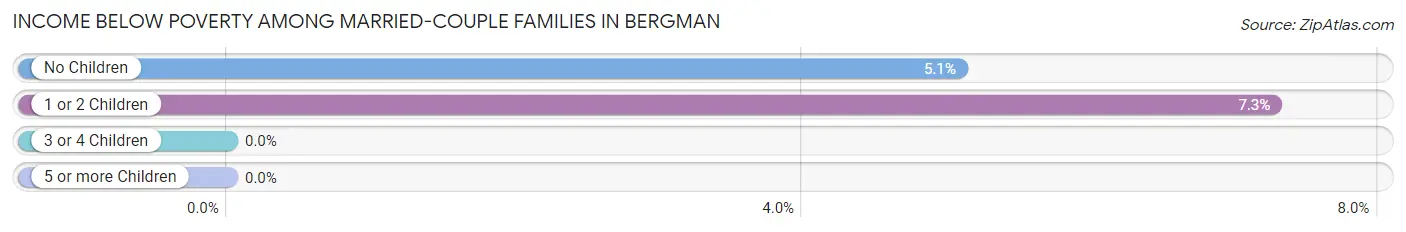
| Children | Above Poverty | Below Poverty |
| No Children | 56 (94.9%) | 3 (5.1%) |
| 1 or 2 Children | 51 (92.7%) | 4 (7.3%) |
| 3 or 4 Children | 14 (100.0%) | 0 (0.0%) |
| 5 or more Children | 0 (0.0%) | 0 (0.0%) |
| Total | 121 (94.5%) | 7 (5.5%) |
Income Below Poverty Among Single-Parent Households in Bergman
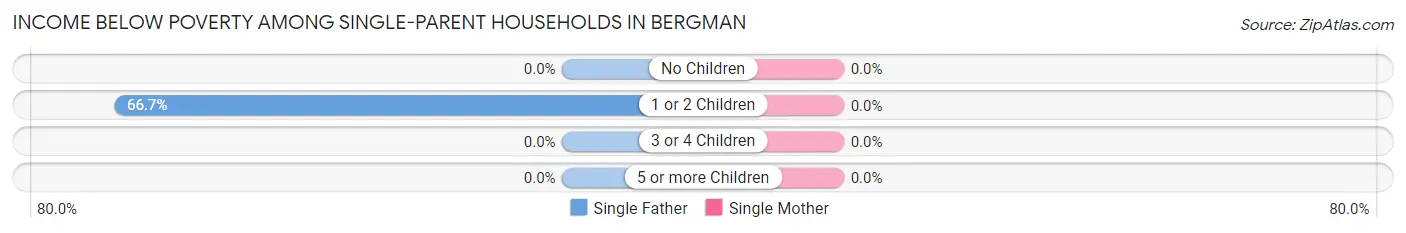
| Children | Single Father | Single Mother |
| No Children | 0 (0.0%) | 0 (0.0%) |
| 1 or 2 Children | 6 (66.7%) | 0 (0.0%) |
| 3 or 4 Children | 0 (0.0%) | 0 (0.0%) |
| 5 or more Children | 0 (0.0%) | 0 (0.0%) |
| Total | 6 (60.0%) | 0 (0.0%) |
Income Below Poverty Among Married-Couple vs Single-Parent Households in Bergman
The poverty data for Bergman shows that 7 of the married-couple family households (5.5%) and 6 of the single-parent households (16.7%) are living below the poverty level. Within the married-couple family households, those with 1 or 2 children have the highest poverty rate, with 4 households (7.3%) falling below the poverty line. Among the single-parent households, those with 1 or 2 children have the highest poverty rate, with 6 household (35.3%) living below poverty.
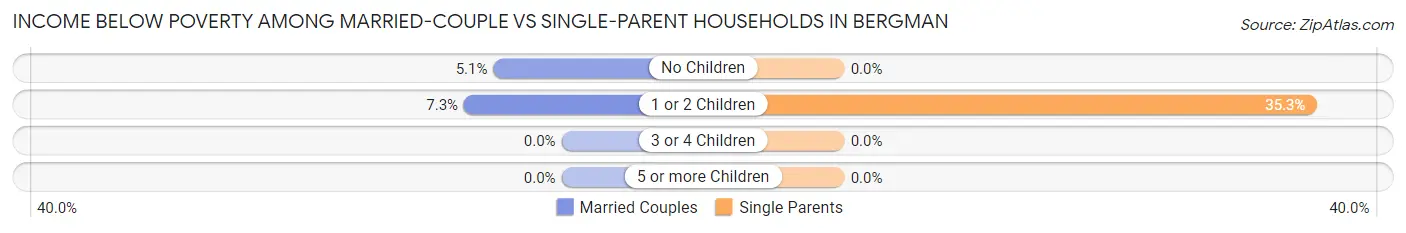
| Children | Married-Couple Families | Single-Parent Households |
| No Children | 3 (5.1%) | 0 (0.0%) |
| 1 or 2 Children | 4 (7.3%) | 6 (35.3%) |
| 3 or 4 Children | 0 (0.0%) | 0 (0.0%) |
| 5 or more Children | 0 (0.0%) | 0 (0.0%) |
| Total | 7 (5.5%) | 6 (16.7%) |
Race in Bergman
The most populous races in Bergman are White / Caucasian (579 | 91.3%), Asian (30 | 4.7%), and Two or more Races (13 | 2.1%).
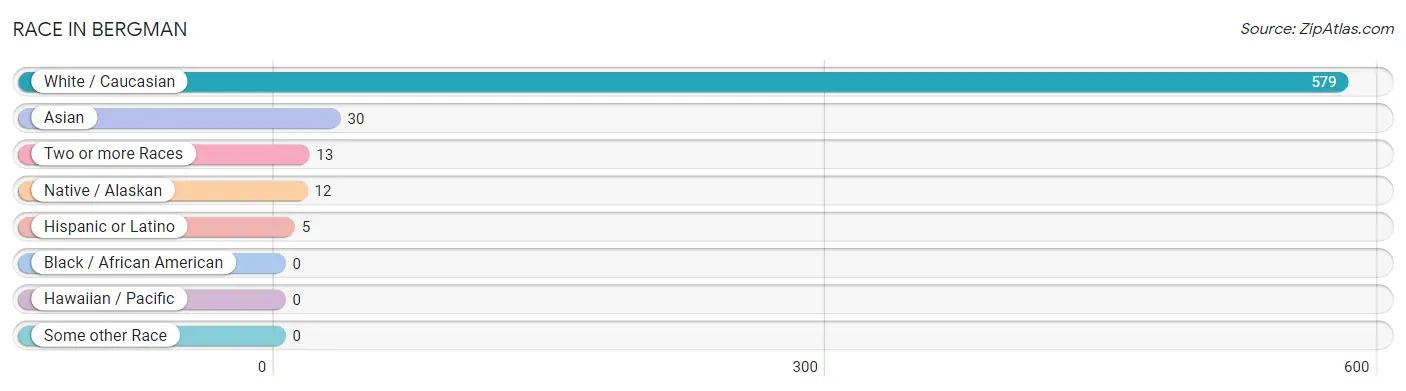
| Race | # Population | % Population |
| Asian | 30 | 4.7% |
| Black / African American | 0 | 0.0% |
| Hawaiian / Pacific | 0 | 0.0% |
| Hispanic or Latino | 5 | 0.8% |
| Native / Alaskan | 12 | 1.9% |
| White / Caucasian | 579 | 91.3% |
| Two or more Races | 13 | 2.1% |
| Some other Race | 0 | 0.0% |
| Total | 634 | 100.0% |
Ancestry in Bergman
The most populous ancestries reported in Bergman are Irish (114 | 18.0%), German (89 | 14.0%), English (74 | 11.7%), Scotch-Irish (52 | 8.2%), and American (45 | 7.1%), together accounting for 59.0% of all Bergman residents.
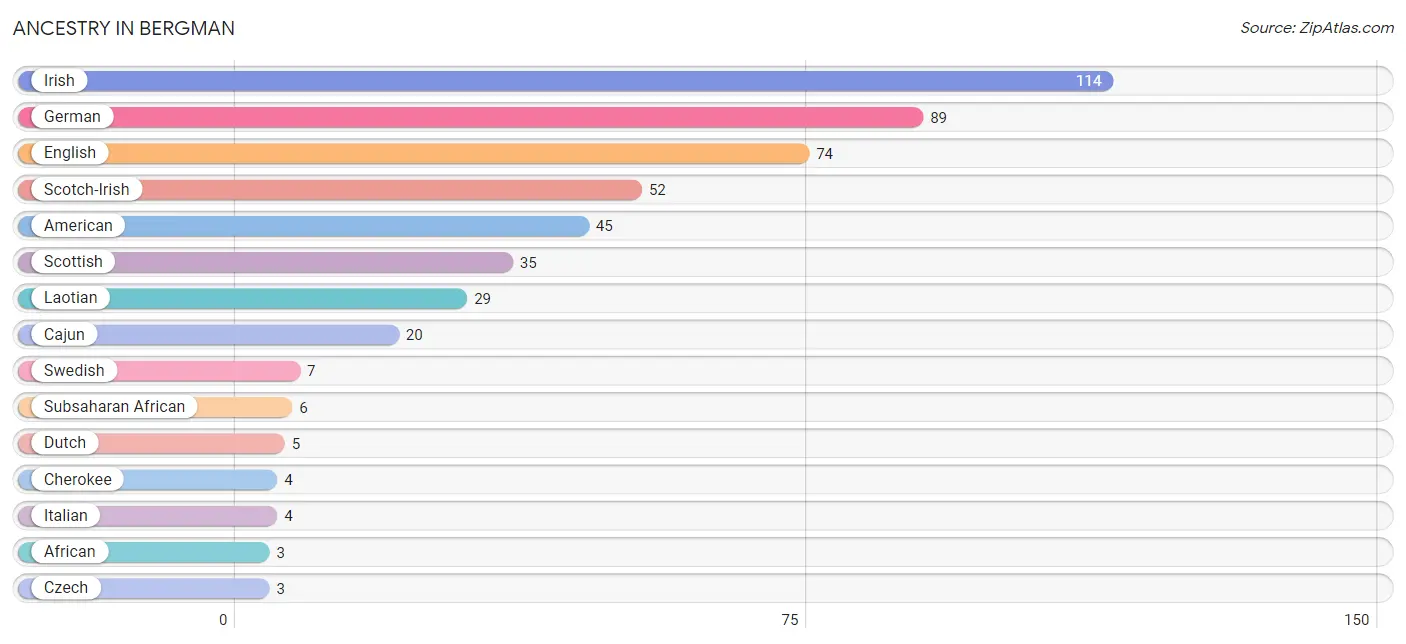
| Ancestry | # Population | % Population |
| African | 3 | 0.5% |
| American | 45 | 7.1% |
| Brazilian | 1 | 0.2% |
| Cajun | 20 | 3.2% |
| Cherokee | 4 | 0.6% |
| Czech | 3 | 0.5% |
| Dutch | 5 | 0.8% |
| English | 74 | 11.7% |
| German | 89 | 14.0% |
| Irish | 114 | 18.0% |
| Italian | 4 | 0.6% |
| Korean | 1 | 0.2% |
| Laotian | 29 | 4.6% |
| Nigerian | 3 | 0.5% |
| Polish | 2 | 0.3% |
| Puerto Rican | 2 | 0.3% |
| Russian | 1 | 0.2% |
| Scotch-Irish | 52 | 8.2% |
| Scottish | 35 | 5.5% |
| Slovak | 1 | 0.2% |
| Spanish | 3 | 0.5% |
| Subsaharan African | 6 | 0.9% |
| Swedish | 7 | 1.1% | View All 23 Rows |
Immigrants in Bergman
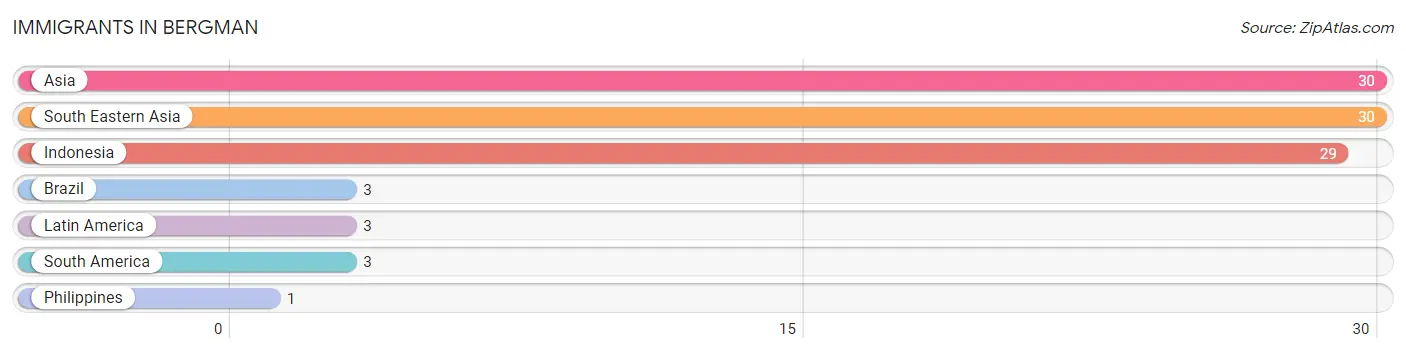
The most numerous immigrant groups reported in Bergman came from Asia (30 | 4.7%), South Eastern Asia (30 | 4.7%), Indonesia (29 | 4.6%), Brazil (3 | 0.5%), and Latin America (3 | 0.5%), together accounting for 15.0% of all Bergman residents.
| Immigration Origin | # Population | % Population |
| Asia | 30 | 4.7% |
| Brazil | 3 | 0.5% |
| Indonesia | 29 | 4.6% |
| Latin America | 3 | 0.5% |
| Philippines | 1 | 0.2% |
| South America | 3 | 0.5% |
| South Eastern Asia | 30 | 4.7% | View All 7 Rows |
Sex and Age in Bergman
Sex and Age in Bergman
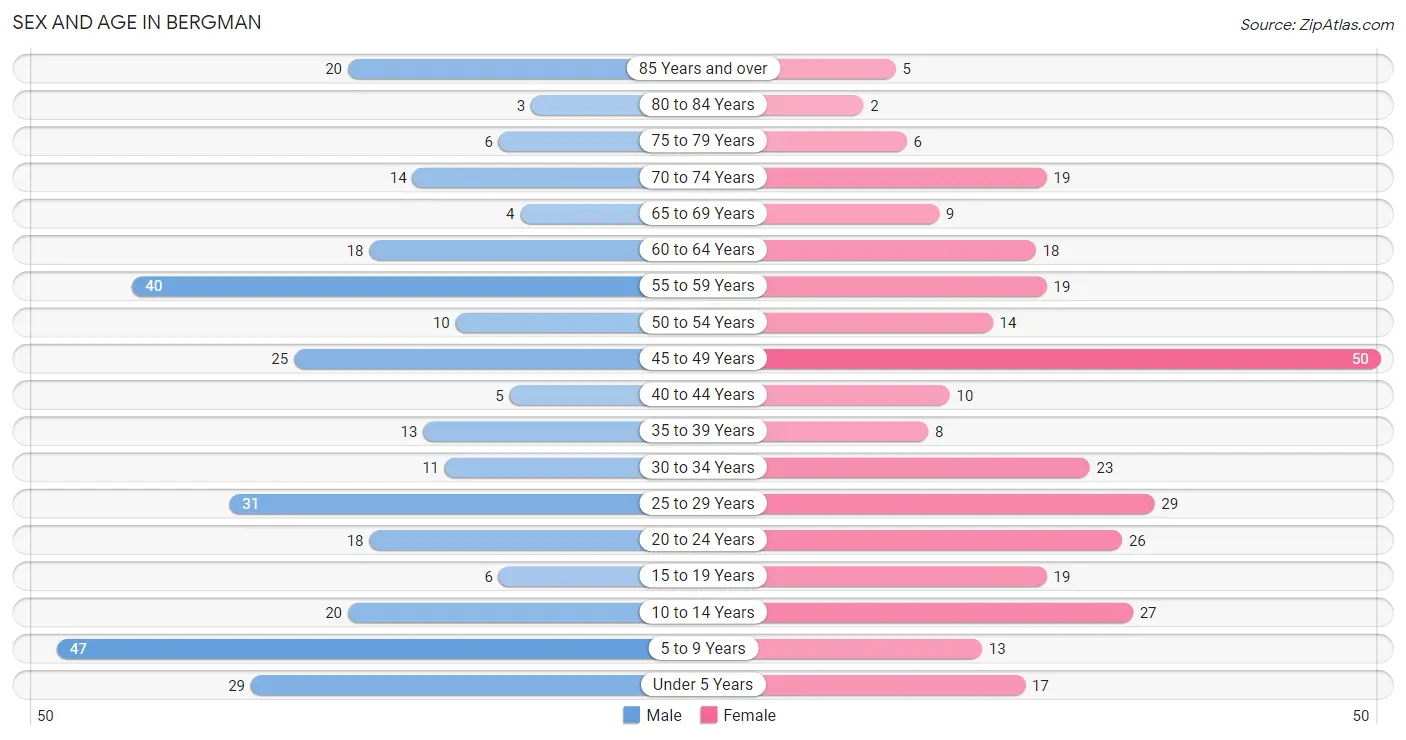
The most populous age groups in Bergman are 5 to 9 Years (47 | 14.7%) for men and 45 to 49 Years (50 | 15.9%) for women.
| Age Bracket | Male | Female |
| Under 5 Years | 29 (9.1%) | 17 (5.4%) |
| 5 to 9 Years | 47 (14.7%) | 13 (4.1%) |
| 10 to 14 Years | 20 (6.2%) | 27 (8.6%) |
| 15 to 19 Years | 6 (1.9%) | 19 (6.0%) |
| 20 to 24 Years | 18 (5.6%) | 26 (8.3%) |
| 25 to 29 Years | 31 (9.7%) | 29 (9.2%) |
| 30 to 34 Years | 11 (3.4%) | 23 (7.3%) |
| 35 to 39 Years | 13 (4.1%) | 8 (2.5%) |
| 40 to 44 Years | 5 (1.6%) | 10 (3.2%) |
| 45 to 49 Years | 25 (7.8%) | 50 (15.9%) |
| 50 to 54 Years | 10 (3.1%) | 14 (4.5%) |
| 55 to 59 Years | 40 (12.5%) | 19 (6.0%) |
| 60 to 64 Years | 18 (5.6%) | 18 (5.7%) |
| 65 to 69 Years | 4 (1.3%) | 9 (2.9%) |
| 70 to 74 Years | 14 (4.4%) | 19 (6.0%) |
| 75 to 79 Years | 6 (1.9%) | 6 (1.9%) |
| 80 to 84 Years | 3 (0.9%) | 2 (0.6%) |
| 85 Years and over | 20 (6.2%) | 5 (1.6%) |
| Total | 320 (100.0%) | 314 (100.0%) |
Families and Households in Bergman
Median Family Size in Bergman
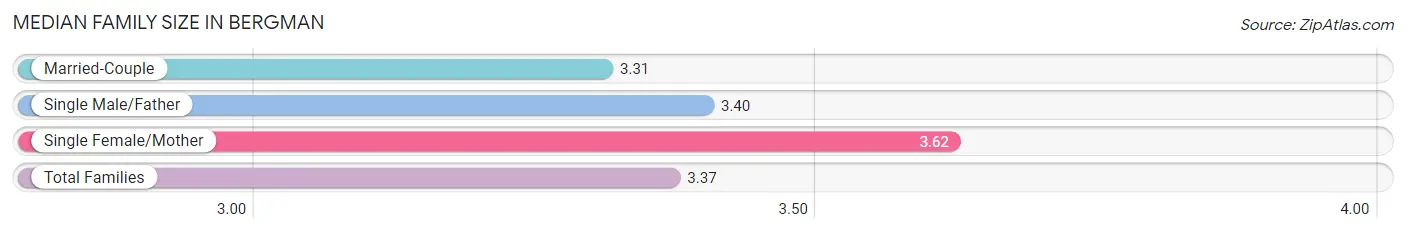
The median family size in Bergman is 3.37 persons per family, with single female/mother families (26 | 15.9%) accounting for the largest median family size of 3.62 persons per family. On the other hand, married-couple families (128 | 78.0%) represent the smallest median family size with 3.31 persons per family.
| Family Type | # Families | Family Size |
| Married-Couple | 128 (78.0%) | 3.31 |
| Single Male/Father | 10 (6.1%) | 3.40 |
| Single Female/Mother | 26 (15.9%) | 3.62 |
| Total Families | 164 (100.0%) | 3.37 |
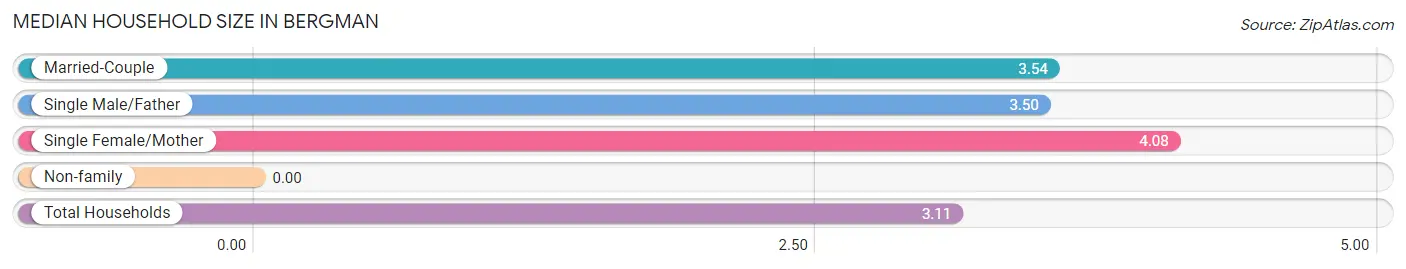
Median Household Size in Bergman
| Household Type | # Households | Household Size |
| Married-Couple | 128 (62.7%) | 3.54 |
| Single Male/Father | 10 (4.9%) | 3.50 |
| Single Female/Mother | 26 (12.8%) | 4.08 |
| Non-family | 40 (19.6%) | - |
| Total Households | 204 (100.0%) | 3.11 |
Household Size by Marriage Status in Bergman
Out of a total of 204 households in Bergman, 164 (80.4%) are family households, while 40 (19.6%) are nonfamily households. The most numerous type of family households are 4-person households, comprising 59, and the most common type of nonfamily households are 1-person households, comprising 40.
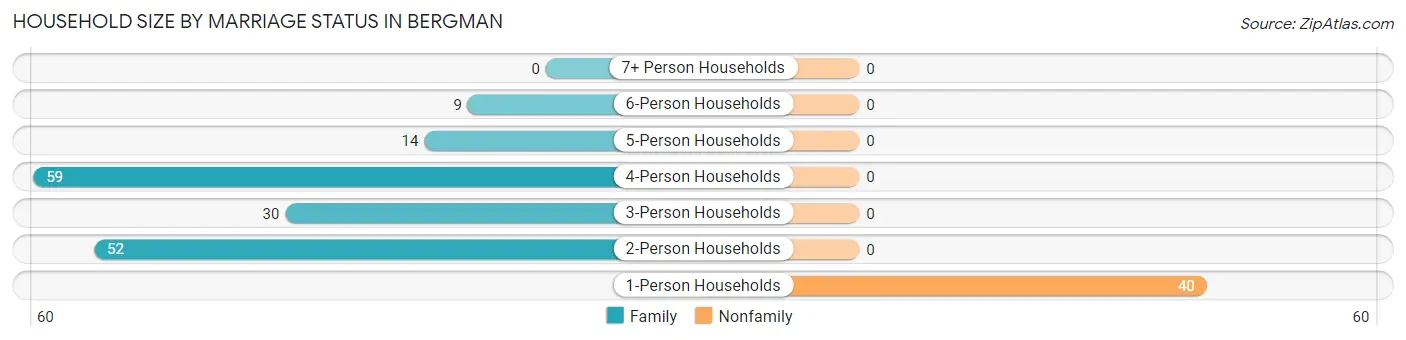
| Household Size | Family Households | Nonfamily Households |
| 1-Person Households | - | 40 (19.6%) |
| 2-Person Households | 52 (25.5%) | 0 (0.0%) |
| 3-Person Households | 30 (14.7%) | 0 (0.0%) |
| 4-Person Households | 59 (28.9%) | 0 (0.0%) |
| 5-Person Households | 14 (6.9%) | 0 (0.0%) |
| 6-Person Households | 9 (4.4%) | 0 (0.0%) |
| 7+ Person Households | 0 (0.0%) | 0 (0.0%) |
| Total | 164 (80.4%) | 40 (19.6%) |
Female Fertility in Bergman
Fertility by Age in Bergman
Average fertility rate in Bergman is 24.0 births per 1,000 women. Women in the age bracket of 20 to 34 years have the highest fertility rate with 51.0 births per 1,000 women. Women in the age bracket of 20 to 34 years acount for 100.0% of all women with births.
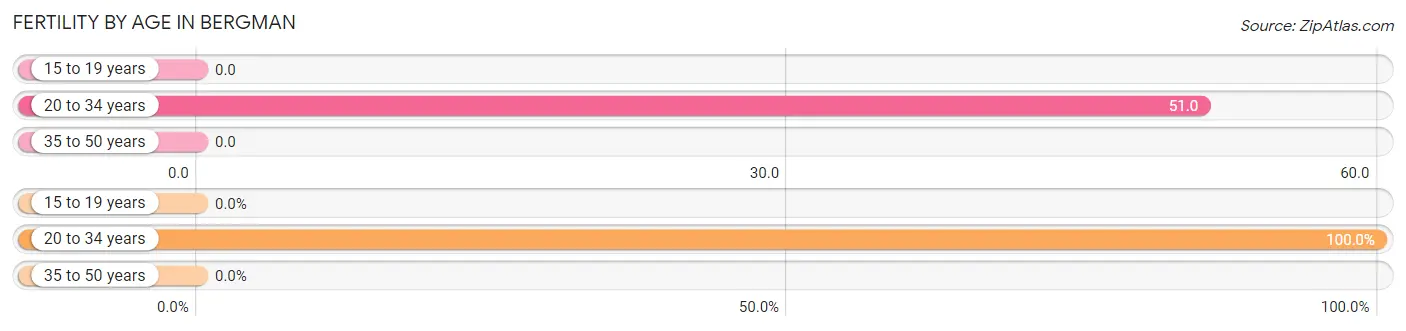
| Age Bracket | Women with Births | Births / 1,000 Women |
| 15 to 19 years | 0 (0.0%) | 0.0 |
| 20 to 34 years | 4 (100.0%) | 51.0 |
| 35 to 50 years | 0 (0.0%) | 0.0 |
| Total | 4 (100.0%) | 24.0 |
Fertility by Age by Marriage Status in Bergman
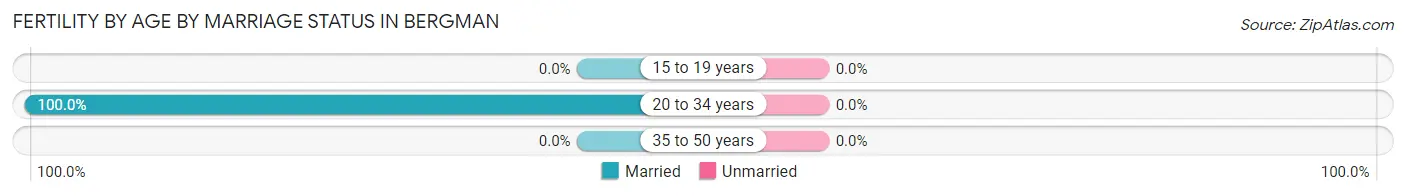
| Age Bracket | Married | Unmarried |
| 15 to 19 years | 0 (0.0%) | 0 (0.0%) |
| 20 to 34 years | 4 (100.0%) | 0 (0.0%) |
| 35 to 50 years | 0 (0.0%) | 0 (0.0%) |
| Total | 4 (100.0%) | 0 (0.0%) |
Fertility by Education in Bergman
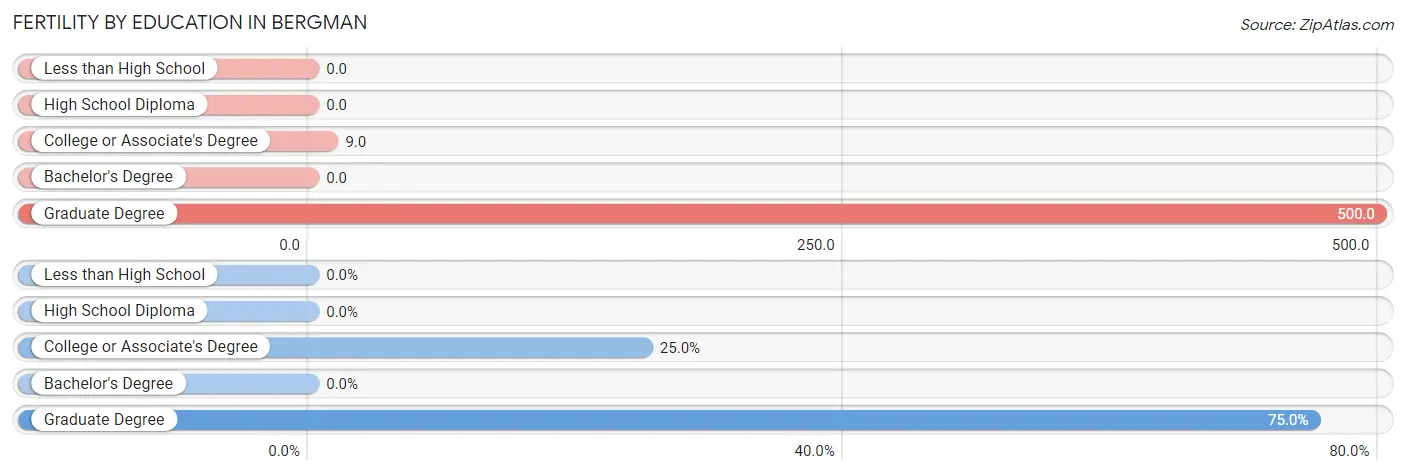
| Educational Attainment | Women with Births | Births / 1,000 Women |
| Less than High School | 0 (0.0%) | 0.0 |
| High School Diploma | 0 (0.0%) | 0.0 |
| College or Associate's Degree | 1 (25.0%) | 9.0 |
| Bachelor's Degree | 0 (0.0%) | 0.0 |
| Graduate Degree | 3 (75.0%) | 500.0 |
| Total | 4 (100.0%) | 24.0 |
Fertility by Education by Marriage Status in Bergman
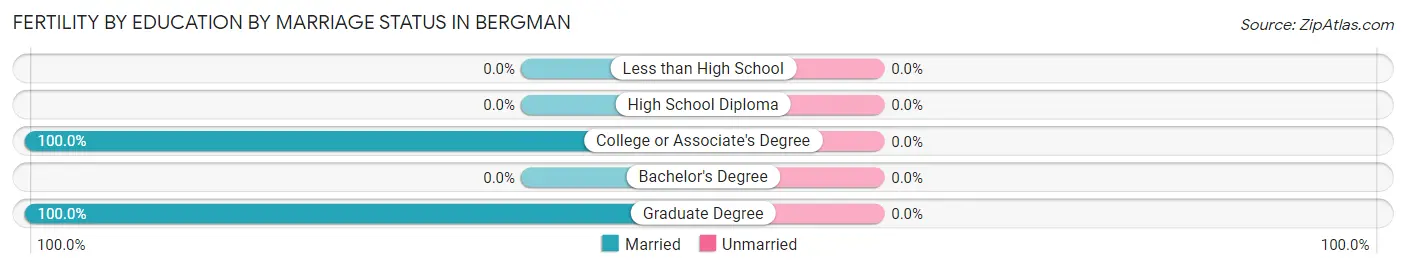
| Educational Attainment | Married | Unmarried |
| Less than High School | 0 (0.0%) | 0 (0.0%) |
| High School Diploma | 0 (0.0%) | 0 (0.0%) |
| College or Associate's Degree | 1 (100.0%) | 0 (0.0%) |
| Bachelor's Degree | 0 (0.0%) | 0 (0.0%) |
| Graduate Degree | 3 (100.0%) | 0 (0.0%) |
| Total | 4 (100.0%) | 0 (0.0%) |
Employment Characteristics in Bergman
Employment by Class of Employer in Bergman
Among the 312 employed individuals in Bergman, private company employees (216 | 69.2%), not-for-profit organizations (34 | 10.9%), and local government employees (26 | 8.3%) make up the most common classes of employment.
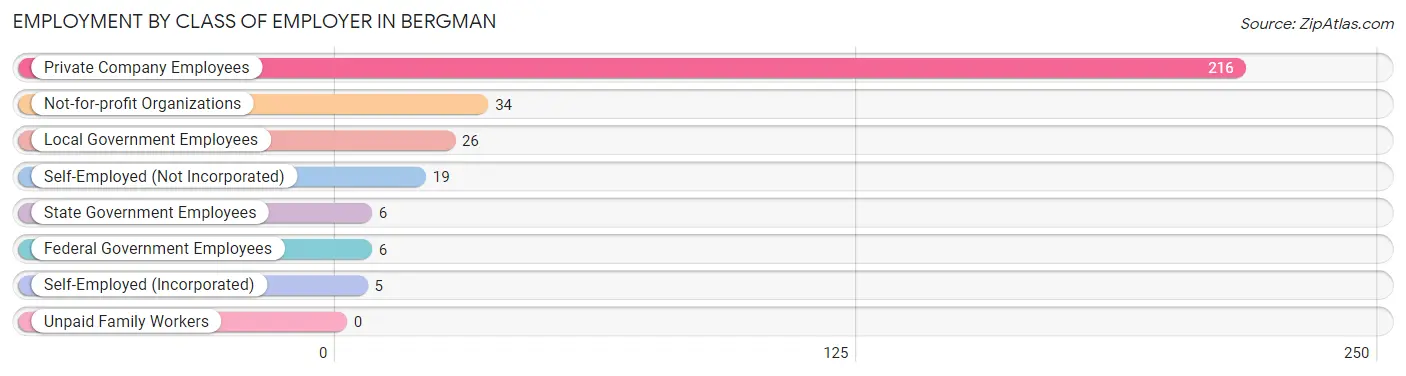
| Employer Class | # Employees | % Employees |
| Private Company Employees | 216 | 69.2% |
| Self-Employed (Incorporated) | 5 | 1.6% |
| Self-Employed (Not Incorporated) | 19 | 6.1% |
| Not-for-profit Organizations | 34 | 10.9% |
| Local Government Employees | 26 | 8.3% |
| State Government Employees | 6 | 1.9% |
| Federal Government Employees | 6 | 1.9% |
| Unpaid Family Workers | 0 | 0.0% |
| Total | 312 | 100.0% |
Employment Status by Age in Bergman
According to the labor force statistics for Bergman, out of the total population over 16 years of age (471), 66.9% or 315 individuals are in the labor force, with 1.0% or 3 of them unemployed. The age group with the highest labor force participation rate is 25 to 29 years, with 98.3% or 59 individuals in the labor force. Within the labor force, the 16 to 19 years age range has the highest percentage of unemployed individuals, with 25.0% or 2 of them being unemployed.
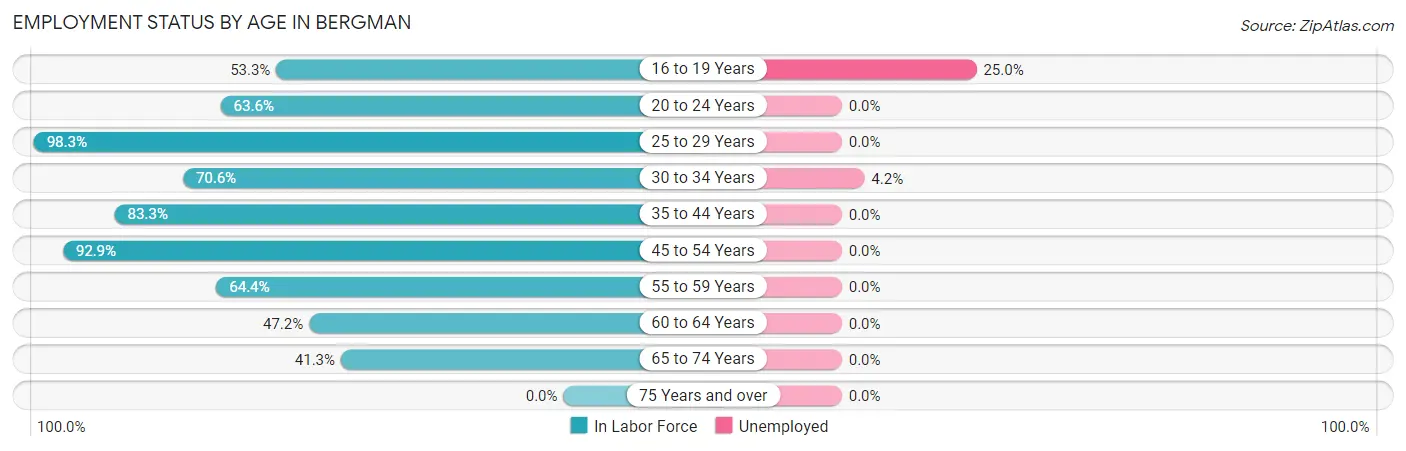
| Age Bracket | In Labor Force | Unemployed |
| 16 to 19 Years | 8 (53.3%) | 2 (25.0%) |
| 20 to 24 Years | 28 (63.6%) | 0 (0.0%) |
| 25 to 29 Years | 59 (98.3%) | 0 (0.0%) |
| 30 to 34 Years | 24 (70.6%) | 1 (4.2%) |
| 35 to 44 Years | 30 (83.3%) | 0 (0.0%) |
| 45 to 54 Years | 92 (92.9%) | 0 (0.0%) |
| 55 to 59 Years | 38 (64.4%) | 0 (0.0%) |
| 60 to 64 Years | 17 (47.2%) | 0 (0.0%) |
| 65 to 74 Years | 19 (41.3%) | 0 (0.0%) |
| 75 Years and over | 0 (0.0%) | 0 (0.0%) |
| Total | 315 (66.9%) | 3 (1.0%) |
Employment Status by Educational Attainment in Bergman
According to labor force statistics for Bergman, 80.2% of individuals (260) out of the total population between 25 and 64 years of age (324) are in the labor force, with 0.4% or 1 of them being unemployed. The group with the highest labor force participation rate are those with the educational attainment of college / associate degree, with 87.1% or 135 individuals in the labor force. Within the labor force, individuals with less than high school education have the highest percentage of unemployment, with 20.0% or 1 of them being unemployed.
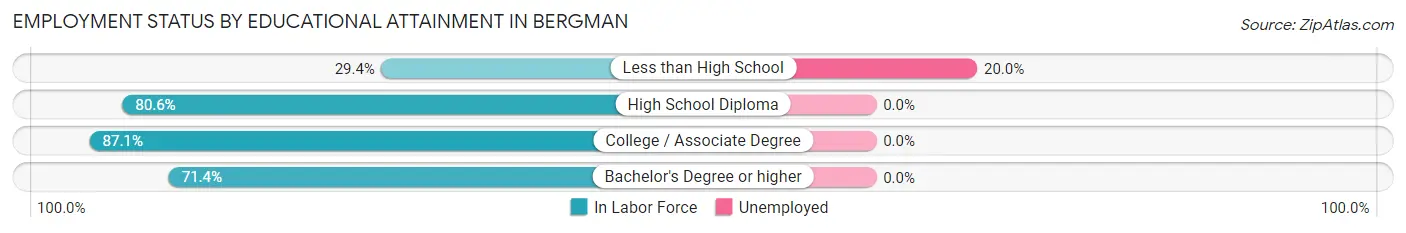
| Educational Attainment | In Labor Force | Unemployed |
| Less than High School | 5 (29.4%) | 3 (20.0%) |
| High School Diploma | 100 (80.6%) | 0 (0.0%) |
| College / Associate Degree | 135 (87.1%) | 0 (0.0%) |
| Bachelor's Degree or higher | 20 (71.4%) | 0 (0.0%) |
| Total | 260 (80.2%) | 1 (0.4%) |
Employment Occupations by Sex in Bergman
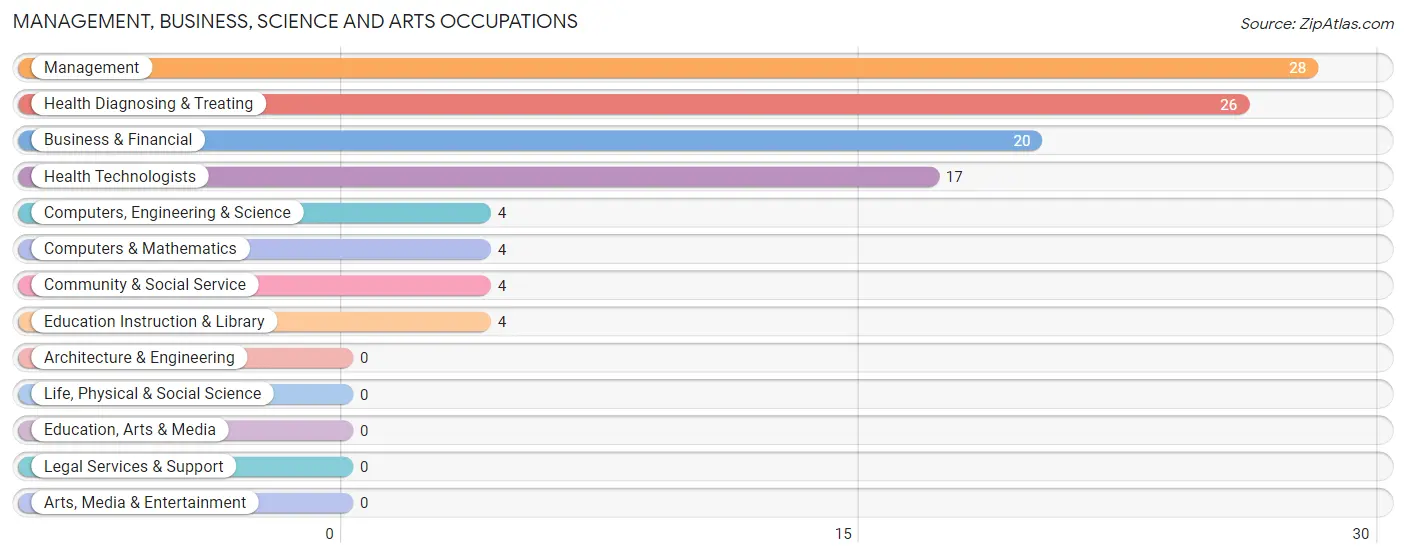
Management, Business, Science and Arts Occupations
The most common Management, Business, Science and Arts occupations in Bergman are Management (28 | 9.0%), Health Diagnosing & Treating (26 | 8.3%), Business & Financial (20 | 6.4%), Health Technologists (17 | 5.4%), and Computers, Engineering & Science (4 | 1.3%).
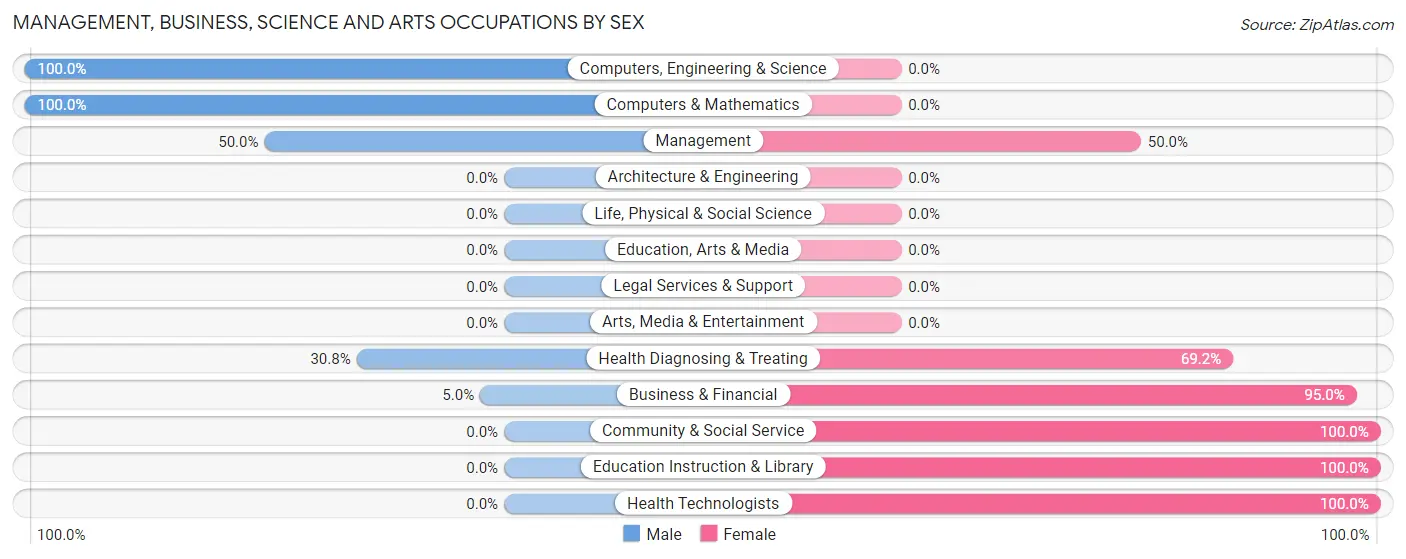
Management, Business, Science and Arts Occupations by Sex
Within the Management, Business, Science and Arts occupations in Bergman, the most male-oriented occupations are Computers, Engineering & Science (100.0%), Computers & Mathematics (100.0%), and Management (50.0%), while the most female-oriented occupations are Community & Social Service (100.0%), Education Instruction & Library (100.0%), and Health Technologists (100.0%).
| Occupation | Male | Female |
| Management | 14 (50.0%) | 14 (50.0%) |
| Business & Financial | 1 (5.0%) | 19 (95.0%) |
| Computers, Engineering & Science | 4 (100.0%) | 0 (0.0%) |
| Computers & Mathematics | 4 (100.0%) | 0 (0.0%) |
| Architecture & Engineering | 0 (0.0%) | 0 (0.0%) |
| Life, Physical & Social Science | 0 (0.0%) | 0 (0.0%) |
| Community & Social Service | 0 (0.0%) | 4 (100.0%) |
| Education, Arts & Media | 0 (0.0%) | 0 (0.0%) |
| Legal Services & Support | 0 (0.0%) | 0 (0.0%) |
| Education Instruction & Library | 0 (0.0%) | 4 (100.0%) |
| Arts, Media & Entertainment | 0 (0.0%) | 0 (0.0%) |
| Health Diagnosing & Treating | 8 (30.8%) | 18 (69.2%) |
| Health Technologists | 0 (0.0%) | 17 (100.0%) |
| Total (Category) | 27 (32.9%) | 55 (67.1%) |
| Total (Overall) | 137 (43.9%) | 175 (56.1%) |
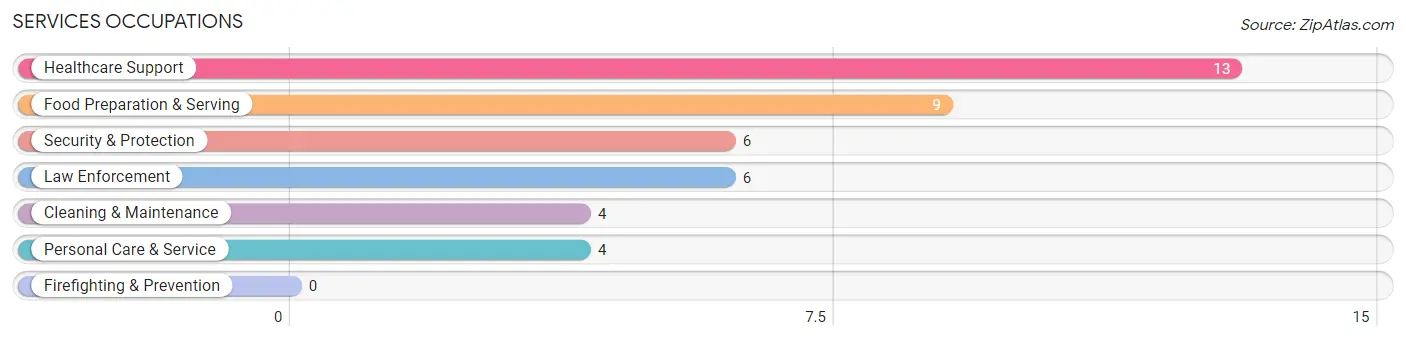
Services Occupations
The most common Services occupations in Bergman are Healthcare Support (13 | 4.2%), Food Preparation & Serving (9 | 2.9%), Security & Protection (6 | 1.9%), Law Enforcement (6 | 1.9%), and Cleaning & Maintenance (4 | 1.3%).
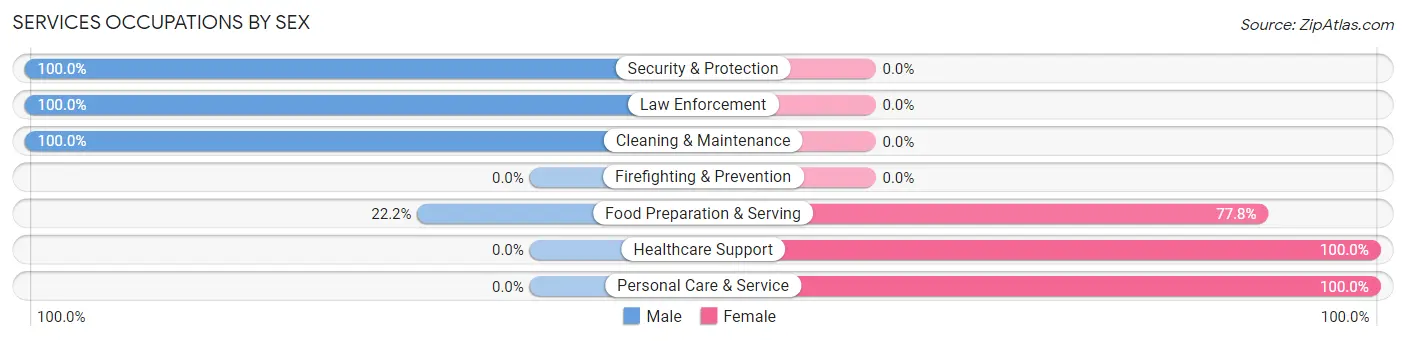
Services Occupations by Sex
Within the Services occupations in Bergman, the most male-oriented occupations are Security & Protection (100.0%), Law Enforcement (100.0%), and Cleaning & Maintenance (100.0%), while the most female-oriented occupations are Healthcare Support (100.0%), Personal Care & Service (100.0%), and Food Preparation & Serving (77.8%).
| Occupation | Male | Female |
| Healthcare Support | 0 (0.0%) | 13 (100.0%) |
| Security & Protection | 6 (100.0%) | 0 (0.0%) |
| Firefighting & Prevention | 0 (0.0%) | 0 (0.0%) |
| Law Enforcement | 6 (100.0%) | 0 (0.0%) |
| Food Preparation & Serving | 2 (22.2%) | 7 (77.8%) |
| Cleaning & Maintenance | 4 (100.0%) | 0 (0.0%) |
| Personal Care & Service | 0 (0.0%) | 4 (100.0%) |
| Total (Category) | 12 (33.3%) | 24 (66.7%) |
| Total (Overall) | 137 (43.9%) | 175 (56.1%) |
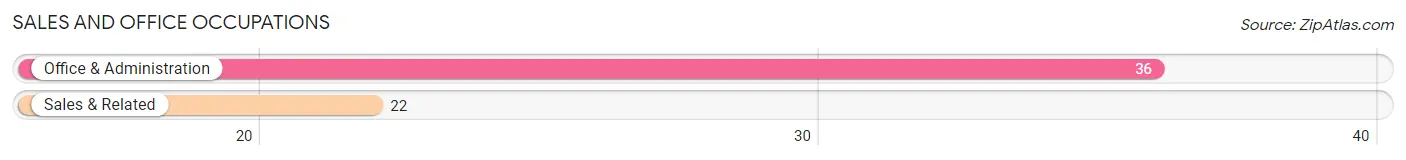
Sales and Office Occupations
The most common Sales and Office occupations in Bergman are Office & Administration (36 | 11.5%), and Sales & Related (22 | 7.0%).
Sales and Office Occupations by Sex
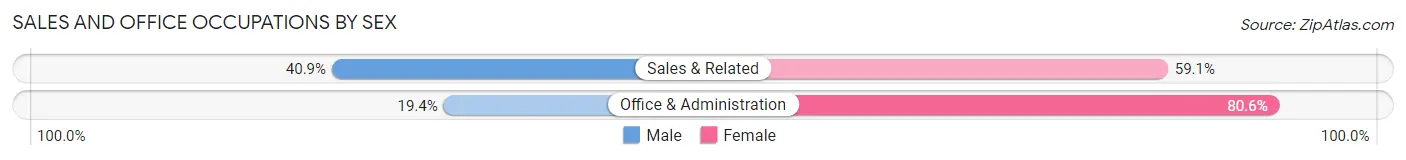
| Occupation | Male | Female |
| Sales & Related | 9 (40.9%) | 13 (59.1%) |
| Office & Administration | 7 (19.4%) | 29 (80.6%) |
| Total (Category) | 16 (27.6%) | 42 (72.4%) |
| Total (Overall) | 137 (43.9%) | 175 (56.1%) |
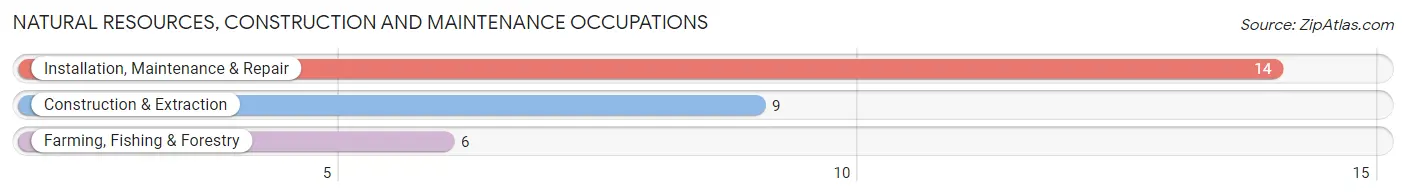
Natural Resources, Construction and Maintenance Occupations
The most common Natural Resources, Construction and Maintenance occupations in Bergman are Installation, Maintenance & Repair (14 | 4.5%), Construction & Extraction (9 | 2.9%), and Farming, Fishing & Forestry (6 | 1.9%).
Natural Resources, Construction and Maintenance Occupations by Sex
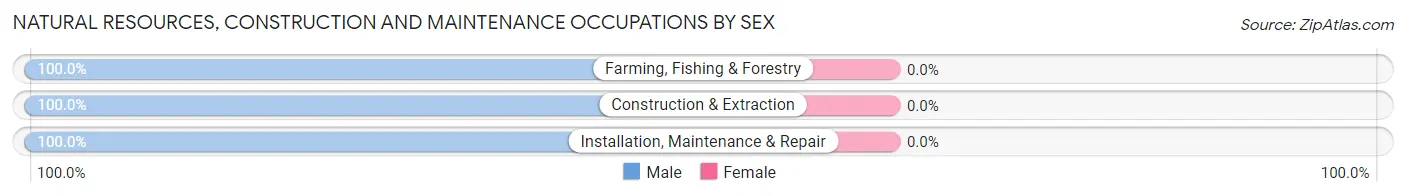
| Occupation | Male | Female |
| Farming, Fishing & Forestry | 6 (100.0%) | 0 (0.0%) |
| Construction & Extraction | 9 (100.0%) | 0 (0.0%) |
| Installation, Maintenance & Repair | 14 (100.0%) | 0 (0.0%) |
| Total (Category) | 29 (100.0%) | 0 (0.0%) |
| Total (Overall) | 137 (43.9%) | 175 (56.1%) |
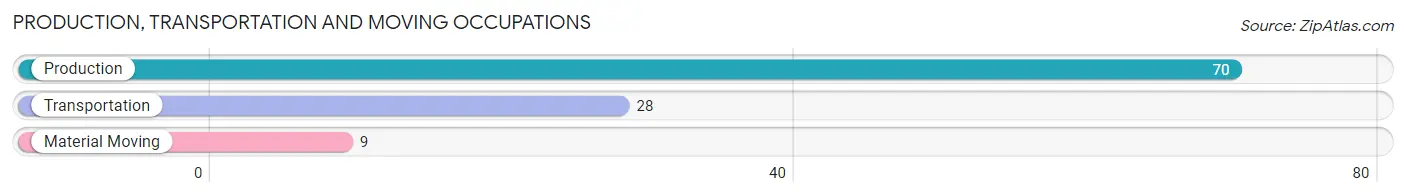
Production, Transportation and Moving Occupations
The most common Production, Transportation and Moving occupations in Bergman are Production (70 | 22.4%), Transportation (28 | 9.0%), and Material Moving (9 | 2.9%).
Production, Transportation and Moving Occupations by Sex
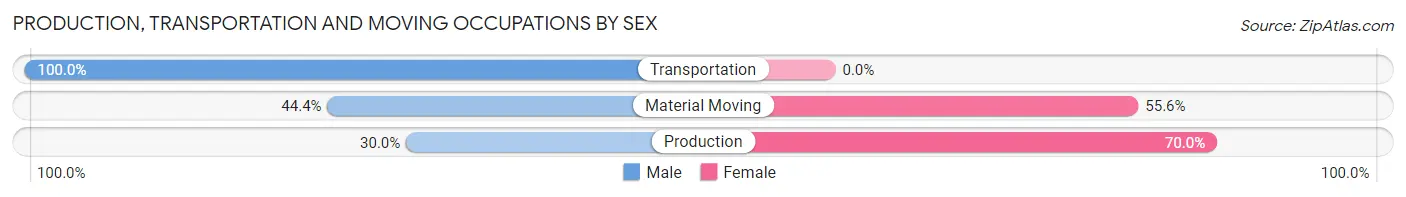
| Occupation | Male | Female |
| Production | 21 (30.0%) | 49 (70.0%) |
| Transportation | 28 (100.0%) | 0 (0.0%) |
| Material Moving | 4 (44.4%) | 5 (55.6%) |
| Total (Category) | 53 (49.5%) | 54 (50.5%) |
| Total (Overall) | 137 (43.9%) | 175 (56.1%) |
Employment Industries by Sex in Bergman
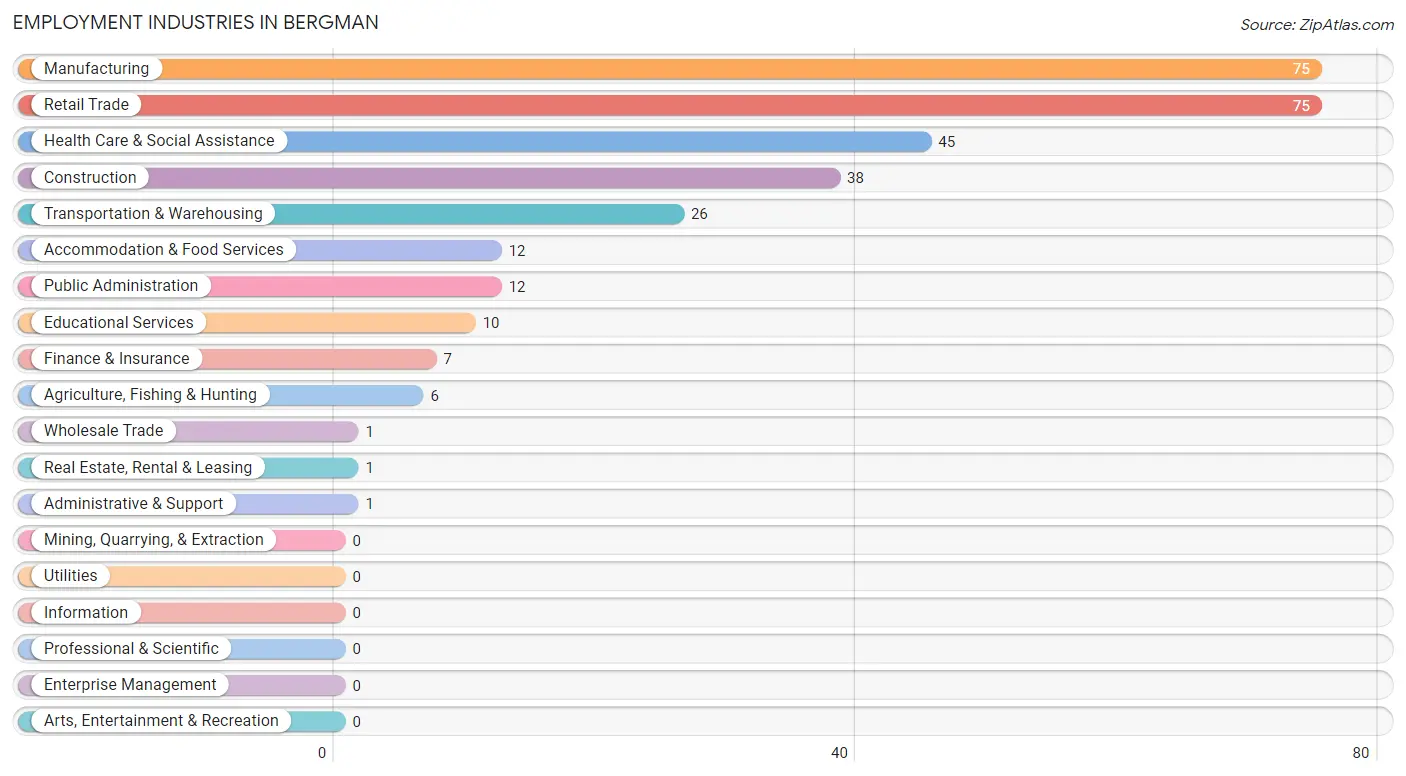
Employment Industries in Bergman
The major employment industries in Bergman include Manufacturing (75 | 24.0%), Retail Trade (75 | 24.0%), Health Care & Social Assistance (45 | 14.4%), Construction (38 | 12.2%), and Transportation & Warehousing (26 | 8.3%).
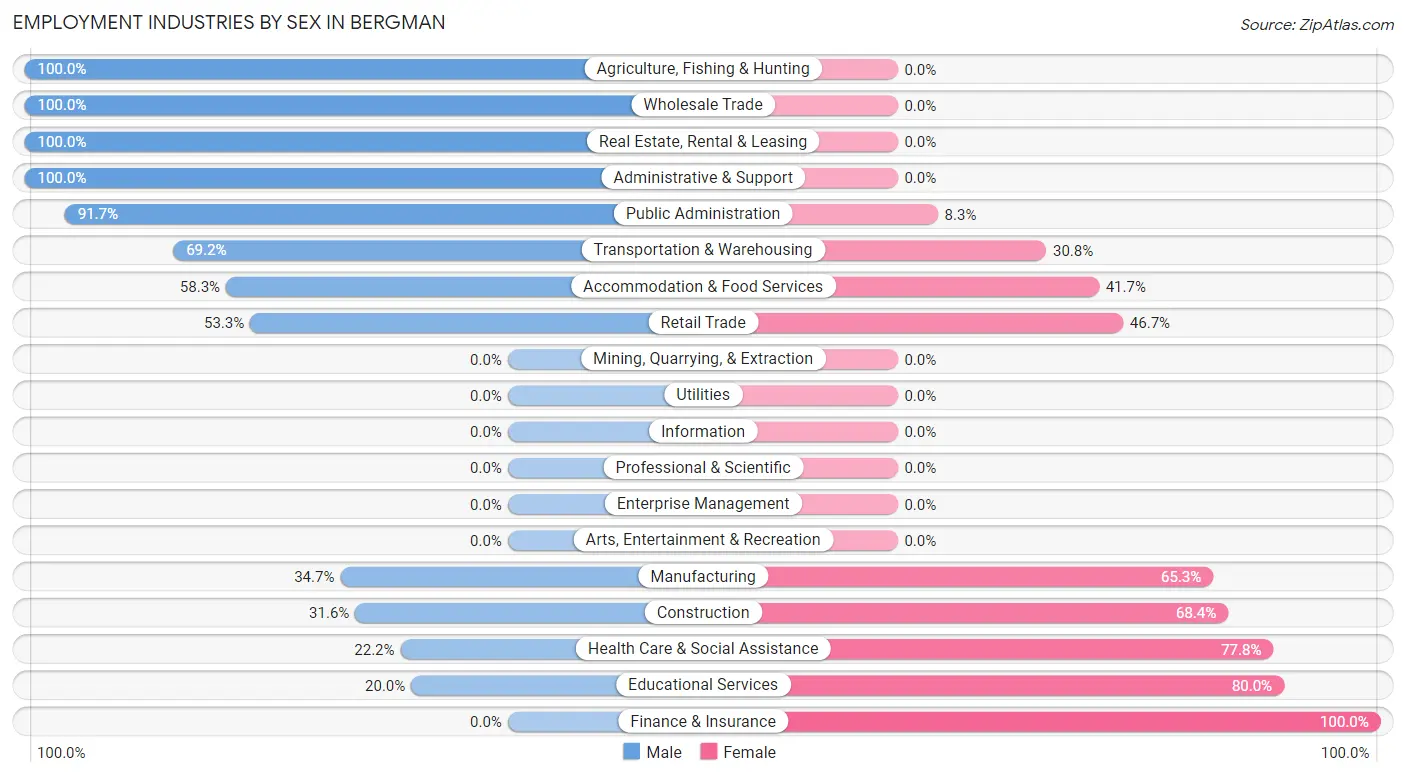
Employment Industries by Sex in Bergman
The Bergman industries that see more men than women are Agriculture, Fishing & Hunting (100.0%), Wholesale Trade (100.0%), and Real Estate, Rental & Leasing (100.0%), whereas the industries that tend to have a higher number of women are Finance & Insurance (100.0%), Educational Services (80.0%), and Health Care & Social Assistance (77.8%).
| Industry | Male | Female |
| Agriculture, Fishing & Hunting | 6 (100.0%) | 0 (0.0%) |
| Mining, Quarrying, & Extraction | 0 (0.0%) | 0 (0.0%) |
| Construction | 12 (31.6%) | 26 (68.4%) |
| Manufacturing | 26 (34.7%) | 49 (65.3%) |
| Wholesale Trade | 1 (100.0%) | 0 (0.0%) |
| Retail Trade | 40 (53.3%) | 35 (46.7%) |
| Transportation & Warehousing | 18 (69.2%) | 8 (30.8%) |
| Utilities | 0 (0.0%) | 0 (0.0%) |
| Information | 0 (0.0%) | 0 (0.0%) |
| Finance & Insurance | 0 (0.0%) | 7 (100.0%) |
| Real Estate, Rental & Leasing | 1 (100.0%) | 0 (0.0%) |
| Professional & Scientific | 0 (0.0%) | 0 (0.0%) |
| Enterprise Management | 0 (0.0%) | 0 (0.0%) |
| Administrative & Support | 1 (100.0%) | 0 (0.0%) |
| Educational Services | 2 (20.0%) | 8 (80.0%) |
| Health Care & Social Assistance | 10 (22.2%) | 35 (77.8%) |
| Arts, Entertainment & Recreation | 0 (0.0%) | 0 (0.0%) |
| Accommodation & Food Services | 7 (58.3%) | 5 (41.7%) |
| Public Administration | 11 (91.7%) | 1 (8.3%) |
| Total | 137 (43.9%) | 175 (56.1%) |
Education in Bergman
School Enrollment in Bergman
The most common levels of schooling among the 168 students in Bergman are elementary school (53 | 31.6%), middle school (31 | 18.4%), and high school (24 | 14.3%).
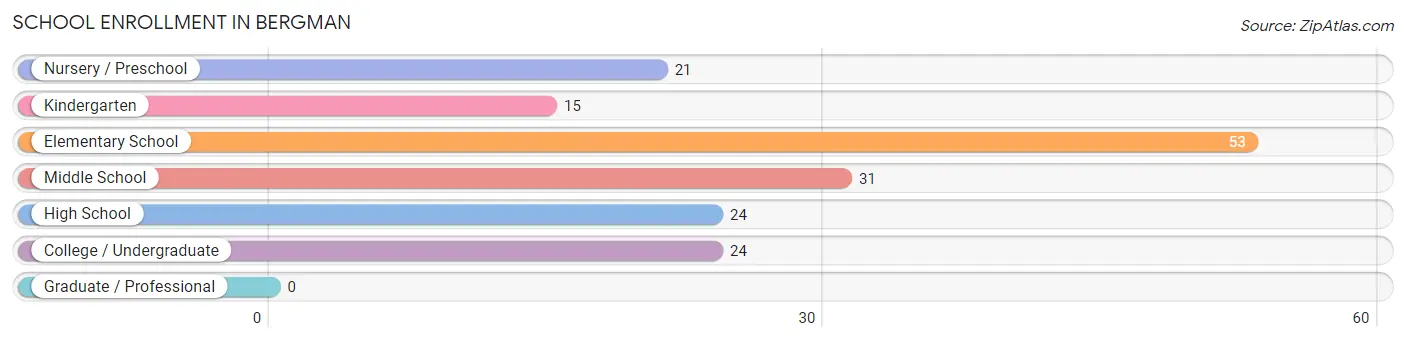
| School Level | # Students | % Students |
| Nursery / Preschool | 21 | 12.5% |
| Kindergarten | 15 | 8.9% |
| Elementary School | 53 | 31.6% |
| Middle School | 31 | 18.4% |
| High School | 24 | 14.3% |
| College / Undergraduate | 24 | 14.3% |
| Graduate / Professional | 0 | 0.0% |
| Total | 168 | 100.0% |
School Enrollment by Age by Funding Source in Bergman
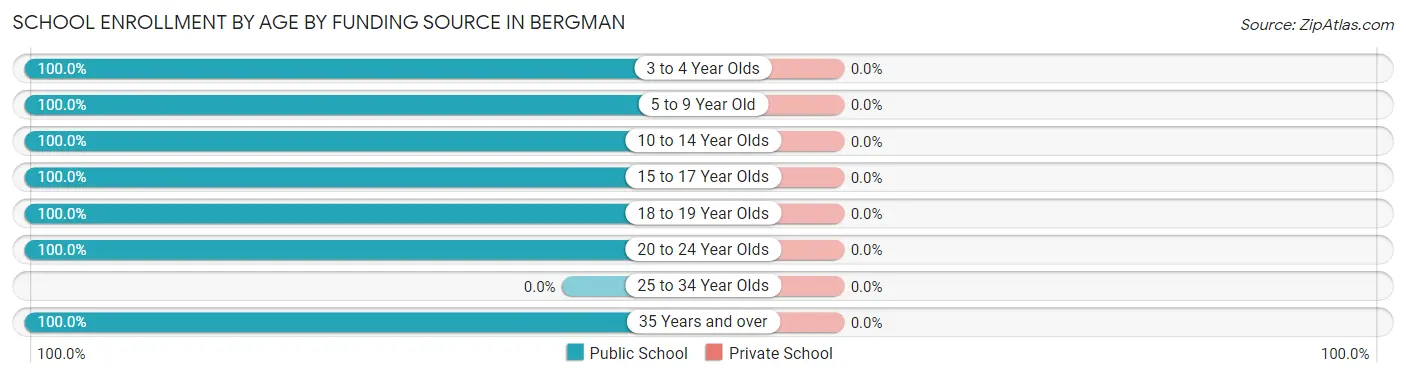
| Age Bracket | Public School | Private School |
| 3 to 4 Year Olds | 19 (100.0%) | 0 (0.0%) |
| 5 to 9 Year Old | 57 (100.0%) | 0 (0.0%) |
| 10 to 14 Year Olds | 47 (100.0%) | 0 (0.0%) |
| 15 to 17 Year Olds | 20 (100.0%) | 0 (0.0%) |
| 18 to 19 Year Olds | 3 (100.0%) | 0 (0.0%) |
| 20 to 24 Year Olds | 20 (100.0%) | 0 (0.0%) |
| 25 to 34 Year Olds | 0 (0.0%) | 0 (0.0%) |
| 35 Years and over | 2 (100.0%) | 0 (0.0%) |
| Total | 168 (100.0%) | 0 (0.0%) |
Educational Attainment by Field of Study in Bergman
Computers & mathematics (9 | 31.0%), education (7 | 24.1%), social sciences (5 | 17.2%), business (5 | 17.2%), and bio, nature & agricultural (1 | 3.5%) are the most common fields of study among 29 individuals in Bergman who have obtained a bachelor's degree or higher.
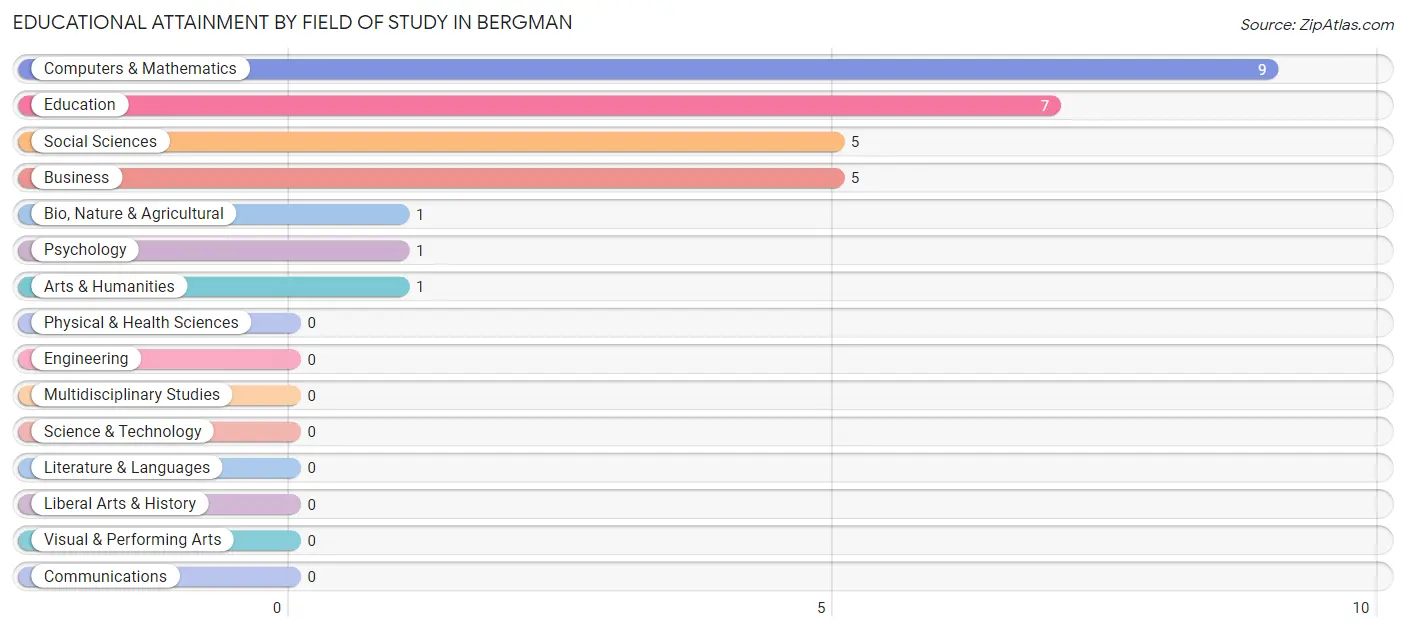
| Field of Study | # Graduates | % Graduates |
| Computers & Mathematics | 9 | 31.0% |
| Bio, Nature & Agricultural | 1 | 3.5% |
| Physical & Health Sciences | 0 | 0.0% |
| Psychology | 1 | 3.5% |
| Social Sciences | 5 | 17.2% |
| Engineering | 0 | 0.0% |
| Multidisciplinary Studies | 0 | 0.0% |
| Science & Technology | 0 | 0.0% |
| Business | 5 | 17.2% |
| Education | 7 | 24.1% |
| Literature & Languages | 0 | 0.0% |
| Liberal Arts & History | 0 | 0.0% |
| Visual & Performing Arts | 0 | 0.0% |
| Communications | 0 | 0.0% |
| Arts & Humanities | 1 | 3.5% |
| Total | 29 | 100.0% |
Transportation & Commute in Bergman
Vehicle Availability by Sex in Bergman
The most prevalent vehicle ownership categories in Bergman are males with 3 vehicles (53, accounting for 38.7%) and females with 3 vehicles (93, making up 30.3%).
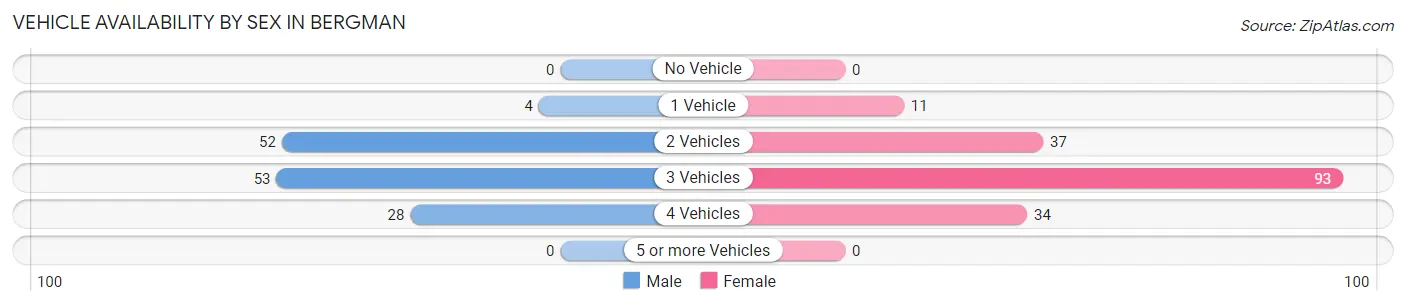
| Vehicles Available | Male | Female |
| No Vehicle | 0 (0.0%) | 0 (0.0%) |
| 1 Vehicle | 4 (2.9%) | 11 (6.3%) |
| 2 Vehicles | 52 (38.0%) | 37 (21.1%) |
| 3 Vehicles | 53 (38.7%) | 93 (53.1%) |
| 4 Vehicles | 28 (20.4%) | 34 (19.4%) |
| 5 or more Vehicles | 0 (0.0%) | 0 (0.0%) |
| Total | 137 (100.0%) | 175 (100.0%) |
Commute Time in Bergman
The most frequently occuring commute durations in Bergman are 10 to 14 minutes (93 commuters, 31.6%), 15 to 19 minutes (73 commuters, 24.8%), and 60 to 89 minutes (39 commuters, 13.3%).
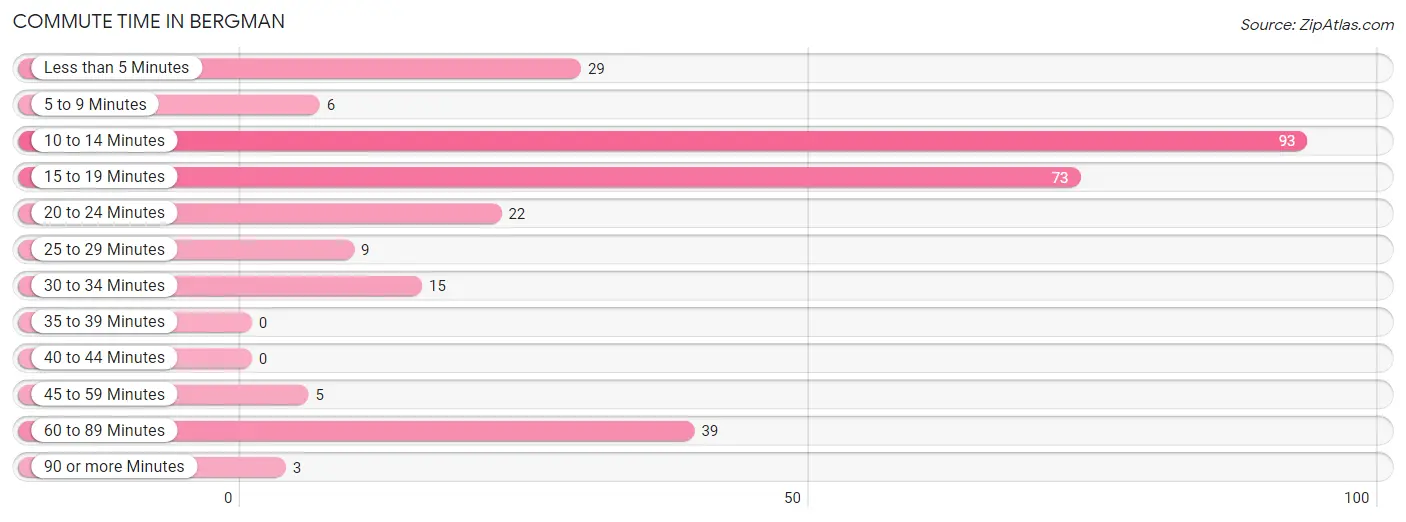
| Commute Time | # Commuters | % Commuters |
| Less than 5 Minutes | 29 | 9.9% |
| 5 to 9 Minutes | 6 | 2.0% |
| 10 to 14 Minutes | 93 | 31.6% |
| 15 to 19 Minutes | 73 | 24.8% |
| 20 to 24 Minutes | 22 | 7.5% |
| 25 to 29 Minutes | 9 | 3.1% |
| 30 to 34 Minutes | 15 | 5.1% |
| 35 to 39 Minutes | 0 | 0.0% |
| 40 to 44 Minutes | 0 | 0.0% |
| 45 to 59 Minutes | 5 | 1.7% |
| 60 to 89 Minutes | 39 | 13.3% |
| 90 or more Minutes | 3 | 1.0% |
Commute Time by Sex in Bergman
The most common commute times in Bergman are 10 to 14 minutes (45 commuters, 36.0%) for males and 10 to 14 minutes (48 commuters, 28.4%) for females.
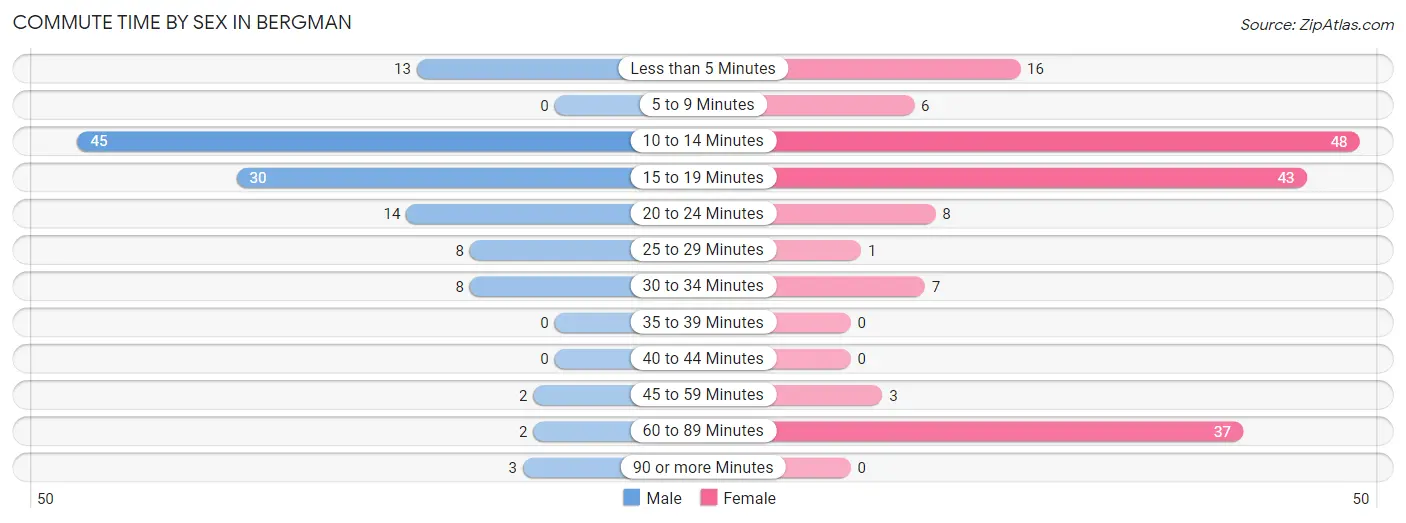
| Commute Time | Male | Female |
| Less than 5 Minutes | 13 (10.4%) | 16 (9.5%) |
| 5 to 9 Minutes | 0 (0.0%) | 6 (3.5%) |
| 10 to 14 Minutes | 45 (36.0%) | 48 (28.4%) |
| 15 to 19 Minutes | 30 (24.0%) | 43 (25.4%) |
| 20 to 24 Minutes | 14 (11.2%) | 8 (4.7%) |
| 25 to 29 Minutes | 8 (6.4%) | 1 (0.6%) |
| 30 to 34 Minutes | 8 (6.4%) | 7 (4.1%) |
| 35 to 39 Minutes | 0 (0.0%) | 0 (0.0%) |
| 40 to 44 Minutes | 0 (0.0%) | 0 (0.0%) |
| 45 to 59 Minutes | 2 (1.6%) | 3 (1.8%) |
| 60 to 89 Minutes | 2 (1.6%) | 37 (21.9%) |
| 90 or more Minutes | 3 (2.4%) | 0 (0.0%) |
Time of Departure to Work by Sex in Bergman
The most frequent times of departure to work in Bergman are 6:30 AM to 6:59 AM (38, 30.4%) for males and 5:30 AM to 5:59 AM (55, 32.5%) for females.
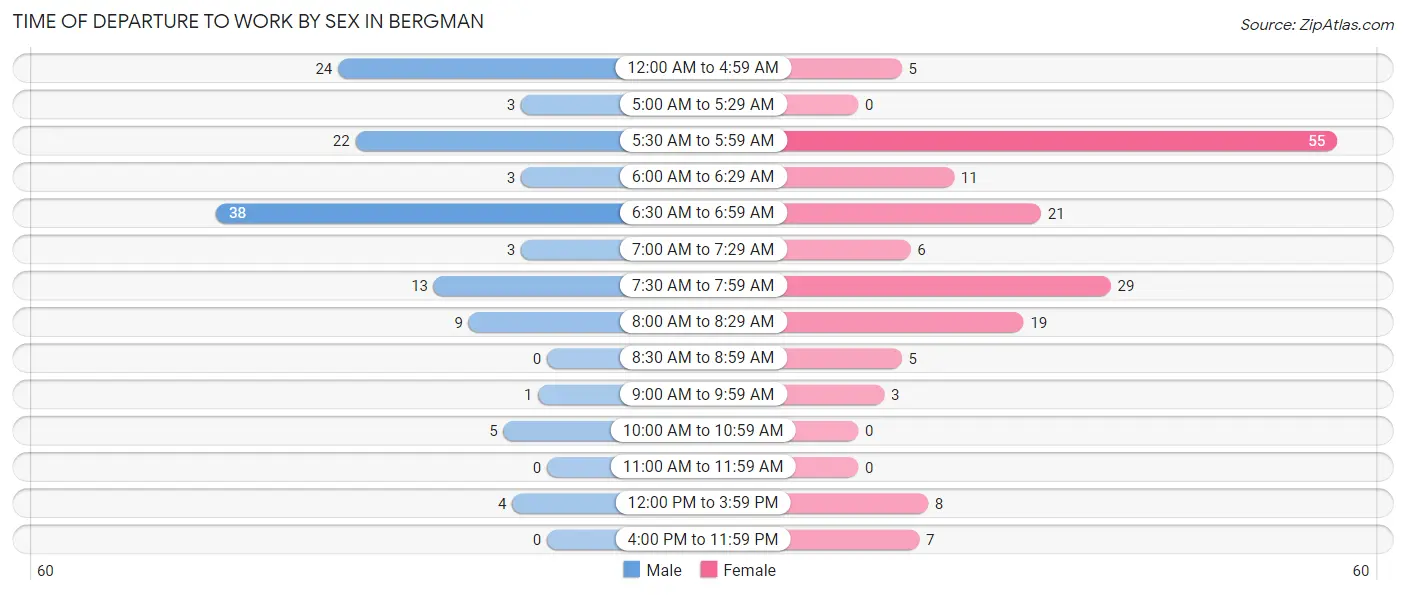
| Time of Departure | Male | Female |
| 12:00 AM to 4:59 AM | 24 (19.2%) | 5 (3.0%) |
| 5:00 AM to 5:29 AM | 3 (2.4%) | 0 (0.0%) |
| 5:30 AM to 5:59 AM | 22 (17.6%) | 55 (32.5%) |
| 6:00 AM to 6:29 AM | 3 (2.4%) | 11 (6.5%) |
| 6:30 AM to 6:59 AM | 38 (30.4%) | 21 (12.4%) |
| 7:00 AM to 7:29 AM | 3 (2.4%) | 6 (3.5%) |
| 7:30 AM to 7:59 AM | 13 (10.4%) | 29 (17.2%) |
| 8:00 AM to 8:29 AM | 9 (7.2%) | 19 (11.2%) |
| 8:30 AM to 8:59 AM | 0 (0.0%) | 5 (3.0%) |
| 9:00 AM to 9:59 AM | 1 (0.8%) | 3 (1.8%) |
| 10:00 AM to 10:59 AM | 5 (4.0%) | 0 (0.0%) |
| 11:00 AM to 11:59 AM | 0 (0.0%) | 0 (0.0%) |
| 12:00 PM to 3:59 PM | 4 (3.2%) | 8 (4.7%) |
| 4:00 PM to 11:59 PM | 0 (0.0%) | 7 (4.1%) |
| Total | 125 (100.0%) | 169 (100.0%) |
Housing Occupancy in Bergman
Occupancy by Ownership in Bergman
Of the total 204 dwellings in Bergman, owner-occupied units account for 173 (84.8%), while renter-occupied units make up 31 (15.2%).
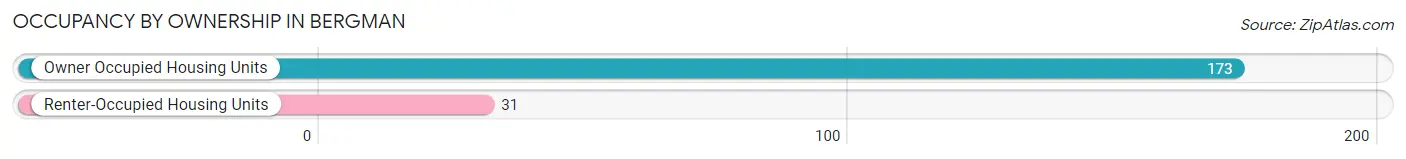
| Occupancy | # Housing Units | % Housing Units |
| Owner Occupied Housing Units | 173 | 84.8% |
| Renter-Occupied Housing Units | 31 | 15.2% |
| Total Occupied Housing Units | 204 | 100.0% |
Occupancy by Household Size in Bergman
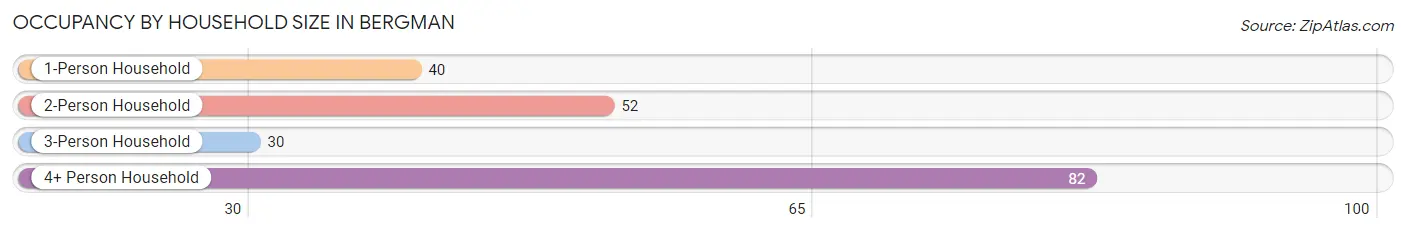
| Household Size | # Housing Units | % Housing Units |
| 1-Person Household | 40 | 19.6% |
| 2-Person Household | 52 | 25.5% |
| 3-Person Household | 30 | 14.7% |
| 4+ Person Household | 82 | 40.2% |
| Total Housing Units | 204 | 100.0% |
Occupancy by Ownership by Household Size in Bergman
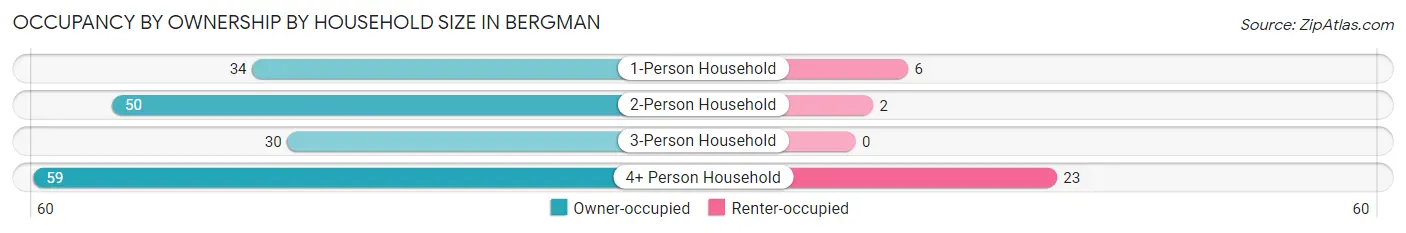
| Household Size | Owner-occupied | Renter-occupied |
| 1-Person Household | 34 (85.0%) | 6 (15.0%) |
| 2-Person Household | 50 (96.2%) | 2 (3.8%) |
| 3-Person Household | 30 (100.0%) | 0 (0.0%) |
| 4+ Person Household | 59 (72.0%) | 23 (28.1%) |
| Total Housing Units | 173 (84.8%) | 31 (15.2%) |
Occupancy by Educational Attainment in Bergman
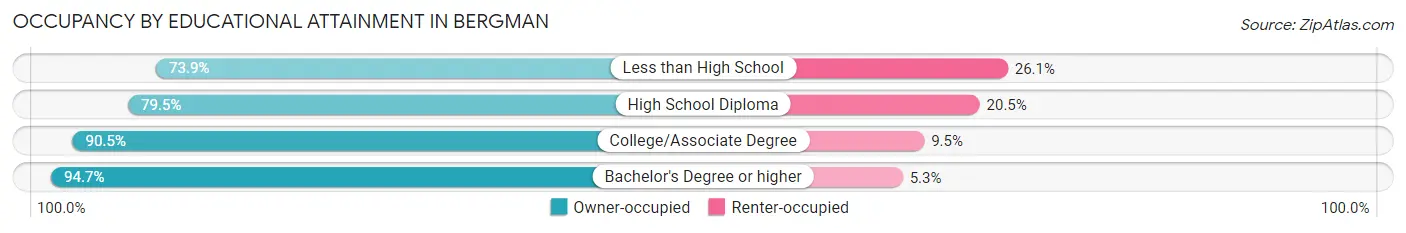
| Household Size | Owner-occupied | Renter-occupied |
| Less than High School | 17 (73.9%) | 6 (26.1%) |
| High School Diploma | 62 (79.5%) | 16 (20.5%) |
| College/Associate Degree | 76 (90.5%) | 8 (9.5%) |
| Bachelor's Degree or higher | 18 (94.7%) | 1 (5.3%) |
Occupancy by Age of Householder in Bergman
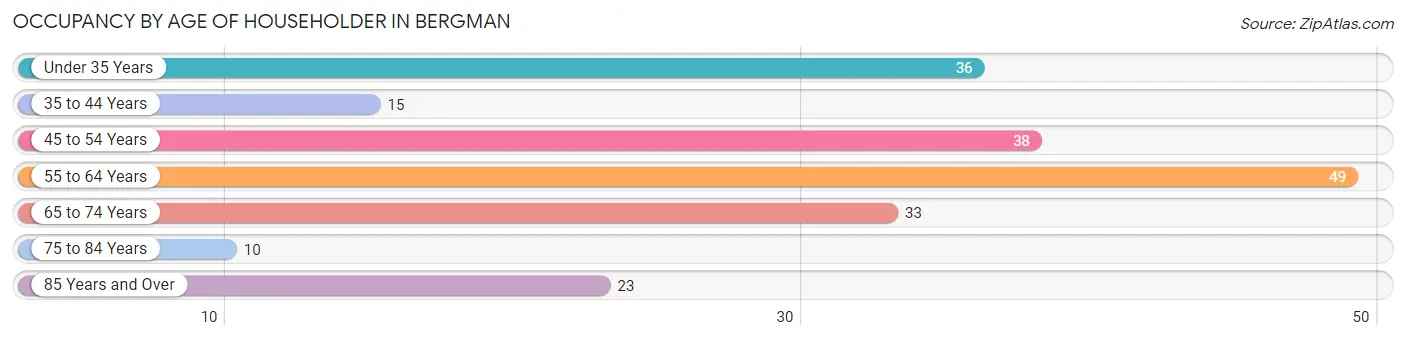
| Age Bracket | # Households | % Households |
| Under 35 Years | 36 | 17.6% |
| 35 to 44 Years | 15 | 7.3% |
| 45 to 54 Years | 38 | 18.6% |
| 55 to 64 Years | 49 | 24.0% |
| 65 to 74 Years | 33 | 16.2% |
| 75 to 84 Years | 10 | 4.9% |
| 85 Years and Over | 23 | 11.3% |
| Total | 204 | 100.0% |
Housing Finances in Bergman
Median Income by Occupancy in Bergman
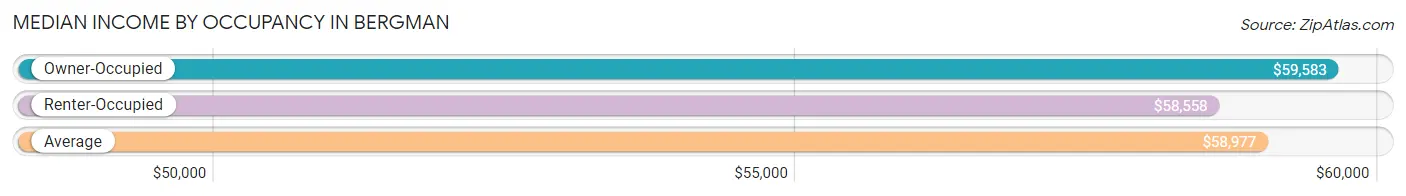
| Occupancy Type | # Households | Median Income |
| Owner-Occupied | 173 (84.8%) | $59,583 |
| Renter-Occupied | 31 (15.2%) | $58,558 |
| Average | 204 (100.0%) | $58,977 |
Occupancy by Householder Income Bracket in Bergman
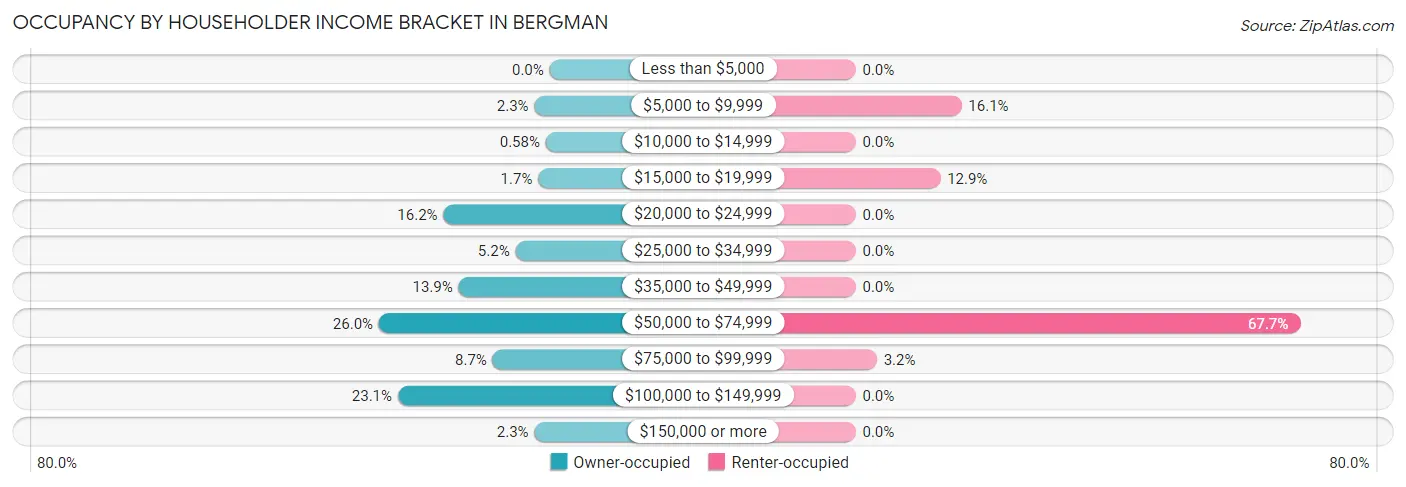
| Income Bracket | Owner-occupied | Renter-occupied |
| Less than $5,000 | 0 (0.0%) | 0 (0.0%) |
| $5,000 to $9,999 | 4 (2.3%) | 5 (16.1%) |
| $10,000 to $14,999 | 1 (0.6%) | 0 (0.0%) |
| $15,000 to $19,999 | 3 (1.7%) | 4 (12.9%) |
| $20,000 to $24,999 | 28 (16.2%) | 0 (0.0%) |
| $25,000 to $34,999 | 9 (5.2%) | 0 (0.0%) |
| $35,000 to $49,999 | 24 (13.9%) | 0 (0.0%) |
| $50,000 to $74,999 | 45 (26.0%) | 21 (67.7%) |
| $75,000 to $99,999 | 15 (8.7%) | 1 (3.2%) |
| $100,000 to $149,999 | 40 (23.1%) | 0 (0.0%) |
| $150,000 or more | 4 (2.3%) | 0 (0.0%) |
| Total | 173 (100.0%) | 31 (100.0%) |
Monthly Housing Cost Tiers in Bergman
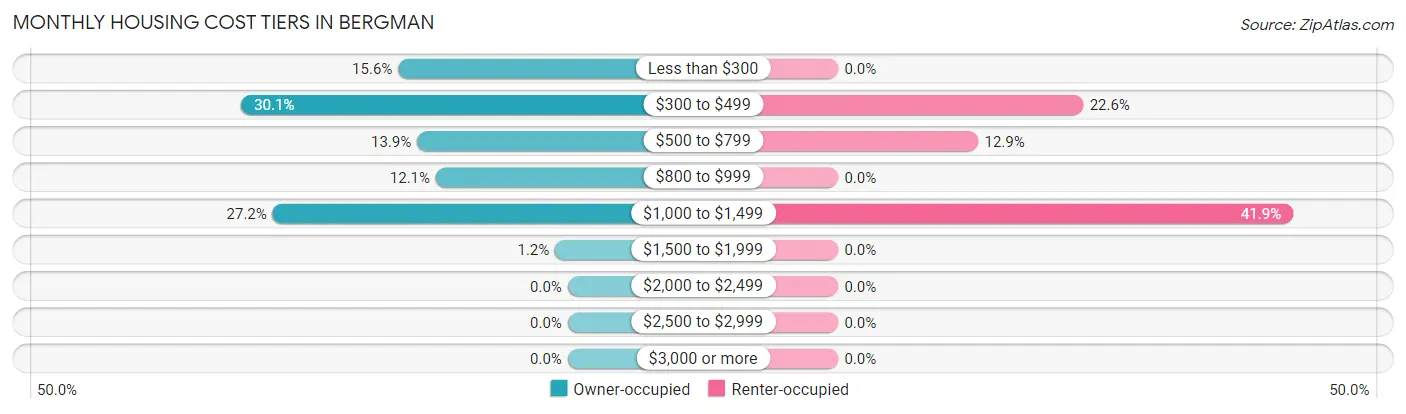
| Monthly Cost | Owner-occupied | Renter-occupied |
| Less than $300 | 27 (15.6%) | 0 (0.0%) |
| $300 to $499 | 52 (30.1%) | 7 (22.6%) |
| $500 to $799 | 24 (13.9%) | 4 (12.9%) |
| $800 to $999 | 21 (12.1%) | 0 (0.0%) |
| $1,000 to $1,499 | 47 (27.2%) | 13 (41.9%) |
| $1,500 to $1,999 | 2 (1.2%) | 0 (0.0%) |
| $2,000 to $2,499 | 0 (0.0%) | 0 (0.0%) |
| $2,500 to $2,999 | 0 (0.0%) | 0 (0.0%) |
| $3,000 or more | 0 (0.0%) | 0 (0.0%) |
| Total | 173 (100.0%) | 31 (100.0%) |
Physical Housing Characteristics in Bergman
Housing Structures in Bergman
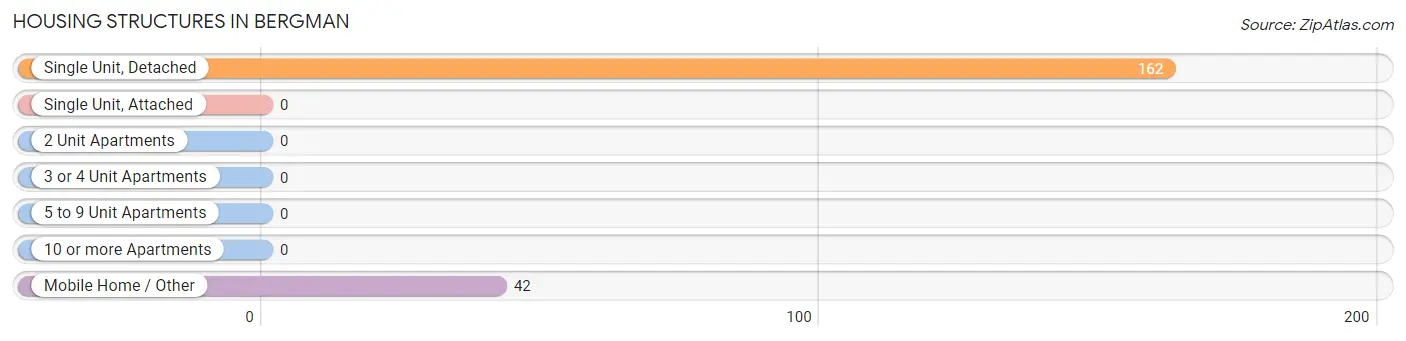
| Structure Type | # Housing Units | % Housing Units |
| Single Unit, Detached | 162 | 79.4% |
| Single Unit, Attached | 0 | 0.0% |
| 2 Unit Apartments | 0 | 0.0% |
| 3 or 4 Unit Apartments | 0 | 0.0% |
| 5 to 9 Unit Apartments | 0 | 0.0% |
| 10 or more Apartments | 0 | 0.0% |
| Mobile Home / Other | 42 | 20.6% |
| Total | 204 | 100.0% |
Housing Structures by Occupancy in Bergman
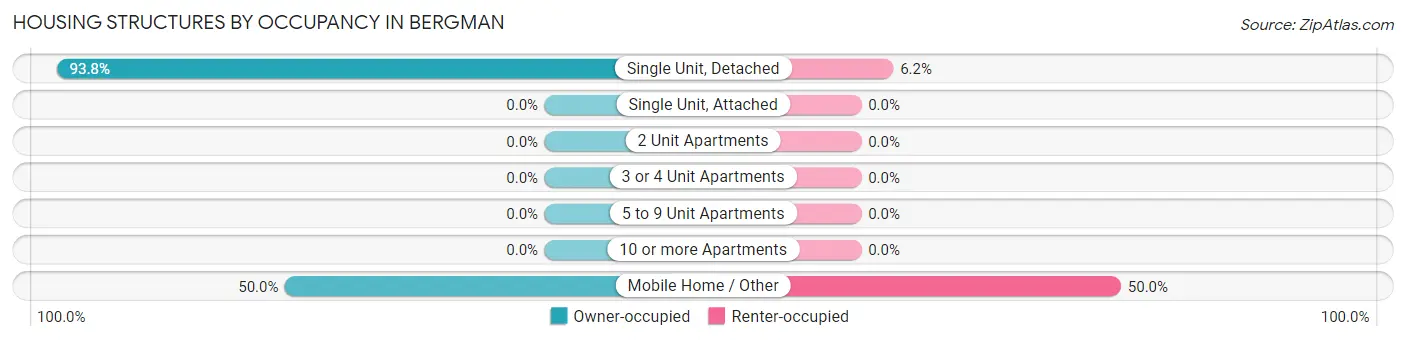
| Structure Type | Owner-occupied | Renter-occupied |
| Single Unit, Detached | 152 (93.8%) | 10 (6.2%) |
| Single Unit, Attached | 0 (0.0%) | 0 (0.0%) |
| 2 Unit Apartments | 0 (0.0%) | 0 (0.0%) |
| 3 or 4 Unit Apartments | 0 (0.0%) | 0 (0.0%) |
| 5 to 9 Unit Apartments | 0 (0.0%) | 0 (0.0%) |
| 10 or more Apartments | 0 (0.0%) | 0 (0.0%) |
| Mobile Home / Other | 21 (50.0%) | 21 (50.0%) |
| Total | 173 (84.8%) | 31 (15.2%) |
Housing Structures by Number of Rooms in Bergman
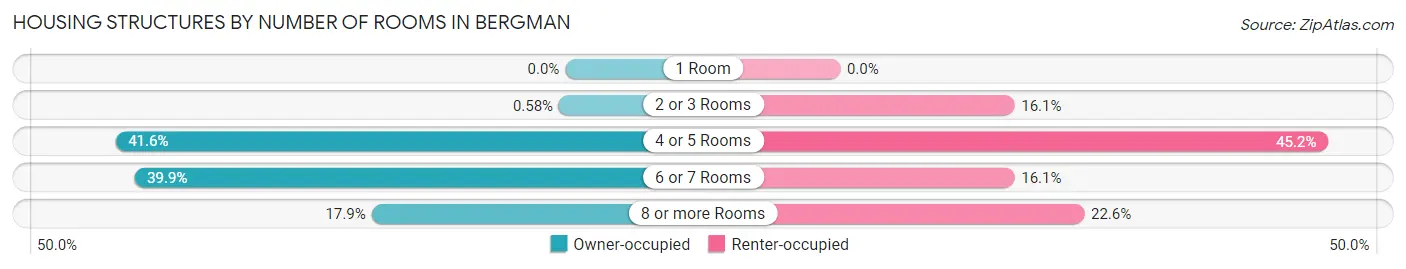
| Number of Rooms | Owner-occupied | Renter-occupied |
| 1 Room | 0 (0.0%) | 0 (0.0%) |
| 2 or 3 Rooms | 1 (0.6%) | 5 (16.1%) |
| 4 or 5 Rooms | 72 (41.6%) | 14 (45.2%) |
| 6 or 7 Rooms | 69 (39.9%) | 5 (16.1%) |
| 8 or more Rooms | 31 (17.9%) | 7 (22.6%) |
| Total | 173 (100.0%) | 31 (100.0%) |
Housing Structure by Heating Type in Bergman
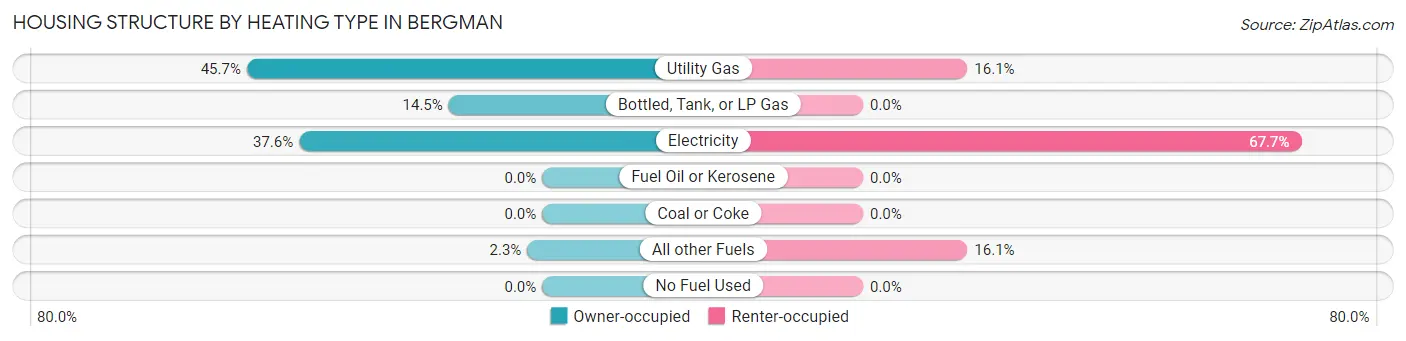
| Heating Type | Owner-occupied | Renter-occupied |
| Utility Gas | 79 (45.7%) | 5 (16.1%) |
| Bottled, Tank, or LP Gas | 25 (14.4%) | 0 (0.0%) |
| Electricity | 65 (37.6%) | 21 (67.7%) |
| Fuel Oil or Kerosene | 0 (0.0%) | 0 (0.0%) |
| Coal or Coke | 0 (0.0%) | 0 (0.0%) |
| All other Fuels | 4 (2.3%) | 5 (16.1%) |
| No Fuel Used | 0 (0.0%) | 0 (0.0%) |
| Total | 173 (100.0%) | 31 (100.0%) |
Household Vehicle Usage in Bergman
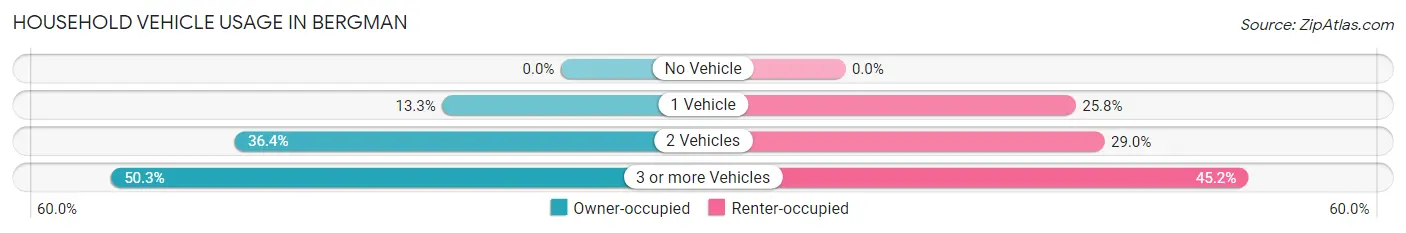
| Vehicles per Household | Owner-occupied | Renter-occupied |
| No Vehicle | 0 (0.0%) | 0 (0.0%) |
| 1 Vehicle | 23 (13.3%) | 8 (25.8%) |
| 2 Vehicles | 63 (36.4%) | 9 (29.0%) |
| 3 or more Vehicles | 87 (50.3%) | 14 (45.2%) |
| Total | 173 (100.0%) | 31 (100.0%) |
Real Estate & Mortgages in Bergman
Real Estate and Mortgage Overview in Bergman
| Characteristic | Without Mortgage | With Mortgage |
| Housing Units | 83 | 90 |
| Median Property Value | $137,500 | $100,000 |
| Median Household Income | $34,688 | $0 |
| Monthly Housing Costs | $351 | $0 |
| Real Estate Taxes | $400 | $2 |
Property Value by Mortgage Status in Bergman
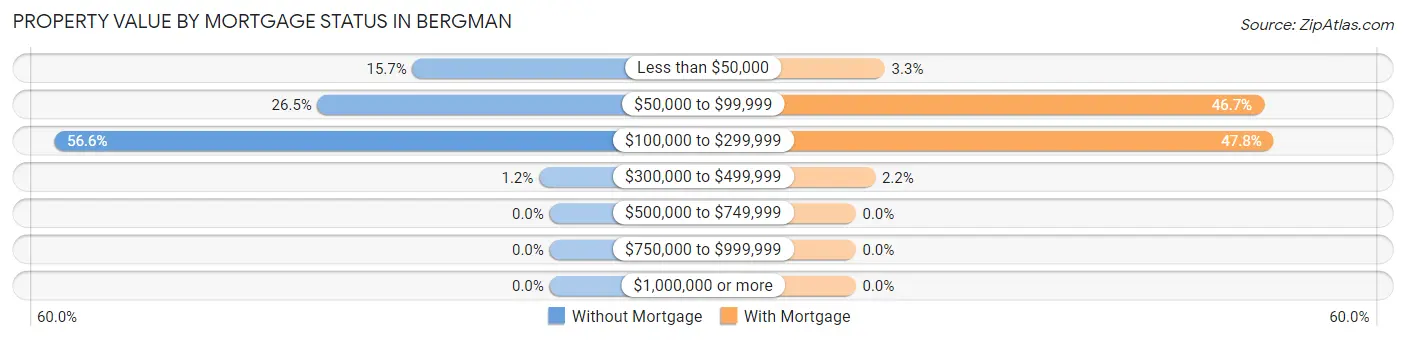
| Property Value | Without Mortgage | With Mortgage |
| Less than $50,000 | 13 (15.7%) | 3 (3.3%) |
| $50,000 to $99,999 | 22 (26.5%) | 42 (46.7%) |
| $100,000 to $299,999 | 47 (56.6%) | 43 (47.8%) |
| $300,000 to $499,999 | 1 (1.2%) | 2 (2.2%) |
| $500,000 to $749,999 | 0 (0.0%) | 0 (0.0%) |
| $750,000 to $999,999 | 0 (0.0%) | 0 (0.0%) |
| $1,000,000 or more | 0 (0.0%) | 0 (0.0%) |
| Total | 83 (100.0%) | 90 (100.0%) |
Household Income by Mortgage Status in Bergman
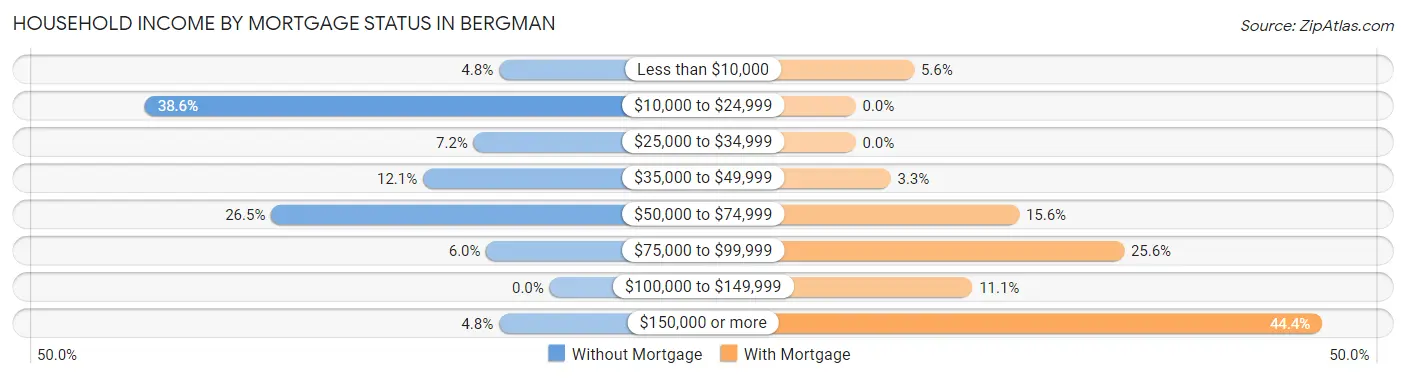
| Household Income | Without Mortgage | With Mortgage |
| Less than $10,000 | 4 (4.8%) | 5 (5.6%) |
| $10,000 to $24,999 | 32 (38.6%) | 0 (0.0%) |
| $25,000 to $34,999 | 6 (7.2%) | 0 (0.0%) |
| $35,000 to $49,999 | 10 (12.0%) | 3 (3.3%) |
| $50,000 to $74,999 | 22 (26.5%) | 14 (15.6%) |
| $75,000 to $99,999 | 5 (6.0%) | 23 (25.6%) |
| $100,000 to $149,999 | 0 (0.0%) | 10 (11.1%) |
| $150,000 or more | 4 (4.8%) | 40 (44.4%) |
| Total | 83 (100.0%) | 90 (100.0%) |
Property Value to Household Income Ratio in Bergman
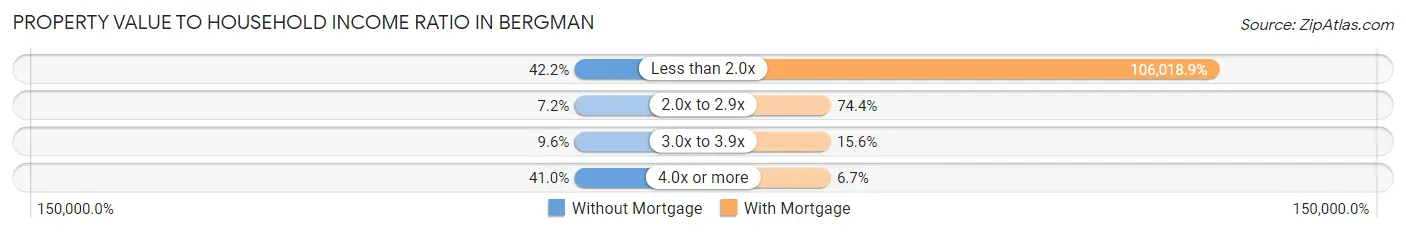
| Value-to-Income Ratio | Without Mortgage | With Mortgage |
| Less than 2.0x | 35 (42.2%) | 95,417 (106,018.9%) |
| 2.0x to 2.9x | 6 (7.2%) | 67 (74.4%) |
| 3.0x to 3.9x | 8 (9.6%) | 14 (15.6%) |
| 4.0x or more | 34 (41.0%) | 6 (6.7%) |
| Total | 83 (100.0%) | 90 (100.0%) |
Real Estate Taxes by Mortgage Status in Bergman
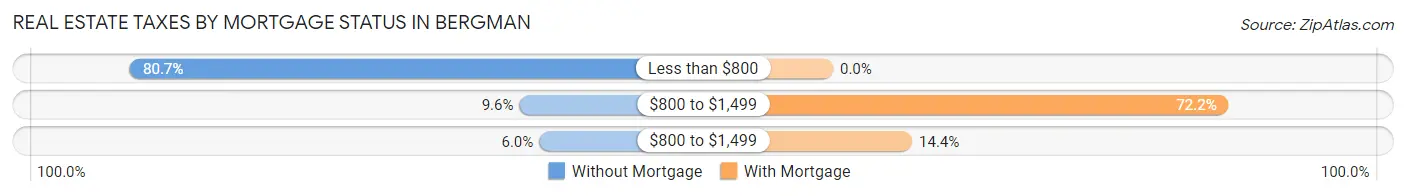
| Property Taxes | Without Mortgage | With Mortgage |
| Less than $800 | 67 (80.7%) | 0 (0.0%) |
| $800 to $1,499 | 8 (9.6%) | 65 (72.2%) |
| $800 to $1,499 | 5 (6.0%) | 13 (14.4%) |
| Total | 83 (100.0%) | 90 (100.0%) |
Health & Disability in Bergman
Health Insurance Coverage by Age in Bergman
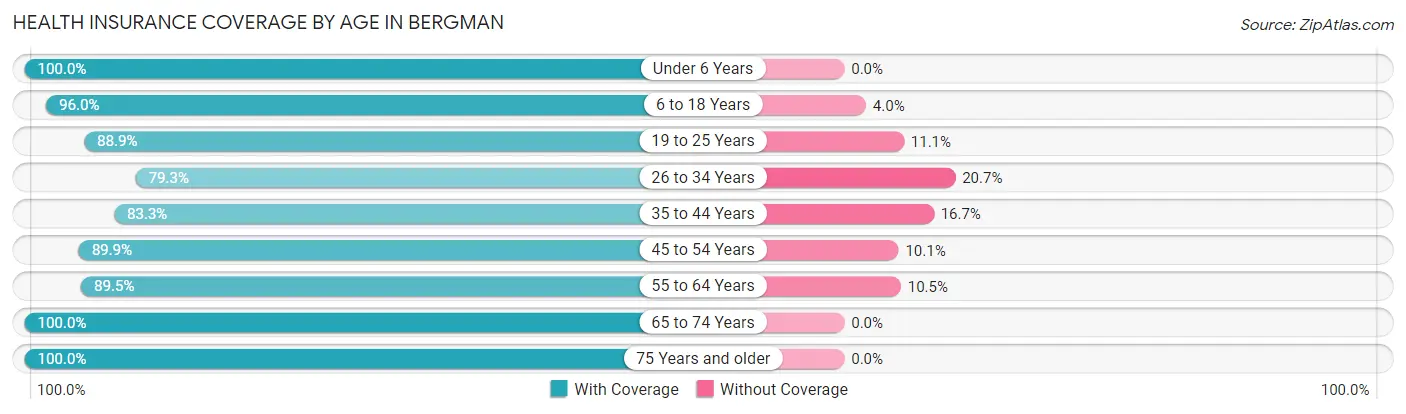
| Age Bracket | With Coverage | Without Coverage |
| Under 6 Years | 51 (100.0%) | 0 (0.0%) |
| 6 to 18 Years | 119 (96.0%) | 5 (4.0%) |
| 19 to 25 Years | 48 (88.9%) | 6 (11.1%) |
| 26 to 34 Years | 69 (79.3%) | 18 (20.7%) |
| 35 to 44 Years | 30 (83.3%) | 6 (16.7%) |
| 45 to 54 Years | 89 (89.9%) | 10 (10.1%) |
| 55 to 64 Years | 85 (89.5%) | 10 (10.5%) |
| 65 to 74 Years | 46 (100.0%) | 0 (0.0%) |
| 75 Years and older | 42 (100.0%) | 0 (0.0%) |
| Total | 579 (91.3%) | 55 (8.7%) |
Health Insurance Coverage by Citizenship Status in Bergman
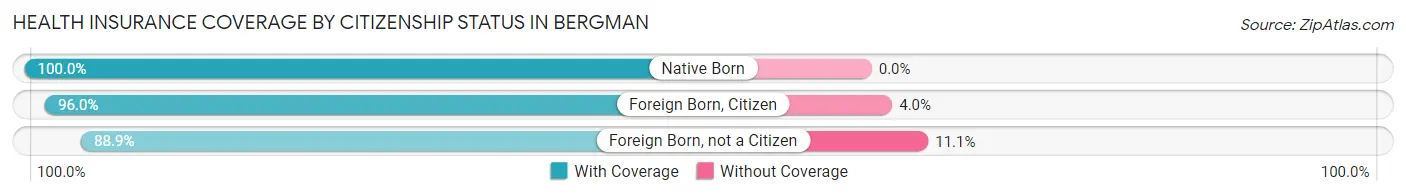
| Citizenship Status | With Coverage | Without Coverage |
| Native Born | 51 (100.0%) | 0 (0.0%) |
| Foreign Born, Citizen | 119 (96.0%) | 5 (4.0%) |
| Foreign Born, not a Citizen | 48 (88.9%) | 6 (11.1%) |
Health Insurance Coverage by Household Income in Bergman
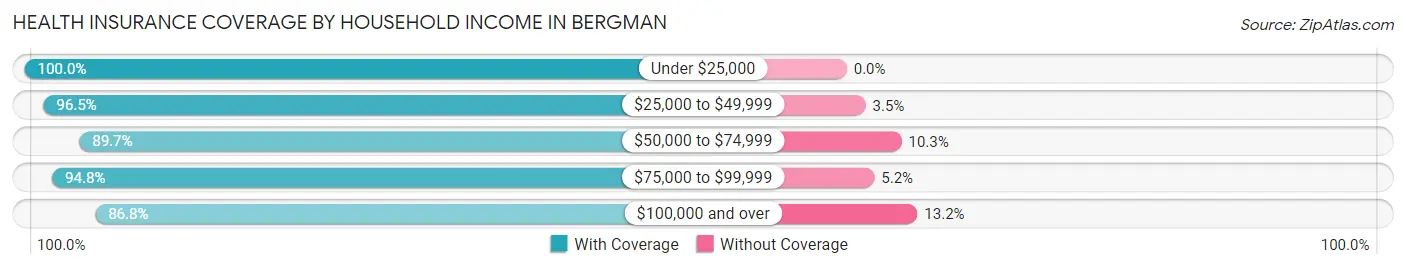
| Household Income | With Coverage | Without Coverage |
| Under $25,000 | 68 (100.0%) | 0 (0.0%) |
| $25,000 to $49,999 | 82 (96.5%) | 3 (3.5%) |
| $50,000 to $74,999 | 210 (89.7%) | 24 (10.3%) |
| $75,000 to $99,999 | 55 (94.8%) | 3 (5.2%) |
| $100,000 and over | 164 (86.8%) | 25 (13.2%) |
Public vs Private Health Insurance Coverage by Age in Bergman
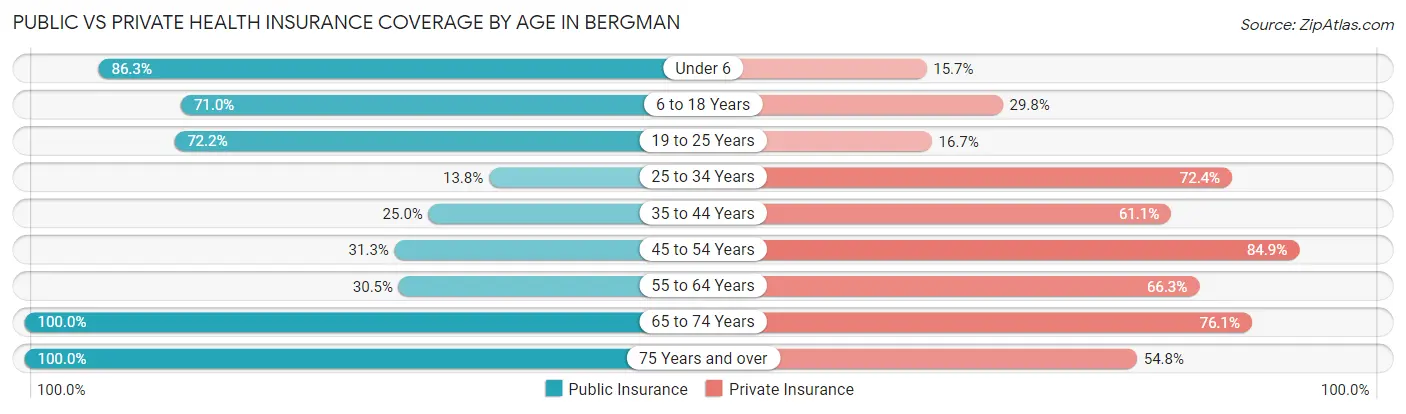
| Age Bracket | Public Insurance | Private Insurance |
| Under 6 | 44 (86.3%) | 8 (15.7%) |
| 6 to 18 Years | 88 (71.0%) | 37 (29.8%) |
| 19 to 25 Years | 39 (72.2%) | 9 (16.7%) |
| 25 to 34 Years | 12 (13.8%) | 63 (72.4%) |
| 35 to 44 Years | 9 (25.0%) | 22 (61.1%) |
| 45 to 54 Years | 31 (31.3%) | 84 (84.9%) |
| 55 to 64 Years | 29 (30.5%) | 63 (66.3%) |
| 65 to 74 Years | 46 (100.0%) | 35 (76.1%) |
| 75 Years and over | 42 (100.0%) | 23 (54.8%) |
| Total | 340 (53.6%) | 344 (54.3%) |
Disability Status by Sex by Age in Bergman
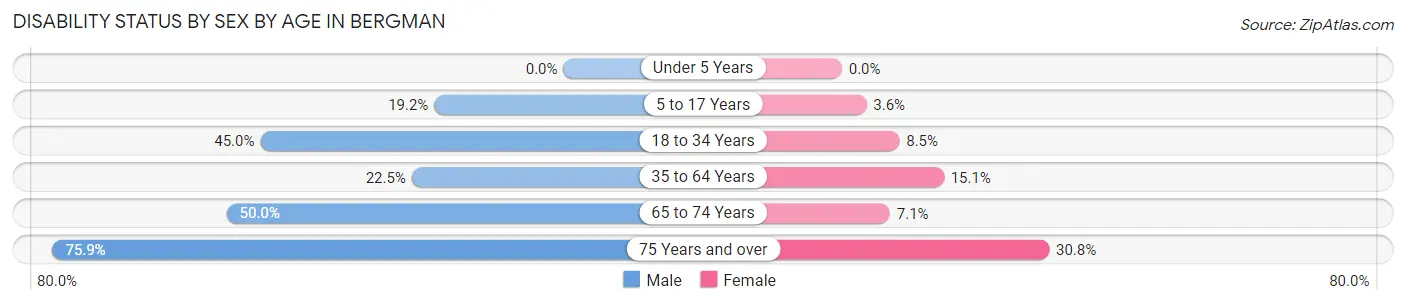
| Age Bracket | Male | Female |
| Under 5 Years | 0 (0.0%) | 0 (0.0%) |
| 5 to 17 Years | 14 (19.2%) | 2 (3.6%) |
| 18 to 34 Years | 27 (45.0%) | 7 (8.5%) |
| 35 to 64 Years | 25 (22.5%) | 18 (15.1%) |
| 65 to 74 Years | 9 (50.0%) | 2 (7.1%) |
| 75 Years and over | 22 (75.9%) | 4 (30.8%) |
Disability Class by Sex by Age in Bergman
Disability Class: Hearing Difficulty
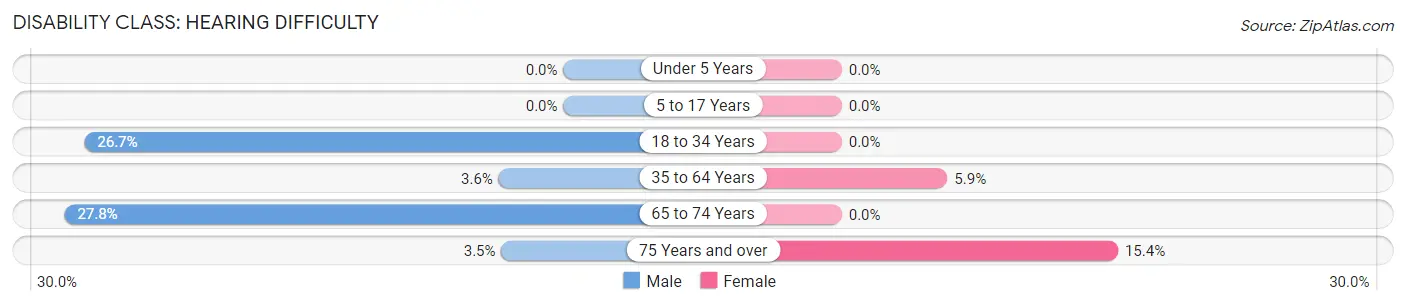
| Age Bracket | Male | Female |
| Under 5 Years | 0 (0.0%) | 0 (0.0%) |
| 5 to 17 Years | 0 (0.0%) | 0 (0.0%) |
| 18 to 34 Years | 16 (26.7%) | 0 (0.0%) |
| 35 to 64 Years | 4 (3.6%) | 7 (5.9%) |
| 65 to 74 Years | 5 (27.8%) | 0 (0.0%) |
| 75 Years and over | 1 (3.5%) | 2 (15.4%) |
Disability Class: Vision Difficulty
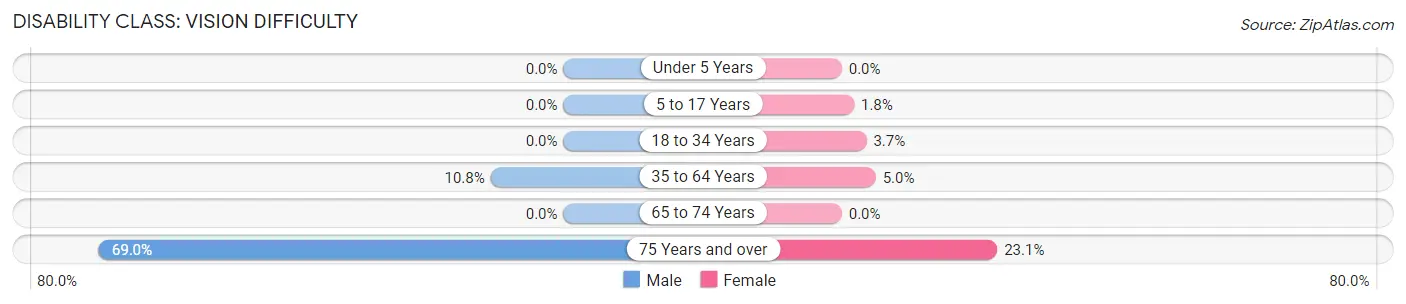
| Age Bracket | Male | Female |
| Under 5 Years | 0 (0.0%) | 0 (0.0%) |
| 5 to 17 Years | 0 (0.0%) | 1 (1.8%) |
| 18 to 34 Years | 0 (0.0%) | 3 (3.7%) |
| 35 to 64 Years | 12 (10.8%) | 6 (5.0%) |
| 65 to 74 Years | 0 (0.0%) | 0 (0.0%) |
| 75 Years and over | 20 (69.0%) | 3 (23.1%) |
Disability Class: Cognitive Difficulty
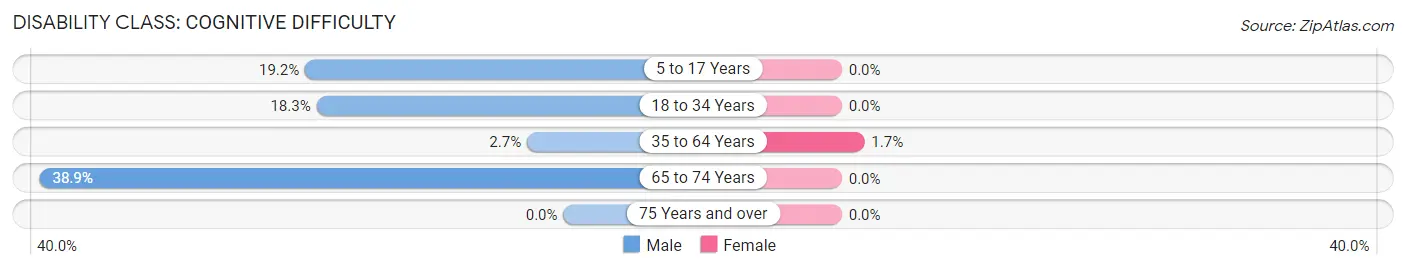
| Age Bracket | Male | Female |
| 5 to 17 Years | 14 (19.2%) | 0 (0.0%) |
| 18 to 34 Years | 11 (18.3%) | 0 (0.0%) |
| 35 to 64 Years | 3 (2.7%) | 2 (1.7%) |
| 65 to 74 Years | 7 (38.9%) | 0 (0.0%) |
| 75 Years and over | 0 (0.0%) | 0 (0.0%) |
Disability Class: Ambulatory Difficulty
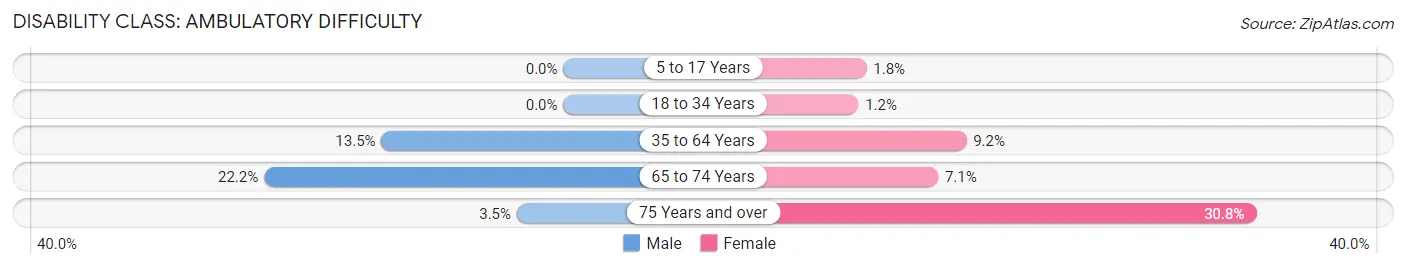
| Age Bracket | Male | Female |
| 5 to 17 Years | 0 (0.0%) | 1 (1.8%) |
| 18 to 34 Years | 0 (0.0%) | 1 (1.2%) |
| 35 to 64 Years | 15 (13.5%) | 11 (9.2%) |
| 65 to 74 Years | 4 (22.2%) | 2 (7.1%) |
| 75 Years and over | 1 (3.5%) | 4 (30.8%) |
Disability Class: Self-Care Difficulty
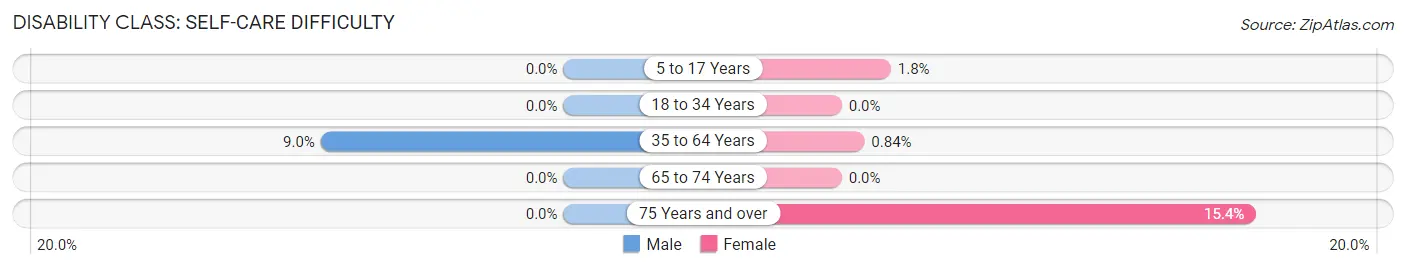
| Age Bracket | Male | Female |
| 5 to 17 Years | 0 (0.0%) | 1 (1.8%) |
| 18 to 34 Years | 0 (0.0%) | 0 (0.0%) |
| 35 to 64 Years | 10 (9.0%) | 1 (0.8%) |
| 65 to 74 Years | 0 (0.0%) | 0 (0.0%) |
| 75 Years and over | 0 (0.0%) | 2 (15.4%) |
Technology Access in Bergman
Computing Device Access in Bergman
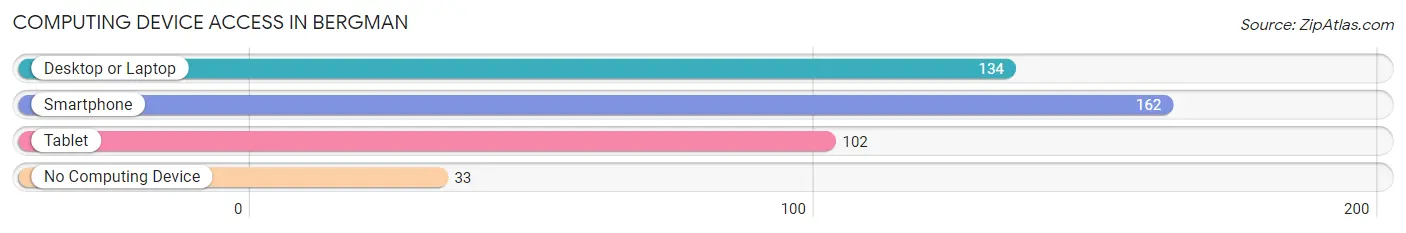
| Device Type | # Households | % Households |
| Desktop or Laptop | 134 | 65.7% |
| Smartphone | 162 | 79.4% |
| Tablet | 102 | 50.0% |
| No Computing Device | 33 | 16.2% |
| Total | 204 | 100.0% |
Internet Access in Bergman
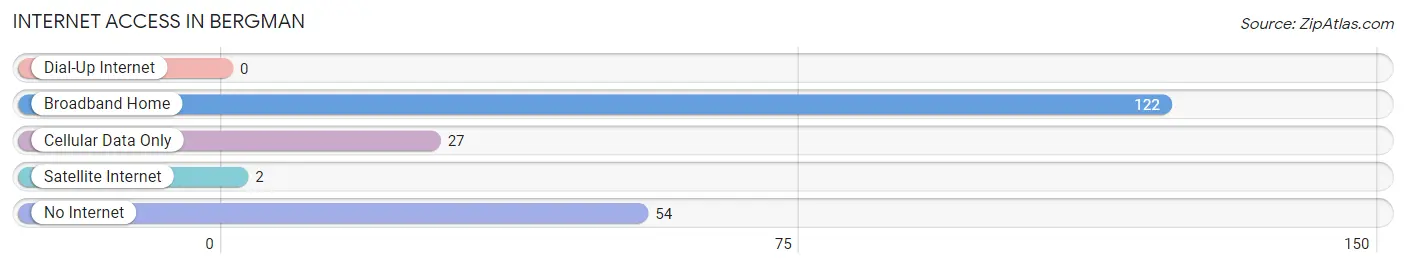
| Internet Type | # Households | % Households |
| Dial-Up Internet | 0 | 0.0% |
| Broadband Home | 122 | 59.8% |
| Cellular Data Only | 27 | 13.2% |
| Satellite Internet | 2 | 1.0% |
| No Internet | 54 | 26.5% |
| Total | 204 | 100.0% |
Bergman Summary
AR History
The history of Arkansas is a long and varied one, stretching back to the earliest days of the United States. The state was first explored by Spanish explorers in the 16th century, and was later claimed by France in the 18th century. The area was ceded to the United States in 1803 as part of the Louisiana Purchase. Arkansas was admitted to the Union as the 25th state in 1836.
The state has a rich history of Native American tribes, including the Quapaw, Caddo, Osage, and Cherokee. These tribes were displaced by European settlers in the 19th century, and many of their descendants still live in the state today.
Arkansas was a slave state before the Civil War, and was the site of several battles during the conflict. After the war, the state was readmitted to the Union in 1868.
In the late 19th century, Arkansas was a major producer of cotton, and the state’s economy was heavily dependent on the crop. The Great Depression of the 1930s hit the state hard, and the economy did not fully recover until after World War II.
In the late 20th century, Arkansas underwent a period of economic and social transformation. The state’s economy diversified, and the population shifted from rural to urban areas. Arkansas also became a major center for the poultry industry, and the state’s tourism industry grew significantly.
Geography
Arkansas is located in the south-central United States, bordered by Missouri to the north, Tennessee and Mississippi to the east, Louisiana to the south, and Texas and Oklahoma to the west. The state is divided into 75 counties, and its capital is Little Rock.
The state is divided into four distinct geographic regions: the Ozark Mountains in the northwest, the Ouachita Mountains in the southwest, the Arkansas River Valley in the center, and the Delta region in the east. The highest point in the state is Mount Magazine, which rises to 2,753 feet (839 m).
The state is home to numerous rivers, including the Arkansas, White, and St. Francis. The Arkansas River is the longest river in the state, and is a major source of hydroelectric power.
Economy
Arkansas’s economy is largely based on agriculture, manufacturing, and services. The state’s major agricultural products include poultry, soybeans, cotton, rice, and hogs. The state is also a major producer of timber, and is home to several large paper mills.
Manufacturing is an important part of the state’s economy, and Arkansas is home to several large companies, including Tyson Foods, J.B. Hunt, and Walmart. The state is also a major center for the aerospace industry, and is home to several military bases.
The state’s service sector is also important, and includes tourism, healthcare, and education. Arkansas is home to several major tourist attractions, including Hot Springs National Park, the Ozark National Forest, and the Buffalo National River.
Demographics
As of 2019, Arkansas had an estimated population of 3.017 million people. The state’s population is largely rural, with the majority of residents living in small towns and rural areas. The largest cities in the state are Little Rock, Fort Smith, Fayetteville, and Springdale.
The state’s population is largely white (77.3%), with African Americans (15.4%), Hispanics (6.2%), and Asians (1.1%) making up the remainder. The state’s median household income is $45,869, and the poverty rate is 17.2%.
Arkansas is home to several major universities, including the University of Arkansas, Arkansas State University, and the University of Central Arkansas. The state is also home to several professional sports teams, including the Arkansas Razorbacks (NCAA Division I), the Arkansas Travelers (minor league baseball), and the Arkansas Diamonds (minor league hockey).
Common Questions
What is Per Capita Income in Bergman?
Per Capita income in Bergman is $23,267.
What is the Median Family Income in Bergman?
Median Family Income in Bergman is $66,071.
What is the Median Household income in Bergman?
Median Household Income in Bergman is $58,977.
What is Income or Wage Gap in Bergman?
Income or Wage Gap in Bergman is 18.2%.
Women in Bergman earn 81.8 cents for every dollar earned by a man.
What is Inequality or Gini Index in Bergman?
Inequality or Gini Index in Bergman is 0.33.
What is the Total Population of Bergman?
Total Population of Bergman is 634.
What is the Total Male Population of Bergman?
Total Male Population of Bergman is 320.
What is the Total Female Population of Bergman?
Total Female Population of Bergman is 314.
What is the Ratio of Males per 100 Females in Bergman?
There are 101.91 Males per 100 Females in Bergman.
What is the Ratio of Females per 100 Males in Bergman?
There are 98.12 Females per 100 Males in Bergman.
What is the Median Population Age in Bergman?
Median Population Age in Bergman is 35.3 Years.
What is the Average Family Size in Bergman
Average Family Size in Bergman is 3.4 People.
What is the Average Household Size in Bergman
Average Household Size in Bergman is 3.1 People.
How Large is the Labor Force in Bergman?
There are 315 People in the Labor Forcein in Bergman.
What is the Percentage of People in the Labor Force in Bergman?
66.9% of People are in the Labor Force in Bergman.
What is the Unemployment Rate in Bergman?
Unemployment Rate in Bergman is 1.0%.