Palestinian Female Disability
COMPARE
Palestinian
Select to Compare
Female Disability
Palestinian Female Disability
11.6%
DISABILITY | FEMALES
99.6/ 100
METRIC RATING
85th/ 347
METRIC RANK
Palestinian Female Disability Correlation Chart
The statistical analysis conducted on geographies consisting of 216,463,404 people shows a weak positive correlation between the proportion of Palestinians and percentage of females with a disability in the United States with a correlation coefficient (R) of 0.267 and weighted average of 11.6%. On average, for every 1% (one percent) increase in Palestinians within a typical geography, there is an increase of 0.39% in percentage of females with a disability.
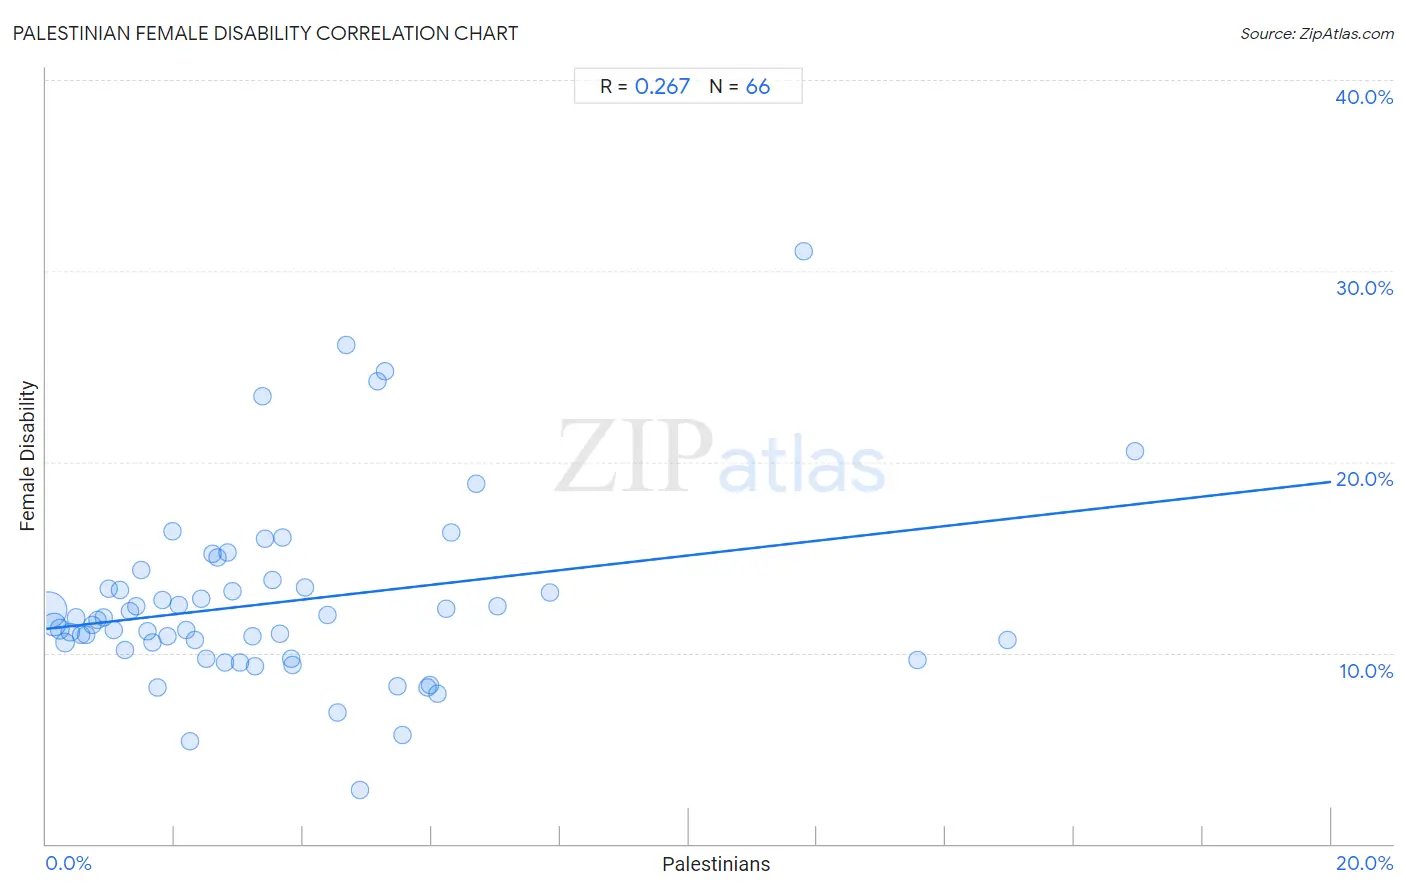
It is essential to understand that the correlation between the percentage of Palestinians and percentage of females with a disability does not imply a direct cause-and-effect relationship. It remains uncertain whether the presence of Palestinians influences an upward or downward trend in the level of percentage of females with a disability within an area, or if Palestinians simply ended up residing in those areas with higher or lower levels of percentage of females with a disability due to other factors.
Demographics Similar to Palestinians by Female Disability
In terms of female disability, the demographic groups most similar to Palestinians are Immigrants from Cameroon (11.6%, a difference of 0.0%), Immigrants from Poland (11.6%, a difference of 0.030%), Immigrants from Serbia (11.6%, a difference of 0.060%), Immigrants from Denmark (11.6%, a difference of 0.070%), and Yup'ik (11.6%, a difference of 0.070%).
| Demographics | Rating | Rank | Female Disability |
| Immigrants from South Africa | 99.7 /100 | #78 | Exceptional 11.5% |
| Sierra Leoneans | 99.7 /100 | #79 | Exceptional 11.5% |
| Immigrants from Jordan | 99.7 /100 | #80 | Exceptional 11.5% |
| Eastern Europeans | 99.7 /100 | #81 | Exceptional 11.5% |
| Luxembourgers | 99.6 /100 | #82 | Exceptional 11.6% |
| Immigrants from Serbia | 99.6 /100 | #83 | Exceptional 11.6% |
| Immigrants from Poland | 99.6 /100 | #84 | Exceptional 11.6% |
| Palestinians | 99.6 /100 | #85 | Exceptional 11.6% |
| Immigrants from Cameroon | 99.6 /100 | #86 | Exceptional 11.6% |
| Immigrants from Denmark | 99.5 /100 | #87 | Exceptional 11.6% |
| Yup'ik | 99.5 /100 | #88 | Exceptional 11.6% |
| Vietnamese | 99.5 /100 | #89 | Exceptional 11.6% |
| Immigrants from Romania | 99.5 /100 | #90 | Exceptional 11.6% |
| Immigrants from Zimbabwe | 99.5 /100 | #91 | Exceptional 11.6% |
| Immigrants from Czechoslovakia | 99.5 /100 | #92 | Exceptional 11.6% |
Palestinian Female Disability Correlation Summary
| Measurement | Palestinian Data | Female Disability Data |
| Minimum | 0.038% | 2.8% |
| Maximum | 16.9% | 31.0% |
| Range | 16.9% | 28.2% |
| Mean | 3.6% | 12.7% |
| Median | 2.8% | 11.6% |
| Interquartile 25% (IQ1) | 1.4% | 10.1% |
| Interquartile 75% (IQ3) | 4.9% | 13.4% |
| Interquartile Range (IQR) | 3.5% | 3.3% |
| Standard Deviation (Sample) | 3.4% | 4.9% |
| Standard Deviation (Population) | 3.4% | 4.8% |
Correlation Details
| Palestinian Percentile | Sample Size | Female Disability |
[ 0.0% - 0.5% ] 0.038% | 136,188,485 | 12.2% |
[ 0.0% - 0.5% ] 0.12% | 42,627,897 | 11.5% |
[ 0.0% - 0.5% ] 0.21% | 12,835,745 | 11.3% |
[ 0.0% - 0.5% ] 0.29% | 7,971,410 | 10.5% |
[ 0.0% - 0.5% ] 0.38% | 4,899,546 | 11.1% |
[ 0.0% - 0.5% ] 0.47% | 2,805,153 | 11.8% |
[ 0.5% - 1.0% ] 0.55% | 1,767,000 | 10.9% |
[ 0.5% - 1.0% ] 0.63% | 1,400,962 | 10.9% |
[ 0.5% - 1.0% ] 0.71% | 1,109,253 | 11.5% |
[ 0.5% - 1.0% ] 0.80% | 494,913 | 11.7% |
[ 0.5% - 1.0% ] 0.90% | 801,883 | 11.9% |
[ 0.5% - 1.0% ] 0.98% | 533,871 | 13.3% |
[ 1.0% - 1.5% ] 1.06% | 381,797 | 11.2% |
[ 1.0% - 1.5% ] 1.14% | 269,854 | 13.3% |
[ 1.0% - 1.5% ] 1.22% | 257,921 | 10.1% |
[ 1.0% - 1.5% ] 1.30% | 452,606 | 12.2% |
[ 1.0% - 1.5% ] 1.40% | 53,323 | 12.4% |
[ 1.0% - 1.5% ] 1.48% | 100,703 | 14.3% |
[ 1.5% - 2.0% ] 1.57% | 210,045 | 11.1% |
[ 1.5% - 2.0% ] 1.65% | 195,446 | 10.6% |
[ 1.5% - 2.0% ] 1.73% | 52,070 | 8.2% |
[ 1.5% - 2.0% ] 1.80% | 69,876 | 12.7% |
[ 1.5% - 2.0% ] 1.89% | 88,001 | 10.9% |
[ 1.5% - 2.0% ] 1.97% | 59,828 | 16.4% |
[ 2.0% - 2.5% ] 2.06% | 104,816 | 12.5% |
[ 2.0% - 2.5% ] 2.18% | 37,319 | 11.2% |
[ 2.0% - 2.5% ] 2.24% | 11,815 | 5.4% |
[ 2.0% - 2.5% ] 2.32% | 42,595 | 10.7% |
[ 2.0% - 2.5% ] 2.41% | 91,580 | 12.9% |
[ 2.0% - 2.5% ] 2.50% | 76,650 | 9.7% |
[ 2.5% - 3.0% ] 2.60% | 14,176 | 15.2% |
[ 2.5% - 3.0% ] 2.66% | 10,859 | 15.0% |
[ 2.5% - 3.0% ] 2.79% | 2,508 | 9.5% |
[ 2.5% - 3.0% ] 2.82% | 7,946 | 15.3% |
[ 2.5% - 3.0% ] 2.91% | 22,318 | 13.2% |
[ 3.0% - 3.5% ] 3.02% | 34,224 | 9.5% |
[ 3.0% - 3.5% ] 3.21% | 68,870 | 10.9% |
[ 3.0% - 3.5% ] 3.24% | 2,222 | 9.3% |
[ 3.0% - 3.5% ] 3.37% | 4,830 | 23.4% |
[ 3.0% - 3.5% ] 3.40% | 36,556 | 16.0% |
[ 3.5% - 4.0% ] 3.53% | 14,360 | 13.8% |
[ 3.5% - 4.0% ] 3.64% | 43,709 | 11.0% |
[ 3.5% - 4.0% ] 3.68% | 2,090 | 16.0% |
[ 3.5% - 4.0% ] 3.81% | 4,018 | 9.7% |
[ 3.5% - 4.0% ] 3.83% | 8,065 | 9.4% |
[ 4.0% - 4.5% ] 4.03% | 23,437 | 13.4% |
[ 4.0% - 4.5% ] 4.37% | 5,121 | 12.0% |
[ 4.5% - 5.0% ] 4.53% | 11,787 | 6.9% |
[ 4.5% - 5.0% ] 4.66% | 794 | 26.1% |
[ 4.5% - 5.0% ] 4.89% | 3,050 | 2.8% |
[ 5.0% - 5.5% ] 5.16% | 3,447 | 24.2% |
[ 5.0% - 5.5% ] 5.27% | 3,379 | 24.7% |
[ 5.0% - 5.5% ] 5.47% | 4,222 | 8.2% |
[ 5.5% - 6.0% ] 5.54% | 2,059 | 5.7% |
[ 5.5% - 6.0% ] 5.93% | 26,198 | 8.2% |
[ 5.5% - 6.0% ] 5.98% | 14,915 | 8.3% |
[ 6.0% - 6.5% ] 6.09% | 14,650 | 7.9% |
[ 6.0% - 6.5% ] 6.22% | 46,933 | 12.3% |
[ 6.0% - 6.5% ] 6.31% | 16,939 | 16.3% |
[ 6.5% - 7.0% ] 6.70% | 2,970 | 18.9% |
[ 7.0% - 7.5% ] 7.03% | 5,022 | 12.4% |
[ 7.5% - 8.0% ] 7.84% | 1,428 | 13.2% |
[ 11.5% - 12.0% ] 11.79% | 212 | 31.0% |
[ 13.5% - 14.0% ] 13.56% | 826 | 9.7% |
[ 14.5% - 15.0% ] 14.95% | 6,842 | 10.7% |
[ 16.5% - 17.0% ] 16.95% | 59 | 20.6% |