Palestinian vs Immigrants from Vietnam Married-Couple Family Poverty
COMPARE
Palestinian
Immigrants from Vietnam
Married-Couple Family Poverty
Married-Couple Family Poverty Comparison
Palestinians
Immigrants from Vietnam
4.9%
MARRIED-COUPLE FAMILY POVERTY
91.2/ 100
METRIC RATING
128th/ 347
METRIC RANK
5.3%
MARRIED-COUPLE FAMILY POVERTY
37.7/ 100
METRIC RATING
182nd/ 347
METRIC RANK
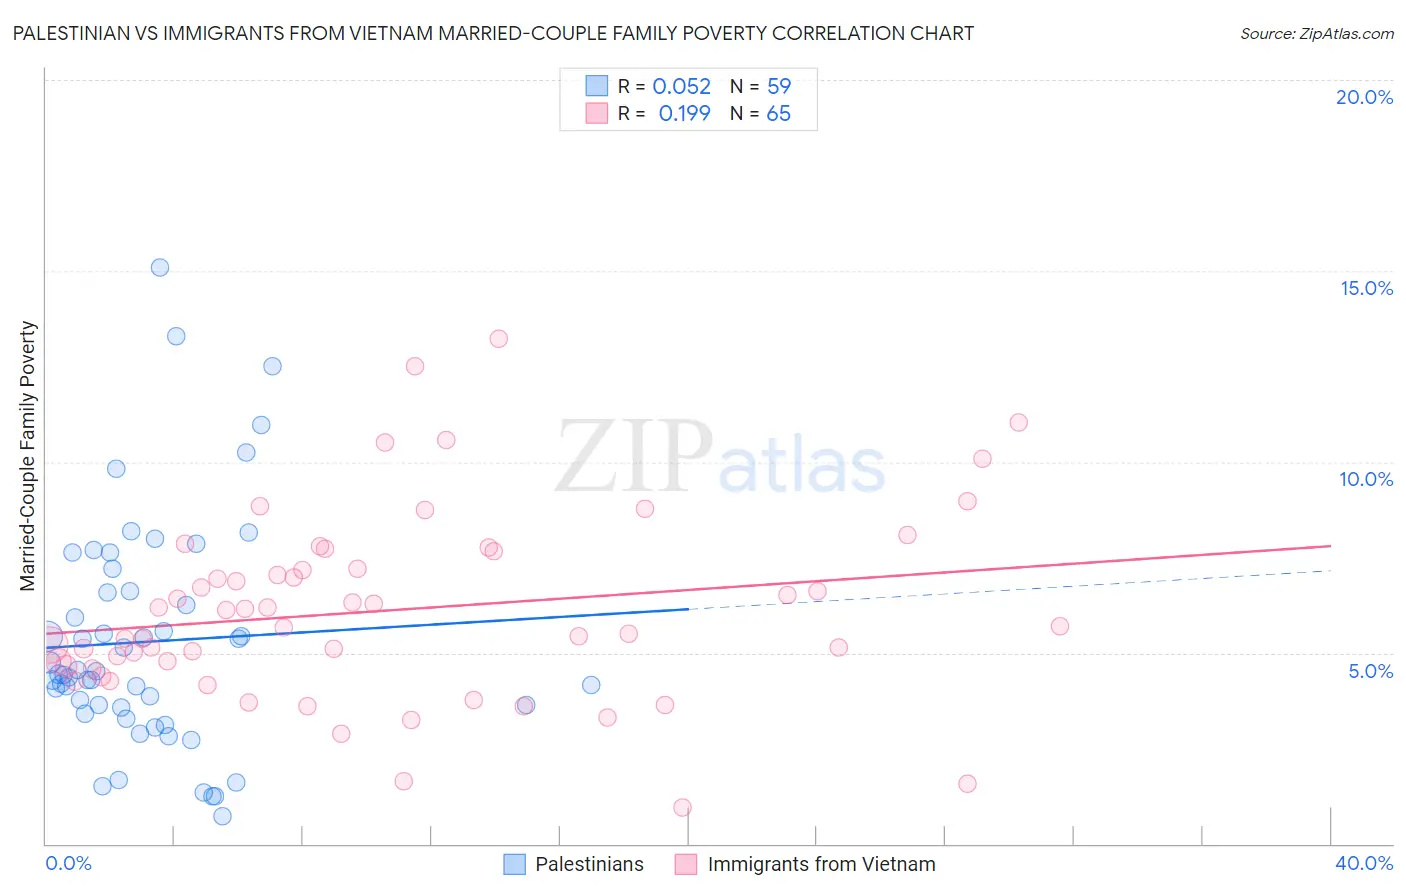
Palestinian vs Immigrants from Vietnam Married-Couple Family Poverty Correlation Chart
The statistical analysis conducted on geographies consisting of 215,628,863 people shows a slight positive correlation between the proportion of Palestinians and poverty level among married-couple families in the United States with a correlation coefficient (R) of 0.052 and weighted average of 4.9%. Similarly, the statistical analysis conducted on geographies consisting of 401,742,374 people shows a poor positive correlation between the proportion of Immigrants from Vietnam and poverty level among married-couple families in the United States with a correlation coefficient (R) of 0.199 and weighted average of 5.3%, a difference of 8.9%.
Married-Couple Family Poverty Correlation Summary
| Measurement | Palestinian | Immigrants from Vietnam |
| Minimum | 0.73% | 0.96% |
| Maximum | 15.1% | 13.2% |
| Range | 14.3% | 12.3% |
| Mean | 5.3% | 6.1% |
| Median | 4.4% | 5.7% |
| Interquartile 25% (IQ1) | 3.6% | 4.6% |
| Interquartile 75% (IQ3) | 6.6% | 7.4% |
| Interquartile Range (IQR) | 3.0% | 2.8% |
| Standard Deviation (Sample) | 3.0% | 2.4% |
| Standard Deviation (Population) | 3.0% | 2.4% |
Similar Demographics by Married-Couple Family Poverty
Demographics Similar to Palestinians by Married-Couple Family Poverty
In terms of married-couple family poverty, the demographic groups most similar to Palestinians are Immigrants from Pakistan (4.9%, a difference of 0.20%), Soviet Union (4.9%, a difference of 0.21%), Immigrants from Eastern Europe (4.9%, a difference of 0.28%), Puget Sound Salish (4.9%, a difference of 0.29%), and Egyptian (4.8%, a difference of 0.32%).
| Demographics | Rating | Rank | Married-Couple Family Poverty |
| Indians (Asian) | 93.2 /100 | #121 | Exceptional 4.8% |
| Whites/Caucasians | 93.1 /100 | #122 | Exceptional 4.8% |
| Jordanians | 93.1 /100 | #123 | Exceptional 4.8% |
| Romanians | 92.5 /100 | #124 | Exceptional 4.8% |
| Immigrants | Bosnia and Herzegovina | 92.5 /100 | #125 | Exceptional 4.8% |
| Immigrants | Asia | 92.3 /100 | #126 | Exceptional 4.8% |
| Egyptians | 92.0 /100 | #127 | Exceptional 4.8% |
| Palestinians | 91.2 /100 | #128 | Exceptional 4.9% |
| Immigrants | Pakistan | 90.7 /100 | #129 | Exceptional 4.9% |
| Soviet Union | 90.7 /100 | #130 | Exceptional 4.9% |
| Immigrants | Eastern Europe | 90.5 /100 | #131 | Exceptional 4.9% |
| Puget Sound Salish | 90.4 /100 | #132 | Exceptional 4.9% |
| Immigrants | Kenya | 90.2 /100 | #133 | Exceptional 4.9% |
| Samoans | 90.2 /100 | #134 | Exceptional 4.9% |
| Assyrians/Chaldeans/Syriacs | 89.4 /100 | #135 | Excellent 4.9% |
Demographics Similar to Immigrants from Vietnam by Married-Couple Family Poverty
In terms of married-couple family poverty, the demographic groups most similar to Immigrants from Vietnam are Peruvian (5.3%, a difference of 0.010%), Immigrants from Chile (5.3%, a difference of 0.13%), Immigrants from Sierra Leone (5.3%, a difference of 0.18%), Nonimmigrants (5.3%, a difference of 0.24%), and American (5.3%, a difference of 0.29%).
| Demographics | Rating | Rank | Married-Couple Family Poverty |
| Marshallese | 47.9 /100 | #175 | Average 5.2% |
| Menominee | 47.8 /100 | #176 | Average 5.2% |
| Immigrants | Kazakhstan | 45.1 /100 | #177 | Average 5.2% |
| Immigrants | Ukraine | 44.9 /100 | #178 | Average 5.2% |
| Spanish | 41.4 /100 | #179 | Average 5.3% |
| Immigrants | Sierra Leone | 39.3 /100 | #180 | Fair 5.3% |
| Immigrants | Chile | 38.8 /100 | #181 | Fair 5.3% |
| Immigrants | Vietnam | 37.7 /100 | #182 | Fair 5.3% |
| Peruvians | 37.6 /100 | #183 | Fair 5.3% |
| Immigrants | Nonimmigrants | 35.8 /100 | #184 | Fair 5.3% |
| Americans | 35.4 /100 | #185 | Fair 5.3% |
| Hungarians | 34.7 /100 | #186 | Fair 5.3% |
| Immigrants | Albania | 33.8 /100 | #187 | Fair 5.3% |
| Israelis | 33.1 /100 | #188 | Fair 5.3% |
| South American Indians | 32.5 /100 | #189 | Fair 5.3% |