Palestinian Disability Age 5 to 17
COMPARE
Palestinian
Select to Compare
Disability Age 5 to 17
Palestinian Disability Age 5 to 17
5.2%
DISABILITY | AGE 5 TO 17
99.8/ 100
METRIC RATING
66th/ 347
METRIC RANK
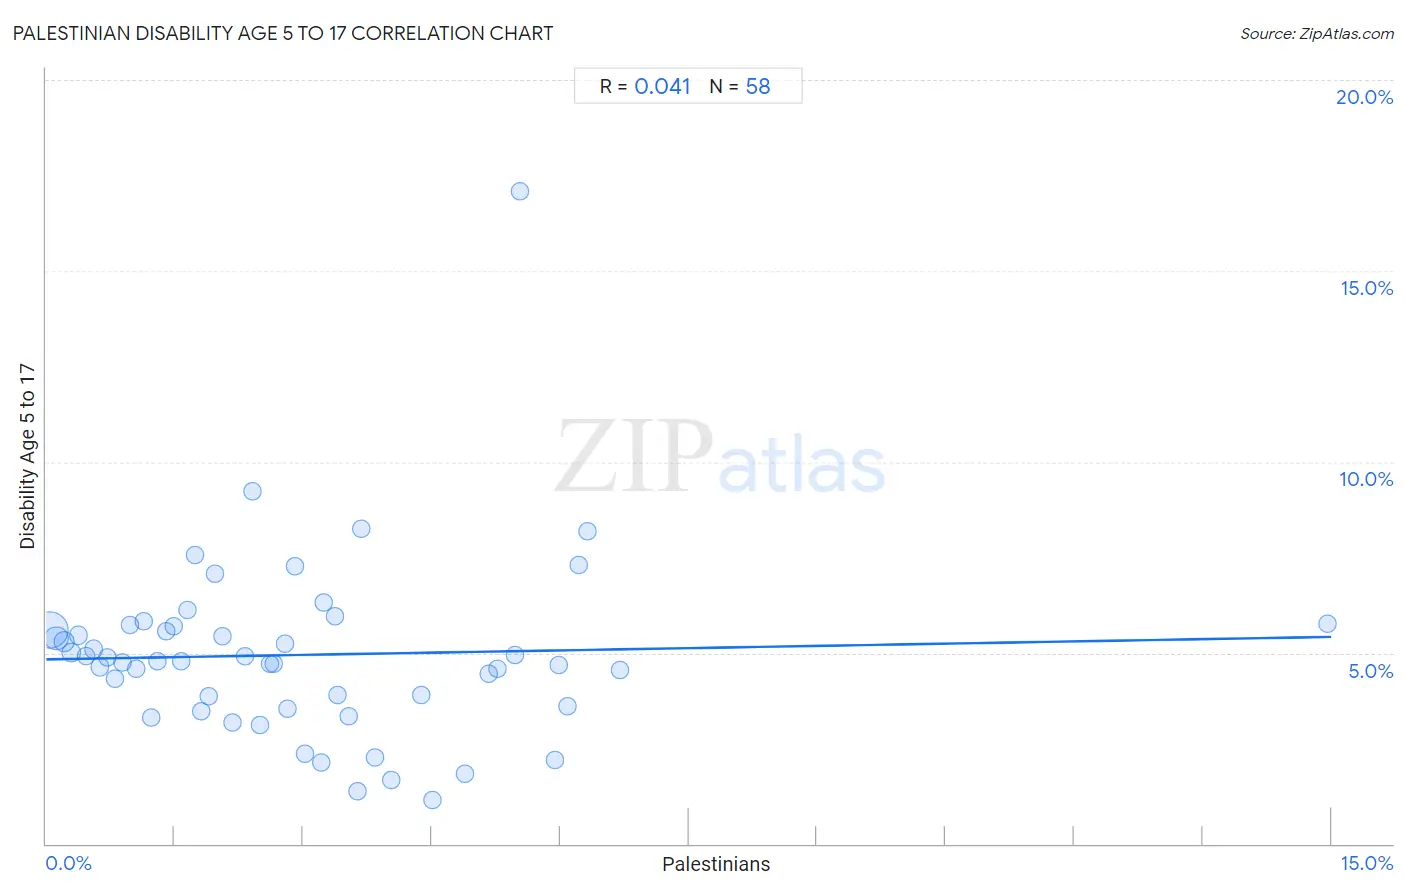
Palestinian Disability Age 5 to 17 Correlation Chart
The statistical analysis conducted on geographies consisting of 215,847,606 people shows no correlation between the proportion of Palestinians and percentage of population with a disability between the ages 5 and 17 in the United States with a correlation coefficient (R) of 0.041 and weighted average of 5.2%. On average, for every 1% (one percent) increase in Palestinians within a typical geography, there is an increase of 0.039% in percentage of population with a disability between the ages 5 and 17.
It is essential to understand that the correlation between the percentage of Palestinians and percentage of population with a disability between the ages 5 and 17 does not imply a direct cause-and-effect relationship. It remains uncertain whether the presence of Palestinians influences an upward or downward trend in the level of percentage of population with a disability between the ages 5 and 17 within an area, or if Palestinians simply ended up residing in those areas with higher or lower levels of percentage of population with a disability between the ages 5 and 17 due to other factors.
Demographics Similar to Palestinians by Disability Age 5 to 17
In terms of disability age 5 to 17, the demographic groups most similar to Palestinians are Macedonian (5.2%, a difference of 0.030%), Immigrants from Greece (5.2%, a difference of 0.040%), Immigrants from South Eastern Asia (5.2%, a difference of 0.060%), Immigrants from Bangladesh (5.2%, a difference of 0.090%), and Immigrants from Syria (5.2%, a difference of 0.17%).
| Demographics | Rating | Rank | Disability Age 5 to 17 |
| Immigrants from North Macedonia | 99.9 /100 | #59 | Exceptional 5.1% |
| Immigrants from Eastern Europe | 99.9 /100 | #60 | Exceptional 5.1% |
| Immigrants from Switzerland | 99.8 /100 | #61 | Exceptional 5.2% |
| Immigrants from Ireland | 99.8 /100 | #62 | Exceptional 5.2% |
| Immigrants from Bangladesh | 99.8 /100 | #63 | Exceptional 5.2% |
| Immigrants from South Eastern Asia | 99.8 /100 | #64 | Exceptional 5.2% |
| Immigrants from Greece | 99.8 /100 | #65 | Exceptional 5.2% |
| Palestinians | 99.8 /100 | #66 | Exceptional 5.2% |
| Macedonians | 99.8 /100 | #67 | Exceptional 5.2% |
| Immigrants from Syria | 99.7 /100 | #68 | Exceptional 5.2% |
| Guyanese | 99.7 /100 | #69 | Exceptional 5.2% |
| Immigrants from Belgium | 99.7 /100 | #70 | Exceptional 5.2% |
| Jordanians | 99.7 /100 | #71 | Exceptional 5.2% |
| Immigrants from Vietnam | 99.7 /100 | #72 | Exceptional 5.2% |
| Immigrants from Czechoslovakia | 99.7 /100 | #73 | Exceptional 5.2% |
Palestinian Disability Age 5 to 17 Correlation Summary
| Measurement | Palestinian Data | Disability Age 5 to 17 Data |
| Minimum | 0.038% | 1.1% |
| Maximum | 15.0% | 17.1% |
| Range | 14.9% | 15.9% |
| Mean | 3.0% | 4.9% |
| Median | 2.6% | 4.8% |
| Interquartile 25% (IQ1) | 1.2% | 3.6% |
| Interquartile 75% (IQ3) | 4.0% | 5.7% |
| Interquartile Range (IQR) | 2.8% | 2.1% |
| Standard Deviation (Sample) | 2.5% | 2.4% |
| Standard Deviation (Population) | 2.4% | 2.3% |
Correlation Details
| Palestinian Percentile | Sample Size | Disability Age 5 to 17 |
[ 0.0% - 0.5% ] 0.038% | 136,114,603 | 5.6% |
[ 0.0% - 0.5% ] 0.12% | 42,474,823 | 5.4% |
[ 0.0% - 0.5% ] 0.21% | 12,733,294 | 5.3% |
[ 0.0% - 0.5% ] 0.29% | 7,899,160 | 5.0% |
[ 0.0% - 0.5% ] 0.38% | 4,858,571 | 5.5% |
[ 0.0% - 0.5% ] 0.47% | 2,792,971 | 4.9% |
[ 0.5% - 1.0% ] 0.55% | 1,739,047 | 5.1% |
[ 0.5% - 1.0% ] 0.63% | 1,380,541 | 4.6% |
[ 0.5% - 1.0% ] 0.71% | 1,103,478 | 4.9% |
[ 0.5% - 1.0% ] 0.80% | 489,907 | 4.3% |
[ 0.5% - 1.0% ] 0.90% | 801,883 | 4.7% |
[ 0.5% - 1.0% ] 0.98% | 507,807 | 5.7% |
[ 1.0% - 1.5% ] 1.06% | 374,867 | 4.6% |
[ 1.0% - 1.5% ] 1.14% | 255,439 | 5.8% |
[ 1.0% - 1.5% ] 1.22% | 257,921 | 3.3% |
[ 1.0% - 1.5% ] 1.30% | 452,606 | 4.8% |
[ 1.0% - 1.5% ] 1.40% | 53,323 | 5.6% |
[ 1.0% - 1.5% ] 1.48% | 96,359 | 5.7% |
[ 1.5% - 2.0% ] 1.57% | 208,829 | 4.8% |
[ 1.5% - 2.0% ] 1.65% | 194,856 | 6.1% |
[ 1.5% - 2.0% ] 1.73% | 51,108 | 7.6% |
[ 1.5% - 2.0% ] 1.80% | 69,876 | 3.5% |
[ 1.5% - 2.0% ] 1.89% | 79,774 | 3.9% |
[ 1.5% - 2.0% ] 1.97% | 59,828 | 7.1% |
[ 2.0% - 2.5% ] 2.06% | 103,440 | 5.4% |
[ 2.0% - 2.5% ] 2.18% | 37,319 | 3.2% |
[ 2.0% - 2.5% ] 2.33% | 36,543 | 4.9% |
[ 2.0% - 2.5% ] 2.41% | 91,289 | 9.2% |
[ 2.0% - 2.5% ] 2.50% | 76,650 | 3.1% |
[ 2.5% - 3.0% ] 2.61% | 11,084 | 4.7% |
[ 2.5% - 3.0% ] 2.66% | 10,859 | 4.7% |
[ 2.5% - 3.0% ] 2.79% | 2,508 | 5.2% |
[ 2.5% - 3.0% ] 2.82% | 7,946 | 3.5% |
[ 2.5% - 3.0% ] 2.91% | 22,318 | 7.3% |
[ 3.0% - 3.5% ] 3.02% | 33,887 | 2.4% |
[ 3.0% - 3.5% ] 3.21% | 68,870 | 2.1% |
[ 3.0% - 3.5% ] 3.24% | 2,222 | 6.3% |
[ 3.0% - 3.5% ] 3.37% | 4,830 | 6.0% |
[ 3.0% - 3.5% ] 3.40% | 36,556 | 3.9% |
[ 3.5% - 4.0% ] 3.53% | 14,360 | 3.3% |
[ 3.5% - 4.0% ] 3.64% | 43,709 | 1.4% |
[ 3.5% - 4.0% ] 3.68% | 2,090 | 8.2% |
[ 3.5% - 4.0% ] 3.83% | 8,065 | 2.2% |
[ 4.0% - 4.5% ] 4.03% | 23,437 | 1.7% |
[ 4.0% - 4.5% ] 4.37% | 5,121 | 3.9% |
[ 4.5% - 5.0% ] 4.51% | 8,028 | 1.1% |
[ 4.5% - 5.0% ] 4.89% | 3,050 | 1.8% |
[ 5.0% - 5.5% ] 5.16% | 3,447 | 4.4% |
[ 5.0% - 5.5% ] 5.27% | 3,379 | 4.6% |
[ 5.0% - 5.5% ] 5.47% | 4,222 | 4.9% |
[ 5.5% - 6.0% ] 5.54% | 2,059 | 17.1% |
[ 5.5% - 6.0% ] 5.93% | 26,198 | 2.2% |
[ 5.5% - 6.0% ] 5.98% | 14,915 | 4.7% |
[ 6.0% - 6.5% ] 6.09% | 14,650 | 3.6% |
[ 6.0% - 6.5% ] 6.22% | 46,933 | 7.3% |
[ 6.0% - 6.5% ] 6.31% | 16,939 | 8.2% |
[ 6.5% - 7.0% ] 6.70% | 2,970 | 4.5% |
[ 14.5% - 15.0% ] 14.95% | 6,842 | 5.8% |