Immigrants from Taiwan vs Nonimmigrants Married-Couple Family Poverty
COMPARE
Immigrants from Taiwan
Nonimmigrants
Married-Couple Family Poverty
Married-Couple Family Poverty Comparison
Immigrants from Taiwan
Nonimmigrants
4.1%
MARRIED-COUPLE FAMILY POVERTY
99.9/ 100
METRIC RATING
25th/ 347
METRIC RANK
5.3%
MARRIED-COUPLE FAMILY POVERTY
35.8/ 100
METRIC RATING
184th/ 347
METRIC RANK
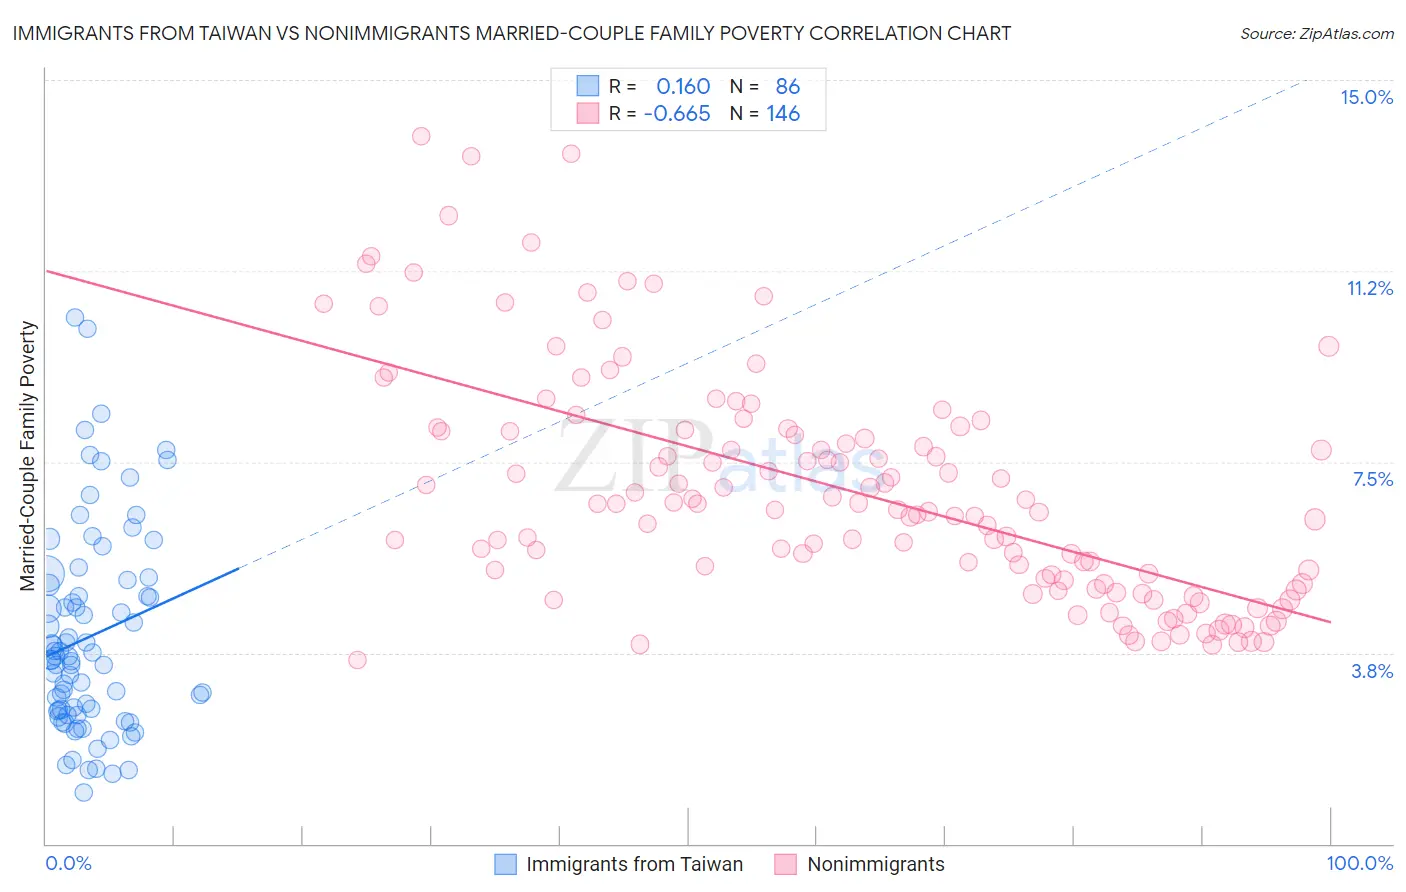
Immigrants from Taiwan vs Nonimmigrants Married-Couple Family Poverty Correlation Chart
The statistical analysis conducted on geographies consisting of 295,998,361 people shows a poor positive correlation between the proportion of Immigrants from Taiwan and poverty level among married-couple families in the United States with a correlation coefficient (R) of 0.160 and weighted average of 4.1%. Similarly, the statistical analysis conducted on geographies consisting of 567,493,090 people shows a significant negative correlation between the proportion of Nonimmigrants and poverty level among married-couple families in the United States with a correlation coefficient (R) of -0.665 and weighted average of 5.3%, a difference of 28.5%.
Married-Couple Family Poverty Correlation Summary
| Measurement | Immigrants from Taiwan | Nonimmigrants |
| Minimum | 1.0% | 3.6% |
| Maximum | 10.3% | 13.9% |
| Range | 9.3% | 10.3% |
| Mean | 4.1% | 6.9% |
| Median | 3.6% | 6.6% |
| Interquartile 25% (IQ1) | 2.6% | 5.1% |
| Interquartile 75% (IQ3) | 5.1% | 8.1% |
| Interquartile Range (IQR) | 2.5% | 3.0% |
| Standard Deviation (Sample) | 2.0% | 2.3% |
| Standard Deviation (Population) | 2.0% | 2.2% |
Similar Demographics by Married-Couple Family Poverty
Demographics Similar to Immigrants from Taiwan by Married-Couple Family Poverty
In terms of married-couple family poverty, the demographic groups most similar to Immigrants from Taiwan are Cypriot (4.1%, a difference of 0.27%), Danish (4.1%, a difference of 0.38%), Scandinavian (4.1%, a difference of 0.49%), Immigrants from Scotland (4.2%, a difference of 0.53%), and Eastern European (4.1%, a difference of 0.57%).
| Demographics | Rating | Rank | Married-Couple Family Poverty |
| Italians | 100.0 /100 | #18 | Exceptional 4.0% |
| Immigrants | Ireland | 99.9 /100 | #19 | Exceptional 4.1% |
| Maltese | 99.9 /100 | #20 | Exceptional 4.1% |
| Zimbabweans | 99.9 /100 | #21 | Exceptional 4.1% |
| Immigrants | Singapore | 99.9 /100 | #22 | Exceptional 4.1% |
| Bhutanese | 99.9 /100 | #23 | Exceptional 4.1% |
| Eastern Europeans | 99.9 /100 | #24 | Exceptional 4.1% |
| Immigrants | Taiwan | 99.9 /100 | #25 | Exceptional 4.1% |
| Cypriots | 99.9 /100 | #26 | Exceptional 4.1% |
| Danes | 99.9 /100 | #27 | Exceptional 4.1% |
| Scandinavians | 99.9 /100 | #28 | Exceptional 4.1% |
| Immigrants | Scotland | 99.9 /100 | #29 | Exceptional 4.2% |
| Finns | 99.9 /100 | #30 | Exceptional 4.2% |
| Estonians | 99.9 /100 | #31 | Exceptional 4.2% |
| Greeks | 99.9 /100 | #32 | Exceptional 4.2% |
Demographics Similar to Nonimmigrants by Married-Couple Family Poverty
In terms of married-couple family poverty, the demographic groups most similar to Nonimmigrants are American (5.3%, a difference of 0.060%), Hungarian (5.3%, a difference of 0.13%), Peruvian (5.3%, a difference of 0.22%), Immigrants from Vietnam (5.3%, a difference of 0.24%), and Immigrants from Albania (5.3%, a difference of 0.25%).
| Demographics | Rating | Rank | Married-Couple Family Poverty |
| Immigrants | Kazakhstan | 45.1 /100 | #177 | Average 5.2% |
| Immigrants | Ukraine | 44.9 /100 | #178 | Average 5.2% |
| Spanish | 41.4 /100 | #179 | Average 5.3% |
| Immigrants | Sierra Leone | 39.3 /100 | #180 | Fair 5.3% |
| Immigrants | Chile | 38.8 /100 | #181 | Fair 5.3% |
| Immigrants | Vietnam | 37.7 /100 | #182 | Fair 5.3% |
| Peruvians | 37.6 /100 | #183 | Fair 5.3% |
| Immigrants | Nonimmigrants | 35.8 /100 | #184 | Fair 5.3% |
| Americans | 35.4 /100 | #185 | Fair 5.3% |
| Hungarians | 34.7 /100 | #186 | Fair 5.3% |
| Immigrants | Albania | 33.8 /100 | #187 | Fair 5.3% |
| Israelis | 33.1 /100 | #188 | Fair 5.3% |
| South American Indians | 32.5 /100 | #189 | Fair 5.3% |
| Ugandans | 31.6 /100 | #190 | Fair 5.3% |
| Immigrants | Cabo Verde | 30.9 /100 | #191 | Fair 5.3% |