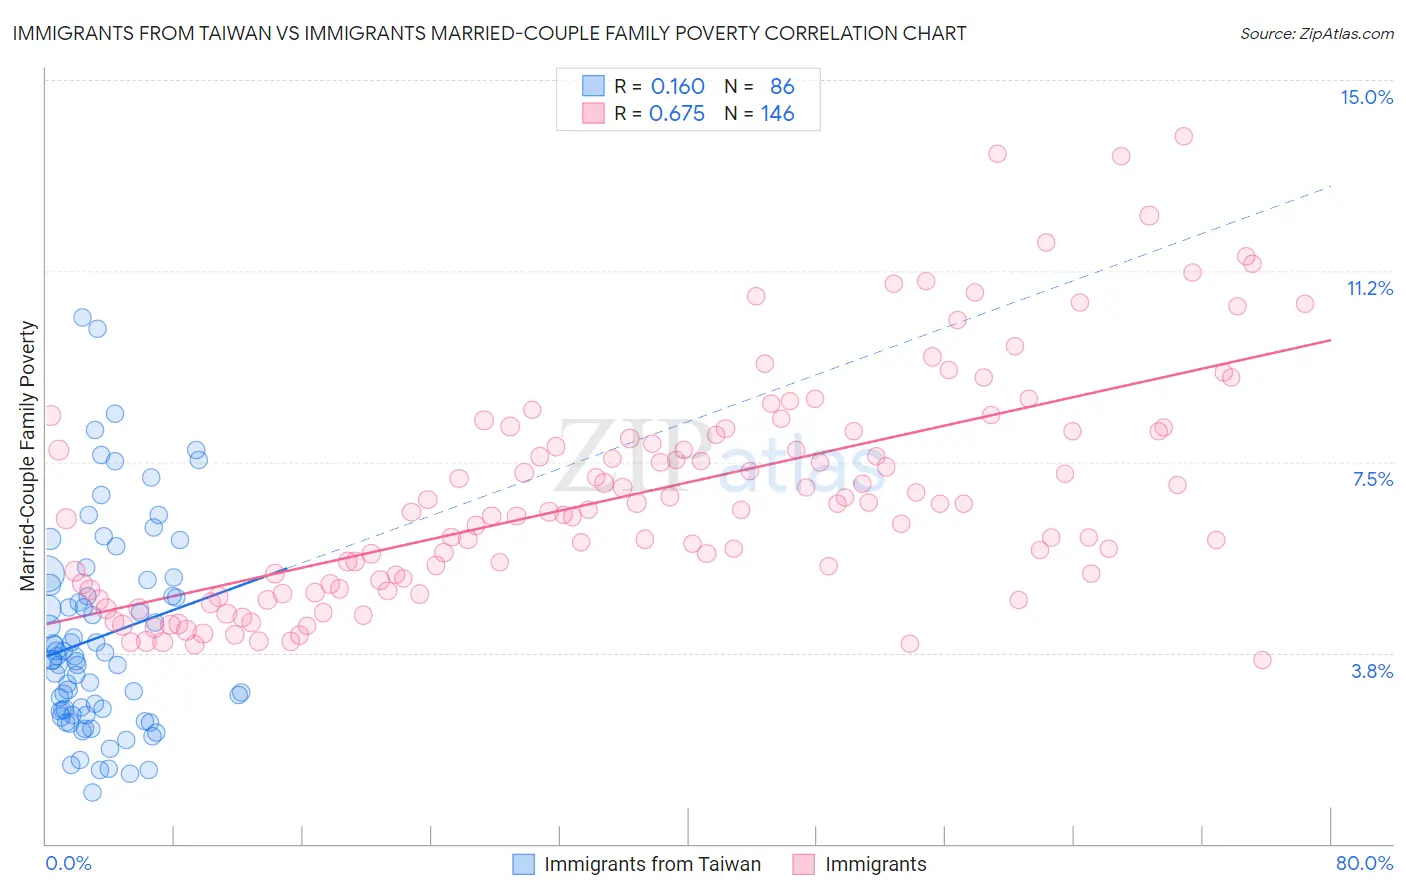
Immigrants from Taiwan vs Immigrants Married-Couple Family Poverty
COMPARE
Immigrants from Taiwan
Immigrants
Married-Couple Family Poverty
Married-Couple Family Poverty Comparison
Immigrants from Taiwan
Immigrants
4.1%
MARRIED-COUPLE FAMILY POVERTY
99.9/ 100
METRIC RATING
25th/ 347
METRIC RANK
6.0%
MARRIED-COUPLE FAMILY POVERTY
0.5/ 100
METRIC RATING
258th/ 347
METRIC RANK
Immigrants from Taiwan vs Immigrants Married-Couple Family Poverty Correlation Chart
The statistical analysis conducted on geographies consisting of 295,998,361 people shows a poor positive correlation between the proportion of Immigrants from Taiwan and poverty level among married-couple families in the United States with a correlation coefficient (R) of 0.160 and weighted average of 4.1%. Similarly, the statistical analysis conducted on geographies consisting of 562,504,380 people shows a significant positive correlation between the proportion of Immigrants and poverty level among married-couple families in the United States with a correlation coefficient (R) of 0.675 and weighted average of 6.0%, a difference of 46.1%.
Married-Couple Family Poverty Correlation Summary
| Measurement | Immigrants from Taiwan | Immigrants |
| Minimum | 1.0% | 3.6% |
| Maximum | 10.3% | 13.9% |
| Range | 9.3% | 10.3% |
| Mean | 4.1% | 6.9% |
| Median | 3.6% | 6.6% |
| Interquartile 25% (IQ1) | 2.6% | 5.1% |
| Interquartile 75% (IQ3) | 5.1% | 8.1% |
| Interquartile Range (IQR) | 2.5% | 3.0% |
| Standard Deviation (Sample) | 2.0% | 2.2% |
| Standard Deviation (Population) | 2.0% | 2.2% |
Similar Demographics by Married-Couple Family Poverty
Demographics Similar to Immigrants from Taiwan by Married-Couple Family Poverty
In terms of married-couple family poverty, the demographic groups most similar to Immigrants from Taiwan are Cypriot (4.1%, a difference of 0.27%), Danish (4.1%, a difference of 0.38%), Scandinavian (4.1%, a difference of 0.49%), Immigrants from Scotland (4.2%, a difference of 0.53%), and Eastern European (4.1%, a difference of 0.57%).
| Demographics | Rating | Rank | Married-Couple Family Poverty |
| Italians | 100.0 /100 | #18 | Exceptional 4.0% |
| Immigrants | Ireland | 99.9 /100 | #19 | Exceptional 4.1% |
| Maltese | 99.9 /100 | #20 | Exceptional 4.1% |
| Zimbabweans | 99.9 /100 | #21 | Exceptional 4.1% |
| Immigrants | Singapore | 99.9 /100 | #22 | Exceptional 4.1% |
| Bhutanese | 99.9 /100 | #23 | Exceptional 4.1% |
| Eastern Europeans | 99.9 /100 | #24 | Exceptional 4.1% |
| Immigrants | Taiwan | 99.9 /100 | #25 | Exceptional 4.1% |
| Cypriots | 99.9 /100 | #26 | Exceptional 4.1% |
| Danes | 99.9 /100 | #27 | Exceptional 4.1% |
| Scandinavians | 99.9 /100 | #28 | Exceptional 4.1% |
| Immigrants | Scotland | 99.9 /100 | #29 | Exceptional 4.2% |
| Finns | 99.9 /100 | #30 | Exceptional 4.2% |
| Estonians | 99.9 /100 | #31 | Exceptional 4.2% |
| Greeks | 99.9 /100 | #32 | Exceptional 4.2% |
Demographics Similar to Immigrants by Married-Couple Family Poverty
In terms of married-couple family poverty, the demographic groups most similar to Immigrants are Immigrants from Burma/Myanmar (6.0%, a difference of 0.13%), Bangladeshi (6.0%, a difference of 0.37%), Alaskan Athabascan (6.1%, a difference of 0.58%), Jamaican (6.1%, a difference of 0.79%), and Comanche (6.0%, a difference of 0.87%).
| Demographics | Rating | Rank | Married-Couple Family Poverty |
| Immigrants | Ghana | 1.0 /100 | #251 | Tragic 5.9% |
| Immigrants | Western Asia | 0.7 /100 | #252 | Tragic 6.0% |
| Africans | 0.7 /100 | #253 | Tragic 6.0% |
| Immigrants | Somalia | 0.7 /100 | #254 | Tragic 6.0% |
| Comanche | 0.7 /100 | #255 | Tragic 6.0% |
| Bangladeshis | 0.5 /100 | #256 | Tragic 6.0% |
| Immigrants | Burma/Myanmar | 0.5 /100 | #257 | Tragic 6.0% |
| Immigrants | Immigrants | 0.5 /100 | #258 | Tragic 6.0% |
| Alaskan Athabascans | 0.4 /100 | #259 | Tragic 6.1% |
| Jamaicans | 0.3 /100 | #260 | Tragic 6.1% |
| Senegalese | 0.3 /100 | #261 | Tragic 6.1% |
| Shoshone | 0.3 /100 | #262 | Tragic 6.1% |
| Immigrants | Senegal | 0.3 /100 | #263 | Tragic 6.1% |
| Immigrants | Congo | 0.2 /100 | #264 | Tragic 6.1% |
| Blackfeet | 0.2 /100 | #265 | Tragic 6.2% |