Immigrants from Romania 4 or more Vehicles in Household
COMPARE
Immigrants from Romania
Select to Compare
4 or more Vehicles in Household
Immigrants from Romania 4 or more Vehicles in Household
6.0%
4+ VEHICLES AVAILABLE
13.8/ 100
METRIC RATING
216th/ 347
METRIC RANK
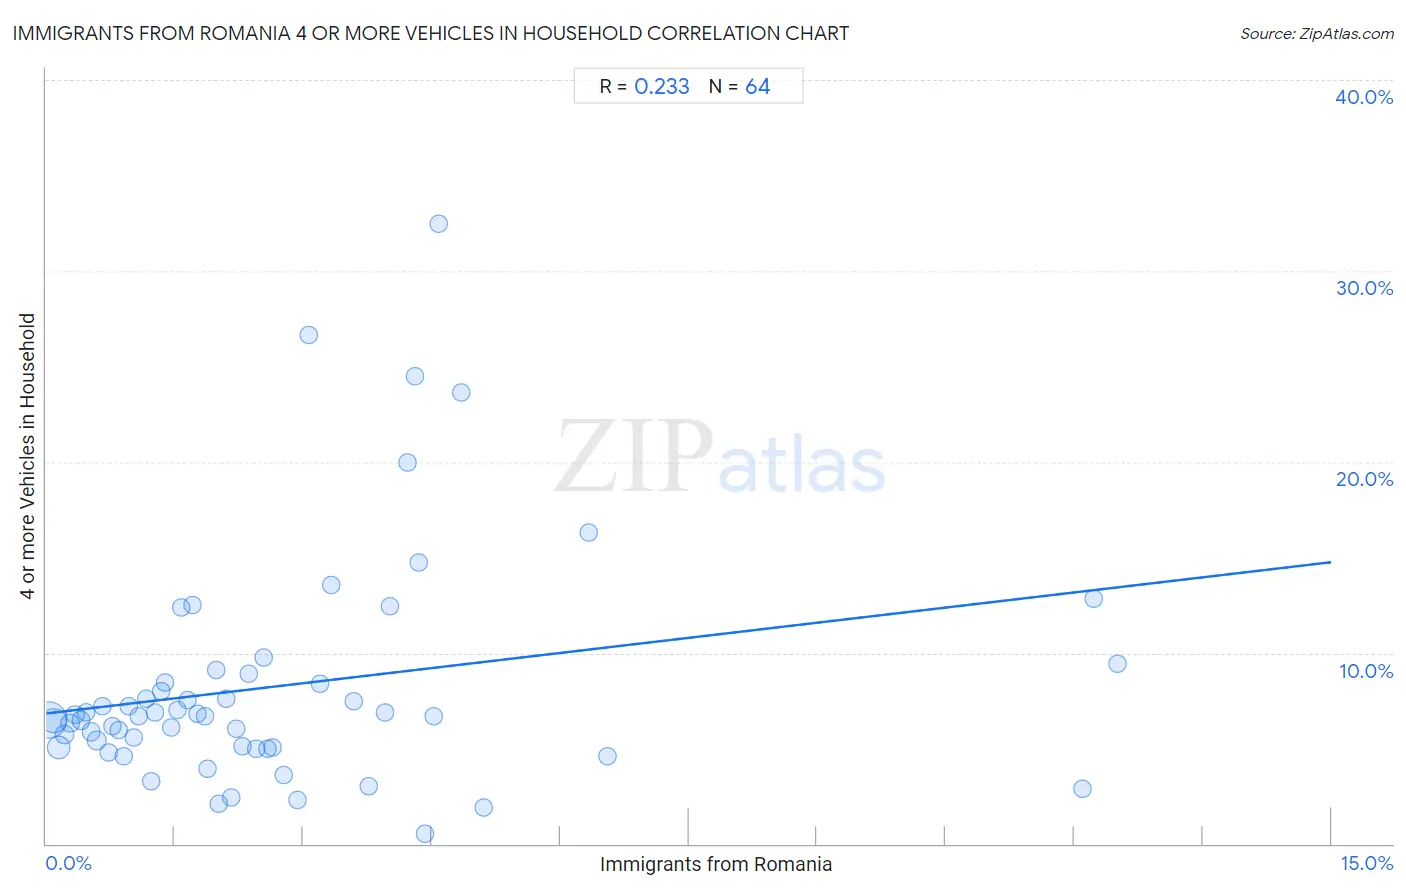
Immigrants from Romania 4 or more Vehicles in Household Correlation Chart
The statistical analysis conducted on geographies consisting of 256,113,445 people shows a weak positive correlation between the proportion of Immigrants from Romania and percentage of households with 4 or more vehicles available in the United States with a correlation coefficient (R) of 0.233 and weighted average of 6.0%. On average, for every 1% (one percent) increase in Immigrants from Romania within a typical geography, there is an increase of 0.53% in percentage of households with 4 or more vehicles available.
It is essential to understand that the correlation between the percentage of Immigrants from Romania and percentage of households with 4 or more vehicles available does not imply a direct cause-and-effect relationship. It remains uncertain whether the presence of Immigrants from Romania influences an upward or downward trend in the level of percentage of households with 4 or more vehicles available within an area, or if Immigrants from Romania simply ended up residing in those areas with higher or lower levels of percentage of households with 4 or more vehicles available due to other factors.
Demographics Similar to Immigrants from Romania by 4 or more Vehicles in Household
In terms of 4 or more vehicles in household, the demographic groups most similar to Immigrants from Romania are Immigrants from China (6.0%, a difference of 0.0%), Immigrants from Austria (6.0%, a difference of 0.11%), Arab (6.0%, a difference of 0.13%), Immigrants from Egypt (6.0%, a difference of 0.19%), and Panamanian (6.0%, a difference of 0.20%).
| Demographics | Rating | Rank | 4 or more Vehicles in Household |
| Immigrants from Honduras | 15.4 /100 | #209 | Poor 6.1% |
| Immigrants from Zimbabwe | 15.1 /100 | #210 | Poor 6.0% |
| Panamanians | 14.8 /100 | #211 | Poor 6.0% |
| Immigrants from Egypt | 14.7 /100 | #212 | Poor 6.0% |
| Arabs | 14.4 /100 | #213 | Poor 6.0% |
| Immigrants from Austria | 14.3 /100 | #214 | Poor 6.0% |
| Immigrants from China | 13.8 /100 | #215 | Poor 6.0% |
| Immigrants from Romania | 13.8 /100 | #216 | Poor 6.0% |
| Nigerians | 12.2 /100 | #217 | Poor 6.0% |
| Immigrants from Italy | 11.0 /100 | #218 | Poor 6.0% |
| Serbians | 11.0 /100 | #219 | Poor 6.0% |
| Russians | 10.3 /100 | #220 | Poor 6.0% |
| Immigrants from Moldova | 9.3 /100 | #221 | Tragic 6.0% |
| Cajuns | 9.2 /100 | #222 | Tragic 6.0% |
| Immigrants from Kenya | 9.2 /100 | #223 | Tragic 6.0% |
Immigrants from Romania 4 or more Vehicles in Household Correlation Summary
| Measurement | Immigrants from Romania Data | 4 or more Vehicles in Household Data |
| Minimum | 0.030% | 0.55% |
| Maximum | 12.5% | 32.5% |
| Range | 12.5% | 31.9% |
| Mean | 2.7% | 8.2% |
| Median | 2.0% | 6.7% |
| Interquartile 25% (IQ1) | 1.00% | 5.0% |
| Interquartile 75% (IQ3) | 3.7% | 8.7% |
| Interquartile Range (IQR) | 2.7% | 3.6% |
| Standard Deviation (Sample) | 2.6% | 6.0% |
| Standard Deviation (Population) | 2.6% | 6.0% |
Correlation Details
| Immigrants from Romania Percentile | Sample Size | 4 or more Vehicles in Household |
[ 0.0% - 0.5% ] 0.030% | 129,620,450 | 6.5% |
[ 0.0% - 0.5% ] 0.089% | 50,649,112 | 6.4% |
[ 0.0% - 0.5% ] 0.15% | 34,982,844 | 5.0% |
[ 0.0% - 0.5% ] 0.21% | 15,131,214 | 5.7% |
[ 0.0% - 0.5% ] 0.28% | 7,232,149 | 6.3% |
[ 0.0% - 0.5% ] 0.34% | 5,041,802 | 6.8% |
[ 0.0% - 0.5% ] 0.40% | 3,608,308 | 6.5% |
[ 0.0% - 0.5% ] 0.46% | 2,241,585 | 6.9% |
[ 0.5% - 1.0% ] 0.52% | 1,746,289 | 5.9% |
[ 0.5% - 1.0% ] 0.59% | 1,489,885 | 5.4% |
[ 0.5% - 1.0% ] 0.65% | 694,846 | 7.2% |
[ 0.5% - 1.0% ] 0.72% | 610,551 | 4.8% |
[ 0.5% - 1.0% ] 0.78% | 675,155 | 6.1% |
[ 0.5% - 1.0% ] 0.85% | 293,064 | 5.9% |
[ 0.5% - 1.0% ] 0.91% | 483,033 | 4.6% |
[ 0.5% - 1.0% ] 0.97% | 272,548 | 7.2% |
[ 1.0% - 1.5% ] 1.03% | 114,945 | 5.6% |
[ 1.0% - 1.5% ] 1.09% | 132,567 | 6.7% |
[ 1.0% - 1.5% ] 1.17% | 77,806 | 7.6% |
[ 1.0% - 1.5% ] 1.23% | 191,066 | 3.3% |
[ 1.0% - 1.5% ] 1.27% | 50,767 | 6.9% |
[ 1.0% - 1.5% ] 1.34% | 181,360 | 8.0% |
[ 1.0% - 1.5% ] 1.39% | 52,825 | 8.5% |
[ 1.0% - 1.5% ] 1.46% | 52,075 | 6.1% |
[ 1.5% - 2.0% ] 1.54% | 36,336 | 7.0% |
[ 1.5% - 2.0% ] 1.57% | 6,667 | 12.4% |
[ 1.5% - 2.0% ] 1.65% | 10,179 | 7.6% |
[ 1.5% - 2.0% ] 1.70% | 6,169 | 12.5% |
[ 1.5% - 2.0% ] 1.76% | 63,398 | 6.8% |
[ 1.5% - 2.0% ] 1.85% | 7,828 | 6.7% |
[ 1.5% - 2.0% ] 1.89% | 93,713 | 3.9% |
[ 1.5% - 2.0% ] 1.98% | 61,187 | 9.1% |
[ 2.0% - 2.5% ] 2.02% | 65,256 | 2.1% |
[ 2.0% - 2.5% ] 2.10% | 11,056 | 7.6% |
[ 2.0% - 2.5% ] 2.15% | 41,134 | 2.4% |
[ 2.0% - 2.5% ] 2.21% | 11,062 | 6.0% |
[ 2.0% - 2.5% ] 2.29% | 523 | 5.1% |
[ 2.0% - 2.5% ] 2.36% | 2,199 | 8.9% |
[ 2.0% - 2.5% ] 2.46% | 27,378 | 5.0% |
[ 2.5% - 3.0% ] 2.54% | 14,652 | 9.8% |
[ 2.5% - 3.0% ] 2.58% | 1,125 | 4.9% |
[ 2.5% - 3.0% ] 2.65% | 1,814 | 5.0% |
[ 2.5% - 3.0% ] 2.77% | 1,048 | 3.6% |
[ 2.5% - 3.0% ] 2.93% | 852 | 2.3% |
[ 3.0% - 3.5% ] 3.06% | 457 | 26.7% |
[ 3.0% - 3.5% ] 3.19% | 1,003 | 8.4% |
[ 3.0% - 3.5% ] 3.33% | 3,064 | 13.6% |
[ 3.5% - 4.0% ] 3.59% | 390 | 7.5% |
[ 3.5% - 4.0% ] 3.77% | 2,812 | 3.0% |
[ 3.5% - 4.0% ] 3.95% | 1,899 | 6.9% |
[ 4.0% - 4.5% ] 4.01% | 673 | 12.5% |
[ 4.0% - 4.5% ] 4.21% | 5,555 | 20.0% |
[ 4.0% - 4.5% ] 4.31% | 116 | 24.5% |
[ 4.0% - 4.5% ] 4.35% | 69 | 14.7% |
[ 4.0% - 4.5% ] 4.42% | 1,153 | 0.55% |
[ 4.5% - 5.0% ] 4.52% | 974 | 6.7% |
[ 4.5% - 5.0% ] 4.59% | 676 | 32.5% |
[ 4.5% - 5.0% ] 4.85% | 268 | 23.7% |
[ 5.0% - 5.5% ] 5.10% | 98 | 1.9% |
[ 6.0% - 6.5% ] 6.33% | 411 | 16.3% |
[ 6.5% - 7.0% ] 6.55% | 412 | 4.6% |
[ 12.0% - 12.5% ] 12.10% | 1,885 | 2.9% |
[ 12.0% - 12.5% ] 12.23% | 1,668 | 12.8% |
[ 12.0% - 12.5% ] 12.50% | 40 | 9.5% |