Immigrants from Romania Self-Care Disability
COMPARE
Immigrants from Romania
Select to Compare
Self-Care Disability
Immigrants from Romania Self-Care Disability
2.4%
SELF-CARE DISABILITY
89.3/ 100
METRIC RATING
129th/ 347
METRIC RANK
Immigrants from Romania Self-Care Disability Correlation Chart
The statistical analysis conducted on geographies consisting of 256,851,853 people shows a poor positive correlation between the proportion of Immigrants from Romania and percentage of population with self-care disability in the United States with a correlation coefficient (R) of 0.125 and weighted average of 2.4%. On average, for every 1% (one percent) increase in Immigrants from Romania within a typical geography, there is an increase of 0.067% in percentage of population with self-care disability.
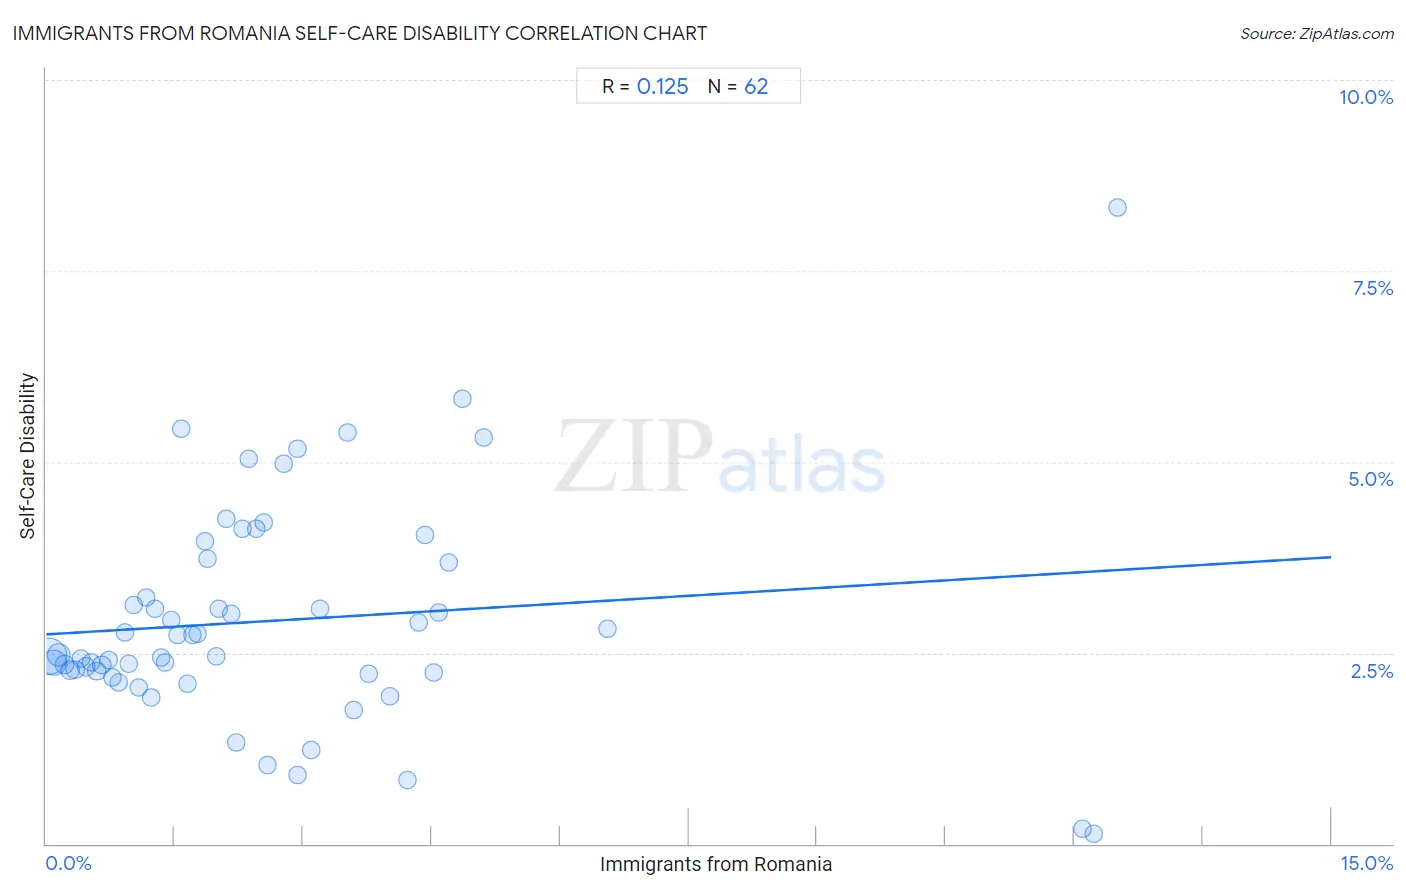
It is essential to understand that the correlation between the percentage of Immigrants from Romania and percentage of population with self-care disability does not imply a direct cause-and-effect relationship. It remains uncertain whether the presence of Immigrants from Romania influences an upward or downward trend in the level of percentage of population with self-care disability within an area, or if Immigrants from Romania simply ended up residing in those areas with higher or lower levels of percentage of population with self-care disability due to other factors.
Demographics Similar to Immigrants from Romania by Self-Care Disability
In terms of self-care disability, the demographic groups most similar to Immigrants from Romania are Immigrants from Austria (2.4%, a difference of 0.030%), Immigrants from Hungary (2.4%, a difference of 0.050%), Polish (2.4%, a difference of 0.050%), Immigrants from South America (2.4%, a difference of 0.050%), and Colombian (2.4%, a difference of 0.060%).
| Demographics | Rating | Rank | Self-Care Disability |
| Belgians | 90.9 /100 | #122 | Exceptional 2.4% |
| Immigrants from Nigeria | 90.3 /100 | #123 | Exceptional 2.4% |
| Immigrants from Morocco | 90.2 /100 | #124 | Exceptional 2.4% |
| Immigrants from North America | 90.2 /100 | #124 | Exceptional 2.4% |
| Hmong | 89.9 /100 | #126 | Excellent 2.4% |
| Colombians | 89.7 /100 | #127 | Excellent 2.4% |
| Immigrants from Hungary | 89.6 /100 | #128 | Excellent 2.4% |
| Immigrants from Romania | 89.3 /100 | #129 | Excellent 2.4% |
| Immigrants from Austria | 89.0 /100 | #130 | Excellent 2.4% |
| Poles | 88.9 /100 | #131 | Excellent 2.4% |
| Immigrants from South America | 88.8 /100 | #132 | Excellent 2.4% |
| Immigrants from Colombia | 88.5 /100 | #133 | Excellent 2.4% |
| Russians | 88.2 /100 | #134 | Excellent 2.4% |
| Laotians | 87.8 /100 | #135 | Excellent 2.4% |
| South American Indians | 87.2 /100 | #136 | Excellent 2.4% |
Immigrants from Romania Self-Care Disability Correlation Summary
| Measurement | Immigrants from Romania Data | Self-Care Disability Data |
| Minimum | 0.030% | 0.12% |
| Maximum | 12.5% | 8.3% |
| Range | 12.5% | 8.2% |
| Mean | 2.6% | 2.9% |
| Median | 1.9% | 2.5% |
| Interquartile 25% (IQ1) | 0.97% | 2.2% |
| Interquartile 75% (IQ3) | 3.5% | 3.7% |
| Interquartile Range (IQR) | 2.6% | 1.5% |
| Standard Deviation (Sample) | 2.7% | 1.4% |
| Standard Deviation (Population) | 2.6% | 1.4% |
Correlation Details
| Immigrants from Romania Percentile | Sample Size | Self-Care Disability |
[ 0.0% - 0.5% ] 0.030% | 129,801,570 | 2.5% |
[ 0.0% - 0.5% ] 0.089% | 50,805,340 | 2.4% |
[ 0.0% - 0.5% ] 0.15% | 35,114,580 | 2.5% |
[ 0.0% - 0.5% ] 0.21% | 15,157,644 | 2.3% |
[ 0.0% - 0.5% ] 0.28% | 7,218,819 | 2.3% |
[ 0.0% - 0.5% ] 0.34% | 5,104,020 | 2.3% |
[ 0.0% - 0.5% ] 0.40% | 3,608,873 | 2.4% |
[ 0.0% - 0.5% ] 0.46% | 2,245,302 | 2.3% |
[ 0.5% - 1.0% ] 0.52% | 1,759,971 | 2.4% |
[ 0.5% - 1.0% ] 0.59% | 1,517,486 | 2.3% |
[ 0.5% - 1.0% ] 0.65% | 767,569 | 2.3% |
[ 0.5% - 1.0% ] 0.72% | 624,238 | 2.4% |
[ 0.5% - 1.0% ] 0.78% | 688,548 | 2.2% |
[ 0.5% - 1.0% ] 0.85% | 291,361 | 2.1% |
[ 0.5% - 1.0% ] 0.91% | 513,892 | 2.8% |
[ 0.5% - 1.0% ] 0.97% | 269,592 | 2.4% |
[ 1.0% - 1.5% ] 1.03% | 114,754 | 3.1% |
[ 1.0% - 1.5% ] 1.09% | 132,567 | 2.0% |
[ 1.0% - 1.5% ] 1.17% | 77,806 | 3.2% |
[ 1.0% - 1.5% ] 1.23% | 190,818 | 1.9% |
[ 1.0% - 1.5% ] 1.27% | 50,767 | 3.1% |
[ 1.0% - 1.5% ] 1.34% | 178,944 | 2.4% |
[ 1.0% - 1.5% ] 1.39% | 51,700 | 2.4% |
[ 1.0% - 1.5% ] 1.46% | 53,907 | 2.9% |
[ 1.5% - 2.0% ] 1.54% | 32,131 | 2.7% |
[ 1.5% - 2.0% ] 1.57% | 6,667 | 5.4% |
[ 1.5% - 2.0% ] 1.65% | 12,050 | 2.1% |
[ 1.5% - 2.0% ] 1.70% | 7,232 | 2.7% |
[ 1.5% - 2.0% ] 1.76% | 65,334 | 2.8% |
[ 1.5% - 2.0% ] 1.85% | 7,828 | 4.0% |
[ 1.5% - 2.0% ] 1.89% | 93,713 | 3.7% |
[ 1.5% - 2.0% ] 1.98% | 63,815 | 2.4% |
[ 2.0% - 2.5% ] 2.02% | 65,256 | 3.1% |
[ 2.0% - 2.5% ] 2.10% | 11,056 | 4.2% |
[ 2.0% - 2.5% ] 2.15% | 41,134 | 3.0% |
[ 2.0% - 2.5% ] 2.21% | 11,062 | 1.3% |
[ 2.0% - 2.5% ] 2.29% | 523 | 4.1% |
[ 2.0% - 2.5% ] 2.36% | 2,199 | 5.0% |
[ 2.0% - 2.5% ] 2.46% | 27,378 | 4.1% |
[ 2.5% - 3.0% ] 2.54% | 14,652 | 4.2% |
[ 2.5% - 3.0% ] 2.58% | 1,125 | 1.0% |
[ 2.5% - 3.0% ] 2.77% | 1,048 | 5.0% |
[ 2.5% - 3.0% ] 2.93% | 852 | 5.2% |
[ 2.5% - 3.0% ] 2.94% | 26,939 | 0.90% |
[ 3.0% - 3.5% ] 3.10% | 1,194 | 1.2% |
[ 3.0% - 3.5% ] 3.19% | 1,003 | 3.1% |
[ 3.5% - 4.0% ] 3.52% | 426 | 5.4% |
[ 3.5% - 4.0% ] 3.59% | 390 | 1.7% |
[ 3.5% - 4.0% ] 3.77% | 2,812 | 2.2% |
[ 4.0% - 4.5% ] 4.01% | 673 | 1.9% |
[ 4.0% - 4.5% ] 4.21% | 5,555 | 0.83% |
[ 4.0% - 4.5% ] 4.35% | 69 | 2.9% |
[ 4.0% - 4.5% ] 4.42% | 1,153 | 4.1% |
[ 4.5% - 5.0% ] 4.52% | 974 | 2.2% |
[ 4.5% - 5.0% ] 4.59% | 676 | 3.0% |
[ 4.5% - 5.0% ] 4.70% | 532 | 3.7% |
[ 4.5% - 5.0% ] 4.86% | 247 | 5.8% |
[ 5.0% - 5.5% ] 5.10% | 98 | 5.3% |
[ 6.5% - 7.0% ] 6.55% | 412 | 2.8% |
[ 12.0% - 12.5% ] 12.10% | 1,885 | 0.20% |
[ 12.0% - 12.5% ] 12.23% | 1,668 | 0.12% |
[ 12.0% - 12.5% ] 12.50% | 24 | 8.3% |