Ironton, WI Map & Demographics
Ironton Map
Ironton Overview
$24,397
PER CAPITA INCOME
$64,375
AVG FAMILY INCOME
$51,875
AVG HOUSEHOLD INCOME
24.1%
WAGE / INCOME GAP [ % ]
75.9¢/ $1
WAGE / INCOME GAP [ $ ]
0.35
INEQUALITY / GINI INDEX
307
TOTAL POPULATION
160
MALE POPULATION
147
FEMALE POPULATION
108.84
MALES / 100 FEMALES
91.88
FEMALES / 100 MALES
31.9
MEDIAN AGE
3.0
AVG FAMILY SIZE
2.6
AVG HOUSEHOLD SIZE
149
LABOR FORCE [ PEOPLE ]
66.2%
PERCENT IN LABOR FORCE
6.0%
UNEMPLOYMENT RATE
Income in Ironton
Income Overview in Ironton
Per Capita Income in Ironton is $24,397, while median incomes of families and households are $64,375 and $51,875 respectively.
| Characteristic | Number | Measure |
| Per Capita Income | 307 | $24,397 |
| Median Family Income | 80 | $64,375 |
| Mean Family Income | 80 | $70,279 |
| Median Household Income | 117 | $51,875 |
| Mean Household Income | 117 | $61,931 |
| Income Deficit | 80 | $0 |
| Wage / Income Gap (%) | 307 | 24.06% |
| Wage / Income Gap ($) | 307 | 75.94¢ per $1 |
| Gini / Inequality Index | 307 | 0.35 |
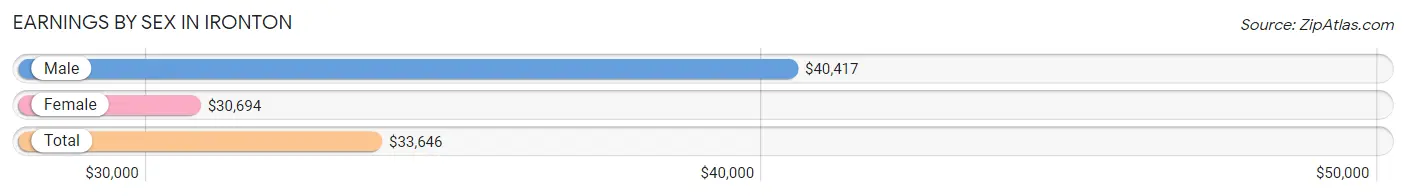
Earnings by Sex in Ironton
Average Earnings in Ironton are $33,646, $40,417 for men and $30,694 for women, a difference of 24.1%.
| Sex | Number | Average Earnings |
| Male | 96 (59.6%) | $40,417 |
| Female | 65 (40.4%) | $30,694 |
| Total | 161 (100.0%) | $33,646 |
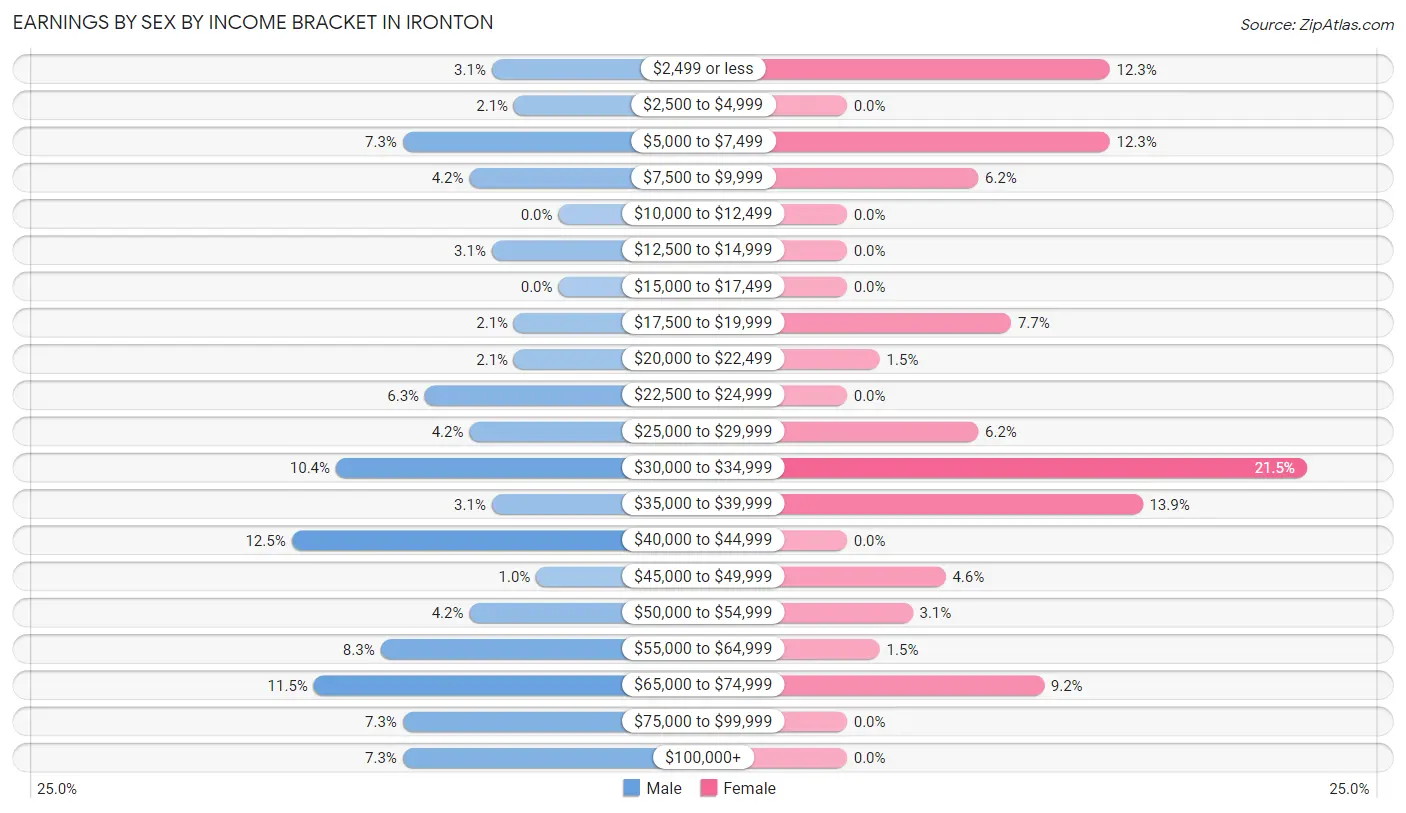
Earnings by Sex by Income Bracket in Ironton
The most common earnings brackets in Ironton are $40,000 to $44,999 for men (12 | 12.5%) and $30,000 to $34,999 for women (14 | 21.5%).
| Income | Male | Female |
| $2,499 or less | 3 (3.1%) | 8 (12.3%) |
| $2,500 to $4,999 | 2 (2.1%) | 0 (0.0%) |
| $5,000 to $7,499 | 7 (7.3%) | 8 (12.3%) |
| $7,500 to $9,999 | 4 (4.2%) | 4 (6.1%) |
| $10,000 to $12,499 | 0 (0.0%) | 0 (0.0%) |
| $12,500 to $14,999 | 3 (3.1%) | 0 (0.0%) |
| $15,000 to $17,499 | 0 (0.0%) | 0 (0.0%) |
| $17,500 to $19,999 | 2 (2.1%) | 5 (7.7%) |
| $20,000 to $22,499 | 2 (2.1%) | 1 (1.5%) |
| $22,500 to $24,999 | 6 (6.2%) | 0 (0.0%) |
| $25,000 to $29,999 | 4 (4.2%) | 4 (6.1%) |
| $30,000 to $34,999 | 10 (10.4%) | 14 (21.5%) |
| $35,000 to $39,999 | 3 (3.1%) | 9 (13.9%) |
| $40,000 to $44,999 | 12 (12.5%) | 0 (0.0%) |
| $45,000 to $49,999 | 1 (1.0%) | 3 (4.6%) |
| $50,000 to $54,999 | 4 (4.2%) | 2 (3.1%) |
| $55,000 to $64,999 | 8 (8.3%) | 1 (1.5%) |
| $65,000 to $74,999 | 11 (11.5%) | 6 (9.2%) |
| $75,000 to $99,999 | 7 (7.3%) | 0 (0.0%) |
| $100,000+ | 7 (7.3%) | 0 (0.0%) |
| Total | 96 (100.0%) | 65 (100.0%) |
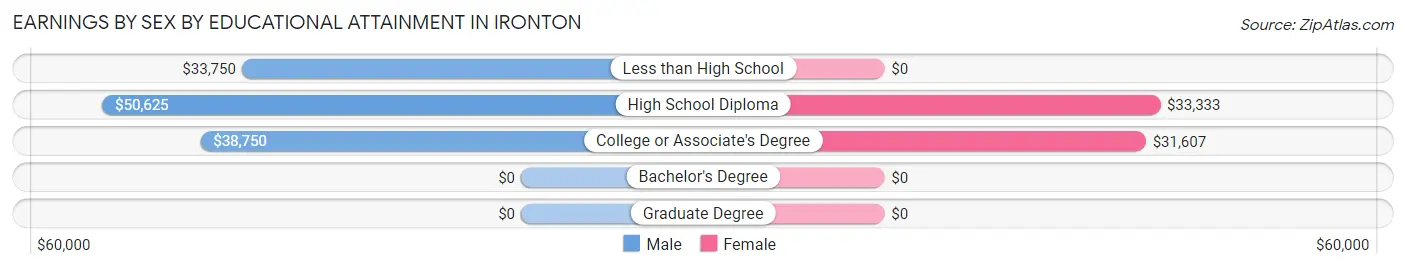
Earnings by Sex by Educational Attainment in Ironton
Average earnings in Ironton are $41,563 for men and $32,361 for women, a difference of 22.1%. Men with an educational attainment of high school diploma enjoy the highest average annual earnings of $50,625, while those with less than high school education earn the least with $33,750. Women with an educational attainment of high school diploma earn the most with the average annual earnings of $33,333, while those with college or associate's degree education have the smallest earnings of $31,607.
| Educational Attainment | Male Income | Female Income |
| Less than High School | $33,750 | $0 |
| High School Diploma | $50,625 | $33,333 |
| College or Associate's Degree | $38,750 | $31,607 |
| Bachelor's Degree | - | - |
| Graduate Degree | - | - |
| Total | $41,563 | $32,361 |
Family Income in Ironton
Family Income Brackets in Ironton
According to the Ironton family income data, there are 19 families falling into the $50,000 to $74,999 income range, which is the most common income bracket and makes up 23.7% of all families.
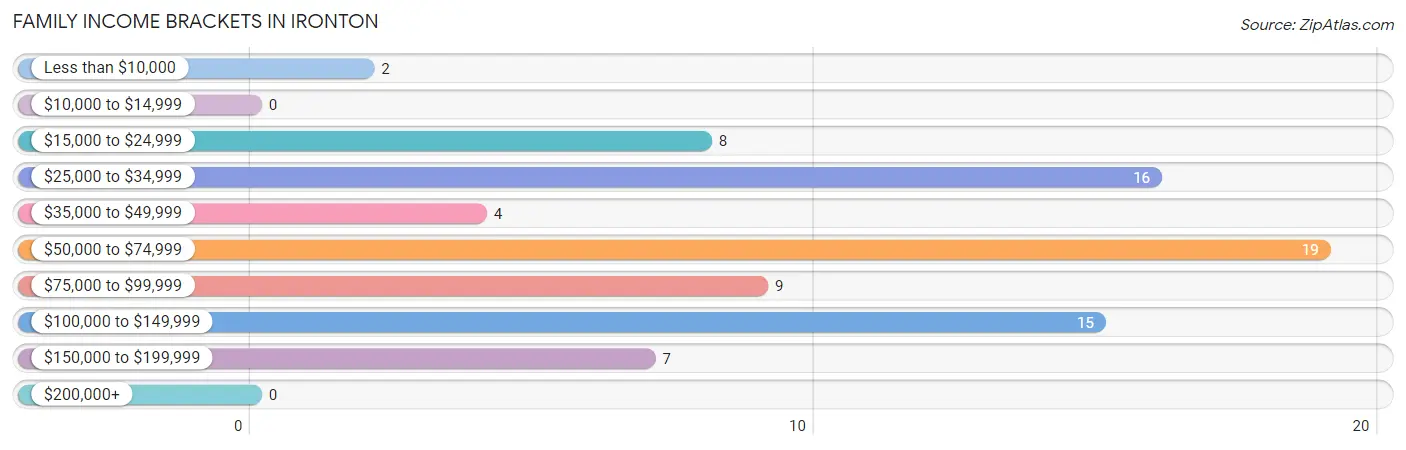
| Income Bracket | # Families | % Families |
| Less than $10,000 | 2 | 2.5% |
| $10,000 to $14,999 | 0 | 0.0% |
| $15,000 to $24,999 | 8 | 10.0% |
| $25,000 to $34,999 | 16 | 20.0% |
| $35,000 to $49,999 | 4 | 5.0% |
| $50,000 to $74,999 | 19 | 23.8% |
| $75,000 to $99,999 | 9 | 11.3% |
| $100,000 to $149,999 | 15 | 18.8% |
| $150,000 to $199,999 | 7 | 8.8% |
| $200,000+ | 0 | 0.0% |
Family Income by Famaliy Size in Ironton
5-person families (8 | 10.0%) account for the highest median family income in Ironton with $85,833 per family, while 2-person families (36 | 45.0%) have the highest median income of $25,000 per family member.
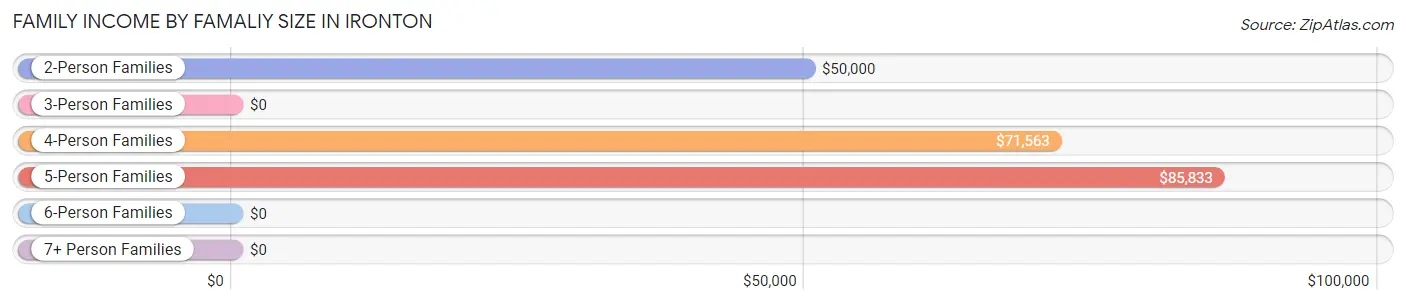
| Income Bracket | # Families | Median Income |
| 2-Person Families | 36 (45.0%) | $50,000 |
| 3-Person Families | 11 (13.8%) | $0 |
| 4-Person Families | 25 (31.2%) | $71,563 |
| 5-Person Families | 8 (10.0%) | $85,833 |
| 6-Person Families | 0 (0.0%) | $0 |
| 7+ Person Families | 0 (0.0%) | $0 |
| Total | 80 (100.0%) | $64,375 |
Family Income by Number of Earners in Ironton
The median family income in Ironton is $64,375, with families comprising 3+ earners (12) having the highest median family income of $125,000, while families with no earners (16) have the lowest median family income of $33,654, accounting for 15.0% and 20.0% of families, respectively.
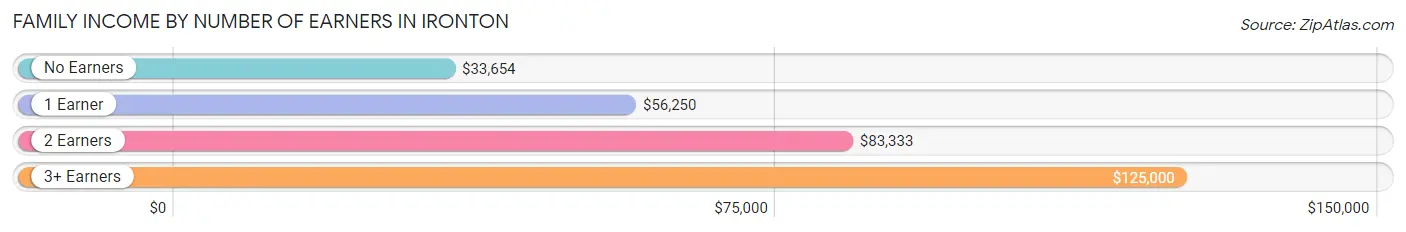
| Number of Earners | # Families | Median Income |
| No Earners | 16 (20.0%) | $33,654 |
| 1 Earner | 30 (37.5%) | $56,250 |
| 2 Earners | 22 (27.5%) | $83,333 |
| 3+ Earners | 12 (15.0%) | $125,000 |
| Total | 80 (100.0%) | $64,375 |
Household Income in Ironton
Household Income Brackets in Ironton
With 28 households falling in the category, the $25,000 to $34,999 income range is the most frequent in Ironton, accounting for 23.9% of all households.
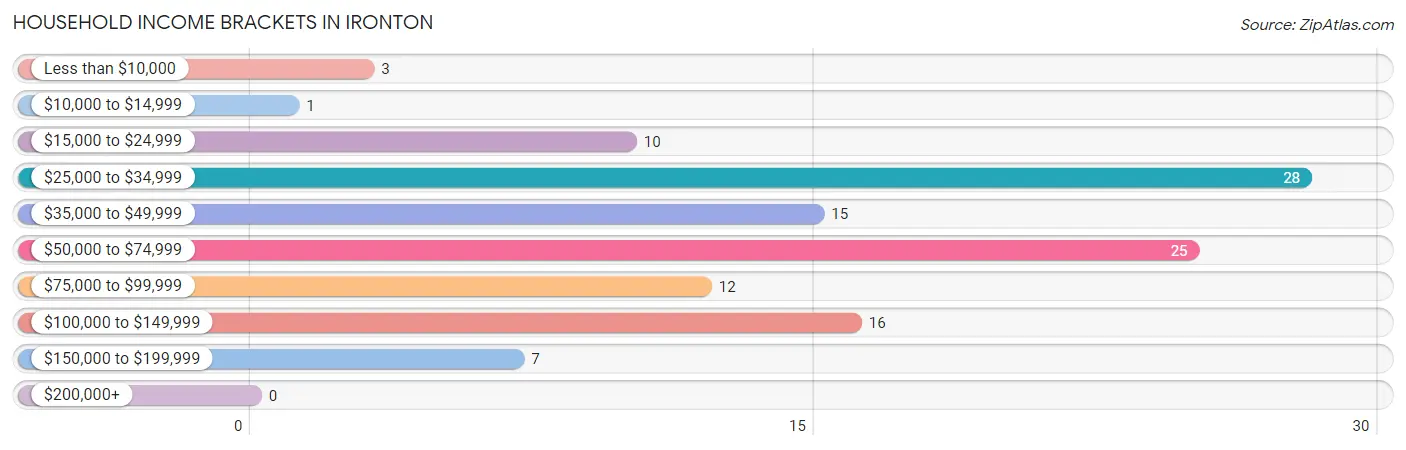
| Income Bracket | # Households | % Households |
| Less than $10,000 | 3 | 2.6% |
| $10,000 to $14,999 | 1 | 0.9% |
| $15,000 to $24,999 | 10 | 8.5% |
| $25,000 to $34,999 | 28 | 23.9% |
| $35,000 to $49,999 | 15 | 12.8% |
| $50,000 to $74,999 | 25 | 21.4% |
| $75,000 to $99,999 | 12 | 10.3% |
| $100,000 to $149,999 | 16 | 13.7% |
| $150,000 to $199,999 | 7 | 6.0% |
| $200,000+ | 0 | 0.0% |
Household Income by Householder Age in Ironton
The median household income in Ironton is $51,875, with the highest median household income of $85,417 found in the 45 to 64 years age bracket for the primary householder. A total of 35 households (29.9%) fall into this category. Meanwhile, the 65+ years age bracket for the primary householder has the lowest median household income of $34,231, with 32 households (27.4%) in this group.
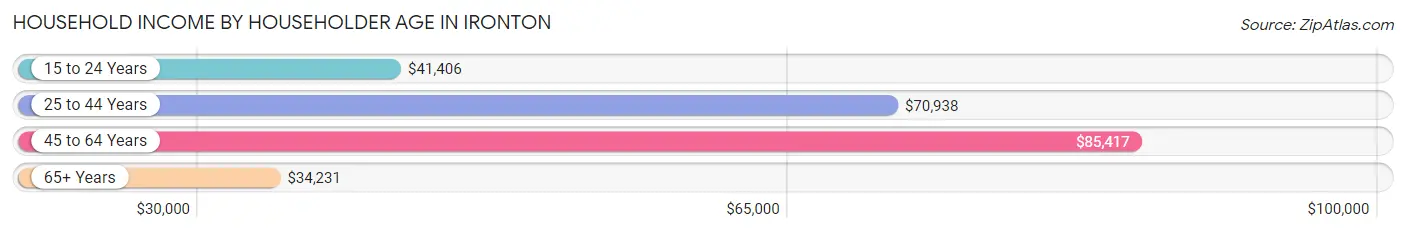
| Income Bracket | # Households | Median Income |
| 15 to 24 Years | 9 (7.7%) | $41,406 |
| 25 to 44 Years | 41 (35.0%) | $70,938 |
| 45 to 64 Years | 35 (29.9%) | $85,417 |
| 65+ Years | 32 (27.4%) | $34,231 |
| Total | 117 (100.0%) | $51,875 |
Poverty in Ironton
Income Below Poverty by Sex and Age in Ironton
With 23.9% poverty level for males and 23.1% for females among the residents of Ironton, 5 year old males and 5 year old females are the most vulnerable to poverty, with 4 males (100.0%) and 4 females (100.0%) in their respective age groups living below the poverty level.
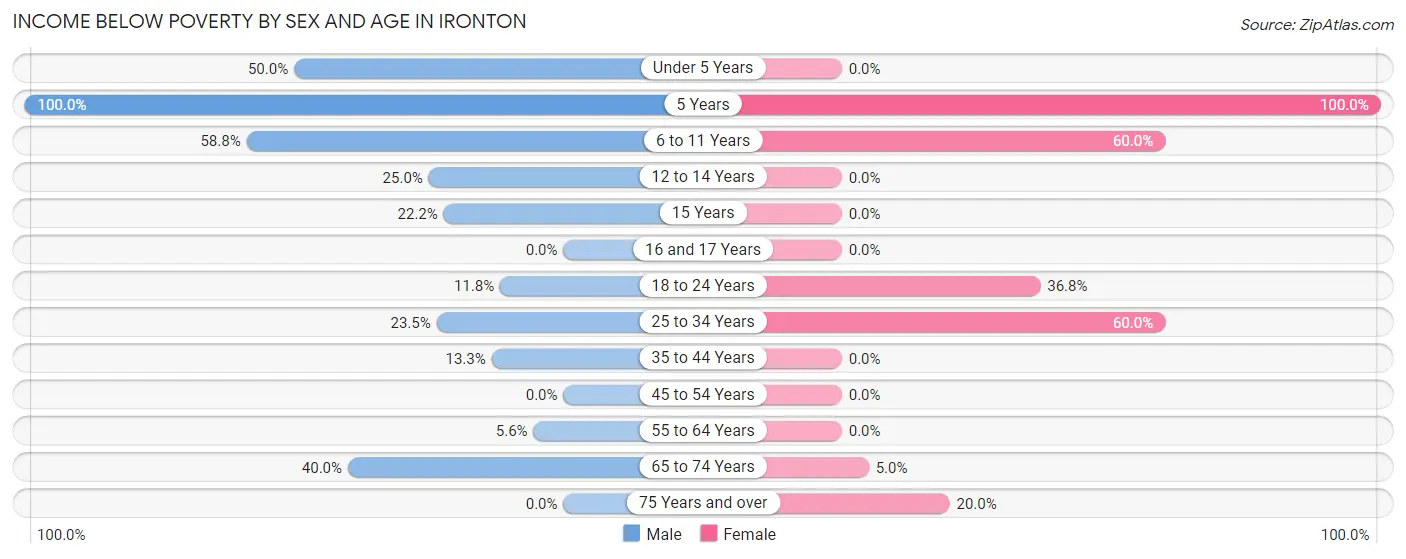
| Age Bracket | Male | Female |
| Under 5 Years | 7 (50.0%) | 0 (0.0%) |
| 5 Years | 4 (100.0%) | 4 (100.0%) |
| 6 to 11 Years | 10 (58.8%) | 6 (60.0%) |
| 12 to 14 Years | 2 (25.0%) | 0 (0.0%) |
| 15 Years | 2 (22.2%) | 0 (0.0%) |
| 16 and 17 Years | 0 (0.0%) | 0 (0.0%) |
| 18 to 24 Years | 2 (11.8%) | 7 (36.8%) |
| 25 to 34 Years | 4 (23.5%) | 15 (60.0%) |
| 35 to 44 Years | 2 (13.3%) | 0 (0.0%) |
| 45 to 54 Years | 0 (0.0%) | 0 (0.0%) |
| 55 to 64 Years | 1 (5.6%) | 0 (0.0%) |
| 65 to 74 Years | 4 (40.0%) | 1 (5.0%) |
| 75 Years and over | 0 (0.0%) | 1 (20.0%) |
| Total | 38 (23.9%) | 34 (23.1%) |
Income Above Poverty by Sex and Age in Ironton
According to the poverty statistics in Ironton, males aged 16 and 17 years and females aged under 5 years are the age groups that are most secure financially, with 100.0% of males and 100.0% of females in these age groups living above the poverty line.
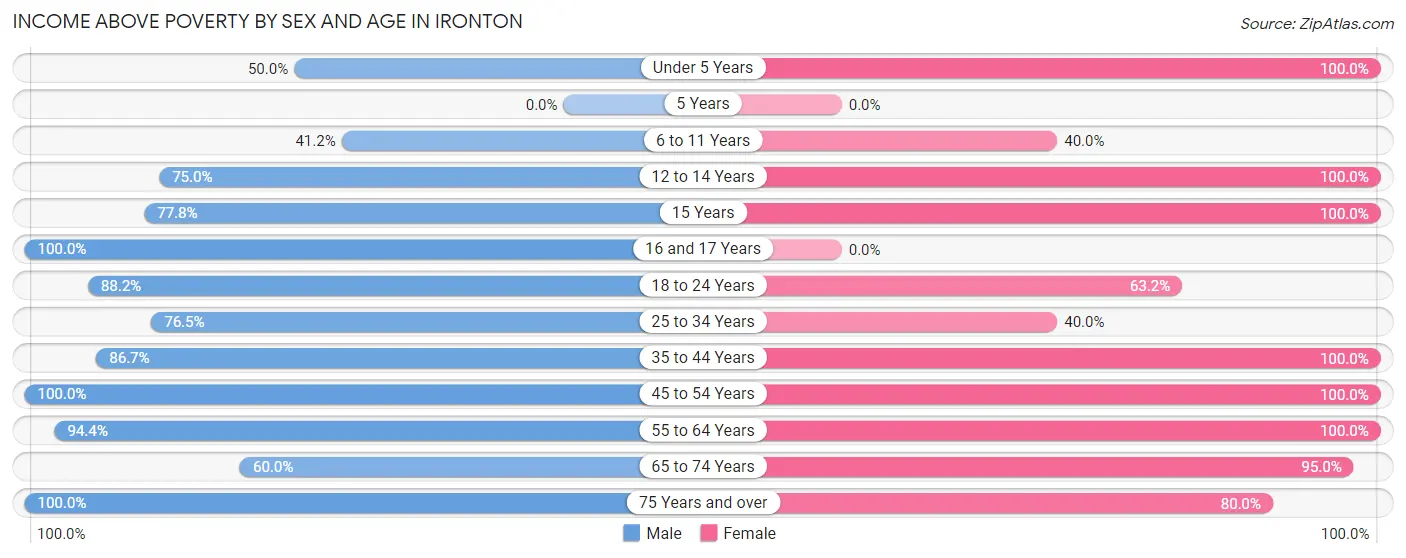
| Age Bracket | Male | Female |
| Under 5 Years | 7 (50.0%) | 8 (100.0%) |
| 5 Years | 0 (0.0%) | 0 (0.0%) |
| 6 to 11 Years | 7 (41.2%) | 4 (40.0%) |
| 12 to 14 Years | 6 (75.0%) | 4 (100.0%) |
| 15 Years | 7 (77.8%) | 3 (100.0%) |
| 16 and 17 Years | 3 (100.0%) | 0 (0.0%) |
| 18 to 24 Years | 15 (88.2%) | 12 (63.2%) |
| 25 to 34 Years | 13 (76.5%) | 10 (40.0%) |
| 35 to 44 Years | 13 (86.7%) | 24 (100.0%) |
| 45 to 54 Years | 22 (100.0%) | 9 (100.0%) |
| 55 to 64 Years | 17 (94.4%) | 16 (100.0%) |
| 65 to 74 Years | 6 (60.0%) | 19 (95.0%) |
| 75 Years and over | 5 (100.0%) | 4 (80.0%) |
| Total | 121 (76.1%) | 113 (76.9%) |
Income Below Poverty Among Married-Couple Families in Ironton
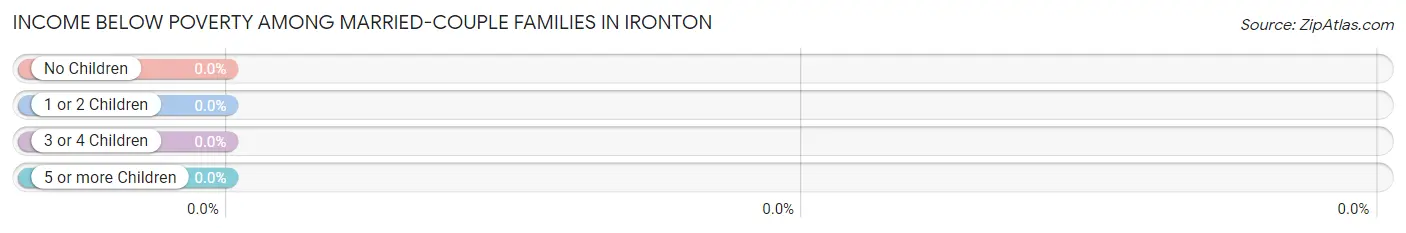
| Children | Above Poverty | Below Poverty |
| No Children | 32 (100.0%) | 0 (0.0%) |
| 1 or 2 Children | 19 (100.0%) | 0 (0.0%) |
| 3 or 4 Children | 5 (100.0%) | 0 (0.0%) |
| 5 or more Children | 0 (0.0%) | 0 (0.0%) |
| Total | 56 (100.0%) | 0 (0.0%) |
Income Below Poverty Among Single-Parent Households in Ironton
According to the poverty data in Ironton, 41.7% or 5 single-father households and 50.0% or 6 single-mother households are living below the poverty line. Among single-father households, those with 3 or 4 children have the highest poverty rate, with 5 households (100.0%) experiencing poverty. Likewise, among single-mother households, those with 3 or 4 children have the highest poverty rate, with 6 households (100.0%) falling below the poverty line.
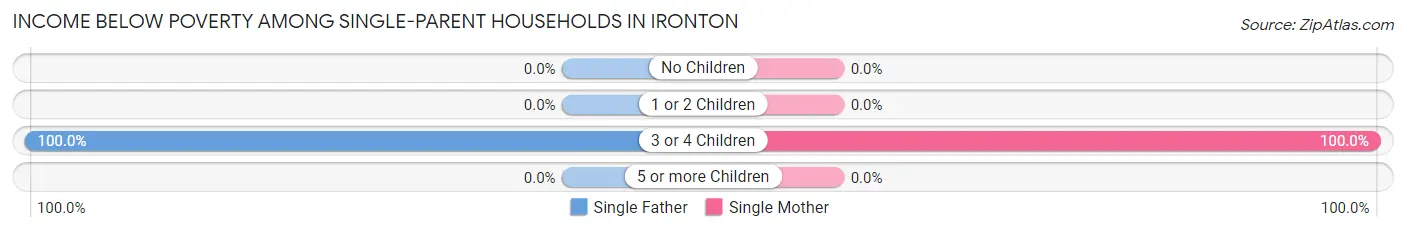
| Children | Single Father | Single Mother |
| No Children | 0 (0.0%) | 0 (0.0%) |
| 1 or 2 Children | 0 (0.0%) | 0 (0.0%) |
| 3 or 4 Children | 5 (100.0%) | 6 (100.0%) |
| 5 or more Children | 0 (0.0%) | 0 (0.0%) |
| Total | 5 (41.7%) | 6 (50.0%) |
Income Below Poverty Among Married-Couple vs Single-Parent Households in Ironton
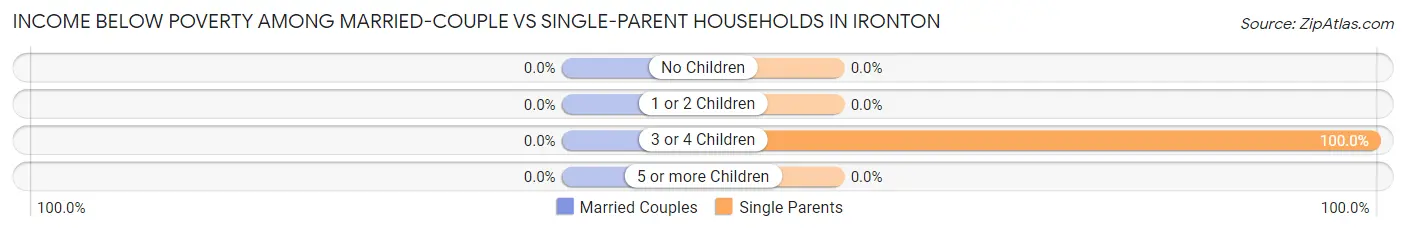
| Children | Married-Couple Families | Single-Parent Households |
| No Children | 0 (0.0%) | 0 (0.0%) |
| 1 or 2 Children | 0 (0.0%) | 0 (0.0%) |
| 3 or 4 Children | 0 (0.0%) | 11 (100.0%) |
| 5 or more Children | 0 (0.0%) | 0 (0.0%) |
| Total | 0 (0.0%) | 11 (45.8%) |
Race in Ironton
The most populous races in Ironton are White / Caucasian (286 | 93.2%), Black / African American (11 | 3.6%), and Two or more Races (10 | 3.3%).
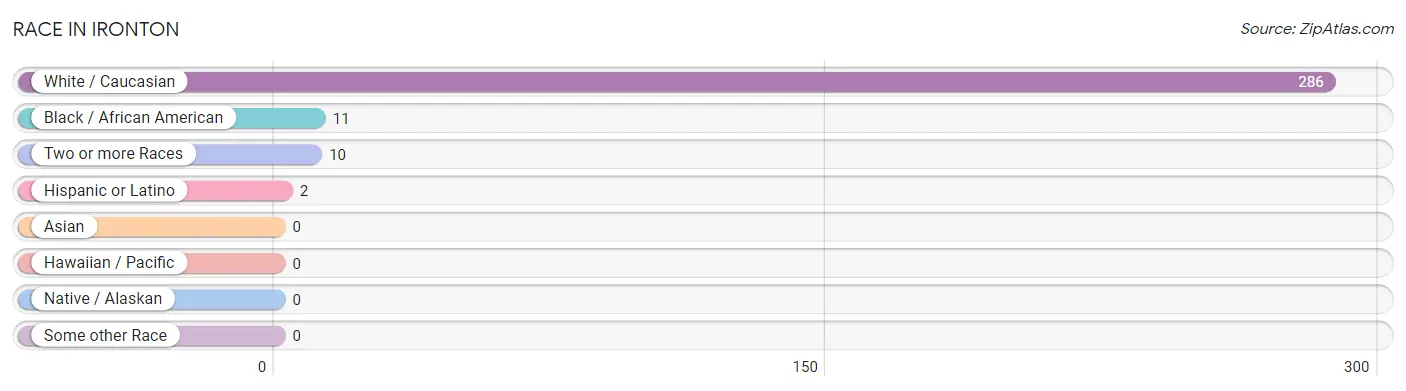
| Race | # Population | % Population |
| Asian | 0 | 0.0% |
| Black / African American | 11 | 3.6% |
| Hawaiian / Pacific | 0 | 0.0% |
| Hispanic or Latino | 2 | 0.6% |
| Native / Alaskan | 0 | 0.0% |
| White / Caucasian | 286 | 93.2% |
| Two or more Races | 10 | 3.3% |
| Some other Race | 0 | 0.0% |
| Total | 307 | 100.0% |
Ancestry in Ironton
The most populous ancestries reported in Ironton are German (109 | 35.5%), American (43 | 14.0%), English (37 | 12.0%), Polish (25 | 8.1%), and Irish (16 | 5.2%), together accounting for 74.9% of all Ironton residents.
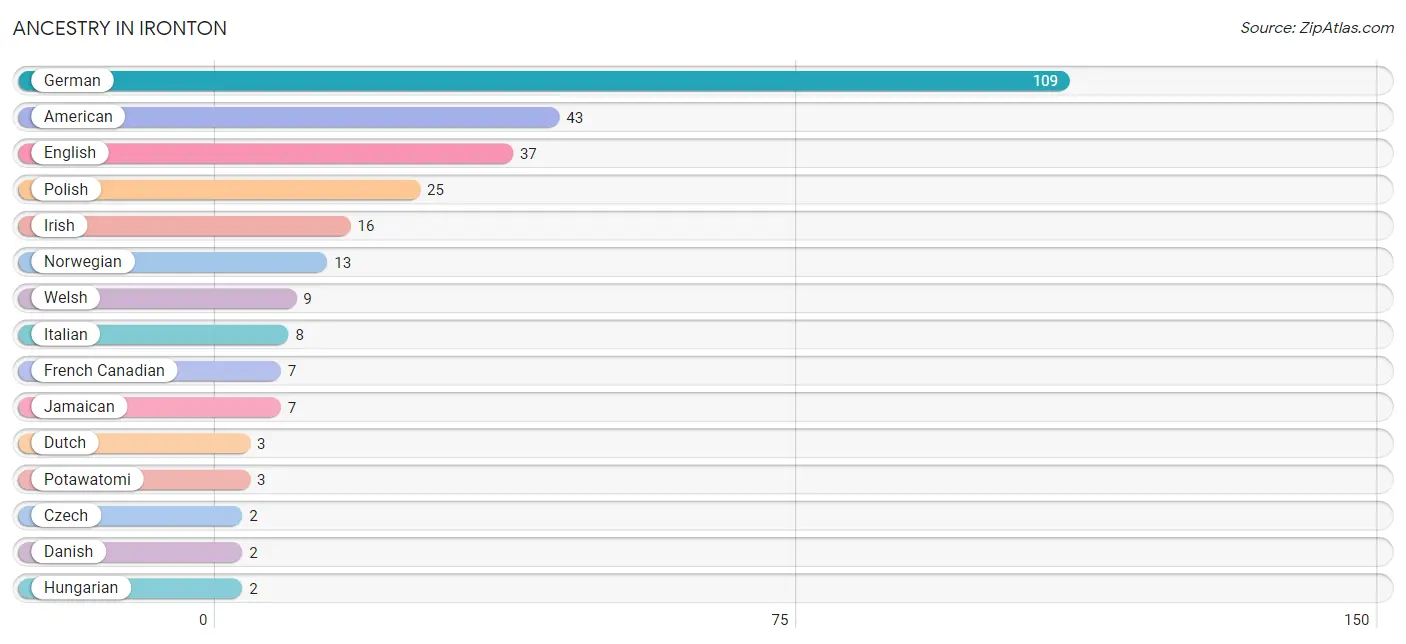
| Ancestry | # Population | % Population |
| American | 43 | 14.0% |
| Belgian | 1 | 0.3% |
| Czech | 2 | 0.6% |
| Danish | 2 | 0.6% |
| Dutch | 3 | 1.0% |
| English | 37 | 12.0% |
| French | 1 | 0.3% |
| French Canadian | 7 | 2.3% |
| German | 109 | 35.5% |
| Hungarian | 2 | 0.6% |
| Irish | 16 | 5.2% |
| Italian | 8 | 2.6% |
| Jamaican | 7 | 2.3% |
| Norwegian | 13 | 4.2% |
| Polish | 25 | 8.1% |
| Potawatomi | 3 | 1.0% |
| Puerto Rican | 2 | 0.6% |
| Scandinavian | 2 | 0.6% |
| Scotch-Irish | 2 | 0.6% |
| Welsh | 9 | 2.9% | View All 20 Rows |
Immigrants in Ironton

| Immigration Origin | # Population | % Population | View All 0 Rows |
Sex and Age in Ironton
Sex and Age in Ironton
The most populous age groups in Ironton are 15 to 19 Years (17 | 10.6%) for men and 15 to 19 Years (21 | 14.3%) for women.
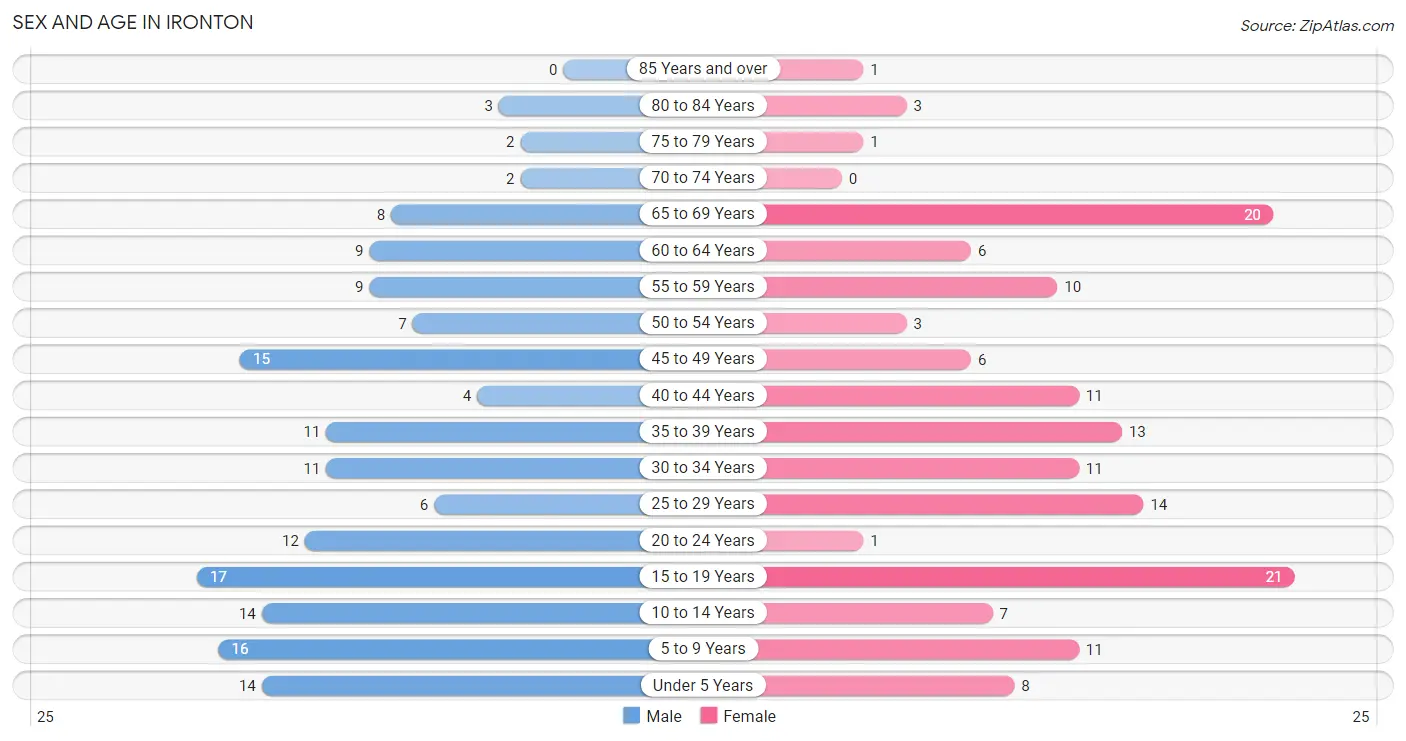
| Age Bracket | Male | Female |
| Under 5 Years | 14 (8.7%) | 8 (5.4%) |
| 5 to 9 Years | 16 (10.0%) | 11 (7.5%) |
| 10 to 14 Years | 14 (8.7%) | 7 (4.8%) |
| 15 to 19 Years | 17 (10.6%) | 21 (14.3%) |
| 20 to 24 Years | 12 (7.5%) | 1 (0.7%) |
| 25 to 29 Years | 6 (3.7%) | 14 (9.5%) |
| 30 to 34 Years | 11 (6.9%) | 11 (7.5%) |
| 35 to 39 Years | 11 (6.9%) | 13 (8.8%) |
| 40 to 44 Years | 4 (2.5%) | 11 (7.5%) |
| 45 to 49 Years | 15 (9.4%) | 6 (4.1%) |
| 50 to 54 Years | 7 (4.4%) | 3 (2.0%) |
| 55 to 59 Years | 9 (5.6%) | 10 (6.8%) |
| 60 to 64 Years | 9 (5.6%) | 6 (4.1%) |
| 65 to 69 Years | 8 (5.0%) | 20 (13.6%) |
| 70 to 74 Years | 2 (1.3%) | 0 (0.0%) |
| 75 to 79 Years | 2 (1.3%) | 1 (0.7%) |
| 80 to 84 Years | 3 (1.9%) | 3 (2.0%) |
| 85 Years and over | 0 (0.0%) | 1 (0.7%) |
| Total | 160 (100.0%) | 147 (100.0%) |
Families and Households in Ironton
Median Family Size in Ironton
The median family size in Ironton is 2.98 persons per family, with single male/father families (12 | 15.0%) accounting for the largest median family size of 3.75 persons per family. On the other hand, married-couple families (56 | 70.0%) represent the smallest median family size with 2.71 persons per family.
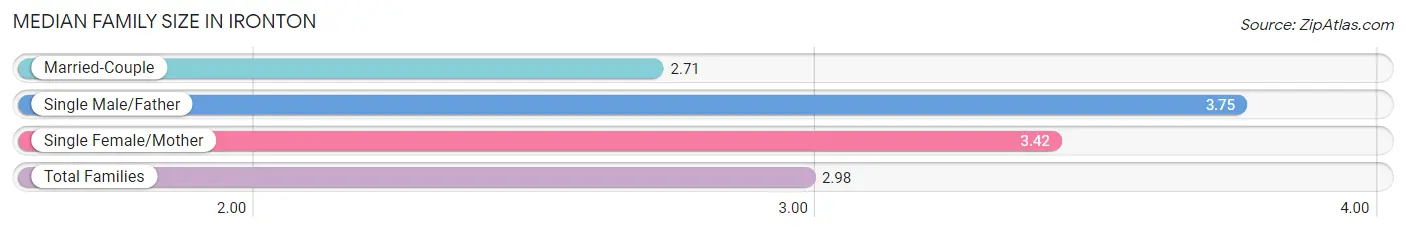
| Family Type | # Families | Family Size |
| Married-Couple | 56 (70.0%) | 2.71 |
| Single Male/Father | 12 (15.0%) | 3.75 |
| Single Female/Mother | 12 (15.0%) | 3.42 |
| Total Families | 80 (100.0%) | 2.98 |
Median Household Size in Ironton
The median household size in Ironton is 2.62 persons per household, with single male/father households (12 | 10.3%) accounting for the largest median household size of 4.42 persons per household. non-family households (37 | 31.6%) represent the smallest median household size with 1.43 persons per household.
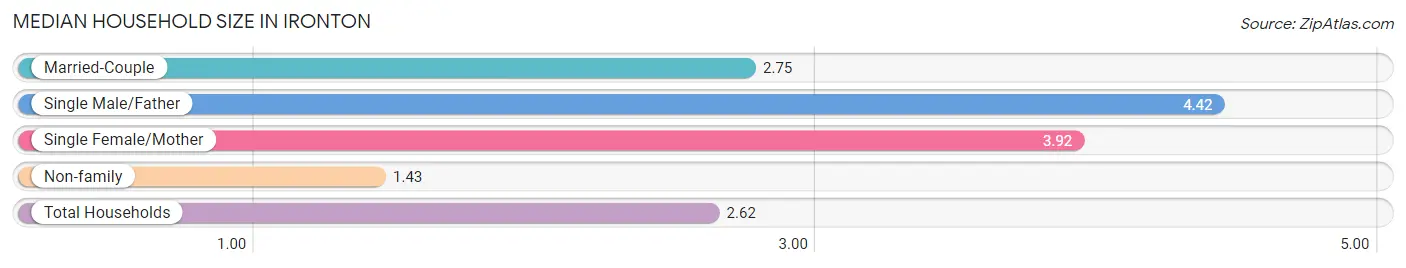
| Household Type | # Households | Household Size |
| Married-Couple | 56 (47.9%) | 2.75 |
| Single Male/Father | 12 (10.3%) | 4.42 |
| Single Female/Mother | 12 (10.3%) | 3.92 |
| Non-family | 37 (31.6%) | 1.43 |
| Total Households | 117 (100.0%) | 2.62 |
Household Size by Marriage Status in Ironton
Out of a total of 117 households in Ironton, 80 (68.4%) are family households, while 37 (31.6%) are nonfamily households. The most numerous type of family households are 2-person households, comprising 35, and the most common type of nonfamily households are 1-person households, comprising 22.
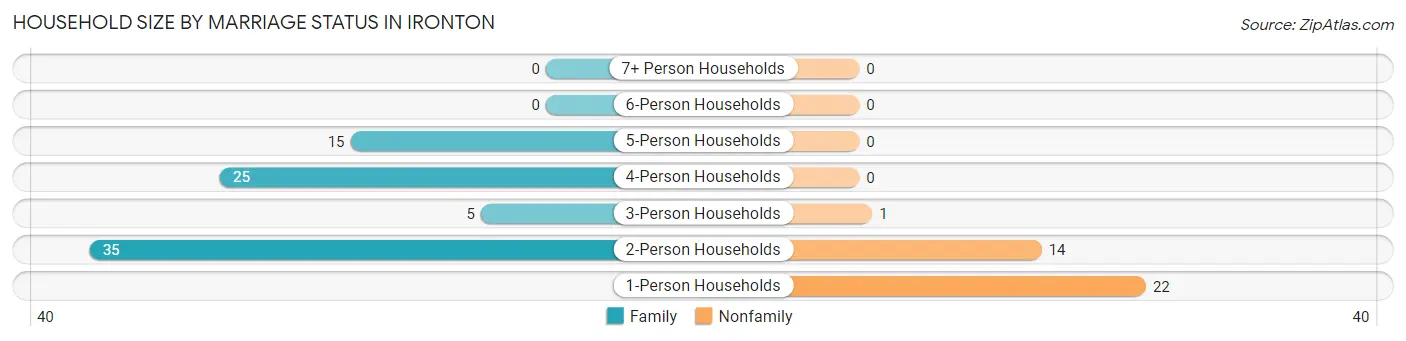
| Household Size | Family Households | Nonfamily Households |
| 1-Person Households | - | 22 (18.8%) |
| 2-Person Households | 35 (29.9%) | 14 (12.0%) |
| 3-Person Households | 5 (4.3%) | 1 (0.9%) |
| 4-Person Households | 25 (21.4%) | 0 (0.0%) |
| 5-Person Households | 15 (12.8%) | 0 (0.0%) |
| 6-Person Households | 0 (0.0%) | 0 (0.0%) |
| 7+ Person Households | 0 (0.0%) | 0 (0.0%) |
| Total | 80 (68.4%) | 37 (31.6%) |
Female Fertility in Ironton
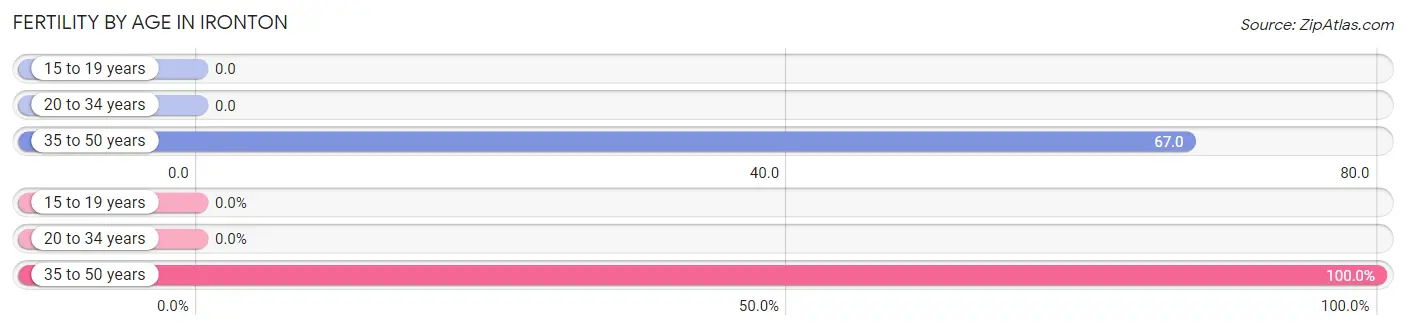
Fertility by Age in Ironton
Average fertility rate in Ironton is 26.0 births per 1,000 women. Women in the age bracket of 35 to 50 years have the highest fertility rate with 67.0 births per 1,000 women. Women in the age bracket of 35 to 50 years acount for 100.0% of all women with births.
| Age Bracket | Women with Births | Births / 1,000 Women |
| 15 to 19 years | 0 (0.0%) | 0.0 |
| 20 to 34 years | 0 (0.0%) | 0.0 |
| 35 to 50 years | 2 (100.0%) | 67.0 |
| Total | 2 (100.0%) | 26.0 |
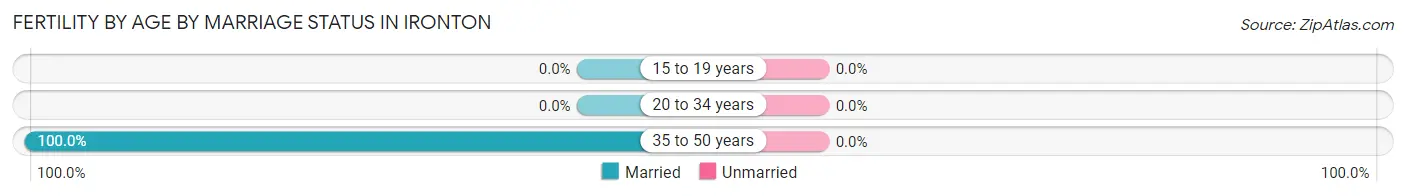
Fertility by Age by Marriage Status in Ironton
| Age Bracket | Married | Unmarried |
| 15 to 19 years | 0 (0.0%) | 0 (0.0%) |
| 20 to 34 years | 0 (0.0%) | 0 (0.0%) |
| 35 to 50 years | 2 (100.0%) | 0 (0.0%) |
| Total | 2 (100.0%) | 0 (0.0%) |
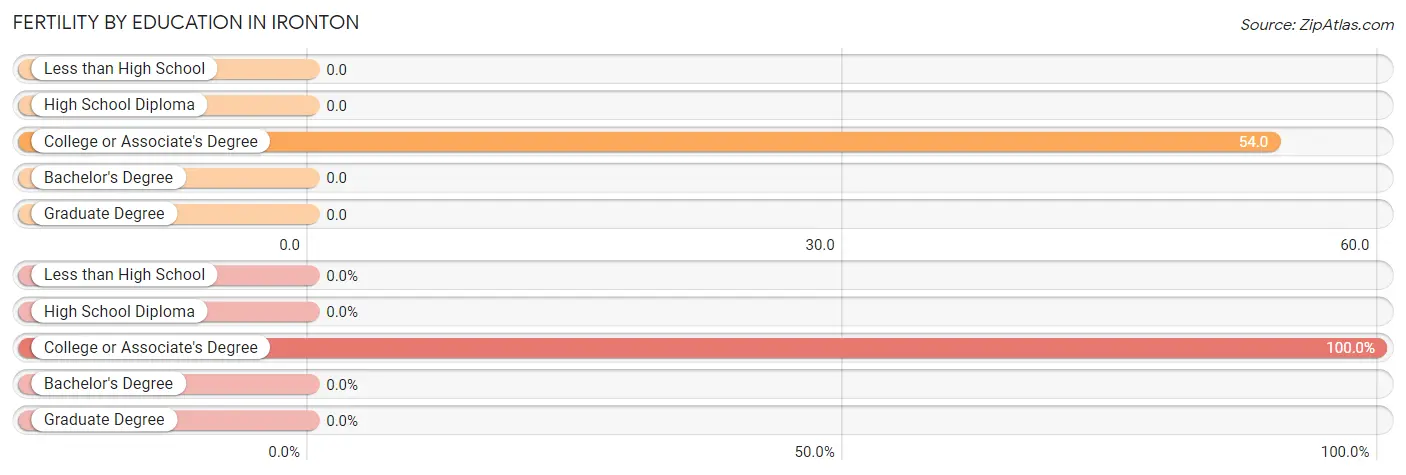
Fertility by Education in Ironton
| Educational Attainment | Women with Births | Births / 1,000 Women |
| Less than High School | 0 (0.0%) | 0.0 |
| High School Diploma | 0 (0.0%) | 0.0 |
| College or Associate's Degree | 2 (100.0%) | 54.0 |
| Bachelor's Degree | 0 (0.0%) | 0.0 |
| Graduate Degree | 0 (0.0%) | 0.0 |
| Total | 2 (100.0%) | 26.0 |
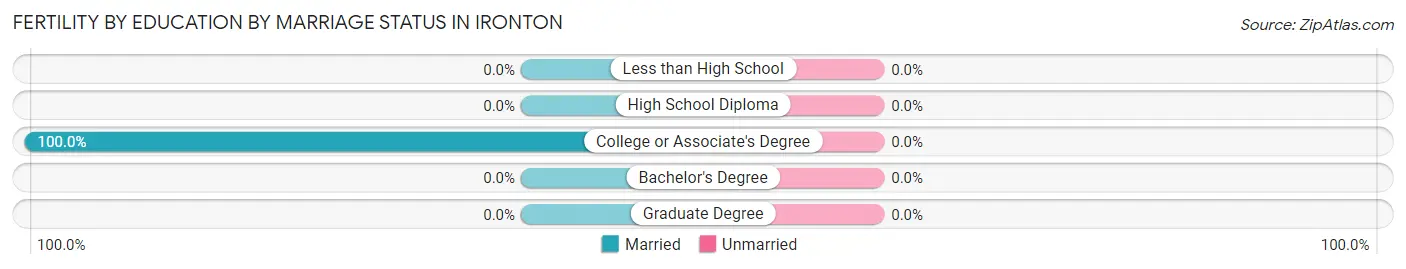
Fertility by Education by Marriage Status in Ironton
| Educational Attainment | Married | Unmarried |
| Less than High School | 0 (0.0%) | 0 (0.0%) |
| High School Diploma | 0 (0.0%) | 0 (0.0%) |
| College or Associate's Degree | 2 (100.0%) | 0 (0.0%) |
| Bachelor's Degree | 0 (0.0%) | 0 (0.0%) |
| Graduate Degree | 0 (0.0%) | 0 (0.0%) |
| Total | 2 (100.0%) | 0 (0.0%) |
Employment Characteristics in Ironton
Employment by Class of Employer in Ironton
Among the 139 employed individuals in Ironton, private company employees (121 | 87.1%), state government employees (10 | 7.2%), and federal government employees (3 | 2.2%) make up the most common classes of employment.
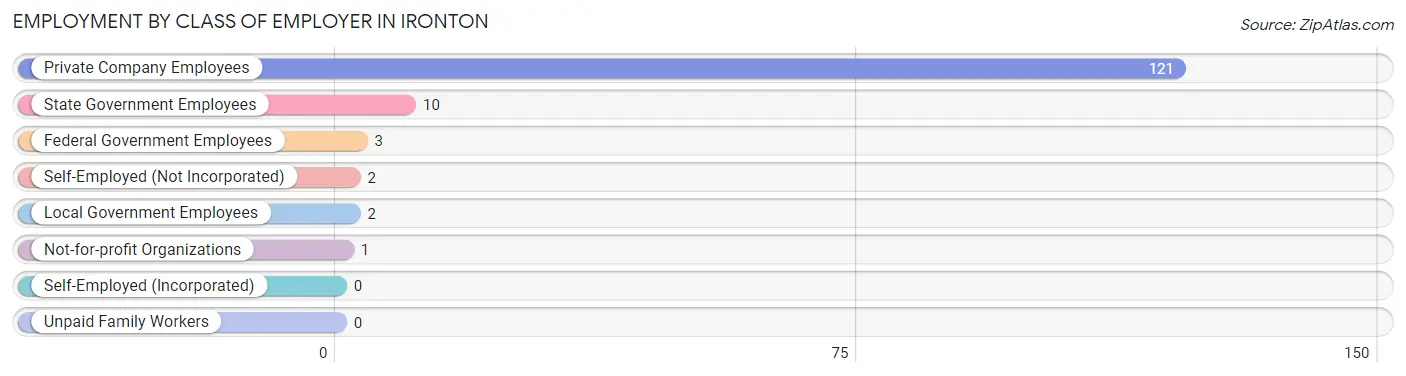
| Employer Class | # Employees | % Employees |
| Private Company Employees | 121 | 87.1% |
| Self-Employed (Incorporated) | 0 | 0.0% |
| Self-Employed (Not Incorporated) | 2 | 1.4% |
| Not-for-profit Organizations | 1 | 0.7% |
| Local Government Employees | 2 | 1.4% |
| State Government Employees | 10 | 7.2% |
| Federal Government Employees | 3 | 2.2% |
| Unpaid Family Workers | 0 | 0.0% |
| Total | 139 | 100.0% |
Employment Status by Age in Ironton
According to the labor force statistics for Ironton, out of the total population over 16 years of age (225), 66.2% or 149 individuals are in the labor force, with 6.0% or 9 of them unemployed. The age group with the highest labor force participation rate is 20 to 24 years, with 100.0% or 13 individuals in the labor force. Within the labor force, the 45 to 54 years age range has the highest percentage of unemployed individuals, with 23.3% or 7 of them being unemployed.
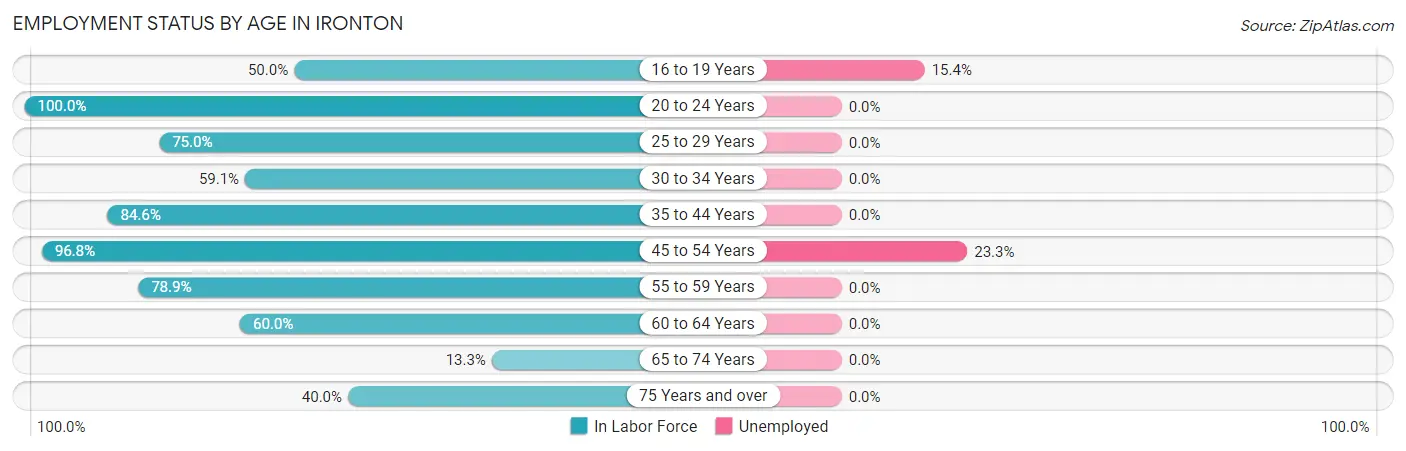
| Age Bracket | In Labor Force | Unemployed |
| 16 to 19 Years | 13 (50.0%) | 2 (15.4%) |
| 20 to 24 Years | 13 (100.0%) | 0 (0.0%) |
| 25 to 29 Years | 15 (75.0%) | 0 (0.0%) |
| 30 to 34 Years | 13 (59.1%) | 0 (0.0%) |
| 35 to 44 Years | 33 (84.6%) | 0 (0.0%) |
| 45 to 54 Years | 30 (96.8%) | 7 (23.3%) |
| 55 to 59 Years | 15 (78.9%) | 0 (0.0%) |
| 60 to 64 Years | 9 (60.0%) | 0 (0.0%) |
| 65 to 74 Years | 4 (13.3%) | 0 (0.0%) |
| 75 Years and over | 4 (40.0%) | 0 (0.0%) |
| Total | 149 (66.2%) | 9 (6.0%) |
Employment Status by Educational Attainment in Ironton
According to labor force statistics for Ironton, 78.8% of individuals (115) out of the total population between 25 and 64 years of age (146) are in the labor force, with 6.1% or 7 of them being unemployed. The group with the highest labor force participation rate are those with the educational attainment of bachelor's degree or higher, with 100.0% or 12 individuals in the labor force. Within the labor force, individuals with bachelor's degree or higher education have the highest percentage of unemployment, with 58.3% or 7 of them being unemployed.
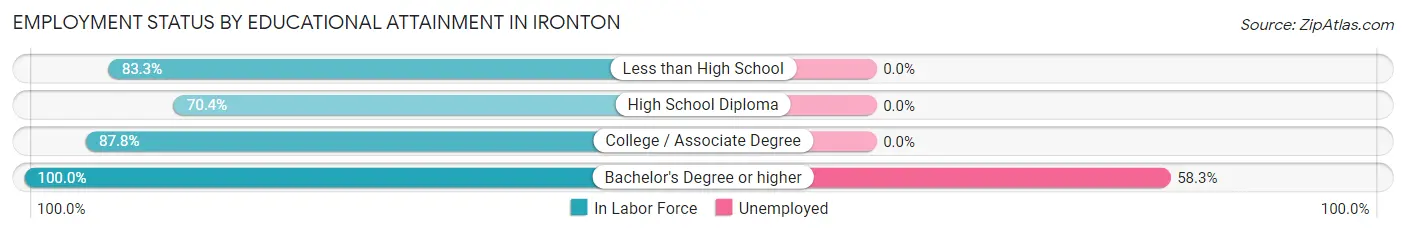
| Educational Attainment | In Labor Force | Unemployed |
| Less than High School | 10 (83.3%) | 0 (0.0%) |
| High School Diploma | 57 (70.4%) | 0 (0.0%) |
| College / Associate Degree | 36 (87.8%) | 0 (0.0%) |
| Bachelor's Degree or higher | 12 (100.0%) | 7 (58.3%) |
| Total | 115 (78.8%) | 9 (6.1%) |
Employment Occupations by Sex in Ironton
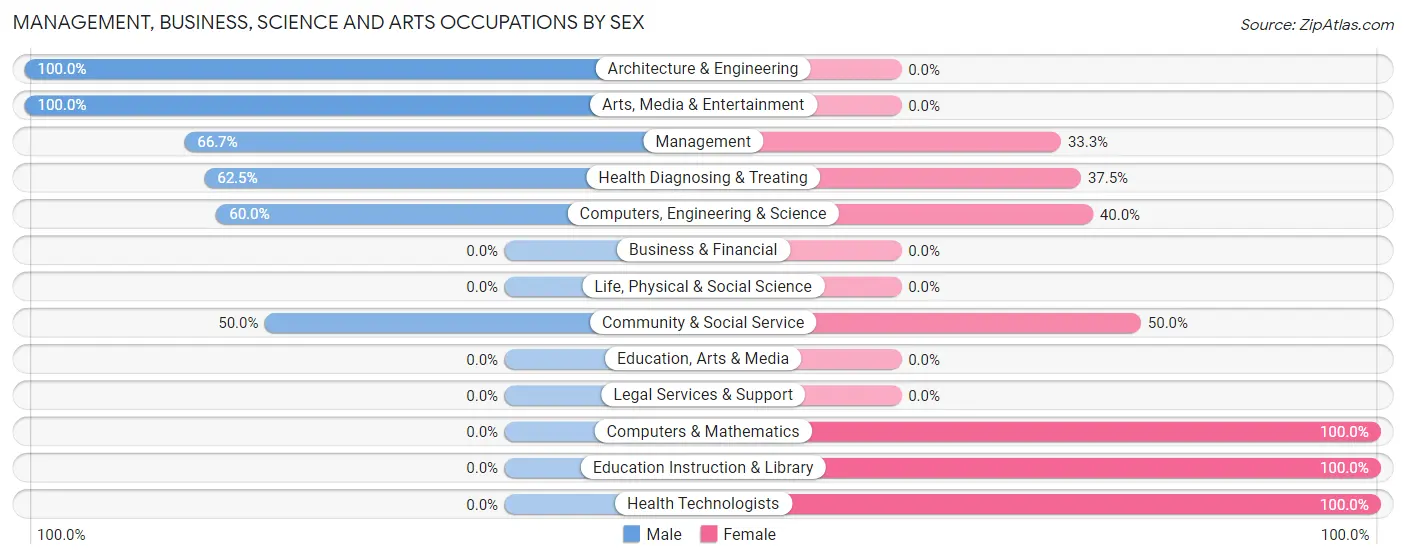
Management, Business, Science and Arts Occupations
The most common Management, Business, Science and Arts occupations in Ironton are Health Diagnosing & Treating (8 | 5.7%), Management (6 | 4.3%), Computers, Engineering & Science (5 | 3.6%), Architecture & Engineering (3 | 2.1%), and Computers & Mathematics (2 | 1.4%).
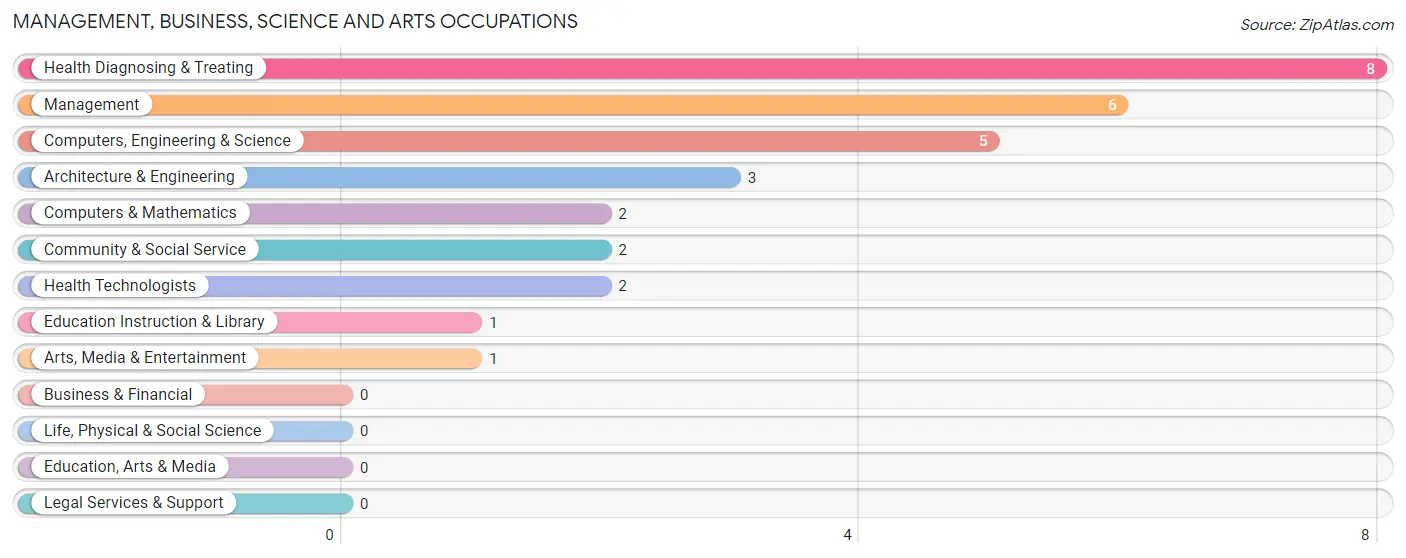
Management, Business, Science and Arts Occupations by Sex
Within the Management, Business, Science and Arts occupations in Ironton, the most male-oriented occupations are Architecture & Engineering (100.0%), Arts, Media & Entertainment (100.0%), and Management (66.7%), while the most female-oriented occupations are Computers & Mathematics (100.0%), Education Instruction & Library (100.0%), and Health Technologists (100.0%).
| Occupation | Male | Female |
| Management | 4 (66.7%) | 2 (33.3%) |
| Business & Financial | 0 (0.0%) | 0 (0.0%) |
| Computers, Engineering & Science | 3 (60.0%) | 2 (40.0%) |
| Computers & Mathematics | 0 (0.0%) | 2 (100.0%) |
| Architecture & Engineering | 3 (100.0%) | 0 (0.0%) |
| Life, Physical & Social Science | 0 (0.0%) | 0 (0.0%) |
| Community & Social Service | 1 (50.0%) | 1 (50.0%) |
| Education, Arts & Media | 0 (0.0%) | 0 (0.0%) |
| Legal Services & Support | 0 (0.0%) | 0 (0.0%) |
| Education Instruction & Library | 0 (0.0%) | 1 (100.0%) |
| Arts, Media & Entertainment | 1 (100.0%) | 0 (0.0%) |
| Health Diagnosing & Treating | 5 (62.5%) | 3 (37.5%) |
| Health Technologists | 0 (0.0%) | 2 (100.0%) |
| Total (Category) | 13 (61.9%) | 8 (38.1%) |
| Total (Overall) | 79 (56.4%) | 61 (43.6%) |
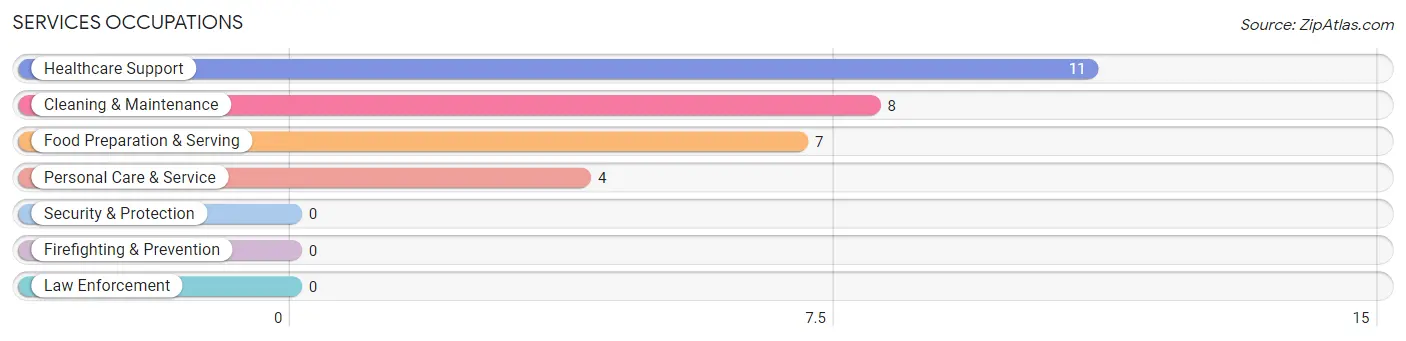
Services Occupations
The most common Services occupations in Ironton are Healthcare Support (11 | 7.9%), Cleaning & Maintenance (8 | 5.7%), Food Preparation & Serving (7 | 5.0%), and Personal Care & Service (4 | 2.9%).
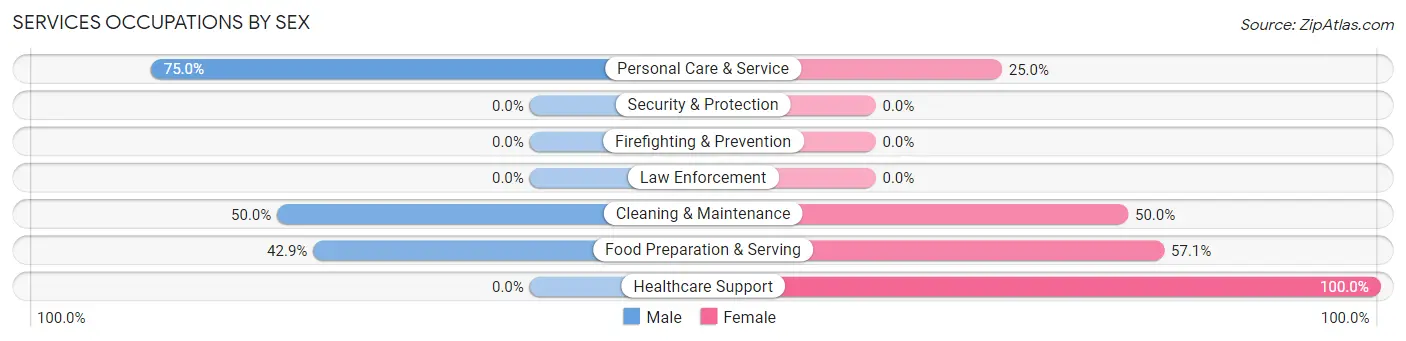
Services Occupations by Sex
Within the Services occupations in Ironton, the most male-oriented occupations are Personal Care & Service (75.0%), Cleaning & Maintenance (50.0%), and Food Preparation & Serving (42.9%), while the most female-oriented occupations are Healthcare Support (100.0%), Food Preparation & Serving (57.1%), and Cleaning & Maintenance (50.0%).
| Occupation | Male | Female |
| Healthcare Support | 0 (0.0%) | 11 (100.0%) |
| Security & Protection | 0 (0.0%) | 0 (0.0%) |
| Firefighting & Prevention | 0 (0.0%) | 0 (0.0%) |
| Law Enforcement | 0 (0.0%) | 0 (0.0%) |
| Food Preparation & Serving | 3 (42.9%) | 4 (57.1%) |
| Cleaning & Maintenance | 4 (50.0%) | 4 (50.0%) |
| Personal Care & Service | 3 (75.0%) | 1 (25.0%) |
| Total (Category) | 10 (33.3%) | 20 (66.7%) |
| Total (Overall) | 79 (56.4%) | 61 (43.6%) |
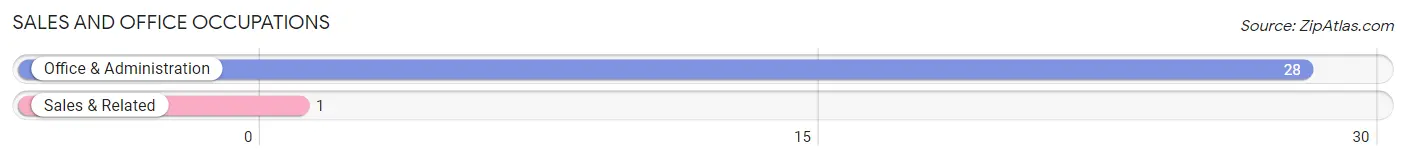
Sales and Office Occupations
The most common Sales and Office occupations in Ironton are Office & Administration (28 | 20.0%), and Sales & Related (1 | 0.7%).
Sales and Office Occupations by Sex
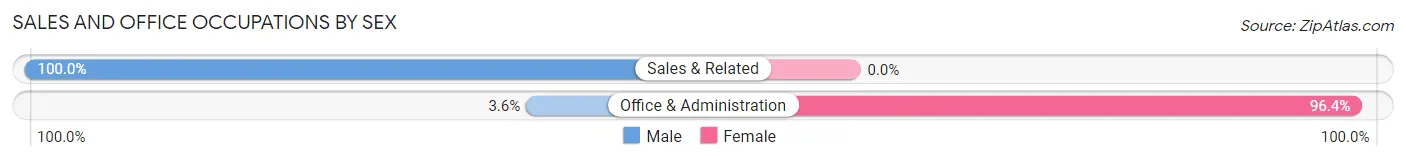
| Occupation | Male | Female |
| Sales & Related | 1 (100.0%) | 0 (0.0%) |
| Office & Administration | 1 (3.6%) | 27 (96.4%) |
| Total (Category) | 2 (6.9%) | 27 (93.1%) |
| Total (Overall) | 79 (56.4%) | 61 (43.6%) |
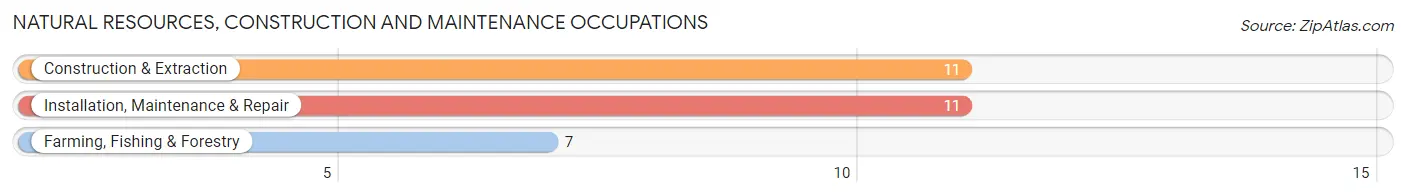
Natural Resources, Construction and Maintenance Occupations
The most common Natural Resources, Construction and Maintenance occupations in Ironton are Construction & Extraction (11 | 7.9%), Installation, Maintenance & Repair (11 | 7.9%), and Farming, Fishing & Forestry (7 | 5.0%).
Natural Resources, Construction and Maintenance Occupations by Sex
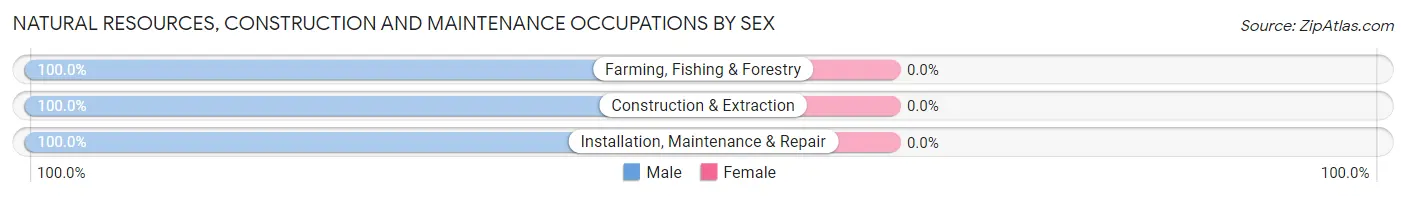
| Occupation | Male | Female |
| Farming, Fishing & Forestry | 7 (100.0%) | 0 (0.0%) |
| Construction & Extraction | 11 (100.0%) | 0 (0.0%) |
| Installation, Maintenance & Repair | 11 (100.0%) | 0 (0.0%) |
| Total (Category) | 29 (100.0%) | 0 (0.0%) |
| Total (Overall) | 79 (56.4%) | 61 (43.6%) |
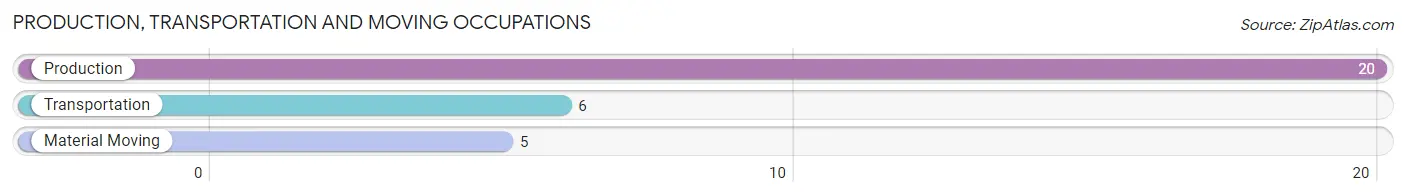
Production, Transportation and Moving Occupations
The most common Production, Transportation and Moving occupations in Ironton are Production (20 | 14.3%), Transportation (6 | 4.3%), and Material Moving (5 | 3.6%).
Production, Transportation and Moving Occupations by Sex
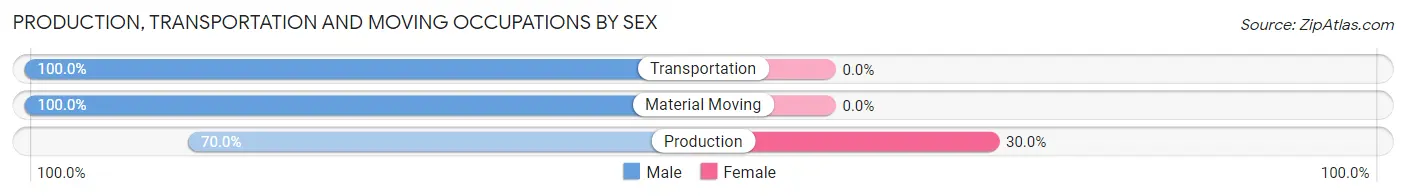
| Occupation | Male | Female |
| Production | 14 (70.0%) | 6 (30.0%) |
| Transportation | 6 (100.0%) | 0 (0.0%) |
| Material Moving | 5 (100.0%) | 0 (0.0%) |
| Total (Category) | 25 (80.6%) | 6 (19.4%) |
| Total (Overall) | 79 (56.4%) | 61 (43.6%) |
Employment Industries by Sex in Ironton
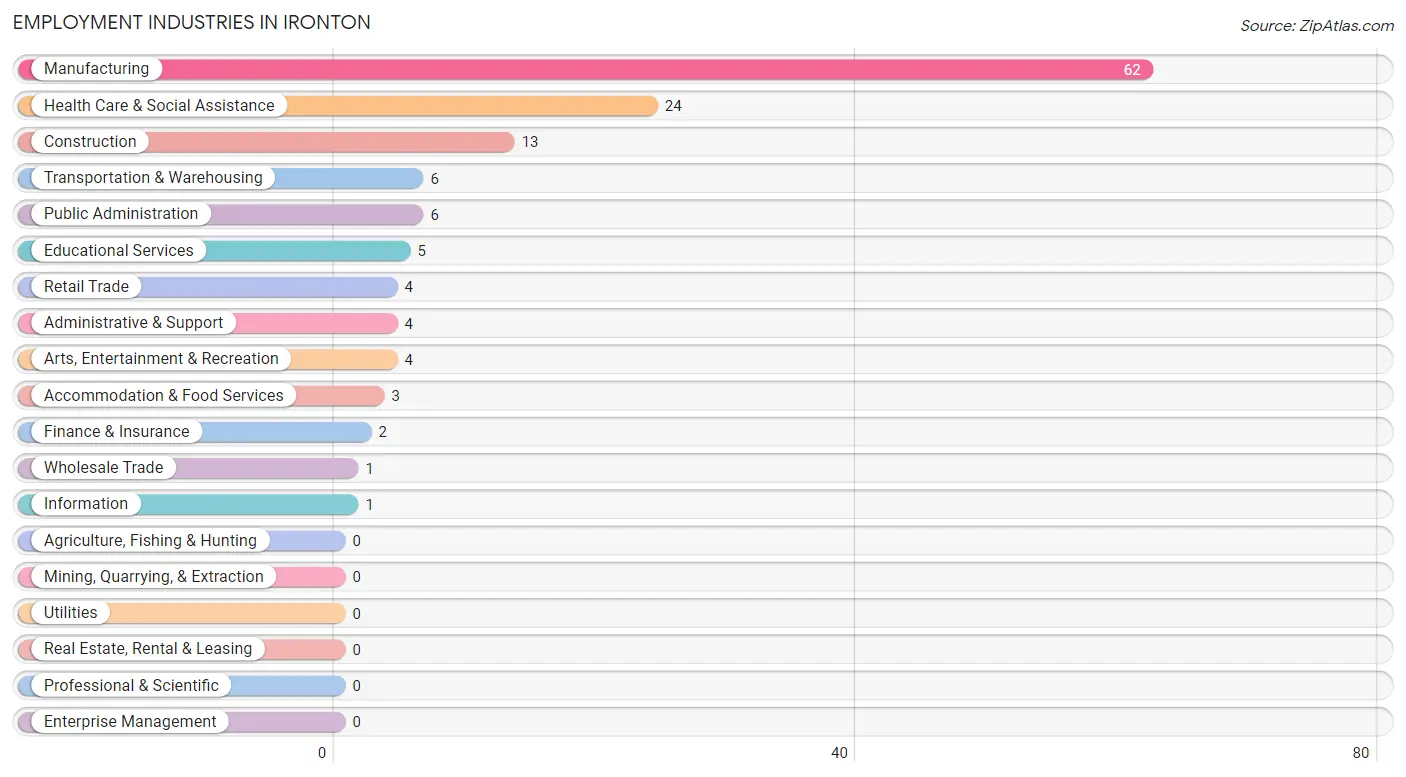
Employment Industries in Ironton
The major employment industries in Ironton include Manufacturing (62 | 44.3%), Health Care & Social Assistance (24 | 17.1%), Construction (13 | 9.3%), Transportation & Warehousing (6 | 4.3%), and Public Administration (6 | 4.3%).
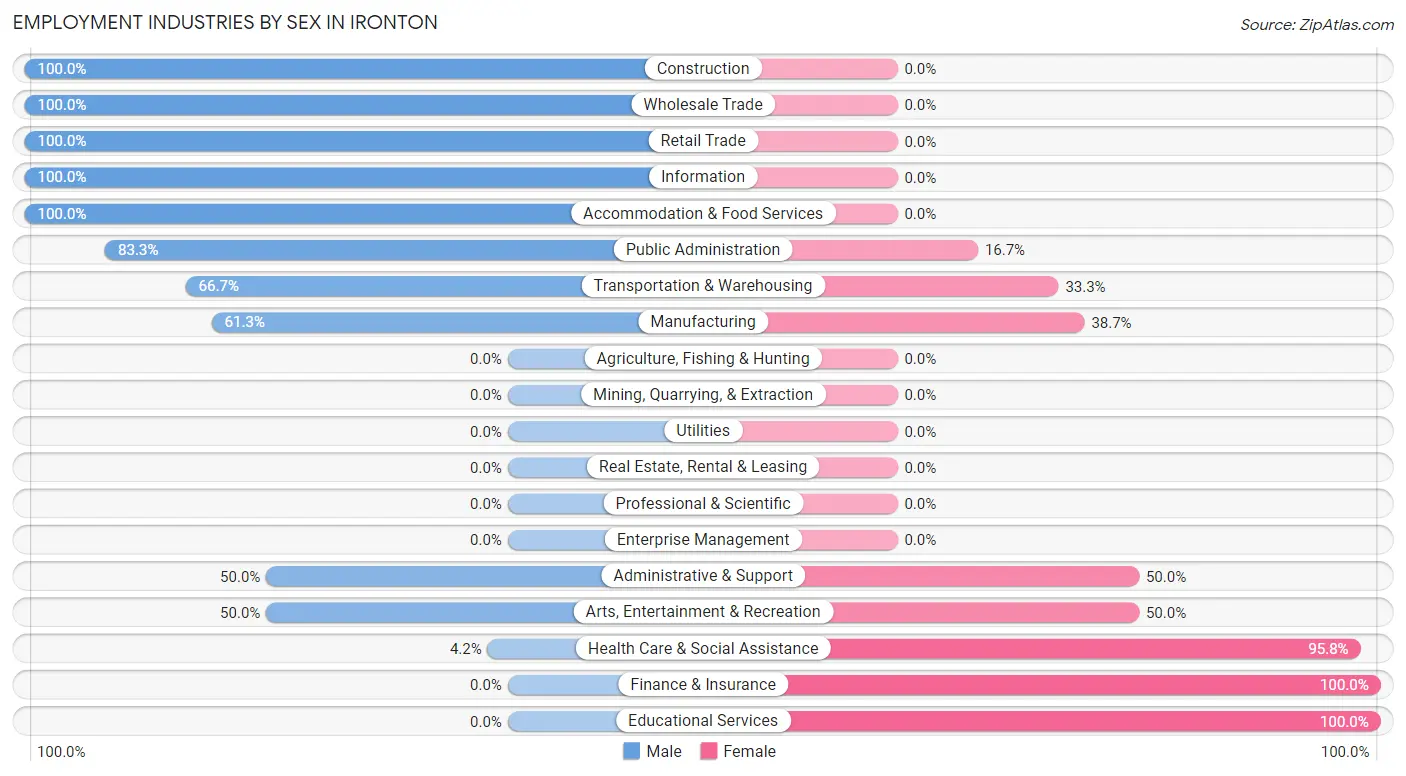
Employment Industries by Sex in Ironton
The Ironton industries that see more men than women are Construction (100.0%), Wholesale Trade (100.0%), and Retail Trade (100.0%), whereas the industries that tend to have a higher number of women are Finance & Insurance (100.0%), Educational Services (100.0%), and Health Care & Social Assistance (95.8%).
| Industry | Male | Female |
| Agriculture, Fishing & Hunting | 0 (0.0%) | 0 (0.0%) |
| Mining, Quarrying, & Extraction | 0 (0.0%) | 0 (0.0%) |
| Construction | 13 (100.0%) | 0 (0.0%) |
| Manufacturing | 38 (61.3%) | 24 (38.7%) |
| Wholesale Trade | 1 (100.0%) | 0 (0.0%) |
| Retail Trade | 4 (100.0%) | 0 (0.0%) |
| Transportation & Warehousing | 4 (66.7%) | 2 (33.3%) |
| Utilities | 0 (0.0%) | 0 (0.0%) |
| Information | 1 (100.0%) | 0 (0.0%) |
| Finance & Insurance | 0 (0.0%) | 2 (100.0%) |
| Real Estate, Rental & Leasing | 0 (0.0%) | 0 (0.0%) |
| Professional & Scientific | 0 (0.0%) | 0 (0.0%) |
| Enterprise Management | 0 (0.0%) | 0 (0.0%) |
| Administrative & Support | 2 (50.0%) | 2 (50.0%) |
| Educational Services | 0 (0.0%) | 5 (100.0%) |
| Health Care & Social Assistance | 1 (4.2%) | 23 (95.8%) |
| Arts, Entertainment & Recreation | 2 (50.0%) | 2 (50.0%) |
| Accommodation & Food Services | 3 (100.0%) | 0 (0.0%) |
| Public Administration | 5 (83.3%) | 1 (16.7%) |
| Total | 79 (56.4%) | 61 (43.6%) |
Education in Ironton
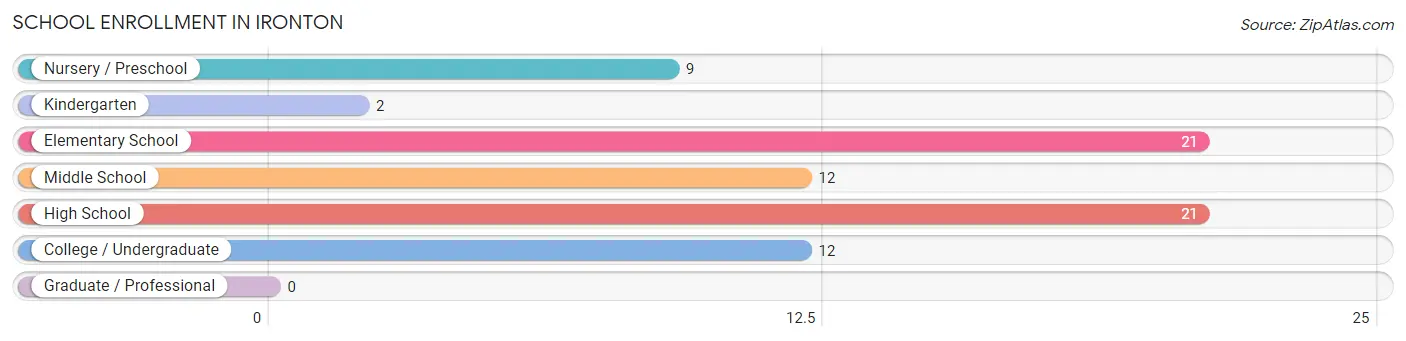
School Enrollment in Ironton
The most common levels of schooling among the 77 students in Ironton are elementary school (21 | 27.3%), high school (21 | 27.3%), and middle school (12 | 15.6%).
| School Level | # Students | % Students |
| Nursery / Preschool | 9 | 11.7% |
| Kindergarten | 2 | 2.6% |
| Elementary School | 21 | 27.3% |
| Middle School | 12 | 15.6% |
| High School | 21 | 27.3% |
| College / Undergraduate | 12 | 15.6% |
| Graduate / Professional | 0 | 0.0% |
| Total | 77 | 100.0% |
School Enrollment by Age by Funding Source in Ironton
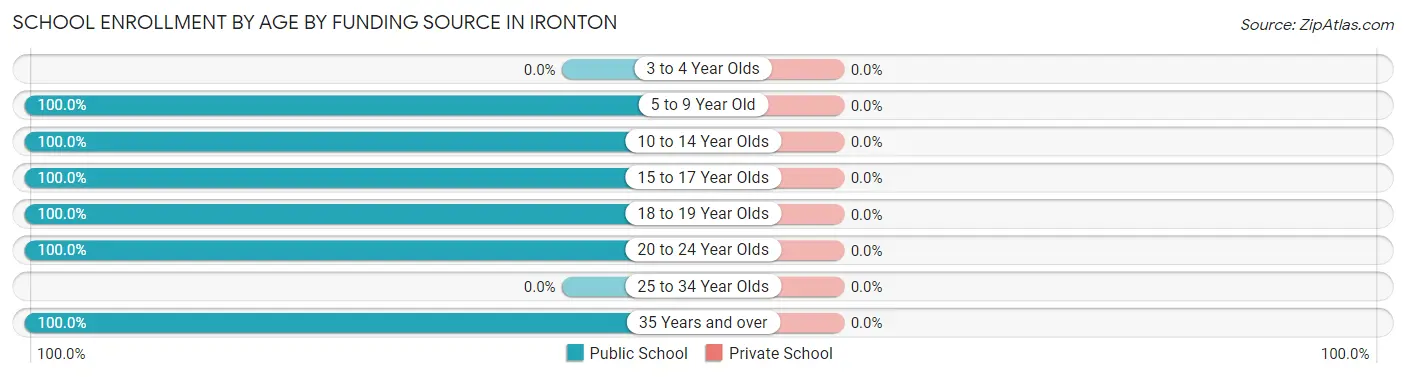
| Age Bracket | Public School | Private School |
| 3 to 4 Year Olds | 0 (0.0%) | 0 (0.0%) |
| 5 to 9 Year Old | 26 (100.0%) | 0 (0.0%) |
| 10 to 14 Year Olds | 21 (100.0%) | 0 (0.0%) |
| 15 to 17 Year Olds | 15 (100.0%) | 0 (0.0%) |
| 18 to 19 Year Olds | 13 (100.0%) | 0 (0.0%) |
| 20 to 24 Year Olds | 1 (100.0%) | 0 (0.0%) |
| 25 to 34 Year Olds | 0 (0.0%) | 0 (0.0%) |
| 35 Years and over | 1 (100.0%) | 0 (0.0%) |
| Total | 77 (100.0%) | 0 (0.0%) |
Educational Attainment by Field of Study in Ironton
Bio, nature & agricultural (7 | 58.3%), business (3 | 25.0%), and arts & humanities (2 | 16.7%) are the most common fields of study among 12 individuals in Ironton who have obtained a bachelor's degree or higher.
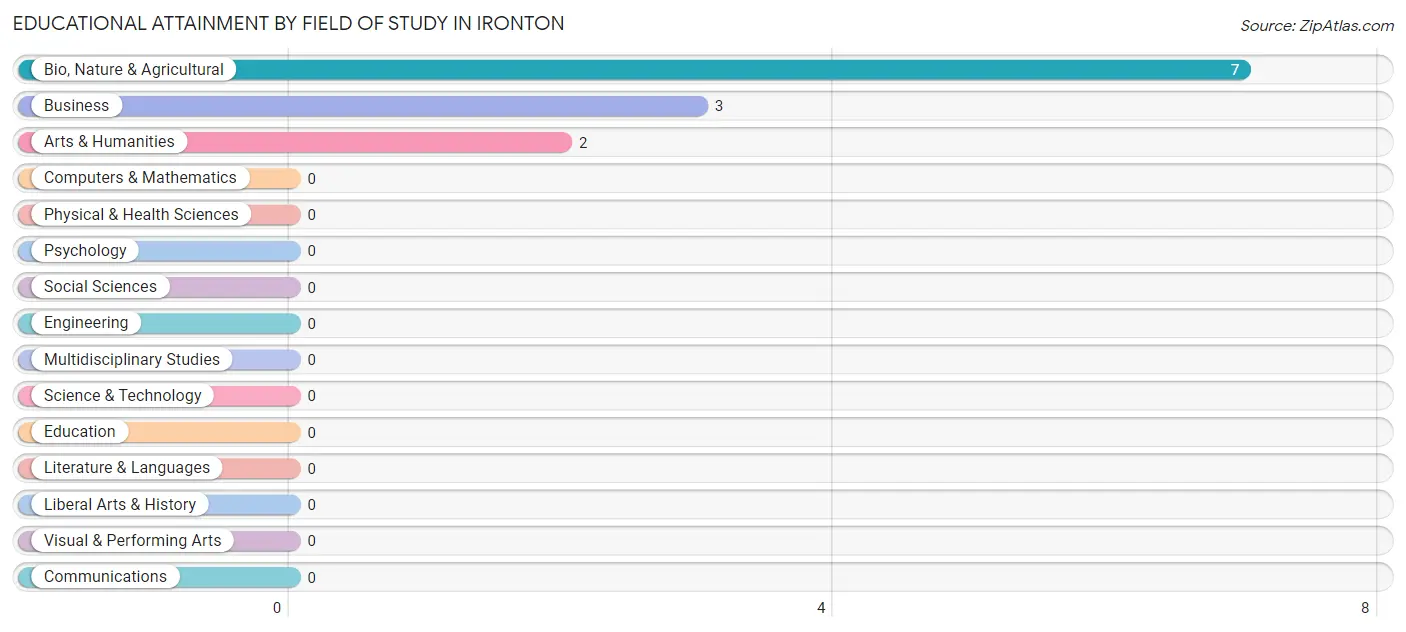
| Field of Study | # Graduates | % Graduates |
| Computers & Mathematics | 0 | 0.0% |
| Bio, Nature & Agricultural | 7 | 58.3% |
| Physical & Health Sciences | 0 | 0.0% |
| Psychology | 0 | 0.0% |
| Social Sciences | 0 | 0.0% |
| Engineering | 0 | 0.0% |
| Multidisciplinary Studies | 0 | 0.0% |
| Science & Technology | 0 | 0.0% |
| Business | 3 | 25.0% |
| Education | 0 | 0.0% |
| Literature & Languages | 0 | 0.0% |
| Liberal Arts & History | 0 | 0.0% |
| Visual & Performing Arts | 0 | 0.0% |
| Communications | 0 | 0.0% |
| Arts & Humanities | 2 | 16.7% |
| Total | 12 | 100.0% |
Transportation & Commute in Ironton
Vehicle Availability by Sex in Ironton
The most prevalent vehicle ownership categories in Ironton are males with 2 vehicles (32, accounting for 41.0%) and females with 2 vehicles (17, making up 52.5%).
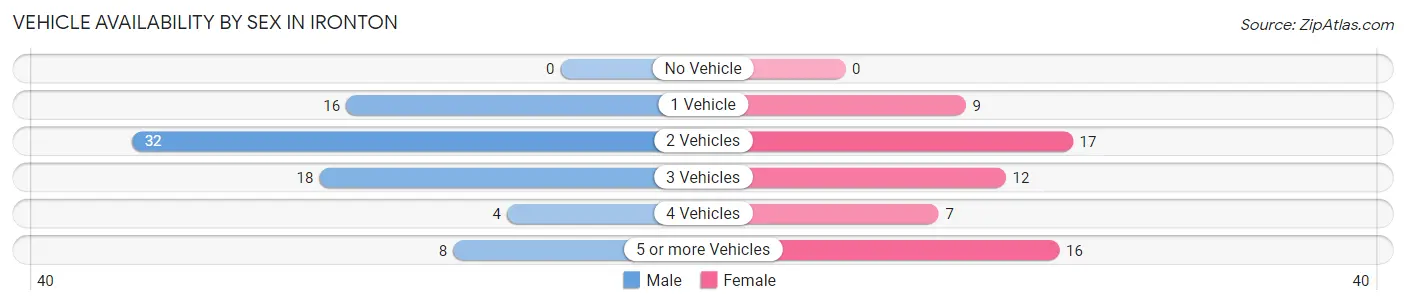
| Vehicles Available | Male | Female |
| No Vehicle | 0 (0.0%) | 0 (0.0%) |
| 1 Vehicle | 16 (20.5%) | 9 (14.7%) |
| 2 Vehicles | 32 (41.0%) | 17 (27.9%) |
| 3 Vehicles | 18 (23.1%) | 12 (19.7%) |
| 4 Vehicles | 4 (5.1%) | 7 (11.5%) |
| 5 or more Vehicles | 8 (10.3%) | 16 (26.2%) |
| Total | 78 (100.0%) | 61 (100.0%) |
Commute Time in Ironton
The most frequently occuring commute durations in Ironton are 15 to 19 minutes (45 commuters, 32.6%), 20 to 24 minutes (43 commuters, 31.2%), and 10 to 14 minutes (19 commuters, 13.8%).
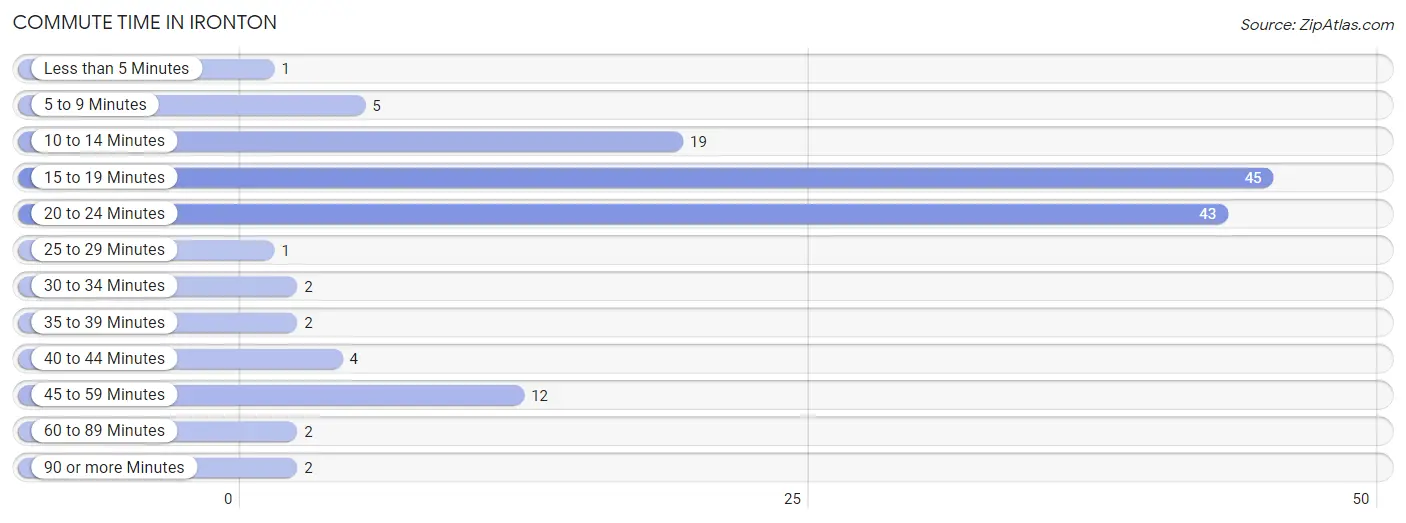
| Commute Time | # Commuters | % Commuters |
| Less than 5 Minutes | 1 | 0.7% |
| 5 to 9 Minutes | 5 | 3.6% |
| 10 to 14 Minutes | 19 | 13.8% |
| 15 to 19 Minutes | 45 | 32.6% |
| 20 to 24 Minutes | 43 | 31.2% |
| 25 to 29 Minutes | 1 | 0.7% |
| 30 to 34 Minutes | 2 | 1.5% |
| 35 to 39 Minutes | 2 | 1.5% |
| 40 to 44 Minutes | 4 | 2.9% |
| 45 to 59 Minutes | 12 | 8.7% |
| 60 to 89 Minutes | 2 | 1.5% |
| 90 or more Minutes | 2 | 1.5% |
Commute Time by Sex in Ironton
The most common commute times in Ironton are 20 to 24 minutes (34 commuters, 44.2%) for males and 10 to 14 minutes (18 commuters, 29.5%) for females.
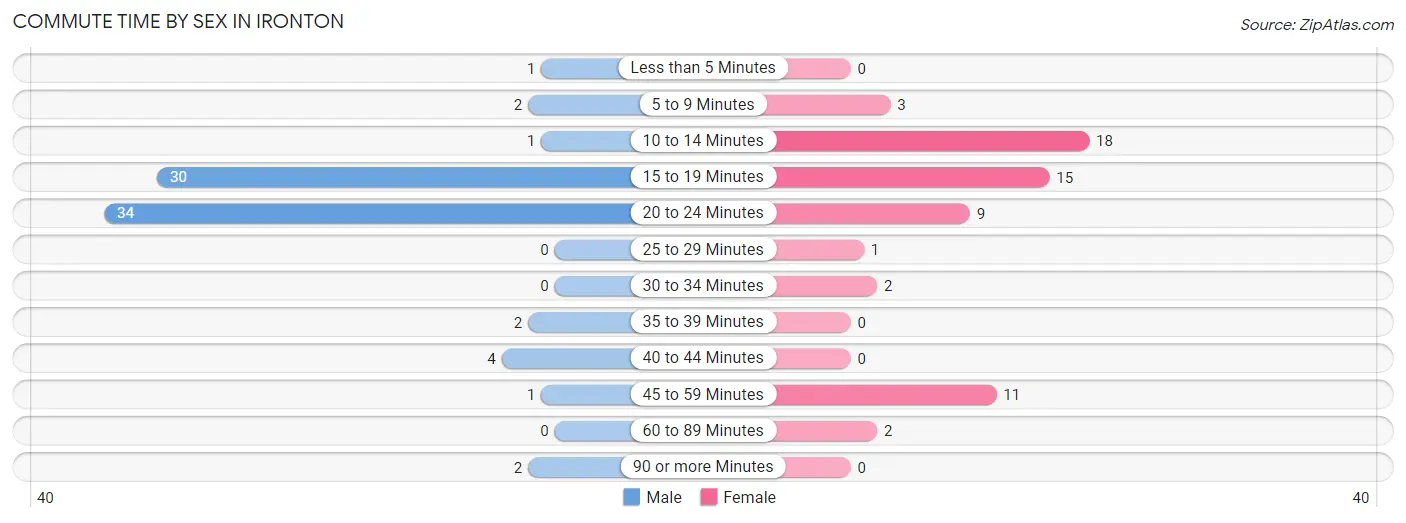
| Commute Time | Male | Female |
| Less than 5 Minutes | 1 (1.3%) | 0 (0.0%) |
| 5 to 9 Minutes | 2 (2.6%) | 3 (4.9%) |
| 10 to 14 Minutes | 1 (1.3%) | 18 (29.5%) |
| 15 to 19 Minutes | 30 (39.0%) | 15 (24.6%) |
| 20 to 24 Minutes | 34 (44.2%) | 9 (14.7%) |
| 25 to 29 Minutes | 0 (0.0%) | 1 (1.6%) |
| 30 to 34 Minutes | 0 (0.0%) | 2 (3.3%) |
| 35 to 39 Minutes | 2 (2.6%) | 0 (0.0%) |
| 40 to 44 Minutes | 4 (5.2%) | 0 (0.0%) |
| 45 to 59 Minutes | 1 (1.3%) | 11 (18.0%) |
| 60 to 89 Minutes | 0 (0.0%) | 2 (3.3%) |
| 90 or more Minutes | 2 (2.6%) | 0 (0.0%) |
Time of Departure to Work by Sex in Ironton
The most frequent times of departure to work in Ironton are 4:00 PM to 11:59 PM (25, 32.5%) for males and 4:00 PM to 11:59 PM (13, 21.3%) for females.
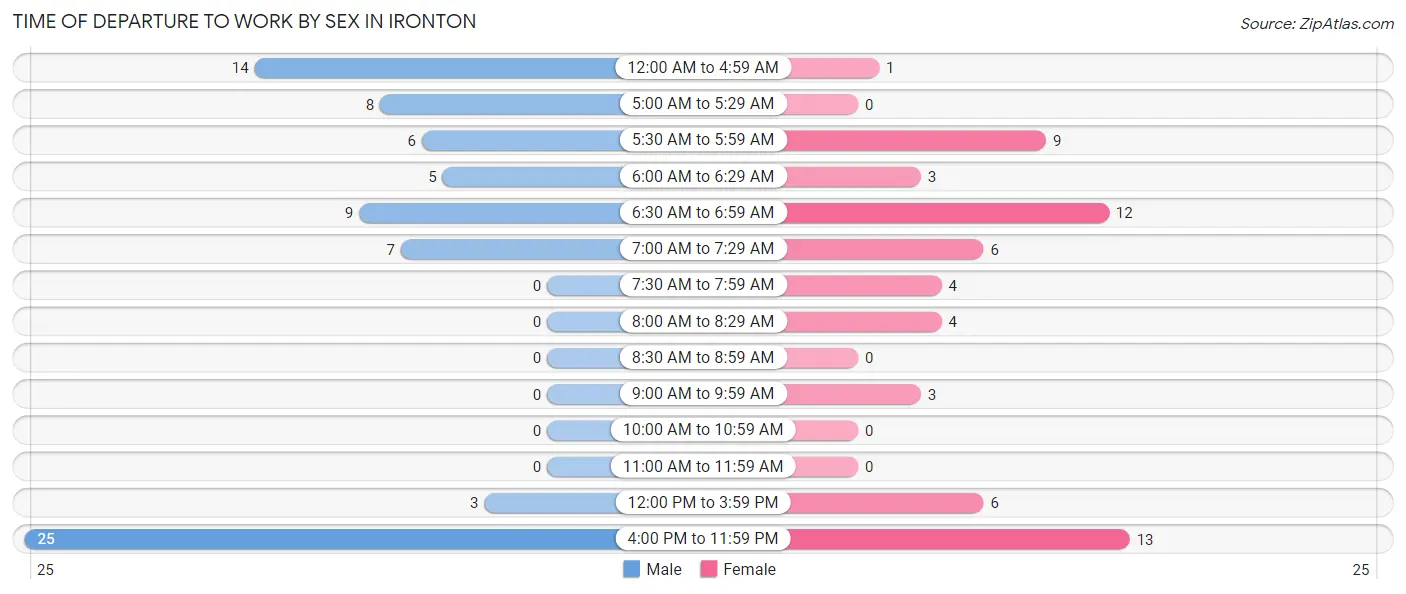
| Time of Departure | Male | Female |
| 12:00 AM to 4:59 AM | 14 (18.2%) | 1 (1.6%) |
| 5:00 AM to 5:29 AM | 8 (10.4%) | 0 (0.0%) |
| 5:30 AM to 5:59 AM | 6 (7.8%) | 9 (14.7%) |
| 6:00 AM to 6:29 AM | 5 (6.5%) | 3 (4.9%) |
| 6:30 AM to 6:59 AM | 9 (11.7%) | 12 (19.7%) |
| 7:00 AM to 7:29 AM | 7 (9.1%) | 6 (9.8%) |
| 7:30 AM to 7:59 AM | 0 (0.0%) | 4 (6.6%) |
| 8:00 AM to 8:29 AM | 0 (0.0%) | 4 (6.6%) |
| 8:30 AM to 8:59 AM | 0 (0.0%) | 0 (0.0%) |
| 9:00 AM to 9:59 AM | 0 (0.0%) | 3 (4.9%) |
| 10:00 AM to 10:59 AM | 0 (0.0%) | 0 (0.0%) |
| 11:00 AM to 11:59 AM | 0 (0.0%) | 0 (0.0%) |
| 12:00 PM to 3:59 PM | 3 (3.9%) | 6 (9.8%) |
| 4:00 PM to 11:59 PM | 25 (32.5%) | 13 (21.3%) |
| Total | 77 (100.0%) | 61 (100.0%) |
Housing Occupancy in Ironton
Occupancy by Ownership in Ironton
Of the total 117 dwellings in Ironton, owner-occupied units account for 100 (85.5%), while renter-occupied units make up 17 (14.5%).
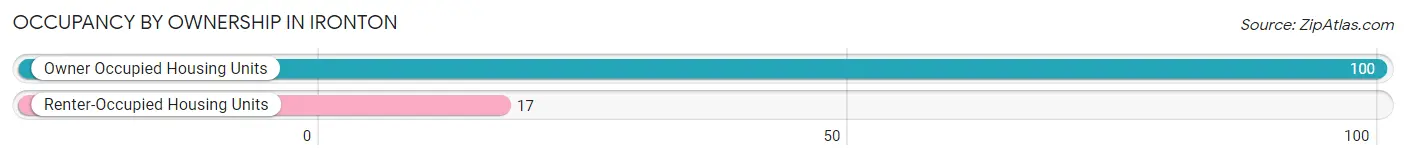
| Occupancy | # Housing Units | % Housing Units |
| Owner Occupied Housing Units | 100 | 85.5% |
| Renter-Occupied Housing Units | 17 | 14.5% |
| Total Occupied Housing Units | 117 | 100.0% |
Occupancy by Household Size in Ironton
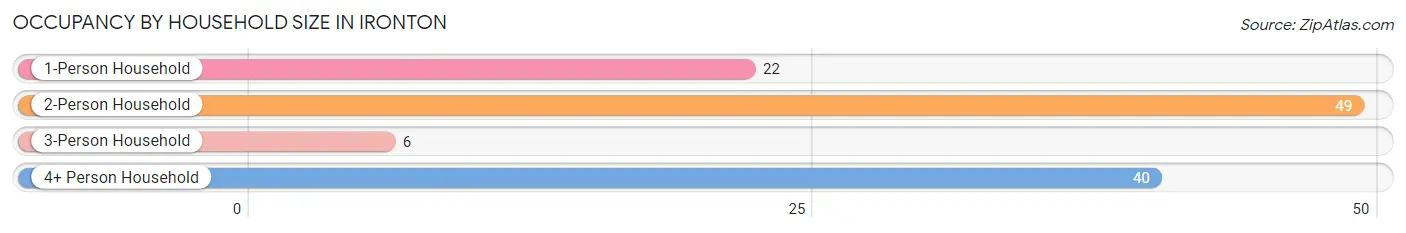
| Household Size | # Housing Units | % Housing Units |
| 1-Person Household | 22 | 18.8% |
| 2-Person Household | 49 | 41.9% |
| 3-Person Household | 6 | 5.1% |
| 4+ Person Household | 40 | 34.2% |
| Total Housing Units | 117 | 100.0% |
Occupancy by Ownership by Household Size in Ironton
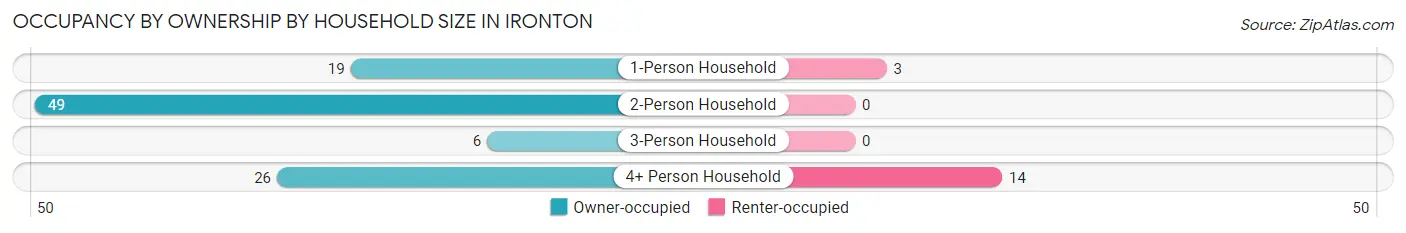
| Household Size | Owner-occupied | Renter-occupied |
| 1-Person Household | 19 (86.4%) | 3 (13.6%) |
| 2-Person Household | 49 (100.0%) | 0 (0.0%) |
| 3-Person Household | 6 (100.0%) | 0 (0.0%) |
| 4+ Person Household | 26 (65.0%) | 14 (35.0%) |
| Total Housing Units | 100 (85.5%) | 17 (14.5%) |
Occupancy by Educational Attainment in Ironton
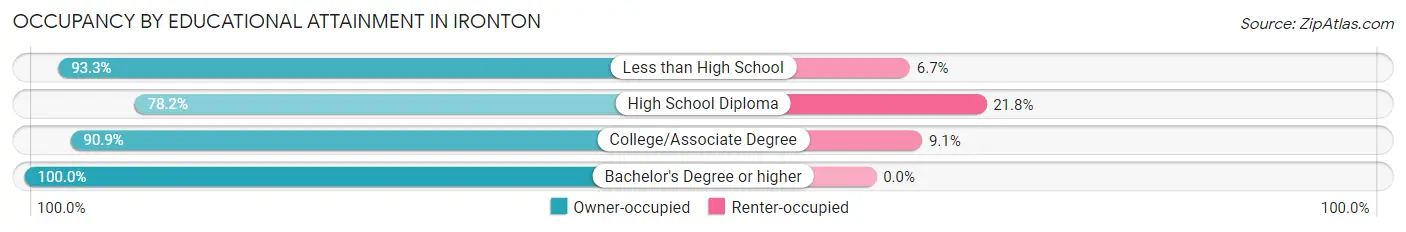
| Household Size | Owner-occupied | Renter-occupied |
| Less than High School | 14 (93.3%) | 1 (6.7%) |
| High School Diploma | 43 (78.2%) | 12 (21.8%) |
| College/Associate Degree | 40 (90.9%) | 4 (9.1%) |
| Bachelor's Degree or higher | 3 (100.0%) | 0 (0.0%) |
Occupancy by Age of Householder in Ironton
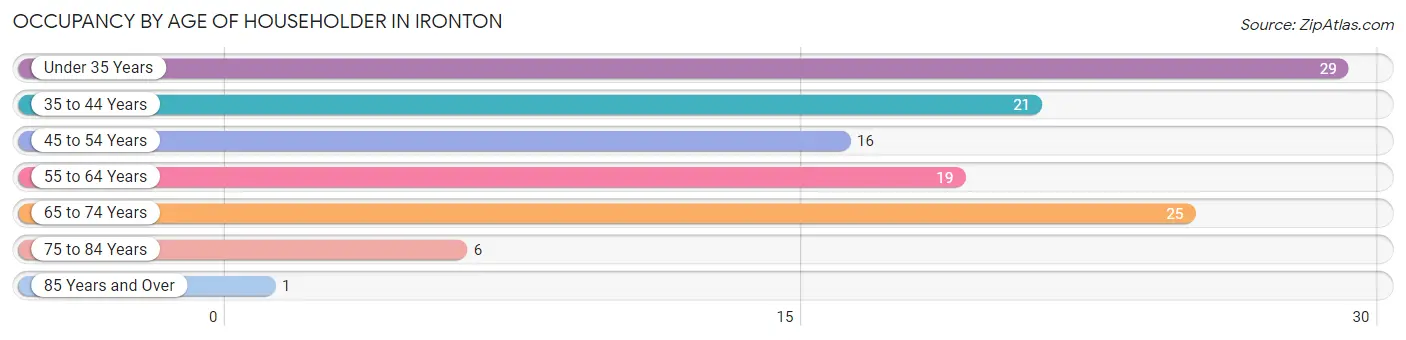
| Age Bracket | # Households | % Households |
| Under 35 Years | 29 | 24.8% |
| 35 to 44 Years | 21 | 17.9% |
| 45 to 54 Years | 16 | 13.7% |
| 55 to 64 Years | 19 | 16.2% |
| 65 to 74 Years | 25 | 21.4% |
| 75 to 84 Years | 6 | 5.1% |
| 85 Years and Over | 1 | 0.9% |
| Total | 117 | 100.0% |
Housing Finances in Ironton
Median Income by Occupancy in Ironton
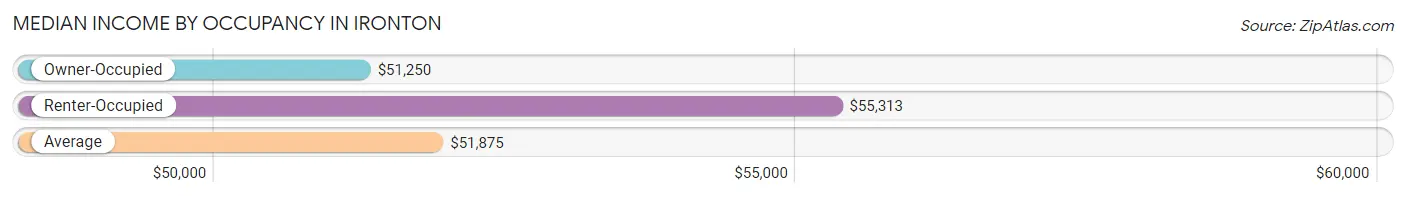
| Occupancy Type | # Households | Median Income |
| Owner-Occupied | 100 (85.5%) | $51,250 |
| Renter-Occupied | 17 (14.5%) | $55,313 |
| Average | 117 (100.0%) | $51,875 |
Occupancy by Householder Income Bracket in Ironton
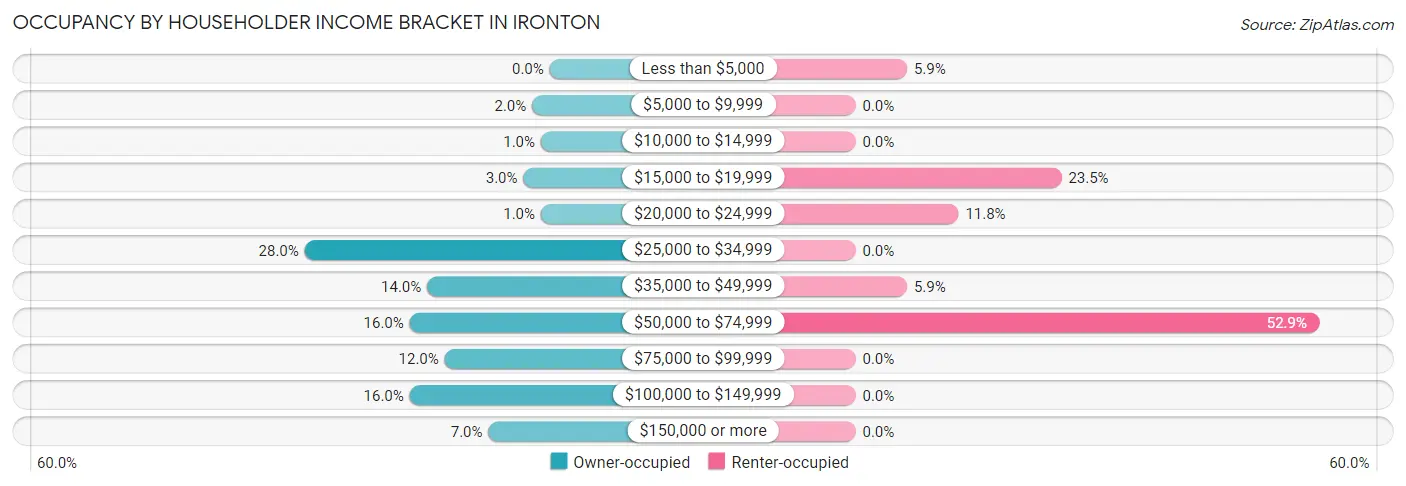
| Income Bracket | Owner-occupied | Renter-occupied |
| Less than $5,000 | 0 (0.0%) | 1 (5.9%) |
| $5,000 to $9,999 | 2 (2.0%) | 0 (0.0%) |
| $10,000 to $14,999 | 1 (1.0%) | 0 (0.0%) |
| $15,000 to $19,999 | 3 (3.0%) | 4 (23.5%) |
| $20,000 to $24,999 | 1 (1.0%) | 2 (11.8%) |
| $25,000 to $34,999 | 28 (28.0%) | 0 (0.0%) |
| $35,000 to $49,999 | 14 (14.0%) | 1 (5.9%) |
| $50,000 to $74,999 | 16 (16.0%) | 9 (52.9%) |
| $75,000 to $99,999 | 12 (12.0%) | 0 (0.0%) |
| $100,000 to $149,999 | 16 (16.0%) | 0 (0.0%) |
| $150,000 or more | 7 (7.0%) | 0 (0.0%) |
| Total | 100 (100.0%) | 17 (100.0%) |
Monthly Housing Cost Tiers in Ironton
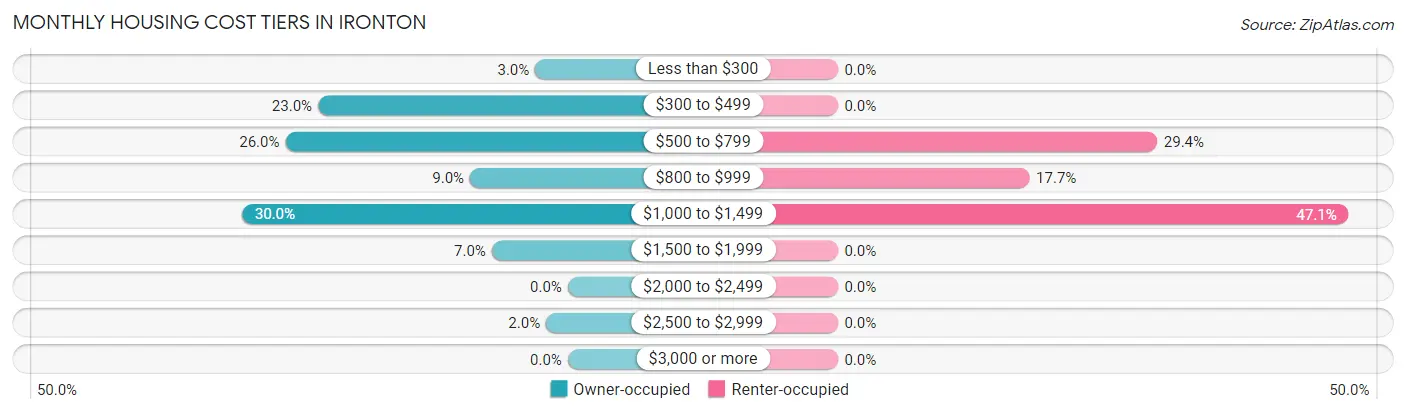
| Monthly Cost | Owner-occupied | Renter-occupied |
| Less than $300 | 3 (3.0%) | 0 (0.0%) |
| $300 to $499 | 23 (23.0%) | 0 (0.0%) |
| $500 to $799 | 26 (26.0%) | 5 (29.4%) |
| $800 to $999 | 9 (9.0%) | 3 (17.6%) |
| $1,000 to $1,499 | 30 (30.0%) | 8 (47.1%) |
| $1,500 to $1,999 | 7 (7.0%) | 0 (0.0%) |
| $2,000 to $2,499 | 0 (0.0%) | 0 (0.0%) |
| $2,500 to $2,999 | 2 (2.0%) | 0 (0.0%) |
| $3,000 or more | 0 (0.0%) | 0 (0.0%) |
| Total | 100 (100.0%) | 17 (100.0%) |
Physical Housing Characteristics in Ironton
Housing Structures in Ironton
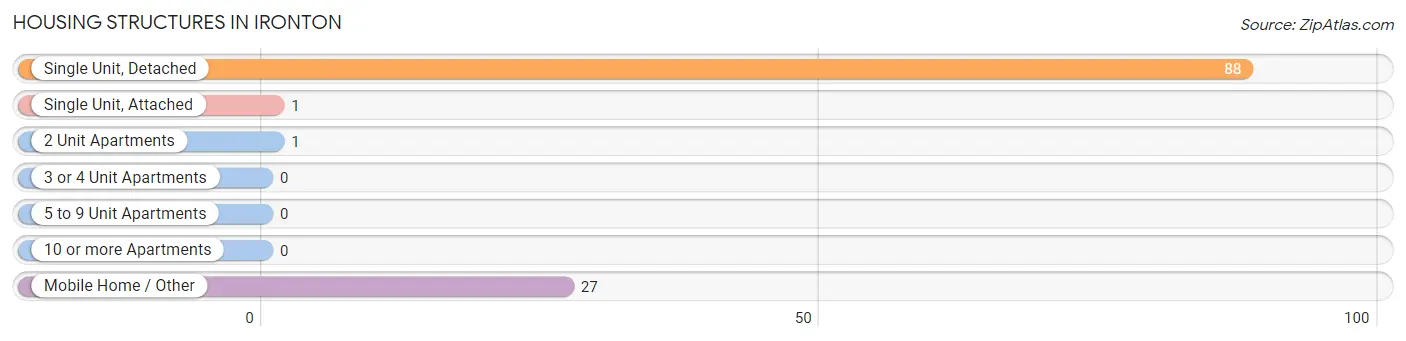
| Structure Type | # Housing Units | % Housing Units |
| Single Unit, Detached | 88 | 75.2% |
| Single Unit, Attached | 1 | 0.9% |
| 2 Unit Apartments | 1 | 0.9% |
| 3 or 4 Unit Apartments | 0 | 0.0% |
| 5 to 9 Unit Apartments | 0 | 0.0% |
| 10 or more Apartments | 0 | 0.0% |
| Mobile Home / Other | 27 | 23.1% |
| Total | 117 | 100.0% |
Housing Structures by Occupancy in Ironton
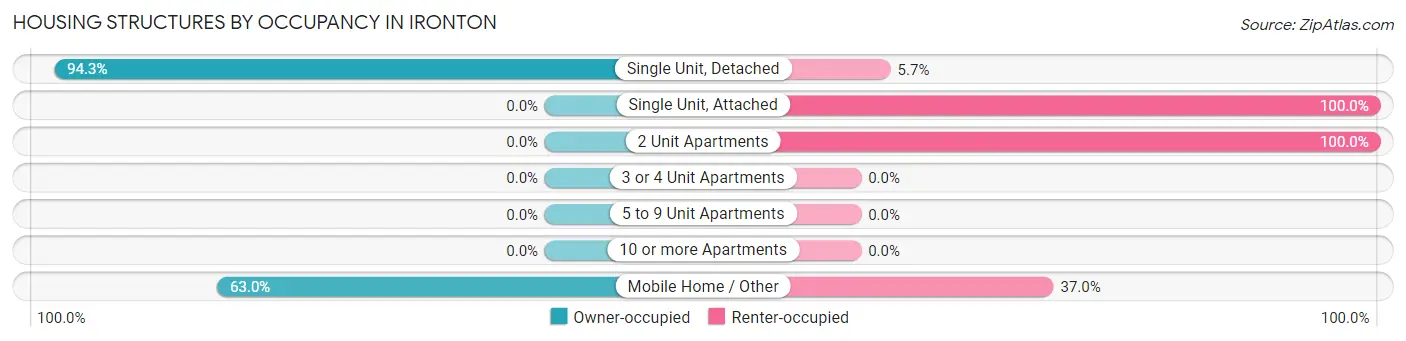
| Structure Type | Owner-occupied | Renter-occupied |
| Single Unit, Detached | 83 (94.3%) | 5 (5.7%) |
| Single Unit, Attached | 0 (0.0%) | 1 (100.0%) |
| 2 Unit Apartments | 0 (0.0%) | 1 (100.0%) |
| 3 or 4 Unit Apartments | 0 (0.0%) | 0 (0.0%) |
| 5 to 9 Unit Apartments | 0 (0.0%) | 0 (0.0%) |
| 10 or more Apartments | 0 (0.0%) | 0 (0.0%) |
| Mobile Home / Other | 17 (63.0%) | 10 (37.0%) |
| Total | 100 (85.5%) | 17 (14.5%) |
Housing Structures by Number of Rooms in Ironton
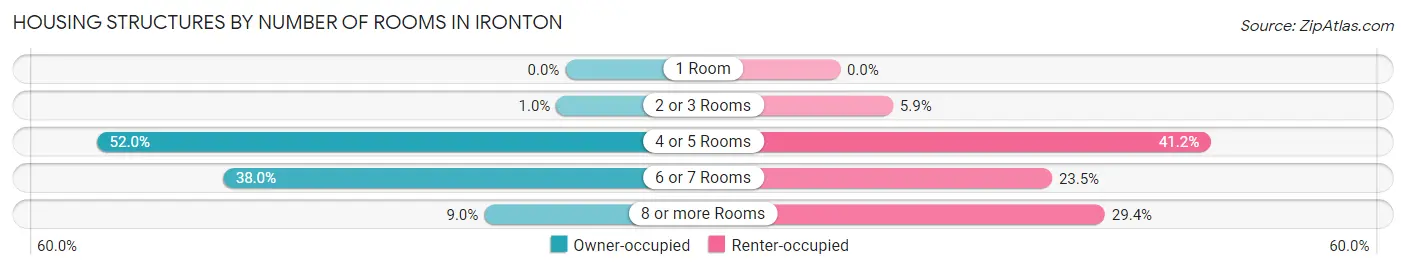
| Number of Rooms | Owner-occupied | Renter-occupied |
| 1 Room | 0 (0.0%) | 0 (0.0%) |
| 2 or 3 Rooms | 1 (1.0%) | 1 (5.9%) |
| 4 or 5 Rooms | 52 (52.0%) | 7 (41.2%) |
| 6 or 7 Rooms | 38 (38.0%) | 4 (23.5%) |
| 8 or more Rooms | 9 (9.0%) | 5 (29.4%) |
| Total | 100 (100.0%) | 17 (100.0%) |
Housing Structure by Heating Type in Ironton
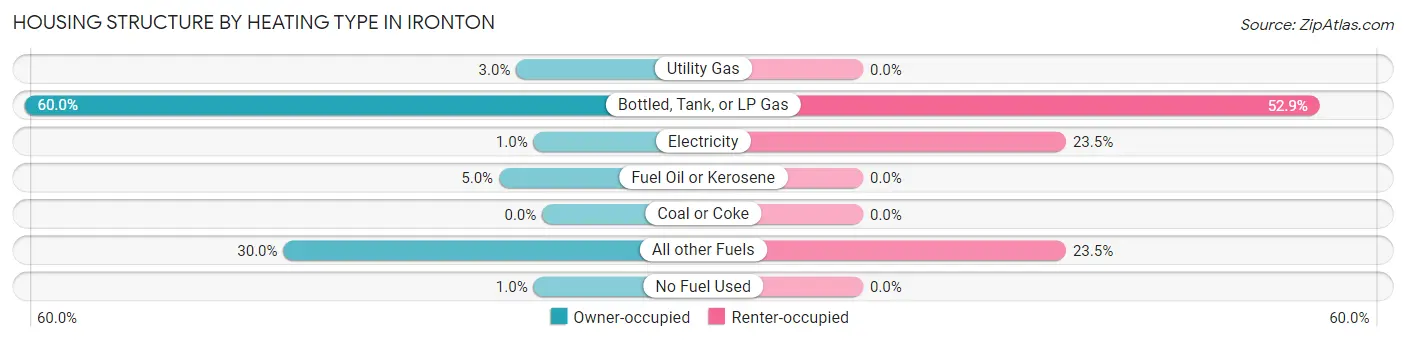
| Heating Type | Owner-occupied | Renter-occupied |
| Utility Gas | 3 (3.0%) | 0 (0.0%) |
| Bottled, Tank, or LP Gas | 60 (60.0%) | 9 (52.9%) |
| Electricity | 1 (1.0%) | 4 (23.5%) |
| Fuel Oil or Kerosene | 5 (5.0%) | 0 (0.0%) |
| Coal or Coke | 0 (0.0%) | 0 (0.0%) |
| All other Fuels | 30 (30.0%) | 4 (23.5%) |
| No Fuel Used | 1 (1.0%) | 0 (0.0%) |
| Total | 100 (100.0%) | 17 (100.0%) |
Household Vehicle Usage in Ironton
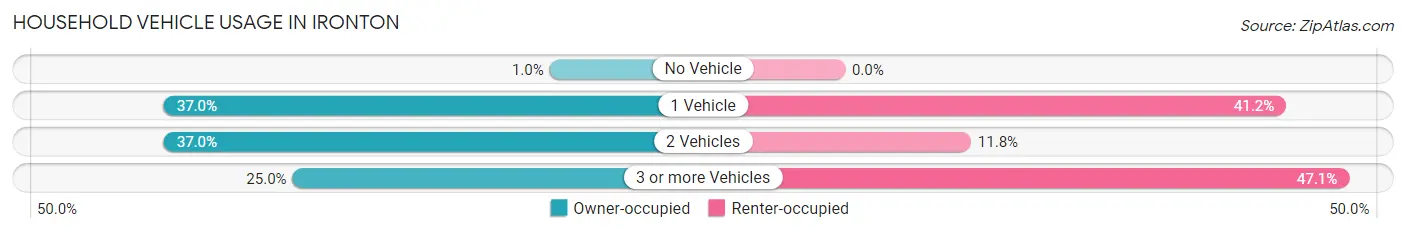
| Vehicles per Household | Owner-occupied | Renter-occupied |
| No Vehicle | 1 (1.0%) | 0 (0.0%) |
| 1 Vehicle | 37 (37.0%) | 7 (41.2%) |
| 2 Vehicles | 37 (37.0%) | 2 (11.8%) |
| 3 or more Vehicles | 25 (25.0%) | 8 (47.1%) |
| Total | 100 (100.0%) | 17 (100.0%) |
Real Estate & Mortgages in Ironton
Real Estate and Mortgage Overview in Ironton
| Characteristic | Without Mortgage | With Mortgage |
| Housing Units | 46 | 54 |
| Median Property Value | $57,100 | $118,800 |
| Median Household Income | $34,643 | $5 |
| Monthly Housing Costs | $450 | $0 |
| Real Estate Taxes | $1,523 | $7 |
Property Value by Mortgage Status in Ironton
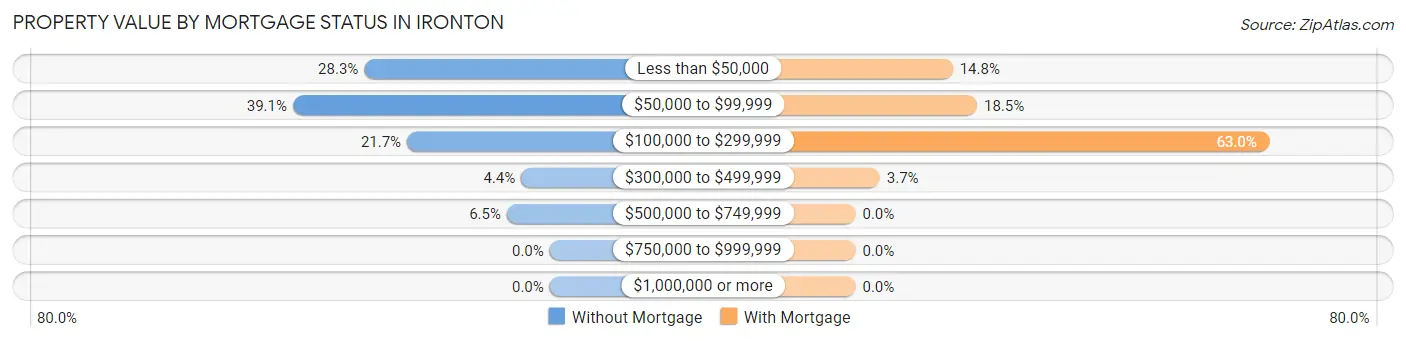
| Property Value | Without Mortgage | With Mortgage |
| Less than $50,000 | 13 (28.3%) | 8 (14.8%) |
| $50,000 to $99,999 | 18 (39.1%) | 10 (18.5%) |
| $100,000 to $299,999 | 10 (21.7%) | 34 (63.0%) |
| $300,000 to $499,999 | 2 (4.3%) | 2 (3.7%) |
| $500,000 to $749,999 | 3 (6.5%) | 0 (0.0%) |
| $750,000 to $999,999 | 0 (0.0%) | 0 (0.0%) |
| $1,000,000 or more | 0 (0.0%) | 0 (0.0%) |
| Total | 46 (100.0%) | 54 (100.0%) |
Household Income by Mortgage Status in Ironton
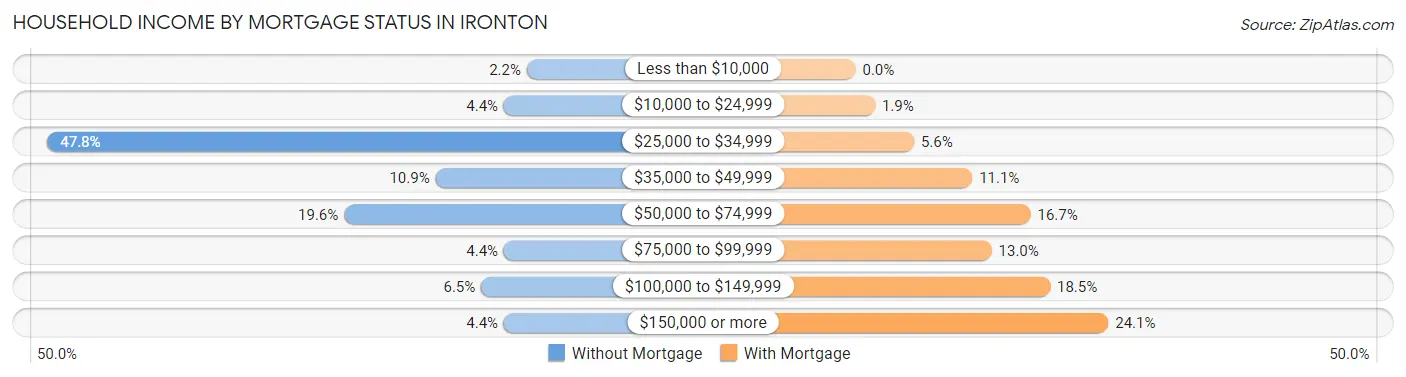
| Household Income | Without Mortgage | With Mortgage |
| Less than $10,000 | 1 (2.2%) | 0 (0.0%) |
| $10,000 to $24,999 | 2 (4.3%) | 1 (1.8%) |
| $25,000 to $34,999 | 22 (47.8%) | 3 (5.6%) |
| $35,000 to $49,999 | 5 (10.9%) | 6 (11.1%) |
| $50,000 to $74,999 | 9 (19.6%) | 9 (16.7%) |
| $75,000 to $99,999 | 2 (4.3%) | 7 (13.0%) |
| $100,000 to $149,999 | 3 (6.5%) | 10 (18.5%) |
| $150,000 or more | 2 (4.3%) | 13 (24.1%) |
| Total | 46 (100.0%) | 54 (100.0%) |
Property Value to Household Income Ratio in Ironton
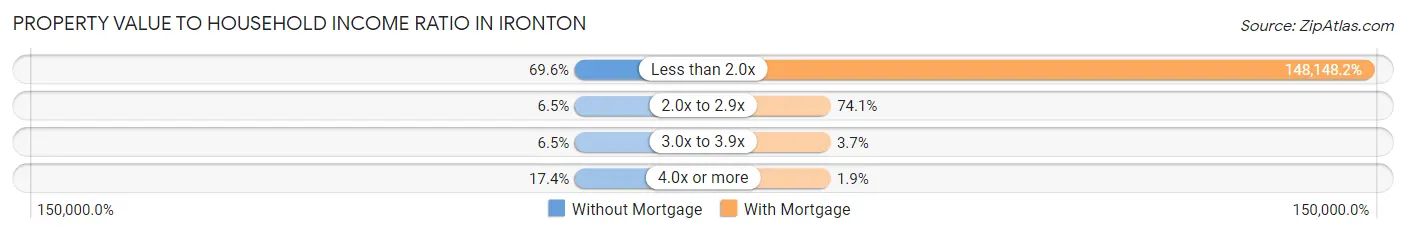
| Value-to-Income Ratio | Without Mortgage | With Mortgage |
| Less than 2.0x | 32 (69.6%) | 80,000 (148,148.2%) |
| 2.0x to 2.9x | 3 (6.5%) | 40 (74.1%) |
| 3.0x to 3.9x | 3 (6.5%) | 2 (3.7%) |
| 4.0x or more | 8 (17.4%) | 1 (1.8%) |
| Total | 46 (100.0%) | 54 (100.0%) |
Real Estate Taxes by Mortgage Status in Ironton
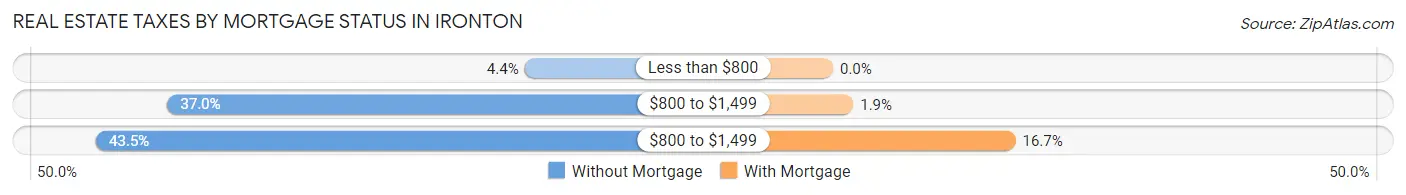
| Property Taxes | Without Mortgage | With Mortgage |
| Less than $800 | 2 (4.3%) | 0 (0.0%) |
| $800 to $1,499 | 17 (37.0%) | 1 (1.8%) |
| $800 to $1,499 | 20 (43.5%) | 9 (16.7%) |
| Total | 46 (100.0%) | 54 (100.0%) |
Health & Disability in Ironton
Health Insurance Coverage by Age in Ironton
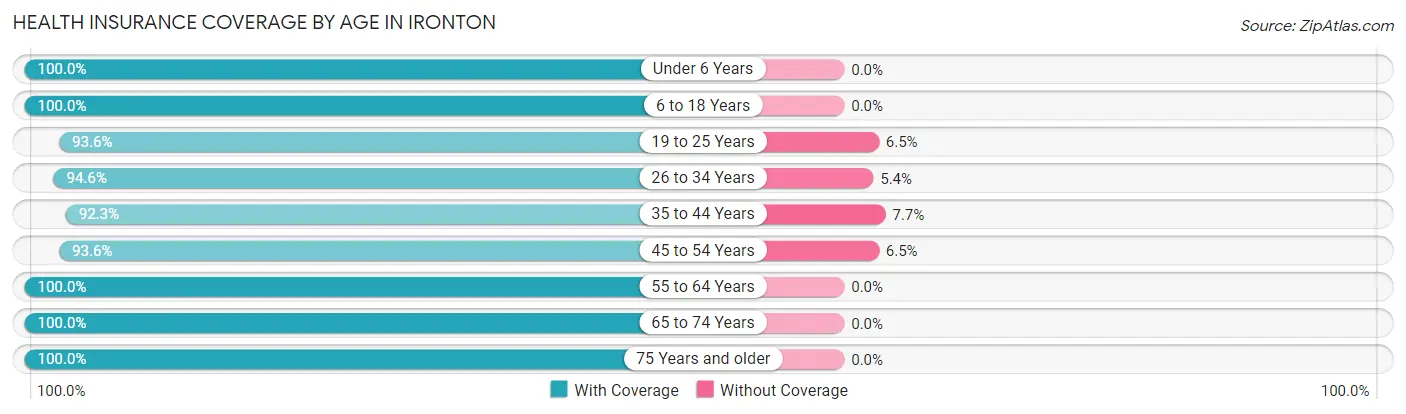
| Age Bracket | With Coverage | Without Coverage |
| Under 6 Years | 31 (100.0%) | 0 (0.0%) |
| 6 to 18 Years | 64 (100.0%) | 0 (0.0%) |
| 19 to 25 Years | 29 (93.5%) | 2 (6.5%) |
| 26 to 34 Years | 35 (94.6%) | 2 (5.4%) |
| 35 to 44 Years | 36 (92.3%) | 3 (7.7%) |
| 45 to 54 Years | 29 (93.5%) | 2 (6.5%) |
| 55 to 64 Years | 34 (100.0%) | 0 (0.0%) |
| 65 to 74 Years | 30 (100.0%) | 0 (0.0%) |
| 75 Years and older | 10 (100.0%) | 0 (0.0%) |
| Total | 298 (97.1%) | 9 (2.9%) |
Health Insurance Coverage by Citizenship Status in Ironton
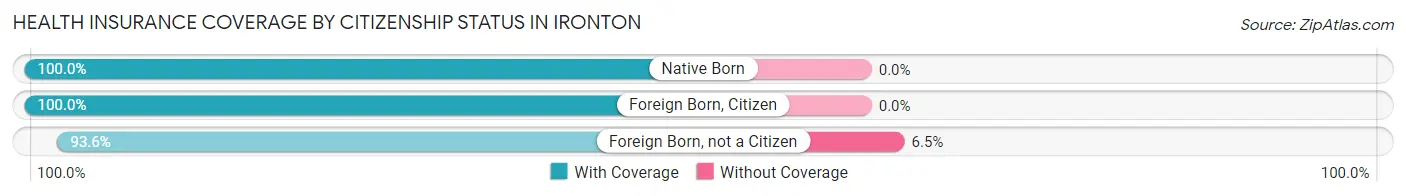
| Citizenship Status | With Coverage | Without Coverage |
| Native Born | 31 (100.0%) | 0 (0.0%) |
| Foreign Born, Citizen | 64 (100.0%) | 0 (0.0%) |
| Foreign Born, not a Citizen | 29 (93.5%) | 2 (6.5%) |
Health Insurance Coverage by Household Income in Ironton
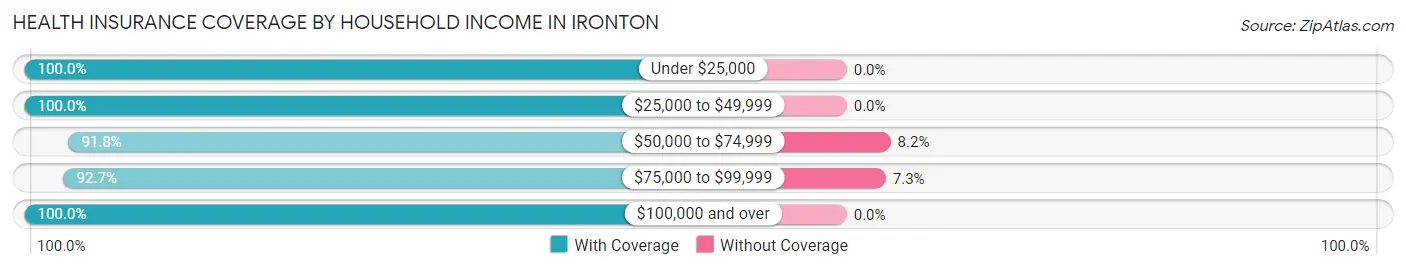
| Household Income | With Coverage | Without Coverage |
| Under $25,000 | 33 (100.0%) | 0 (0.0%) |
| $25,000 to $49,999 | 84 (100.0%) | 0 (0.0%) |
| $50,000 to $74,999 | 67 (91.8%) | 6 (8.2%) |
| $75,000 to $99,999 | 38 (92.7%) | 3 (7.3%) |
| $100,000 and over | 76 (100.0%) | 0 (0.0%) |
Public vs Private Health Insurance Coverage by Age in Ironton
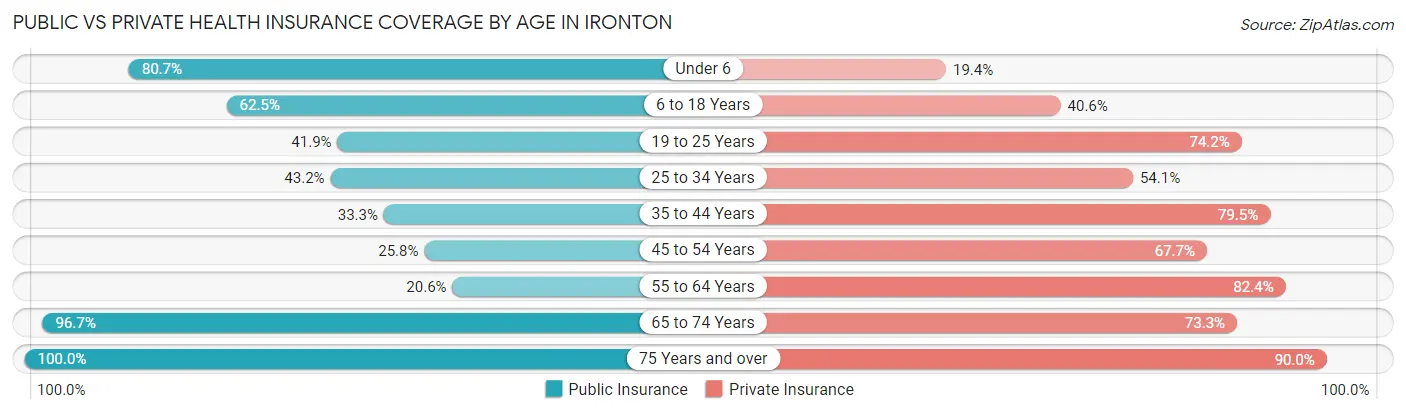
| Age Bracket | Public Insurance | Private Insurance |
| Under 6 | 25 (80.6%) | 6 (19.4%) |
| 6 to 18 Years | 40 (62.5%) | 26 (40.6%) |
| 19 to 25 Years | 13 (41.9%) | 23 (74.2%) |
| 25 to 34 Years | 16 (43.2%) | 20 (54.0%) |
| 35 to 44 Years | 13 (33.3%) | 31 (79.5%) |
| 45 to 54 Years | 8 (25.8%) | 21 (67.7%) |
| 55 to 64 Years | 7 (20.6%) | 28 (82.4%) |
| 65 to 74 Years | 29 (96.7%) | 22 (73.3%) |
| 75 Years and over | 10 (100.0%) | 9 (90.0%) |
| Total | 161 (52.4%) | 186 (60.6%) |
Disability Status by Sex by Age in Ironton
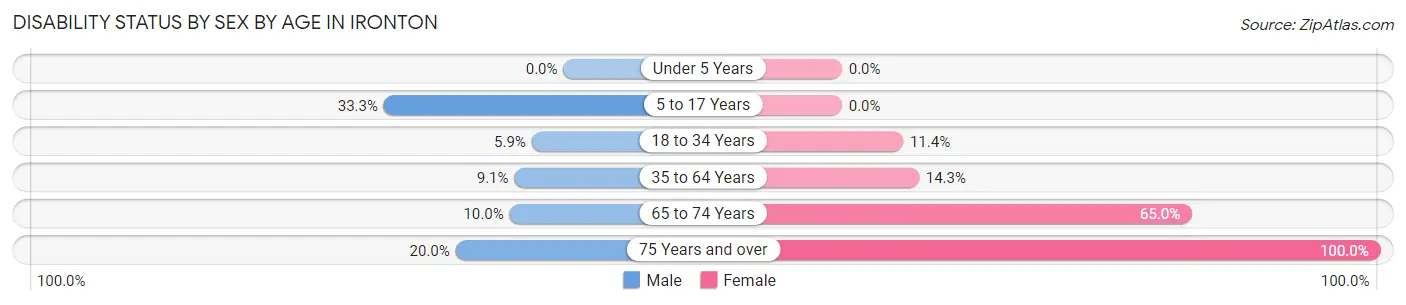
| Age Bracket | Male | Female |
| Under 5 Years | 0 (0.0%) | 0 (0.0%) |
| 5 to 17 Years | 14 (33.3%) | 0 (0.0%) |
| 18 to 34 Years | 2 (5.9%) | 5 (11.4%) |
| 35 to 64 Years | 5 (9.1%) | 7 (14.3%) |
| 65 to 74 Years | 1 (10.0%) | 13 (65.0%) |
| 75 Years and over | 1 (20.0%) | 5 (100.0%) |
Disability Class by Sex by Age in Ironton
Disability Class: Hearing Difficulty
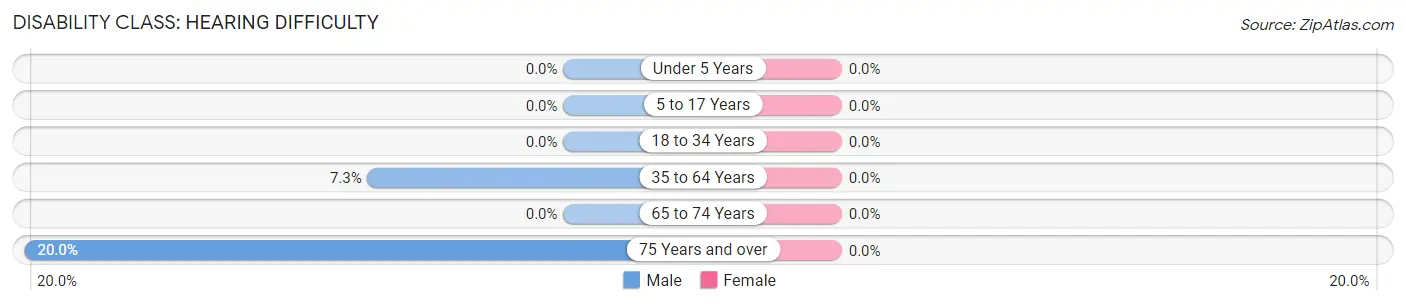
| Age Bracket | Male | Female |
| Under 5 Years | 0 (0.0%) | 0 (0.0%) |
| 5 to 17 Years | 0 (0.0%) | 0 (0.0%) |
| 18 to 34 Years | 0 (0.0%) | 0 (0.0%) |
| 35 to 64 Years | 4 (7.3%) | 0 (0.0%) |
| 65 to 74 Years | 0 (0.0%) | 0 (0.0%) |
| 75 Years and over | 1 (20.0%) | 0 (0.0%) |
Disability Class: Vision Difficulty
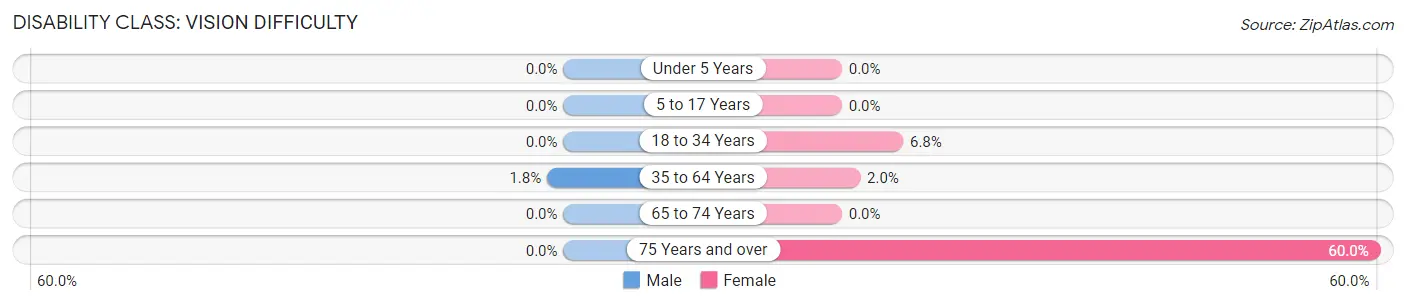
| Age Bracket | Male | Female |
| Under 5 Years | 0 (0.0%) | 0 (0.0%) |
| 5 to 17 Years | 0 (0.0%) | 0 (0.0%) |
| 18 to 34 Years | 0 (0.0%) | 3 (6.8%) |
| 35 to 64 Years | 1 (1.8%) | 1 (2.0%) |
| 65 to 74 Years | 0 (0.0%) | 0 (0.0%) |
| 75 Years and over | 0 (0.0%) | 3 (60.0%) |
Disability Class: Cognitive Difficulty
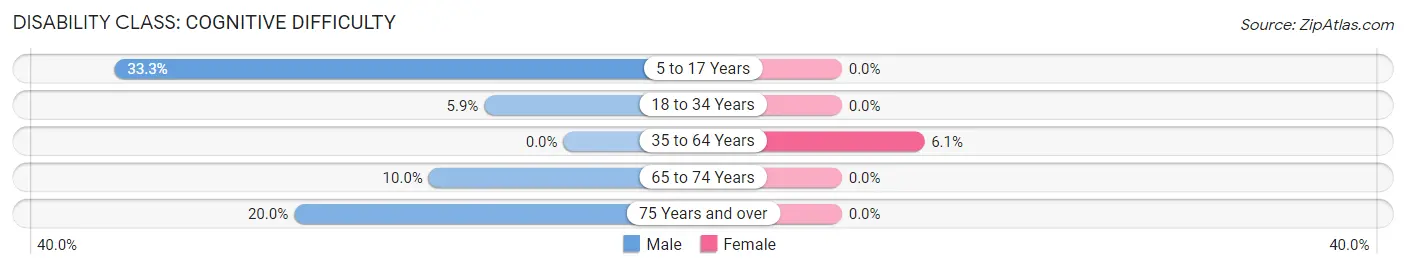
| Age Bracket | Male | Female |
| 5 to 17 Years | 14 (33.3%) | 0 (0.0%) |
| 18 to 34 Years | 2 (5.9%) | 0 (0.0%) |
| 35 to 64 Years | 0 (0.0%) | 3 (6.1%) |
| 65 to 74 Years | 1 (10.0%) | 0 (0.0%) |
| 75 Years and over | 1 (20.0%) | 0 (0.0%) |
Disability Class: Ambulatory Difficulty
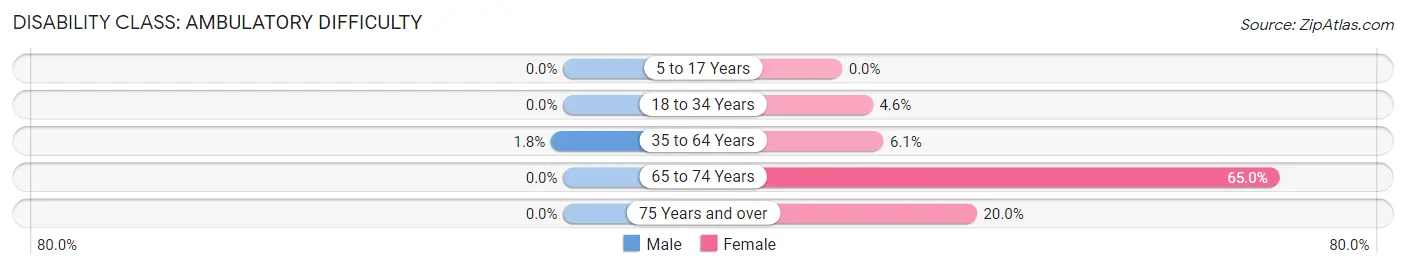
| Age Bracket | Male | Female |
| 5 to 17 Years | 0 (0.0%) | 0 (0.0%) |
| 18 to 34 Years | 0 (0.0%) | 2 (4.5%) |
| 35 to 64 Years | 1 (1.8%) | 3 (6.1%) |
| 65 to 74 Years | 0 (0.0%) | 13 (65.0%) |
| 75 Years and over | 0 (0.0%) | 1 (20.0%) |
Disability Class: Self-Care Difficulty
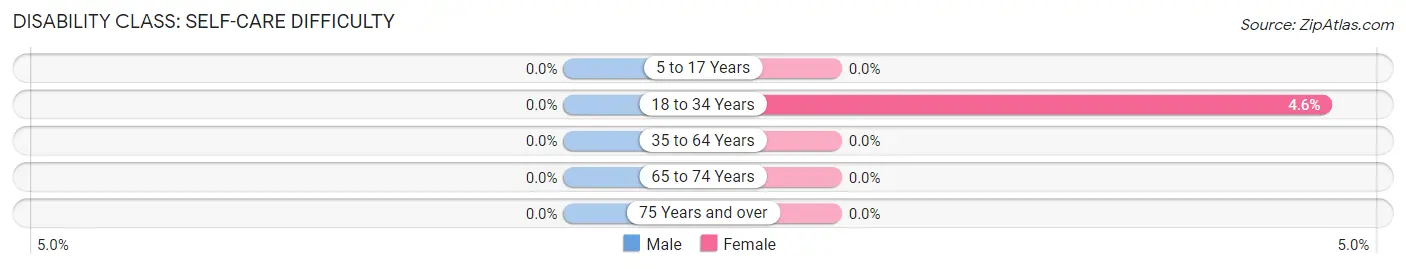
| Age Bracket | Male | Female |
| 5 to 17 Years | 0 (0.0%) | 0 (0.0%) |
| 18 to 34 Years | 0 (0.0%) | 2 (4.5%) |
| 35 to 64 Years | 0 (0.0%) | 0 (0.0%) |
| 65 to 74 Years | 0 (0.0%) | 0 (0.0%) |
| 75 Years and over | 0 (0.0%) | 0 (0.0%) |
Technology Access in Ironton
Computing Device Access in Ironton
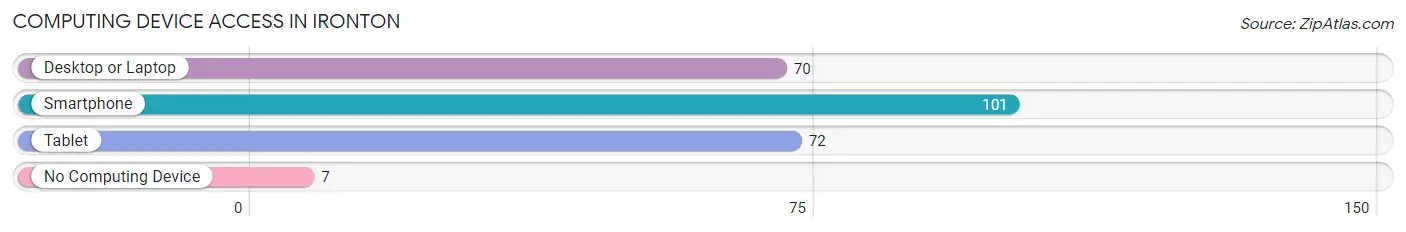
| Device Type | # Households | % Households |
| Desktop or Laptop | 70 | 59.8% |
| Smartphone | 101 | 86.3% |
| Tablet | 72 | 61.5% |
| No Computing Device | 7 | 6.0% |
| Total | 117 | 100.0% |
Internet Access in Ironton
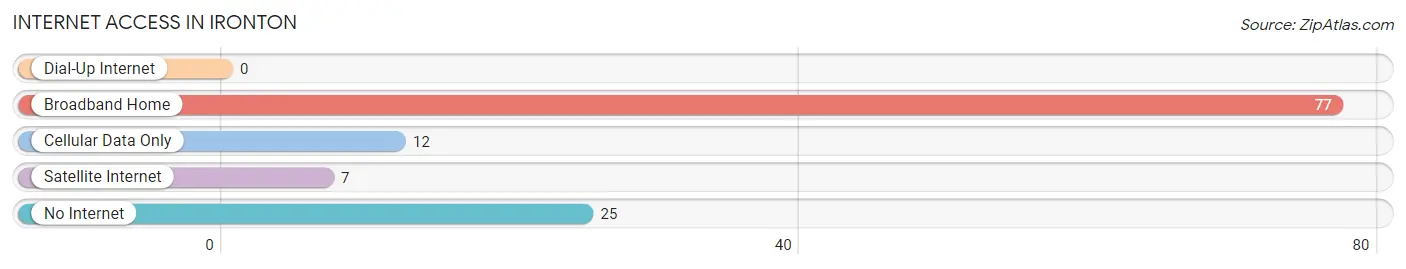
| Internet Type | # Households | % Households |
| Dial-Up Internet | 0 | 0.0% |
| Broadband Home | 77 | 65.8% |
| Cellular Data Only | 12 | 10.3% |
| Satellite Internet | 7 | 6.0% |
| No Internet | 25 | 21.4% |
| Total | 117 | 100.0% |
Ironton Summary
Ironton is a small unincorporated community located in the town of Ironton, in Iron County, Wisconsin, United States. It is located on the Iron River, a tributary of the Bad River, and is the county seat of Iron County. The population of Ironton was estimated to be around 200 in 2020.
History
Ironton was first settled in 1856 by a group of miners from Michigan. The town was named after the Iron River, which runs through the area. The first post office was established in 1858. The town was incorporated in 1872 and the first school was built in 1873.
The town grew rapidly in the late 19th century, with the arrival of the railroad in 1881. The railroad brought in new businesses and industries, including a sawmill, a flour mill, a brickyard, and a tannery. The town also became a center for logging and lumbering.
In the early 20th century, Ironton was a bustling community with a variety of businesses, including a bank, a hotel, a movie theater, and several stores. The town also had a newspaper, the Ironton News, which was published from 1908 to 1940.
Geography
Ironton is located in the northwest corner of Iron County, Wisconsin, at the intersection of US Highway 2 and Wisconsin Highway 77. The Iron River runs through the town, and the Bad River is located just to the north. The town is surrounded by forests and lakes, including the Iron River, the Bad River, and the Turtle-Flambeau Flowage.
The town has a total area of 0.7 square miles, all of which is land. The elevation of Ironton is 1,092 feet above sea level.
Economy
Ironton is a small, rural community with a limited economy. The town is home to a few small businesses, including a gas station, a grocery store, and a few restaurants. The town also has a few small manufacturing businesses, including a sawmill and a woodworking shop.
The town is also home to a few tourist attractions, including the Iron County Historical Museum and the Iron County Fairgrounds. The Iron County Fair is held annually in Ironton, and attracts visitors from all over the region.
Demographics
Ironton is a small, rural community with a population of around 200 people. The town is predominantly white, with a small Hispanic population. The median household income in Ironton is $37,500, and the median home value is $90,000. The town has a high poverty rate, with nearly 30% of the population living below the poverty line.
Conclusion
Ironton is a small, rural community located in Iron County, Wisconsin. The town was first settled in 1856 and has a population of around 200 people. The town is home to a few small businesses and tourist attractions, and is surrounded by forests and lakes. The median household income in Ironton is $37,500, and the median home value is $90,000. The town has a high poverty rate, with nearly 30% of the population living below the poverty line.
Common Questions
What is Per Capita Income in Ironton?
Per Capita income in Ironton is $24,397.
What is the Median Family Income in Ironton?
Median Family Income in Ironton is $64,375.
What is the Median Household income in Ironton?
Median Household Income in Ironton is $51,875.
What is Income or Wage Gap in Ironton?
Income or Wage Gap in Ironton is 24.1%.
Women in Ironton earn 75.9 cents for every dollar earned by a man.
What is Inequality or Gini Index in Ironton?
Inequality or Gini Index in Ironton is 0.35.
What is the Total Population of Ironton?
Total Population of Ironton is 307.
What is the Total Male Population of Ironton?
Total Male Population of Ironton is 160.
What is the Total Female Population of Ironton?
Total Female Population of Ironton is 147.
What is the Ratio of Males per 100 Females in Ironton?
There are 108.84 Males per 100 Females in Ironton.
What is the Ratio of Females per 100 Males in Ironton?
There are 91.88 Females per 100 Males in Ironton.
What is the Median Population Age in Ironton?
Median Population Age in Ironton is 31.9 Years.
What is the Average Family Size in Ironton
Average Family Size in Ironton is 3.0 People.
What is the Average Household Size in Ironton
Average Household Size in Ironton is 2.6 People.
How Large is the Labor Force in Ironton?
There are 149 People in the Labor Forcein in Ironton.
What is the Percentage of People in the Labor Force in Ironton?
66.2% of People are in the Labor Force in Ironton.
What is the Unemployment Rate in Ironton?
Unemployment Rate in Ironton is 6.0%.