Zip Codes with the Lowest Poverty Level Among Single Mothers in Tacoma, WA

RELATED REPORTS & OPTIONS

Lowest Poverty | Single Mother
Population
Families and Households
Female Fertility
Female Fertility (Unmarried)
Race (Community Size)
Race (Percentage)
Ancestry (Community Size)
AfricanAlaska NativeAlaskan AthabascanAlbanianAleutAmericanApacheArabArgentineanArmenianAustralianAustrianBangladeshiBasqueBelgianBelizeanBhutaneseBlackfeetBolivianBrazilianBritishBulgarianBurmeseCanadianCelticCentral AmericanCentral American IndianCherokeeChickasawChileanChippewaChoctawColombianColvilleComancheCosta RicanCreeCreekCroatianCubanCzechCzechoslovakianDanishDelawareDominicanDutchEastern EuropeanEcuadorianEgyptianEnglishEstonianEthiopianEuropeanFijianFilipinoFinnishFrenchFrench American IndianFrench CanadianGermanGerman RussianGhanaianGreekGuamanian / ChamorroGuatemalanHaitianHonduranHopiHungarianIcelanderIndian (Asian)IndonesianInupiatIranianIrishIroquoisIsraeliItalianJamaicanJapaneseKenyanKoreanLaotianLatvianLebaneseLithuanianMacedonianMalaysianMexicanMexican American IndianMoroccanNative HawaiianNavajoNew ZealanderNicaraguanNigerianNorthern EuropeanNorwegianOsagePakistaniPalestinianPanamanianPennsylvania GermanPeruvianPolishPortuguesePuebloPuerto RicanPuget Sound SalishRomanianRussianSalvadoranSamoanScandinavianScotch-IrishScottishSerbianShoshoneSiouxSlavicSlovakSloveneSomaliSouth AfricanSouth AmericanSpaniardSpanishSri LankanSubsaharan AfricanSwedishSwissSyrianThaiTlingit-HaidaTonganTrinidadian and TobagonianTsimshianTurkishUgandanUkrainianVenezuelanVietnameseWelshWest IndianYakamaYaquiYugoslavianYup'ik
Ancestry (Percentage)
AfricanAlaska NativeAlaskan AthabascanAlbanianAleutAmericanApacheArabArgentineanArmenianAustralianAustrianBangladeshiBasqueBelgianBelizeanBhutaneseBlackfeetBolivianBrazilianBritishBulgarianBurmeseCanadianCelticCentral AmericanCentral American IndianCherokeeChickasawChileanChippewaChoctawColombianColvilleComancheCosta RicanCreeCreekCroatianCubanCzechCzechoslovakianDanishDelawareDominicanDutchEastern EuropeanEcuadorianEgyptianEnglishEstonianEthiopianEuropeanFijianFilipinoFinnishFrenchFrench American IndianFrench CanadianGermanGerman RussianGhanaianGreekGuamanian / ChamorroGuatemalanHaitianHonduranHopiHungarianIcelanderIndian (Asian)IndonesianInupiatIranianIrishIroquoisIsraeliItalianJamaicanJapaneseKenyanKoreanLaotianLatvianLebaneseLithuanianMacedonianMalaysianMexicanMexican American IndianMoroccanNative HawaiianNavajoNew ZealanderNicaraguanNigerianNorthern EuropeanNorwegianOsagePakistaniPalestinianPanamanianPennsylvania GermanPeruvianPolishPortuguesePuebloPuerto RicanPuget Sound SalishRomanianRussianSalvadoranSamoanScandinavianScotch-IrishScottishSerbianShoshoneSiouxSlavicSlovakSloveneSomaliSouth AfricanSouth AmericanSpaniardSpanishSri LankanSubsaharan AfricanSwedishSwissSyrianThaiTlingit-HaidaTonganTrinidadian and TobagonianTsimshianTurkishUgandanUkrainianVenezuelanVietnameseWelshWest IndianYakamaYaquiYugoslavianYup'ik
Immigrant Origin (Total)
AfricaArgentinaAsiaAustraliaBangladeshBelarusBelizeBrazilBulgariaBurma / MyanmarCambodiaCameroonCanadaCaribbeanCentral AmericaChileChinaColombiaCosta RicaCubaCzechoslovakiaDenmarkDominican RepublicEastern AfricaEastern AsiaEastern EuropeEcuadorEgyptEl SalvadorEnglandEthiopiaEuropeFijiFranceGermanyGhanaGreeceGuatemalaHaitiHondurasHong KongIndiaIndonesiaIranIrelandIsraelItalyJamaicaJapanKazakhstanKenyaKoreaLaosLatin AmericaLatviaLiberiaMexicoMicronesiaMiddle AfricaMoldovaNetherlandsNicaraguaNigeriaNorthern AfricaNorthern EuropeNorwayOceaniaPakistanPanamaPeruPhilippinesPolandRomaniaRussiaSaudi ArabiaScotlandSomaliaSouth AfricaSouth AmericaSouth Central AsiaSouth Eastern AsiaSouthern EuropeSpainSwedenSwitzerlandTaiwanThailandTrinidad and TobagoTurkeyUgandaUkraineUzbekistanVenezuelaVietnamWestern AfricaWestern AsiaWestern EuropeYemenZimbabwe
Immigrant Origin (Percentage)
AfricaArgentinaAsiaAustraliaBangladeshBelarusBelizeBrazilBulgariaBurma / MyanmarCambodiaCameroonCanadaCaribbeanCentral AmericaChileChinaColombiaCosta RicaCubaCzechoslovakiaDenmarkDominican RepublicEastern AfricaEastern AsiaEastern EuropeEcuadorEgyptEl SalvadorEnglandEthiopiaEuropeFijiFranceGermanyGhanaGreeceGuatemalaHaitiHondurasHong KongIndiaIndonesiaIranIrelandIsraelItalyJamaicaJapanKazakhstanKenyaKoreaLaosLatin AmericaLatviaLiberiaMexicoMicronesiaMiddle AfricaMoldovaNetherlandsNicaraguaNigeriaNorthern AfricaNorthern EuropeNorwayOceaniaPakistanPanamaPeruPhilippinesPolandRomaniaRussiaSaudi ArabiaScotlandSomaliaSouth AfricaSouth AmericaSouth Central AsiaSouth Eastern AsiaSouthern EuropeSpainSwedenSwitzerlandTaiwanThailandTrinidad and TobagoTurkeyUgandaUkraineUzbekistanVenezuelaVietnamWestern AfricaWestern AsiaWestern EuropeYemenZimbabwe
Income
Income (Families)
Income (Households)
Poverty
Poverty (Families)
Unemployment
Employment Occupations
Employment Industries
Employer Class
Commute Time
Commute Means
School Enrollment
Education by Degree Field
Occupancy
Finances
Physical Characteristics
Tacoma
Compare Zip Codes
Comparison Subject

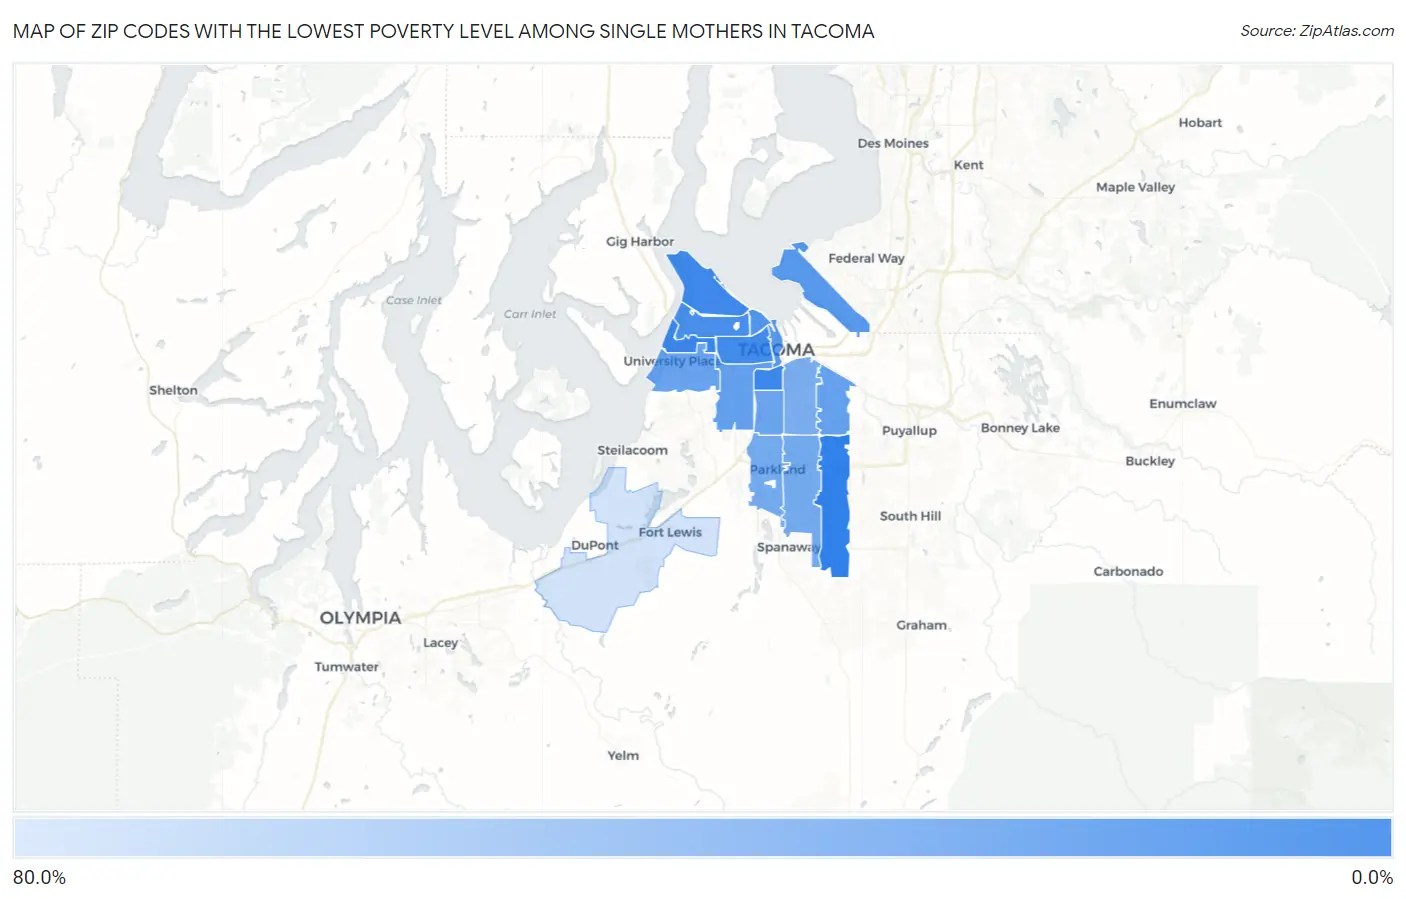
Map of Zip Codes with the Lowest Poverty Level Among Single Mothers in Tacoma

80.0%
0.0%
Zip Codes with the Lowest Poverty Level Among Single Mothers in Tacoma Map

Zip Codes with the Lowest Poverty Level Among Single Mothers in Tacoma, WA

Zip Code Single Mother Poverty vs State vs National
1.984657.2%28.2%(-20.9)#1633.1%(-25.9)#976
2.984187.5%28.2%(-20.6)#1933.1%(-25.6)#1,050
3.984078.7%28.2%(-19.4)#2233.1%(-24.4)#1,351
4.984059.3%28.2%(-18.9)#2633.1%(-23.8)#1,510
5.9840612.2%28.2%(-15.9)#4233.1%(-20.9)#2,342
6.9840314.3%28.2%(-13.9)#5833.1%(-18.8)#3,025
7.9840217.2%28.2%(-10.9)#8433.1%(-15.9)#4,102
8.9842217.4%28.2%(-10.7)#8533.1%(-15.7)#4,182
9.9840920.8%28.2%(-7.38)#10833.1%(-12.3)#5,527
10.9844321.7%28.2%(-6.49)#11933.1%(-11.4)#5,881
11.9846623.6%28.2%(-4.61)#13833.1%(-9.56)#6,620
12.9840824.0%28.2%(-4.16)#14533.1%(-9.12)#6,781
13.9844427.9%28.2%(-0.319)#18333.1%(-5.27)#8,321
14.9844528.2%28.2%(-0.010)#18533.1%(-4.96)#8,442
15.9840431.9%28.2%(+3.73)#21633.1%(-1.23)#9,929
16.9843369.7%28.2%(+41.5)#37633.1%(+36.6)#19,755

Common Questions

What are the Top 10 Zip Codes with the Lowest Poverty Level Among Single Mothers in Tacoma, WA?
Top 10 Zip Codes with the Lowest Poverty Level Among Single Mothers in Tacoma, WA are:
#1
0.0%
#2
7.2%
#3
7.5%
#4
8.7%
#5
9.3%
#6
12.2%
#7
14.3%
#8
17.2%
#9
17.4%
#10
20.8%
What zip code has the Lowest Poverty Level Among Single Mothers in Tacoma, WA?
98465 has the Lowest Poverty Level Among Single Mothers in Tacoma, WA with 7.2%.
What is the Poverty Level Among Single Mothers in Tacoma, WA?
Poverty Level Among Single Mothers in Tacoma is 21.5%.
What is the Poverty Level Among Single Mothers in Washington?
Poverty Level Among Single Mothers in Washington is 28.2%.
What is the Poverty Level Among Single Mothers in the United States?
Poverty Level Among Single Mothers in the United States is 33.1%.