Zip Codes with the Most Immigrants from Western Europe in Tacoma, WA

RELATED REPORTS & OPTIONS

Western Europe
Population
Families and Households
Female Fertility
Female Fertility (Unmarried)
Race (Community Size)
Race (Percentage)
Ancestry (Community Size)
AfricanAlaska NativeAlaskan AthabascanAlbanianAleutAmericanApacheArabArgentineanArmenianAustralianAustrianBangladeshiBasqueBelgianBelizeanBhutaneseBlackfeetBolivianBrazilianBritishBulgarianBurmeseCanadianCelticCentral AmericanCentral American IndianCherokeeChickasawChileanChippewaChoctawColombianColvilleComancheCosta RicanCreeCreekCroatianCubanCzechCzechoslovakianDanishDelawareDominicanDutchEastern EuropeanEcuadorianEgyptianEnglishEstonianEthiopianEuropeanFijianFilipinoFinnishFrenchFrench American IndianFrench CanadianGermanGerman RussianGhanaianGreekGuamanian / ChamorroGuatemalanHaitianHonduranHopiHungarianIcelanderIndian (Asian)IndonesianInupiatIranianIrishIroquoisIsraeliItalianJamaicanJapaneseKenyanKoreanLaotianLatvianLebaneseLithuanianMacedonianMalaysianMexicanMexican American IndianMoroccanNative HawaiianNavajoNew ZealanderNicaraguanNigerianNorthern EuropeanNorwegianOsagePakistaniPalestinianPanamanianPennsylvania GermanPeruvianPolishPortuguesePuebloPuerto RicanPuget Sound SalishRomanianRussianSalvadoranSamoanScandinavianScotch-IrishScottishSerbianShoshoneSiouxSlavicSlovakSloveneSomaliSouth AfricanSouth AmericanSpaniardSpanishSri LankanSubsaharan AfricanSwedishSwissSyrianThaiTlingit-HaidaTonganTrinidadian and TobagonianTsimshianTurkishUgandanUkrainianVenezuelanVietnameseWelshWest IndianYakamaYaquiYugoslavianYup'ik
Ancestry (Percentage)
AfricanAlaska NativeAlaskan AthabascanAlbanianAleutAmericanApacheArabArgentineanArmenianAustralianAustrianBangladeshiBasqueBelgianBelizeanBhutaneseBlackfeetBolivianBrazilianBritishBulgarianBurmeseCanadianCelticCentral AmericanCentral American IndianCherokeeChickasawChileanChippewaChoctawColombianColvilleComancheCosta RicanCreeCreekCroatianCubanCzechCzechoslovakianDanishDelawareDominicanDutchEastern EuropeanEcuadorianEgyptianEnglishEstonianEthiopianEuropeanFijianFilipinoFinnishFrenchFrench American IndianFrench CanadianGermanGerman RussianGhanaianGreekGuamanian / ChamorroGuatemalanHaitianHonduranHopiHungarianIcelanderIndian (Asian)IndonesianInupiatIranianIrishIroquoisIsraeliItalianJamaicanJapaneseKenyanKoreanLaotianLatvianLebaneseLithuanianMacedonianMalaysianMexicanMexican American IndianMoroccanNative HawaiianNavajoNew ZealanderNicaraguanNigerianNorthern EuropeanNorwegianOsagePakistaniPalestinianPanamanianPennsylvania GermanPeruvianPolishPortuguesePuebloPuerto RicanPuget Sound SalishRomanianRussianSalvadoranSamoanScandinavianScotch-IrishScottishSerbianShoshoneSiouxSlavicSlovakSloveneSomaliSouth AfricanSouth AmericanSpaniardSpanishSri LankanSubsaharan AfricanSwedishSwissSyrianThaiTlingit-HaidaTonganTrinidadian and TobagonianTsimshianTurkishUgandanUkrainianVenezuelanVietnameseWelshWest IndianYakamaYaquiYugoslavianYup'ik
Immigrant Origin (Total)
AfricaArgentinaAsiaAustraliaBangladeshBelarusBelizeBrazilBulgariaBurma / MyanmarCambodiaCameroonCanadaCaribbeanCentral AmericaChileChinaColombiaCosta RicaCubaCzechoslovakiaDenmarkDominican RepublicEastern AfricaEastern AsiaEastern EuropeEcuadorEgyptEl SalvadorEnglandEthiopiaEuropeFijiFranceGermanyGhanaGreeceGuatemalaHaitiHondurasHong KongIndiaIndonesiaIranIrelandIsraelItalyJamaicaJapanKazakhstanKenyaKoreaLaosLatin AmericaLatviaLiberiaMexicoMicronesiaMiddle AfricaMoldovaNetherlandsNicaraguaNigeriaNorthern AfricaNorthern EuropeNorwayOceaniaPakistanPanamaPeruPhilippinesPolandRomaniaRussiaSaudi ArabiaScotlandSomaliaSouth AfricaSouth AmericaSouth Central AsiaSouth Eastern AsiaSouthern EuropeSpainSwedenSwitzerlandTaiwanThailandTrinidad and TobagoTurkeyUgandaUkraineUzbekistanVenezuelaVietnamWestern AfricaWestern AsiaWestern EuropeYemenZimbabwe
Immigrant Origin (Percentage)
AfricaArgentinaAsiaAustraliaBangladeshBelarusBelizeBrazilBulgariaBurma / MyanmarCambodiaCameroonCanadaCaribbeanCentral AmericaChileChinaColombiaCosta RicaCubaCzechoslovakiaDenmarkDominican RepublicEastern AfricaEastern AsiaEastern EuropeEcuadorEgyptEl SalvadorEnglandEthiopiaEuropeFijiFranceGermanyGhanaGreeceGuatemalaHaitiHondurasHong KongIndiaIndonesiaIranIrelandIsraelItalyJamaicaJapanKazakhstanKenyaKoreaLaosLatin AmericaLatviaLiberiaMexicoMicronesiaMiddle AfricaMoldovaNetherlandsNicaraguaNigeriaNorthern AfricaNorthern EuropeNorwayOceaniaPakistanPanamaPeruPhilippinesPolandRomaniaRussiaSaudi ArabiaScotlandSomaliaSouth AfricaSouth AmericaSouth Central AsiaSouth Eastern AsiaSouthern EuropeSpainSwedenSwitzerlandTaiwanThailandTrinidad and TobagoTurkeyUgandaUkraineUzbekistanVenezuelaVietnamWestern AfricaWestern AsiaWestern EuropeYemenZimbabwe
Income
Income (Families)
Income (Households)
Poverty
Poverty (Families)
Unemployment
Employment Occupations
Employment Industries
Employer Class
Commute Time
Commute Means
School Enrollment
Education by Degree Field
Occupancy
Finances
Physical Characteristics
Tacoma
Compare Zip Codes
Comparison Subject

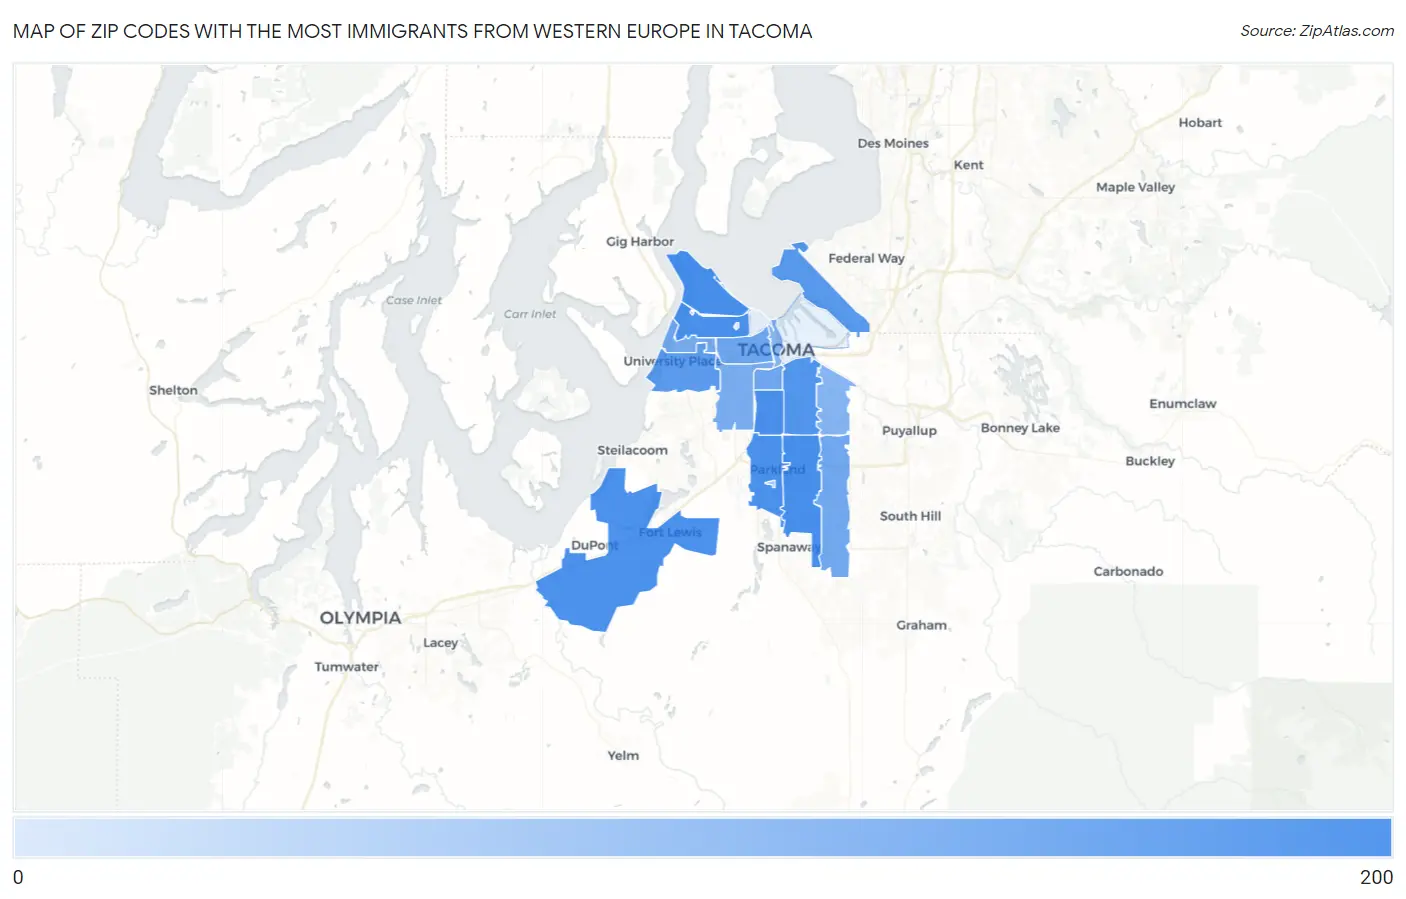
Map of Zip Codes with the Most Immigrants from Western Europe in Tacoma

0
200
Zip Codes with the Most Immigrants from Western Europe in Tacoma Map

Zip Codes with the Most Immigrants from Western Europe in Tacoma, WA

Zip Code Western Europe vs State vs National
1.9840716929,051(0.58%)#50924,665(0.02%)#1,396
2.9844516729,051(0.57%)#51924,665(0.02%)#1,423
3.9840615429,051(0.53%)#60924,665(0.02%)#1,596
4.9840815429,051(0.53%)#61924,665(0.02%)#1,597
5.9844414929,051(0.51%)#64924,665(0.02%)#1,671
6.9843314229,051(0.49%)#75924,665(0.02%)#1,800
7.9840411529,051(0.40%)#94924,665(0.01%)#2,382
8.984229829,051(0.34%)#115924,665(0.01%)#2,899
9.984668029,051(0.28%)#126924,665(0.01%)#3,541
10.984054429,051(0.15%)#179924,665(0.00%)#5,643
11.984184129,051(0.14%)#190924,665(0.00%)#5,923
12.984463829,051(0.13%)#194924,665(0.00%)#6,201
13.984653129,051(0.11%)#210924,665(0.00%)#6,922
14.984093029,051(0.10%)#212924,665(0.00%)#6,988
15.984431929,051(0.07%)#243924,665(0.00%)#8,666
16.984021829,051(0.06%)#248924,665(0.00%)#8,858
17.98447629,051(0.02%)#308924,665(0.00%)#12,409

Common Questions

What are the Top 10 Zip Codes with the Most Immigrants from Western Europe in Tacoma, WA?
Top 10 Zip Codes with the Most Immigrants from Western Europe in Tacoma, WA are:
#1
169
#2
167
#3
154
#4
154
#5
149
#6
142
#7
115
#8
98
#9
80
#10
44
What zip code has the Most Immigrants from Western Europe in Tacoma, WA?
98407 has the Most Immigrants from Western Europe in Tacoma, WA with 169.
What is the Total Immigrants from Western Europe in Tacoma, WA?
Total Immigrants from Western Europe in Tacoma is 880.
What is the Total Immigrants from Western Europe in Washington?
Total Immigrants from Western Europe in Washington is 29,051.
What is the Total Immigrants from Western Europe in the United States?
Total Immigrants from Western Europe in the United States is 924,665.