Zip Codes with the Highest Percentage of Population Employed in Professional & Scientific Services in Virginia
RELATED REPORTS & OPTIONS
Professional & Scientific Services
Virginia
Compare Zip Codes
Map of Zip Codes with the Highest Percentage of Population Employed in Professional & Scientific Services in Virginia
10.0%
50.0%
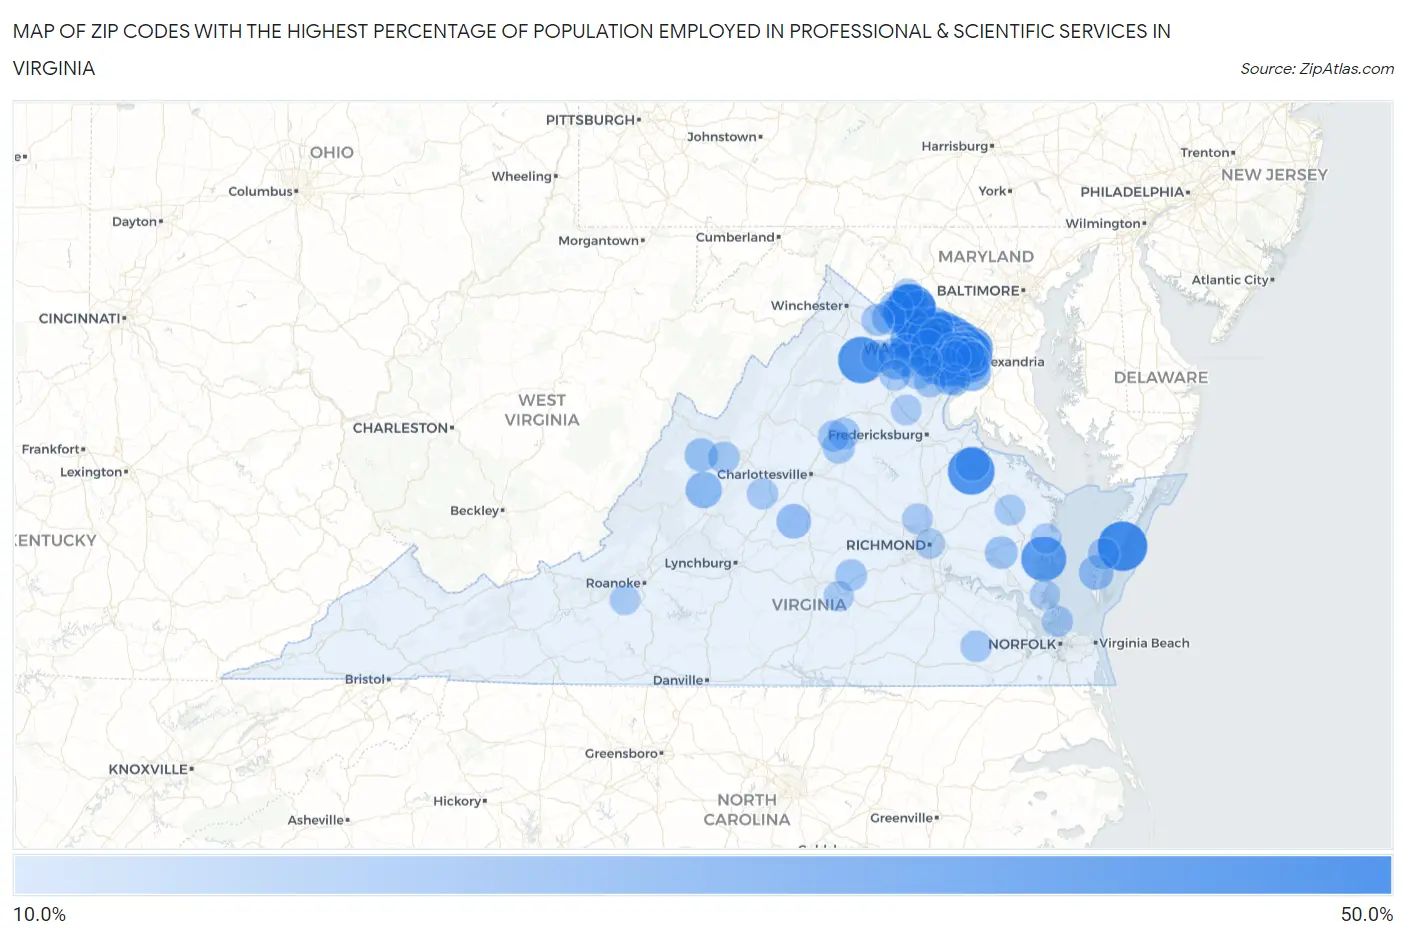
Zip Codes with the Highest Percentage of Population Employed in Professional & Scientific Services in Virginia
| Zip Code | % Employed | vs State | vs National | |
| 1. | 23423 | 42.2% | 12.2%(+30.0)#1 | 7.8%(+34.4)#82 |
| 2. | 20129 | 41.3% | 12.2%(+29.1)#2 | 7.8%(+33.5)#87 |
| 3. | 22476 | 38.5% | 12.2%(+26.3)#3 | 7.8%(+30.6)#100 |
| 4. | 22639 | 37.8% | 12.2%(+25.6)#4 | 7.8%(+29.9)#107 |
| 5. | 23128 | 36.1% | 12.2%(+23.9)#5 | 7.8%(+28.3)#121 |
| 6. | 22102 | 35.7% | 12.2%(+23.5)#6 | 7.8%(+27.8)#129 |
| 7. | 20194 | 34.6% | 12.2%(+22.4)#7 | 7.8%(+26.7)#141 |
| 8. | 20158 | 34.2% | 12.2%(+22.0)#8 | 7.8%(+26.3)#147 |
| 9. | 22203 | 34.0% | 12.2%(+21.8)#9 | 7.8%(+26.2)#149 |
| 10. | 20148 | 33.9% | 12.2%(+21.7)#10 | 7.8%(+26.1)#152 |
| 11. | 22209 | 33.6% | 12.2%(+21.4)#11 | 7.8%(+25.8)#157 |
| 12. | 22201 | 31.8% | 12.2%(+19.6)#12 | 7.8%(+23.9)#182 |
| 13. | 22066 | 31.6% | 12.2%(+19.4)#13 | 7.8%(+23.7)#188 |
| 14. | 22124 | 31.5% | 12.2%(+19.3)#14 | 7.8%(+23.7)#189 |
| 15. | 22101 | 31.4% | 12.2%(+19.2)#15 | 7.8%(+23.5)#193 |
| 16. | 20171 | 31.3% | 12.2%(+19.1)#16 | 7.8%(+23.4)#195 |
| 17. | 22180 | 30.9% | 12.2%(+18.7)#17 | 7.8%(+23.0)#205 |
| 18. | 22182 | 30.4% | 12.2%(+18.2)#18 | 7.8%(+22.6)#213 |
| 19. | 22207 | 29.3% | 12.2%(+17.1)#19 | 7.8%(+21.5)#238 |
| 20. | 20197 | 29.2% | 12.2%(+17.0)#20 | 7.8%(+21.4)#245 |
| 21. | 22043 | 29.1% | 12.2%(+16.9)#21 | 7.8%(+21.3)#252 |
| 22. | 20190 | 29.0% | 12.2%(+16.8)#22 | 7.8%(+21.2)#255 |
| 23. | 22033 | 28.5% | 12.2%(+16.3)#23 | 7.8%(+20.7)#275 |
| 24. | 22202 | 28.3% | 12.2%(+16.1)#24 | 7.8%(+20.4)#281 |
| 25. | 22301 | 28.2% | 12.2%(+16.0)#25 | 7.8%(+20.3)#287 |
| 26. | 20152 | 28.1% | 12.2%(+15.9)#26 | 7.8%(+20.2)#292 |
| 27. | 20147 | 28.0% | 12.2%(+15.8)#27 | 7.8%(+20.2)#294 |
| 28. | 20105 | 27.9% | 12.2%(+15.7)#28 | 7.8%(+20.1)#297 |
| 29. | 22181 | 26.8% | 12.2%(+14.6)#29 | 7.8%(+19.0)#334 |
| 30. | 22046 | 26.8% | 12.2%(+14.6)#30 | 7.8%(+18.9)#339 |
| 31. | 22030 | 26.7% | 12.2%(+14.5)#31 | 7.8%(+18.8)#344 |
| 32. | 22211 | 26.7% | 12.2%(+14.5)#32 | 7.8%(+18.8)#345 |
| 33. | 22315 | 26.0% | 12.2%(+13.8)#33 | 7.8%(+18.2)#372 |
| 34. | 20165 | 25.6% | 12.2%(+13.4)#34 | 7.8%(+17.7)#389 |
| 35. | 22205 | 25.4% | 12.2%(+13.2)#35 | 7.8%(+17.6)#396 |
| 36. | 22308 | 25.4% | 12.2%(+13.2)#36 | 7.8%(+17.6)#398 |
| 37. | 20120 | 25.4% | 12.2%(+13.2)#37 | 7.8%(+17.5)#402 |
| 38. | 20191 | 25.3% | 12.2%(+13.1)#38 | 7.8%(+17.5)#405 |
| 39. | 22314 | 25.0% | 12.2%(+12.8)#39 | 7.8%(+17.2)#418 |
| 40. | 22039 | 24.5% | 12.2%(+12.3)#40 | 7.8%(+16.7)#460 |
| 41. | 20137 | 24.4% | 12.2%(+12.2)#41 | 7.8%(+16.5)#470 |
| 42. | 22206 | 24.2% | 12.2%(+12.0)#42 | 7.8%(+16.3)#486 |
| 43. | 24473 | 24.2% | 12.2%(+12.0)#43 | 7.8%(+16.3)#490 |
| 44. | 20124 | 24.1% | 12.2%(+11.9)#44 | 7.8%(+16.3)#493 |
| 45. | 20175 | 23.5% | 12.2%(+11.3)#45 | 7.8%(+15.7)#529 |
| 46. | 20166 | 22.7% | 12.2%(+10.5)#46 | 7.8%(+14.8)#607 |
| 47. | 22031 | 22.7% | 12.2%(+10.5)#47 | 7.8%(+14.8)#608 |
| 48. | 20169 | 21.9% | 12.2%(+9.71)#48 | 7.8%(+14.1)#671 |
| 49. | 20176 | 21.9% | 12.2%(+9.69)#49 | 7.8%(+14.0)#673 |
| 50. | 24562 | 21.9% | 12.2%(+9.68)#50 | 7.8%(+14.0)#676 |
| 51. | 22509 | 21.9% | 12.2%(+9.68)#51 | 7.8%(+14.0)#678 |
| 52. | 22302 | 21.9% | 12.2%(+9.67)#52 | 7.8%(+14.0)#679 |
| 53. | 23347 | 21.8% | 12.2%(+9.65)#53 | 7.8%(+14.0)#681 |
| 54. | 20170 | 21.8% | 12.2%(+9.60)#54 | 7.8%(+14.0)#689 |
| 55. | 20151 | 21.4% | 12.2%(+9.20)#55 | 7.8%(+13.6)#736 |
| 56. | 20132 | 21.3% | 12.2%(+9.10)#56 | 7.8%(+13.5)#746 |
| 57. | 22032 | 21.1% | 12.2%(+8.93)#57 | 7.8%(+13.3)#764 |
| 58. | 20155 | 21.1% | 12.2%(+8.87)#58 | 7.8%(+13.2)#771 |
| 59. | 20141 | 20.8% | 12.2%(+8.62)#59 | 7.8%(+13.0)#800 |
| 60. | 22153 | 20.6% | 12.2%(+8.43)#60 | 7.8%(+12.8)#814 |
| 61. | 24432 | 20.5% | 12.2%(+8.28)#61 | 7.8%(+12.6)#828 |
| 62. | 22310 | 20.5% | 12.2%(+8.28)#62 | 7.8%(+12.6)#829 |
| 63. | 22213 | 20.1% | 12.2%(+7.85)#63 | 7.8%(+12.2)#882 |
| 64. | 20136 | 19.8% | 12.2%(+7.58)#64 | 7.8%(+11.9)#913 |
| 65. | 22027 | 19.7% | 12.2%(+7.51)#65 | 7.8%(+11.9)#922 |
| 66. | 22307 | 19.7% | 12.2%(+7.50)#66 | 7.8%(+11.8)#926 |
| 67. | 22125 | 19.6% | 12.2%(+7.40)#67 | 7.8%(+11.7)#938 |
| 68. | 23011 | 19.6% | 12.2%(+7.39)#68 | 7.8%(+11.7)#939 |
| 69. | 22304 | 19.5% | 12.2%(+7.29)#69 | 7.8%(+11.6)#954 |
| 70. | 20115 | 19.3% | 12.2%(+7.13)#70 | 7.8%(+11.5)#969 |
| 71. | 22042 | 19.1% | 12.2%(+6.89)#71 | 7.8%(+11.2)#991 |
| 72. | 22044 | 19.0% | 12.2%(+6.83)#72 | 7.8%(+11.2)#1,007 |
| 73. | 22204 | 18.9% | 12.2%(+6.68)#73 | 7.8%(+11.0)#1,027 |
| 74. | 22015 | 18.9% | 12.2%(+6.67)#74 | 7.8%(+11.0)#1,029 |
| 75. | 22972 | 18.8% | 12.2%(+6.55)#75 | 7.8%(+10.9)#1,038 |
| 76. | 20112 | 18.7% | 12.2%(+6.54)#76 | 7.8%(+10.9)#1,039 |
| 77. | 20135 | 18.7% | 12.2%(+6.53)#77 | 7.8%(+10.9)#1,040 |
| 78. | 22305 | 18.6% | 12.2%(+6.35)#78 | 7.8%(+10.7)#1,065 |
| 79. | 22732 | 18.4% | 12.2%(+6.24)#79 | 7.8%(+10.6)#1,085 |
| 80. | 20198 | 18.4% | 12.2%(+6.18)#80 | 7.8%(+10.5)#1,094 |
| 81. | 23354 | 18.1% | 12.2%(+5.89)#81 | 7.8%(+10.2)#1,146 |
| 82. | 23083 | 18.0% | 12.2%(+5.83)#82 | 7.8%(+10.2)#1,155 |
| 83. | 24479 | 18.0% | 12.2%(+5.81)#83 | 7.8%(+10.2)#1,159 |
| 84. | 23878 | 17.9% | 12.2%(+5.70)#84 | 7.8%(+10.1)#1,174 |
| 85. | 22079 | 17.7% | 12.2%(+5.47)#85 | 7.8%(+9.82)#1,215 |
| 86. | 22738 | 17.6% | 12.2%(+5.45)#86 | 7.8%(+9.80)#1,219 |
| 87. | 22003 | 17.6% | 12.2%(+5.45)#87 | 7.8%(+9.80)#1,222 |
| 88. | 20121 | 17.6% | 12.2%(+5.37)#88 | 7.8%(+9.72)#1,238 |
| 89. | 20187 | 17.3% | 12.2%(+5.13)#89 | 7.8%(+9.48)#1,282 |
| 90. | 23651 | 17.3% | 12.2%(+5.12)#90 | 7.8%(+9.47)#1,288 |
| 91. | 22958 | 17.3% | 12.2%(+5.10)#91 | 7.8%(+9.45)#1,294 |
| 92. | 22504 | 16.9% | 12.2%(+4.70)#92 | 7.8%(+9.05)#1,388 |
| 93. | 23176 | 16.9% | 12.2%(+4.67)#93 | 7.8%(+9.02)#1,398 |
| 94. | 23059 | 16.8% | 12.2%(+4.57)#94 | 7.8%(+8.92)#1,413 |
| 95. | 22720 | 16.6% | 12.2%(+4.37)#95 | 7.8%(+8.72)#1,466 |
| 96. | 20180 | 16.4% | 12.2%(+4.19)#96 | 7.8%(+8.54)#1,521 |
| 97. | 23922 | 16.4% | 12.2%(+4.17)#97 | 7.8%(+8.52)#1,525 |
| 98. | 23696 | 16.3% | 12.2%(+4.09)#98 | 7.8%(+8.44)#1,545 |
| 99. | 23219 | 16.2% | 12.2%(+3.96)#99 | 7.8%(+8.31)#1,569 |
| 100. | 24059 | 16.1% | 12.2%(+3.89)#100 | 7.8%(+8.24)#1,589 |
Common Questions
What are the Top 10 Zip Codes with the Highest Percentage of Population Employed in Professional & Scientific Services in Virginia?
Top 10 Zip Codes with the Highest Percentage of Population Employed in Professional & Scientific Services in Virginia are:
What zip code has the Highest Percentage of Population Employed in Professional & Scientific Services in Virginia?
23423 has the Highest Percentage of Population Employed in Professional & Scientific Services in Virginia with 42.2%.
What is the Percentage of Population Employed in Professional & Scientific Services in the State of Virginia?
Percentage of Population Employed in Professional & Scientific Services in Virginia is 12.2%.
What is the Percentage of Population Employed in Professional & Scientific Services in the United States?
Percentage of Population Employed in Professional & Scientific Services in the United States is 7.8%.