Zip Codes with the Highest Percentage of Population Employed in Legal Services & Support in San Angelo, TX
RELATED REPORTS & OPTIONS
Legal Services & Support
San Angelo
Compare Zip Codes
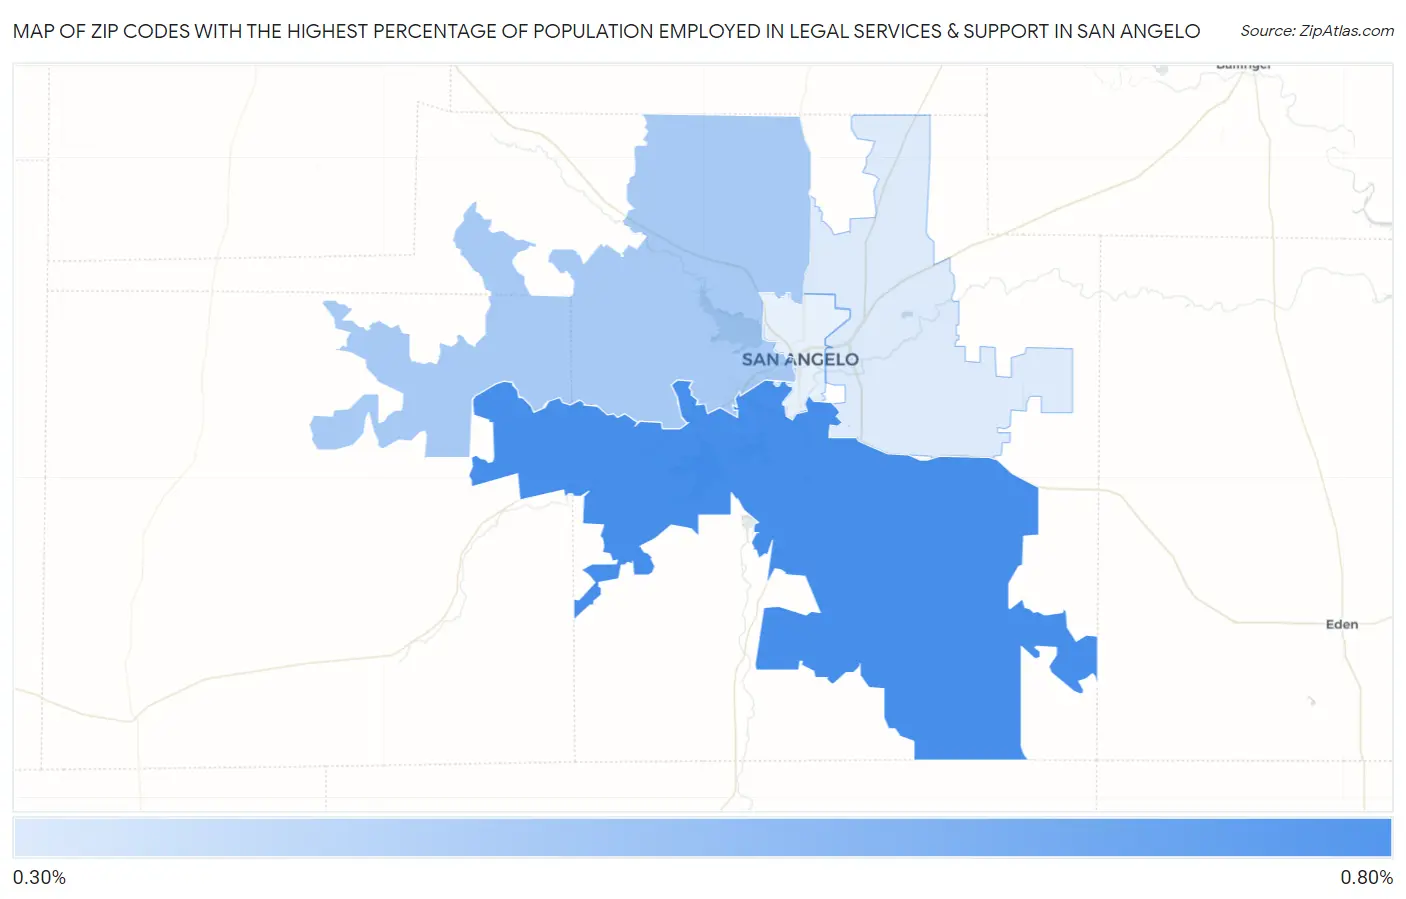
Map of Zip Codes with the Highest Percentage of Population Employed in Legal Services & Support in San Angelo
0.35%
0.78%
Zip Codes with the Highest Percentage of Population Employed in Legal Services & Support in San Angelo, TX
| Zip Code | % Employed | vs State | vs National | |
| 1. | 76904 | 0.78% | 1.0%(-0.232)#542 | 1.2%(-0.408)#9,680 |
| 2. | 76901 | 0.50% | 1.0%(-0.508)#746 | 1.2%(-0.684)#12,634 |
| 3. | 76905 | 0.35% | 1.0%(-0.662)#888 | 1.2%(-0.838)#14,499 |
1
Common Questions
What are the Top 3 Zip Codes with the Highest Percentage of Population Employed in Legal Services & Support in San Angelo, TX?
Top 3 Zip Codes with the Highest Percentage of Population Employed in Legal Services & Support in San Angelo, TX are:
What zip code has the Highest Percentage of Population Employed in Legal Services & Support in San Angelo, TX?
76904 has the Highest Percentage of Population Employed in Legal Services & Support in San Angelo, TX with 0.78%.
What is the Percentage of Population Employed in Legal Services & Support in San Angelo, TX?
Percentage of Population Employed in Legal Services & Support in San Angelo is 0.45%.
What is the Percentage of Population Employed in Legal Services & Support in Texas?
Percentage of Population Employed in Legal Services & Support in Texas is 1.0%.
What is the Percentage of Population Employed in Legal Services & Support in the United States?
Percentage of Population Employed in Legal Services & Support in the United States is 1.2%.