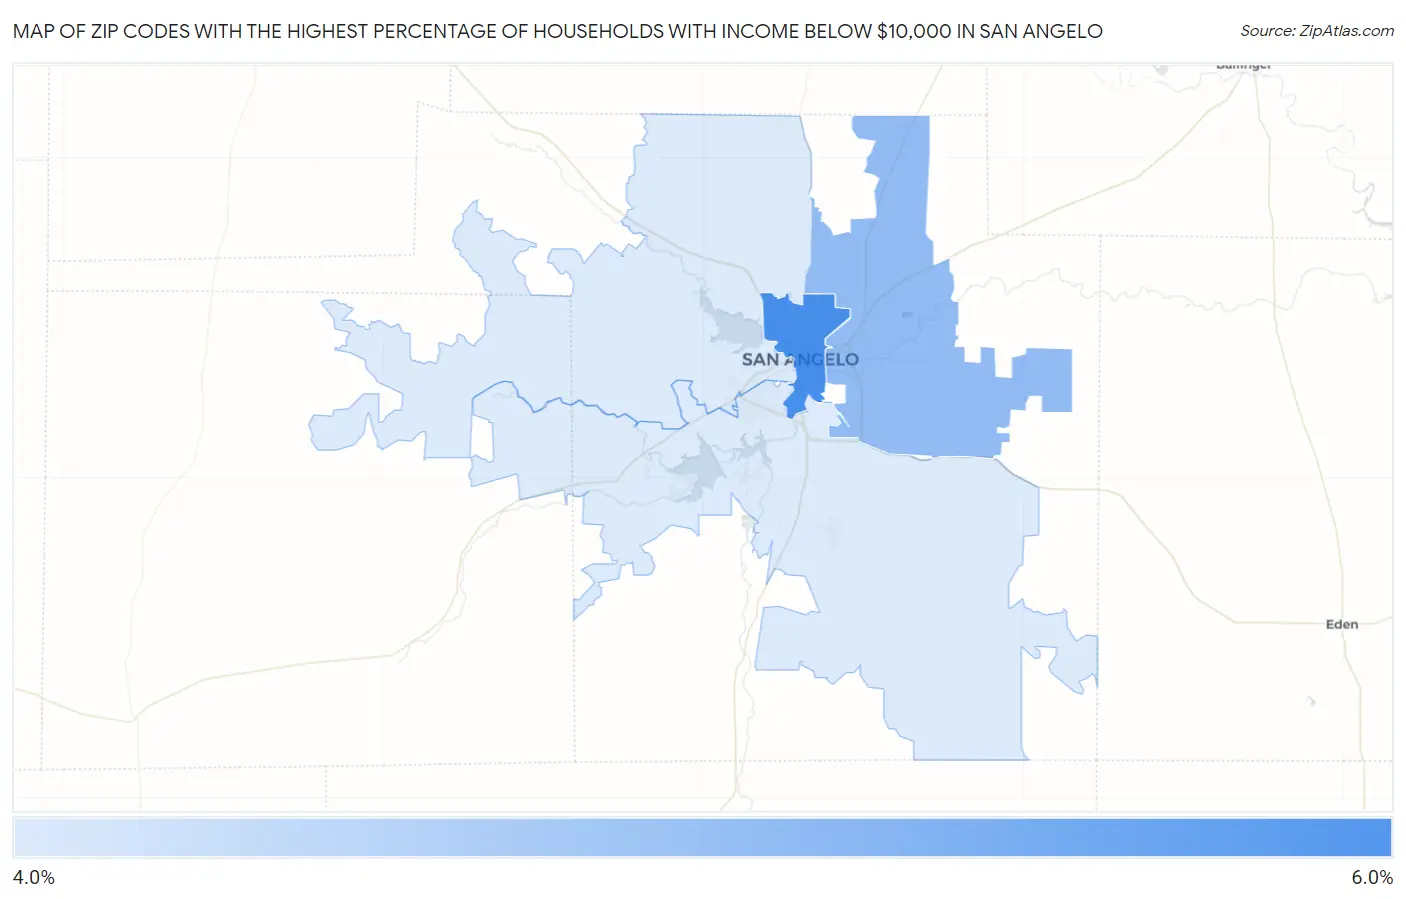
Zip Codes with the Highest Percentage of Households with Income Below $10,000 in San Angelo, TX
RELATED REPORTS & OPTIONS
Household Income | $0-10k
San Angelo
Compare Zip Codes
Map of Zip Codes with the Highest Percentage of Households with Income Below $10,000 in San Angelo
4.1%
5.5%
Zip Codes with the Highest Percentage of Households with Income Below $10,000 in San Angelo, TX
| Zip Code | Households with Income < $10k | vs State | vs National | |
| 1. | 76903 | 5.5% | 5.1%(+0.400)#688 | 4.9%(+0.600)#10,226 |
| 2. | 76905 | 4.8% | 5.1%(-0.300)#823 | 4.9%(-0.100)#12,383 |
| 3. | 76904 | 4.1% | 5.1%(-1.00)#952 | 4.9%(-0.800)#14,832 |
| 4. | 76901 | 4.1% | 5.1%(-1.00)#955 | 4.9%(-0.800)#14,856 |
1
Common Questions
What are the Top 3 Zip Codes with the Highest Percentage of Households with Income Below $10,000 in San Angelo, TX?
Top 3 Zip Codes with the Highest Percentage of Households with Income Below $10,000 in San Angelo, TX are:
What zip code has the Highest Percentage of Households with Income Below $10,000 in San Angelo, TX?
76903 has the Highest Percentage of Households with Income Below $10,000 in San Angelo, TX with 5.5%.
What is the Percentage of Households with Income Below $10,000 in San Angelo, TX?
Percentage of Households with Income Below $10,000 in San Angelo is 4.9%.
What is the Percentage of Households with Income Below $10,000 in Texas?
Percentage of Households with Income Below $10,000 in Texas is 5.1%.
What is the Percentage of Households with Income Below $10,000 in the United States?
Percentage of Households with Income Below $10,000 in the United States is 4.9%.