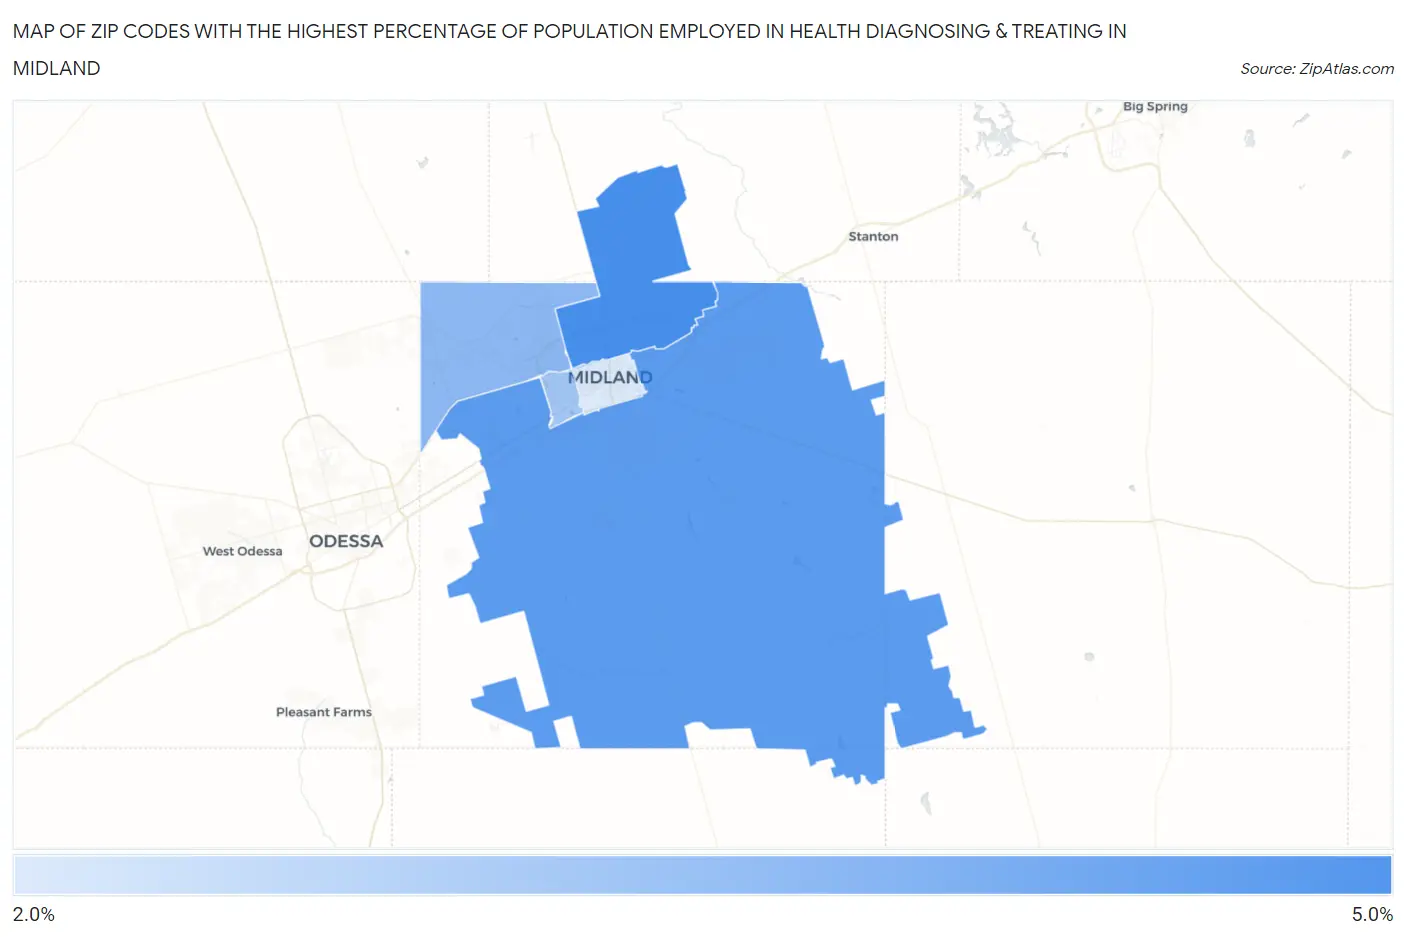
Zip Codes with the Highest Percentage of Population Employed in Health Diagnosing & Treating in Midland, TX
RELATED REPORTS & OPTIONS
Health Diagnosing & Treating
Midland
Compare Zip Codes
Map of Zip Codes with the Highest Percentage of Population Employed in Health Diagnosing & Treating in Midland
2.2%
4.1%
Zip Codes with the Highest Percentage of Population Employed in Health Diagnosing & Treating in Midland, TX
| Zip Code | % Employed | vs State | vs National | |
| 1. | 79705 | 4.1% | 5.5%(-1.38)#1,028 | 6.2%(-2.10)#20,920 |
| 2. | 79706 | 3.9% | 5.5%(-1.62)#1,088 | 6.2%(-2.35)#21,696 |
| 3. | 79707 | 3.2% | 5.5%(-2.27)#1,236 | 6.2%(-3.00)#23,646 |
| 4. | 79703 | 2.9% | 5.5%(-2.59)#1,308 | 6.2%(-3.32)#24,508 |
| 5. | 79701 | 2.2% | 5.5%(-3.32)#1,436 | 6.2%(-4.05)#26,126 |
1
Common Questions
What are the Top 3 Zip Codes with the Highest Percentage of Population Employed in Health Diagnosing & Treating in Midland, TX?
Top 3 Zip Codes with the Highest Percentage of Population Employed in Health Diagnosing & Treating in Midland, TX are:
What zip code has the Highest Percentage of Population Employed in Health Diagnosing & Treating in Midland, TX?
79705 has the Highest Percentage of Population Employed in Health Diagnosing & Treating in Midland, TX with 4.1%.
What is the Percentage of Population Employed in Health Diagnosing & Treating in Midland, TX?
Percentage of Population Employed in Health Diagnosing & Treating in Midland is 3.5%.
What is the Percentage of Population Employed in Health Diagnosing & Treating in Texas?
Percentage of Population Employed in Health Diagnosing & Treating in Texas is 5.5%.
What is the Percentage of Population Employed in Health Diagnosing & Treating in the United States?
Percentage of Population Employed in Health Diagnosing & Treating in the United States is 6.2%.