Zip Codes with the Highest Percentage of Households with Income Above $100,000 in Hurst, TX
RELATED REPORTS & OPTIONS
Household Income | $100k+
Hurst
Compare Zip Codes
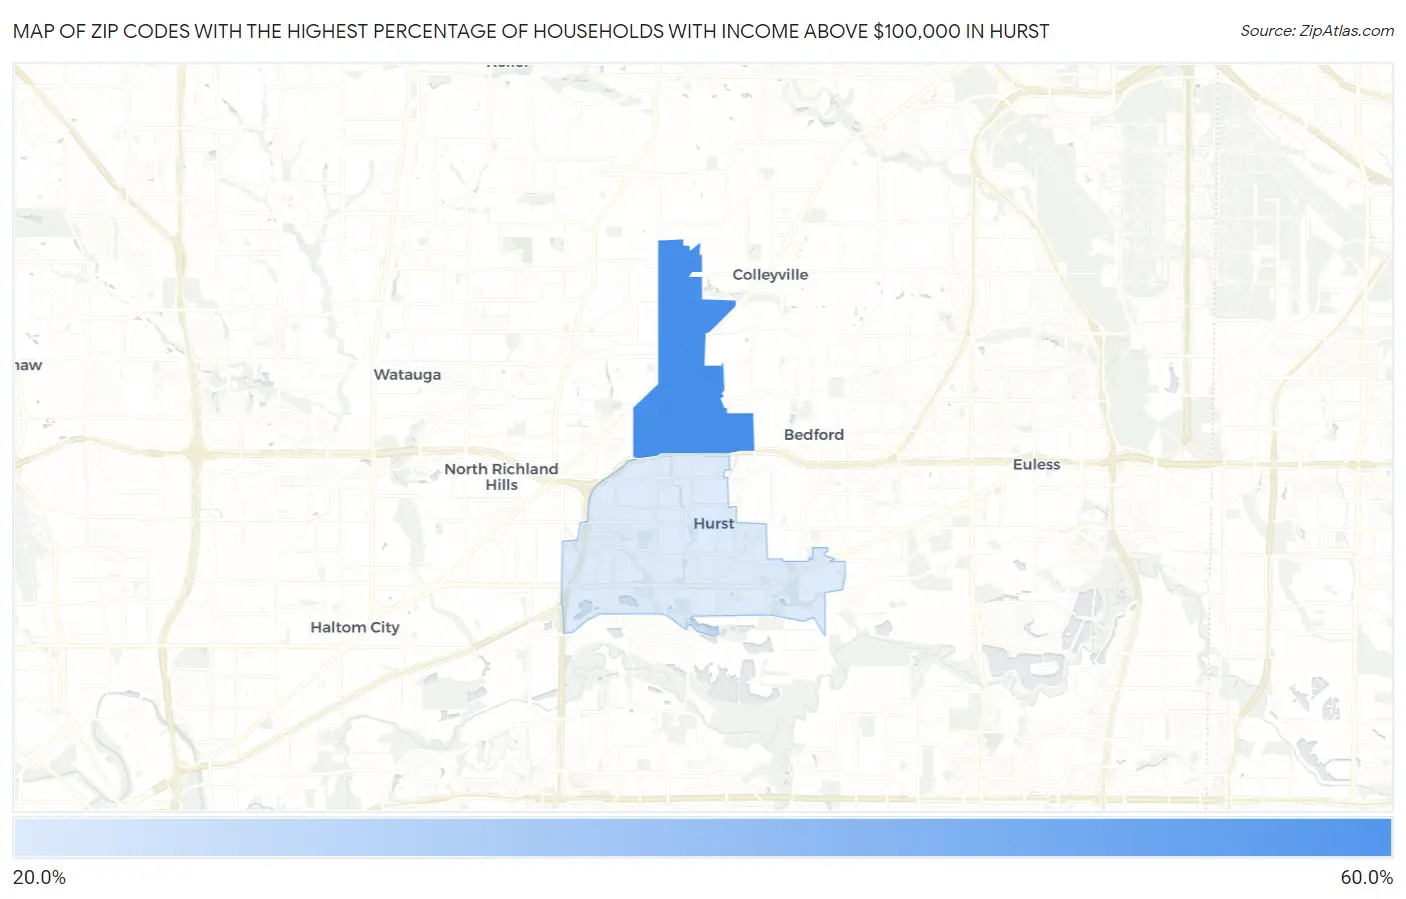
Map of Zip Codes with the Highest Percentage of Households with Income Above $100,000 in Hurst
26.1%
54.3%
Zip Codes with the Highest Percentage of Households with Income Above $100,000 in Hurst, TX
| Zip Code | Households with Income > $100k | vs State | vs National | |
| 1. | 76054 | 54.3% | 36.2%(+18.1)#186 | 37.3%(+17.0)#3,642 |
| 2. | 76053 | 26.1% | 36.2%(-10.1)#1,073 | 37.3%(-11.2)#18,778 |
1
Common Questions
What are the Top Zip Codes with the Highest Percentage of Households with Income Above $100,000 in Hurst, TX?
Top Zip Codes with the Highest Percentage of Households with Income Above $100,000 in Hurst, TX are:
What zip code has the Highest Percentage of Households with Income Above $100,000 in Hurst, TX?
76054 has the Highest Percentage of Households with Income Above $100,000 in Hurst, TX with 54.3%.
What is the Percentage of Households with Income Above $100,000 in Hurst, TX?
Percentage of Households with Income Above $100,000 in Hurst is 32.5%.
What is the Percentage of Households with Income Above $100,000 in Texas?
Percentage of Households with Income Above $100,000 in Texas is 36.2%.
What is the Percentage of Households with Income Above $100,000 in the United States?
Percentage of Households with Income Above $100,000 in the United States is 37.3%.