Zip Codes with the Highest Percentage of Families with Income Above $200,000 in Hurst, TX
RELATED REPORTS & OPTIONS
Family Income | $200k+
Hurst
Compare Zip Codes
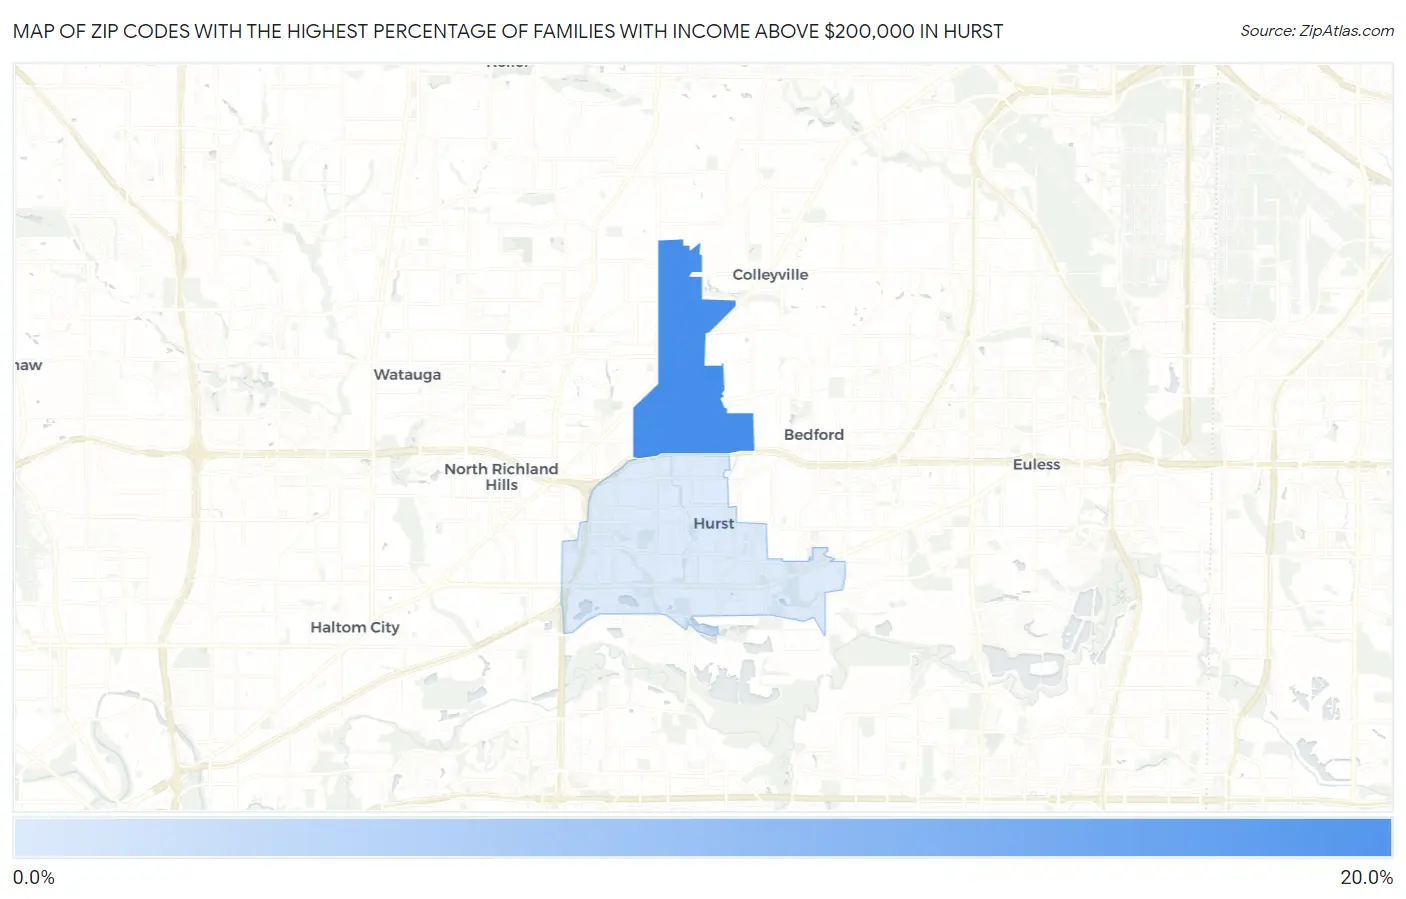
Map of Zip Codes with the Highest Percentage of Families with Income Above $200,000 in Hurst
5.4%
18.9%
Zip Codes with the Highest Percentage of Families with Income Above $200,000 in Hurst, TX
| Zip Code | Families with Income > $200k | vs State | vs National | |
| 1. | 76054 | 18.9% | 13.5%(+5.40)#266 | 14.8%(+4.10)#5,201 |
| 2. | 76053 | 5.4% | 13.5%(-8.10)#1,030 | 14.8%(-9.40)#17,573 |
1
Common Questions
What are the Top Zip Codes with the Highest Percentage of Families with Income Above $200,000 in Hurst, TX?
Top Zip Codes with the Highest Percentage of Families with Income Above $200,000 in Hurst, TX are:
What zip code has the Highest Percentage of Families with Income Above $200,000 in Hurst, TX?
76054 has the Highest Percentage of Families with Income Above $200,000 in Hurst, TX with 18.9%.
What is the Percentage of Families with Income Above $200,000 in Hurst, TX?
Percentage of Families with Income Above $200,000 in Hurst is 9.3%.
What is the Percentage of Families with Income Above $200,000 in Texas?
Percentage of Families with Income Above $200,000 in Texas is 13.5%.
What is the Percentage of Families with Income Above $200,000 in the United States?
Percentage of Families with Income Above $200,000 in the United States is 14.8%.