Zip Codes with the Highest Percentage of Population Employed in Agriculture, Fishing & Hunting in Hurst, TX
RELATED REPORTS & OPTIONS
Agriculture, Fishing & Hunting
Hurst
Compare Zip Codes
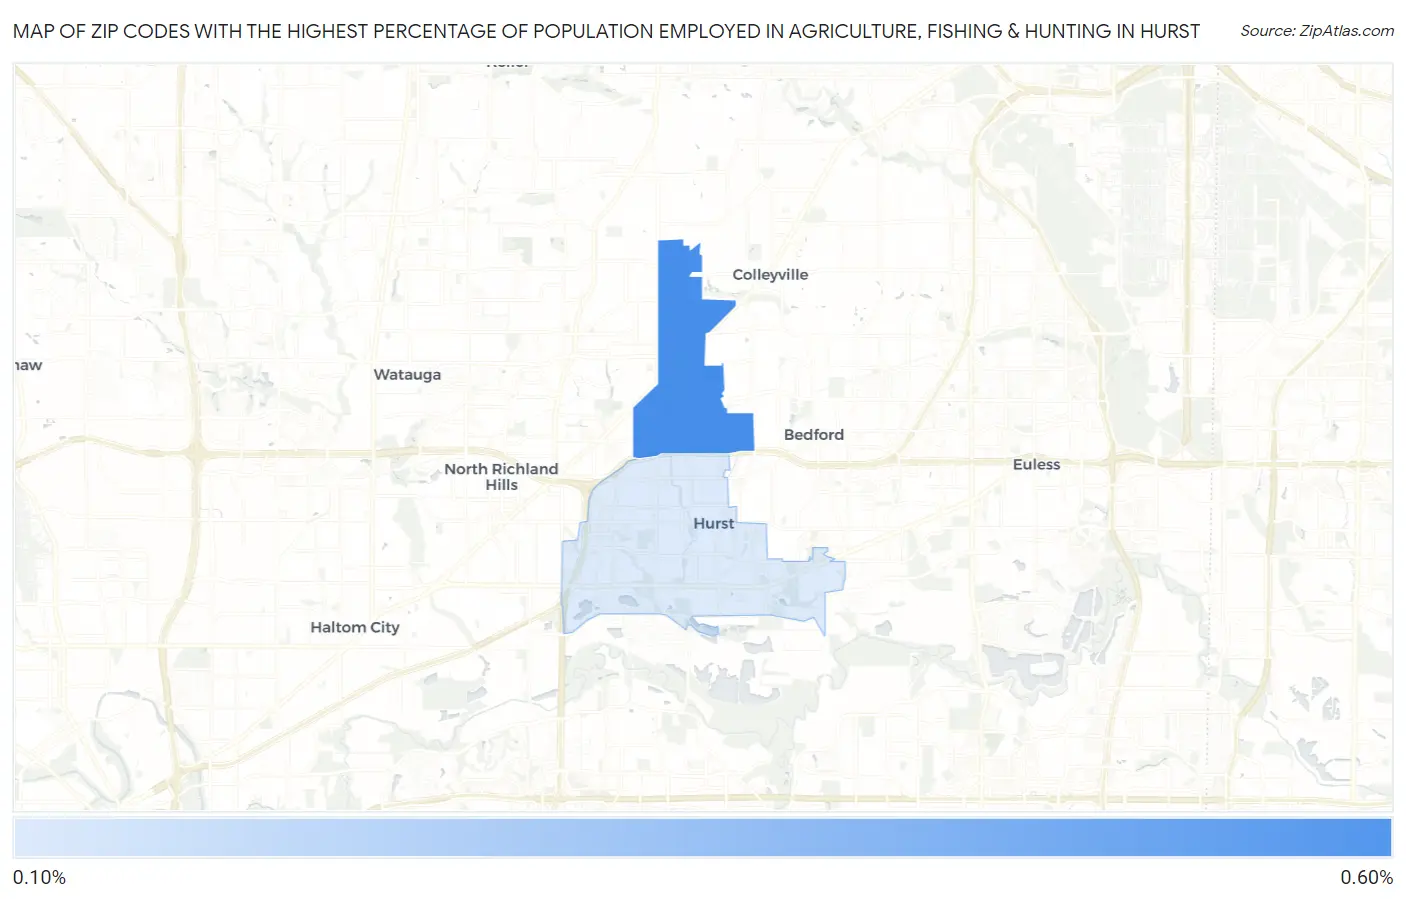
Map of Zip Codes with the Highest Percentage of Population Employed in Agriculture, Fishing & Hunting in Hurst
0.14%
0.56%
Zip Codes with the Highest Percentage of Population Employed in Agriculture, Fishing & Hunting in Hurst, TX
| Zip Code | % Employed | vs State | vs National | |
| 1. | 76054 | 0.56% | 0.75%(-0.197)#1,015 | 1.2%(-0.644)#18,810 |
| 2. | 76053 | 0.14% | 0.75%(-0.611)#1,309 | 1.2%(-1.06)#23,145 |
1
Common Questions
What are the Top Zip Codes with the Highest Percentage of Population Employed in Agriculture, Fishing & Hunting in Hurst, TX?
Top Zip Codes with the Highest Percentage of Population Employed in Agriculture, Fishing & Hunting in Hurst, TX are:
What zip code has the Highest Percentage of Population Employed in Agriculture, Fishing & Hunting in Hurst, TX?
76054 has the Highest Percentage of Population Employed in Agriculture, Fishing & Hunting in Hurst, TX with 0.56%.
What is the Percentage of Population Employed in Agriculture, Fishing & Hunting in Hurst, TX?
Percentage of Population Employed in Agriculture, Fishing & Hunting in Hurst is 0.28%.
What is the Percentage of Population Employed in Agriculture, Fishing & Hunting in Texas?
Percentage of Population Employed in Agriculture, Fishing & Hunting in Texas is 0.75%.
What is the Percentage of Population Employed in Agriculture, Fishing & Hunting in the United States?
Percentage of Population Employed in Agriculture, Fishing & Hunting in the United States is 1.2%.