Zip Codes with the Highest Percentage of Households with Income Below $10,000 in Cleburne, TX
RELATED REPORTS & OPTIONS
Household Income | $0-10k
Cleburne
Compare Zip Codes
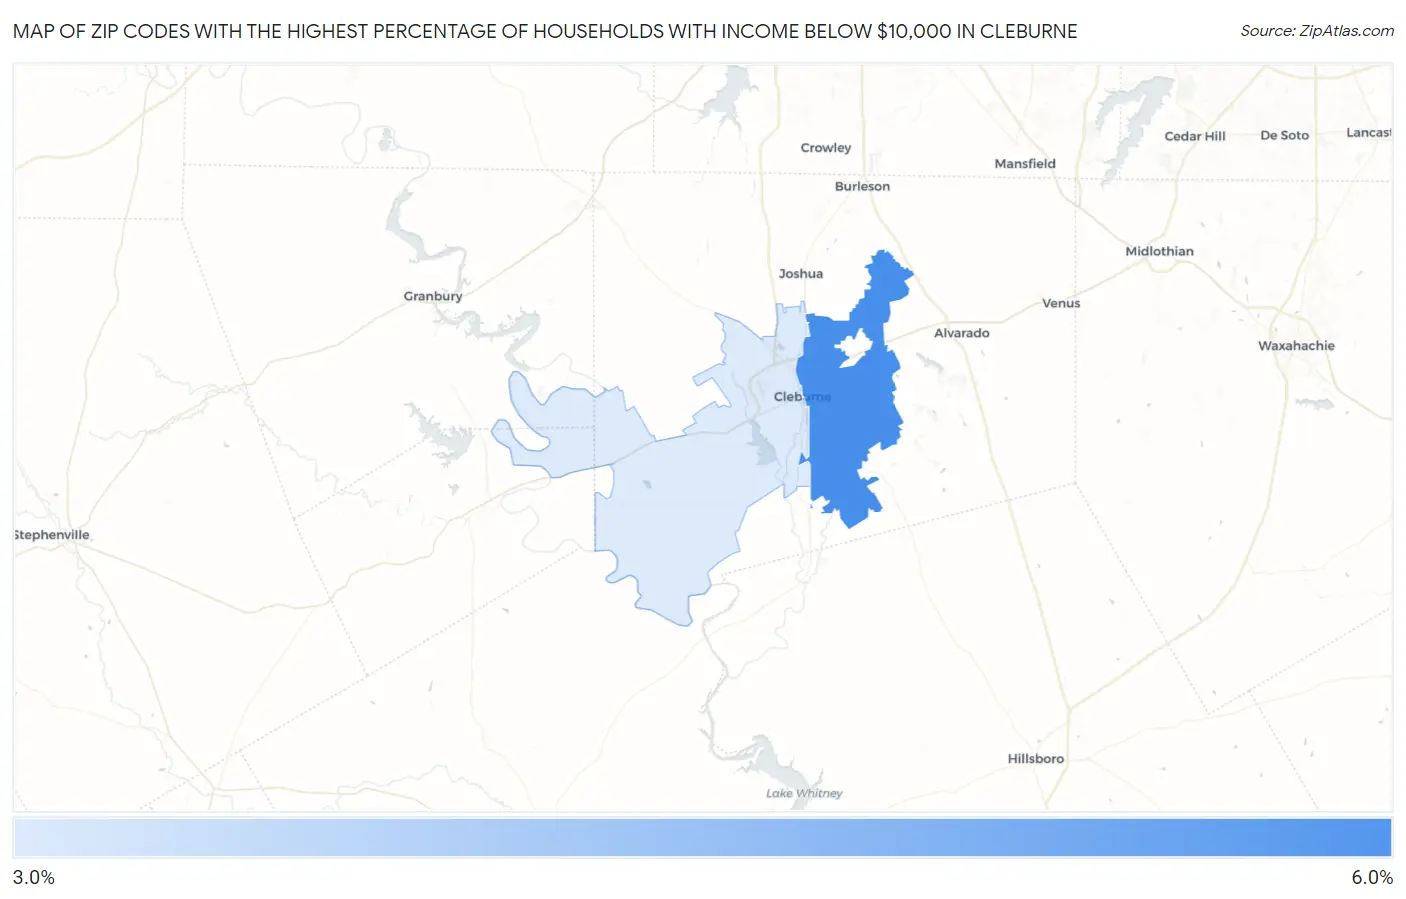
Map of Zip Codes with the Highest Percentage of Households with Income Below $10,000 in Cleburne
3.4%
5.2%
Zip Codes with the Highest Percentage of Households with Income Below $10,000 in Cleburne, TX
| Zip Code | Households with Income < $10k | vs State | vs National | |
| 1. | 76031 | 5.2% | 5.1%(+0.100)#737 | 4.9%(+0.300)#11,112 |
| 2. | 76033 | 3.4% | 5.1%(-1.70)#1,120 | 4.9%(-1.50)#17,680 |
1
Common Questions
What are the Top Zip Codes with the Highest Percentage of Households with Income Below $10,000 in Cleburne, TX?
Top Zip Codes with the Highest Percentage of Households with Income Below $10,000 in Cleburne, TX are:
What zip code has the Highest Percentage of Households with Income Below $10,000 in Cleburne, TX?
76031 has the Highest Percentage of Households with Income Below $10,000 in Cleburne, TX with 5.2%.
What is the Percentage of Households with Income Below $10,000 in Cleburne, TX?
Percentage of Households with Income Below $10,000 in Cleburne is 4.0%.
What is the Percentage of Households with Income Below $10,000 in Texas?
Percentage of Households with Income Below $10,000 in Texas is 5.1%.
What is the Percentage of Households with Income Below $10,000 in the United States?
Percentage of Households with Income Below $10,000 in the United States is 4.9%.