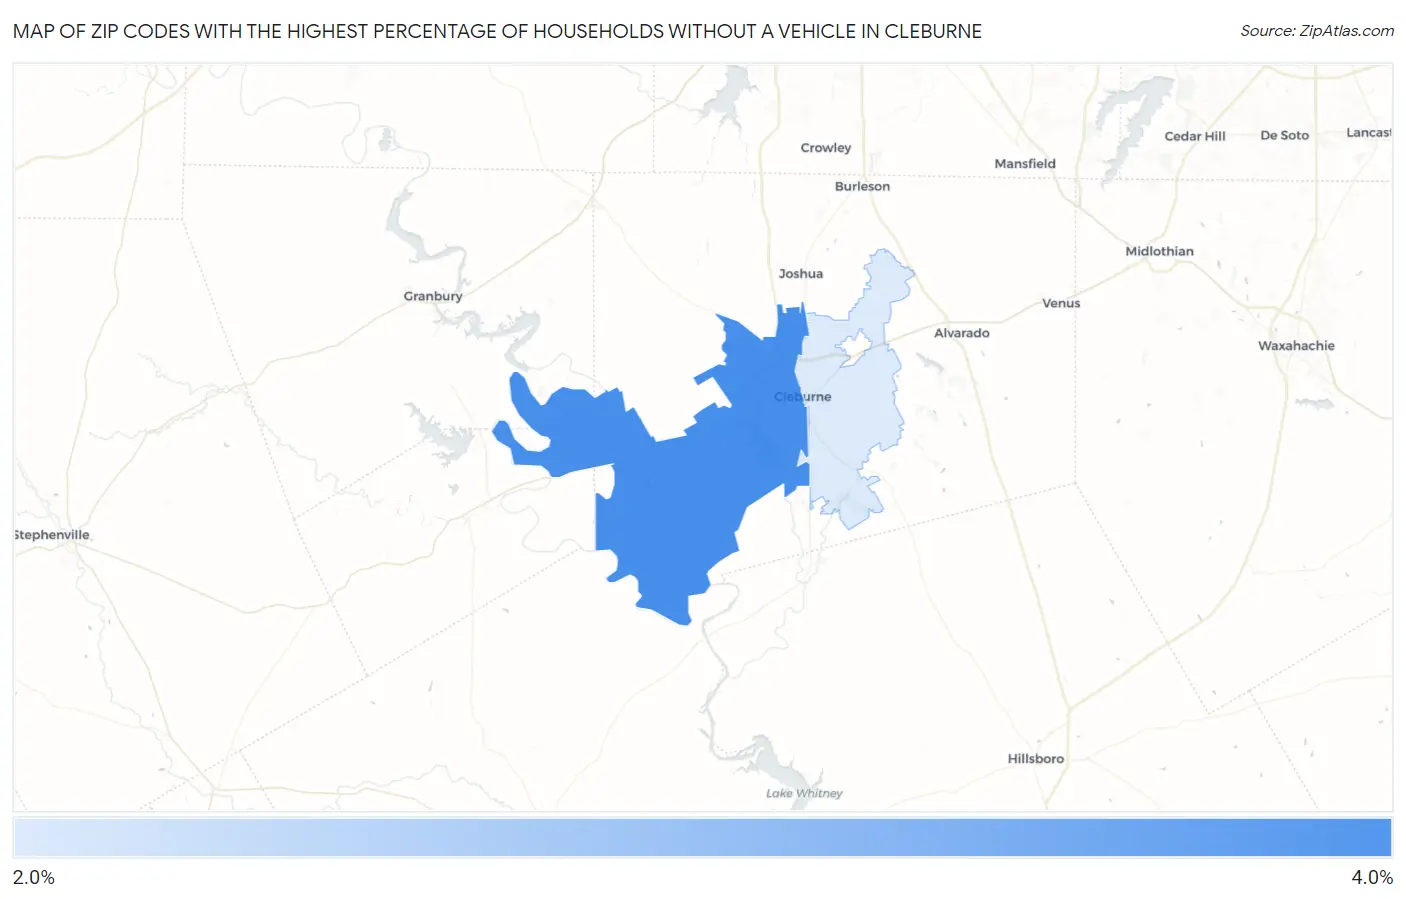
Zip Codes with the Highest Percentage of Households Without a Vehicle in Cleburne, TX
RELATED REPORTS & OPTIONS
Households without a Cars
Cleburne
Compare Zip Codes
Map of Zip Codes with the Highest Percentage of Households Without a Vehicle in Cleburne
2.4%
3.2%
Zip Codes with the Highest Percentage of Households Without a Vehicle in Cleburne, TX
| Zip Code | Housholds Without a Car | vs State | vs National | |
| 1. | 76033 | 3.2% | 5.3%(-2.10)#1,019 | 8.3%(-5.10)#18,354 |
| 2. | 76031 | 2.4% | 5.3%(-2.90)#1,196 | 8.3%(-5.90)#21,091 |
1
Common Questions
What are the Top Zip Codes with the Highest Percentage of Households Without a Vehicle in Cleburne, TX?
Top Zip Codes with the Highest Percentage of Households Without a Vehicle in Cleburne, TX are:
What zip code has the Highest Percentage of Households Without a Vehicle in Cleburne, TX?
76033 has the Highest Percentage of Households Without a Vehicle in Cleburne, TX with 3.2%.
What is the Percentage of Households Without a Vehicle in Cleburne, TX?
Percentage of Households Without a Vehicle in Cleburne is 3.7%.
What is the Percentage of Households Without a Vehicle in Texas?
Percentage of Households Without a Vehicle in Texas is 5.3%.
What is the Percentage of Households Without a Vehicle in the United States?
Percentage of Households Without a Vehicle in the United States is 8.3%.