Kiowa vs Honduran Single Female Poverty
COMPARE
Kiowa
Honduran
Single Female Poverty
Single Female Poverty Comparison
Kiowa
Hondurans
26.9%
SINGLE FEMALE POVERTY
0.0/ 100
METRIC RATING
324th/ 347
METRIC RANK
25.1%
SINGLE FEMALE POVERTY
0.0/ 100
METRIC RATING
301st/ 347
METRIC RANK
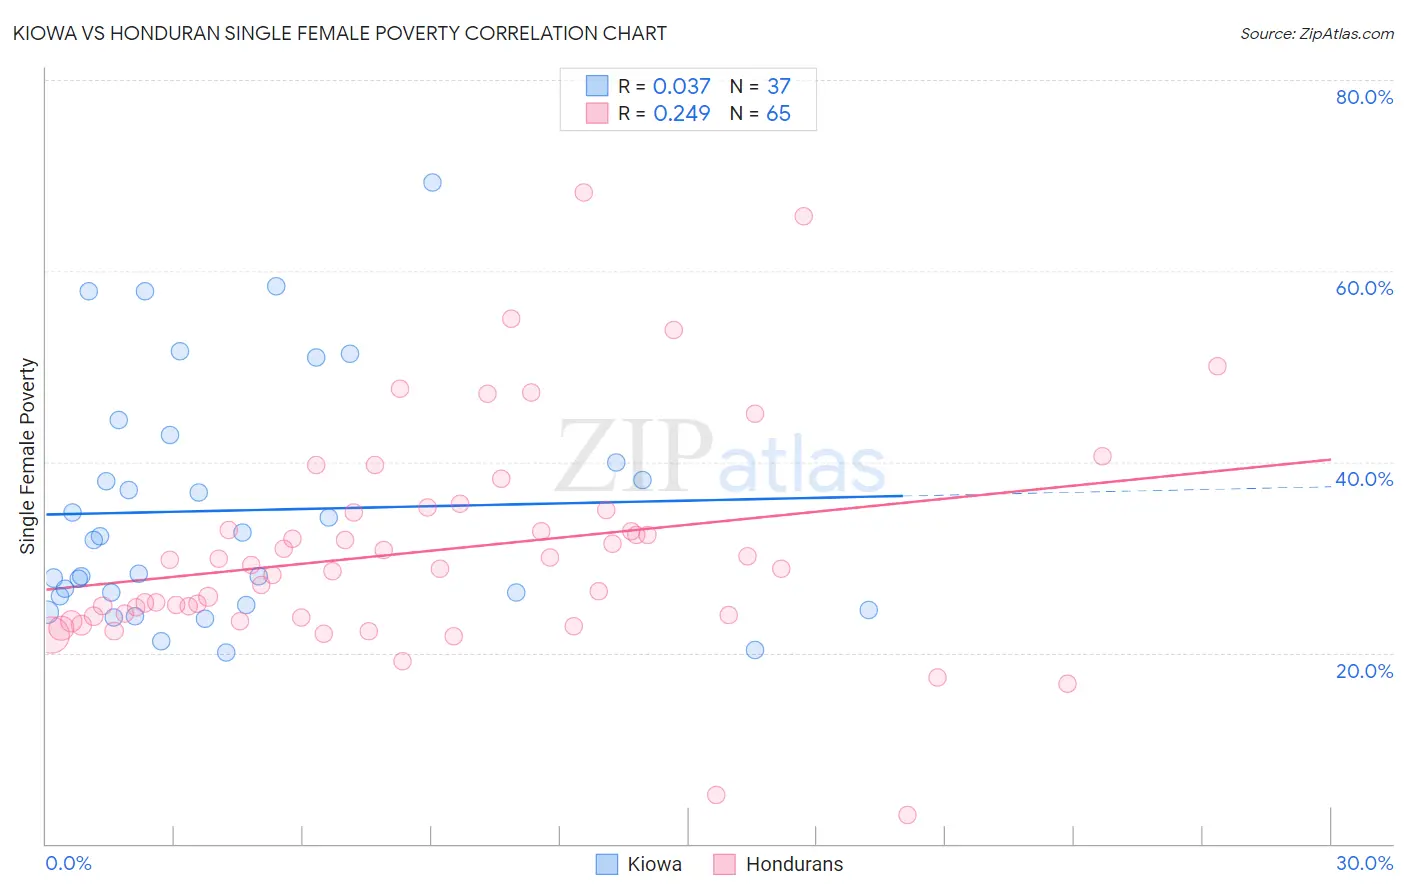
Kiowa vs Honduran Single Female Poverty Correlation Chart
The statistical analysis conducted on geographies consisting of 55,984,677 people shows no correlation between the proportion of Kiowa and poverty level among single females in the United States with a correlation coefficient (R) of 0.037 and weighted average of 26.9%. Similarly, the statistical analysis conducted on geographies consisting of 354,754,258 people shows a weak positive correlation between the proportion of Hondurans and poverty level among single females in the United States with a correlation coefficient (R) of 0.249 and weighted average of 25.1%, a difference of 7.3%.
Single Female Poverty Correlation Summary
| Measurement | Kiowa | Honduran |
| Minimum | 20.0% | 3.0% |
| Maximum | 69.2% | 68.3% |
| Range | 49.2% | 65.3% |
| Mean | 34.9% | 30.7% |
| Median | 31.9% | 28.8% |
| Interquartile 25% (IQ1) | 25.4% | 23.8% |
| Interquartile 75% (IQ3) | 41.4% | 34.8% |
| Interquartile Range (IQR) | 16.0% | 11.0% |
| Standard Deviation (Sample) | 12.6% | 11.6% |
| Standard Deviation (Population) | 12.4% | 11.6% |
Similar Demographics by Single Female Poverty
Demographics Similar to Kiowa by Single Female Poverty
In terms of single female poverty, the demographic groups most similar to Kiowa are Chippewa (26.8%, a difference of 0.41%), Seminole (26.8%, a difference of 0.52%), Choctaw (27.2%, a difference of 0.98%), Yup'ik (26.6%, a difference of 1.3%), and Creek (27.4%, a difference of 1.9%).
| Demographics | Rating | Rank | Single Female Poverty |
| Ottawa | 0.0 /100 | #317 | Tragic 26.0% |
| Chickasaw | 0.0 /100 | #318 | Tragic 26.3% |
| Blacks/African Americans | 0.0 /100 | #319 | Tragic 26.4% |
| Arapaho | 0.0 /100 | #320 | Tragic 26.4% |
| Yup'ik | 0.0 /100 | #321 | Tragic 26.6% |
| Seminole | 0.0 /100 | #322 | Tragic 26.8% |
| Chippewa | 0.0 /100 | #323 | Tragic 26.8% |
| Kiowa | 0.0 /100 | #324 | Tragic 26.9% |
| Choctaw | 0.0 /100 | #325 | Tragic 27.2% |
| Creek | 0.0 /100 | #326 | Tragic 27.4% |
| Dutch West Indians | 0.0 /100 | #327 | Tragic 27.5% |
| Apache | 0.0 /100 | #328 | Tragic 27.7% |
| Menominee | 0.0 /100 | #329 | Tragic 27.8% |
| Hopi | 0.0 /100 | #330 | Tragic 28.0% |
| Natives/Alaskans | 0.0 /100 | #331 | Tragic 28.2% |
Demographics Similar to Hondurans by Single Female Poverty
In terms of single female poverty, the demographic groups most similar to Hondurans are Shoshone (25.1%, a difference of 0.090%), Blackfeet (25.1%, a difference of 0.18%), Mexican (25.0%, a difference of 0.25%), Somali (25.2%, a difference of 0.48%), and Immigrants from Congo (25.3%, a difference of 0.75%).
| Demographics | Rating | Rank | Single Female Poverty |
| French American Indians | 0.0 /100 | #294 | Tragic 24.6% |
| Hispanics or Latinos | 0.0 /100 | #295 | Tragic 24.6% |
| Africans | 0.0 /100 | #296 | Tragic 24.8% |
| Immigrants | Central America | 0.0 /100 | #297 | Tragic 24.8% |
| Yaqui | 0.0 /100 | #298 | Tragic 24.9% |
| Mexicans | 0.0 /100 | #299 | Tragic 25.0% |
| Blackfeet | 0.0 /100 | #300 | Tragic 25.1% |
| Hondurans | 0.0 /100 | #301 | Tragic 25.1% |
| Shoshone | 0.0 /100 | #302 | Tragic 25.1% |
| Somalis | 0.0 /100 | #303 | Tragic 25.2% |
| Immigrants | Congo | 0.0 /100 | #304 | Tragic 25.3% |
| Immigrants | Dominican Republic | 0.0 /100 | #305 | Tragic 25.3% |
| Immigrants | Mexico | 0.0 /100 | #306 | Tragic 25.3% |
| Potawatomi | 0.0 /100 | #307 | Tragic 25.4% |
| Aleuts | 0.0 /100 | #308 | Tragic 25.4% |