Kiowa vs Puerto Rican Single Female Poverty
COMPARE
Kiowa
Puerto Rican
Single Female Poverty
Single Female Poverty Comparison
Kiowa
Puerto Ricans
26.9%
SINGLE FEMALE POVERTY
0.0/ 100
METRIC RATING
324th/ 347
METRIC RANK
34.1%
SINGLE FEMALE POVERTY
0.0/ 100
METRIC RATING
346th/ 347
METRIC RANK
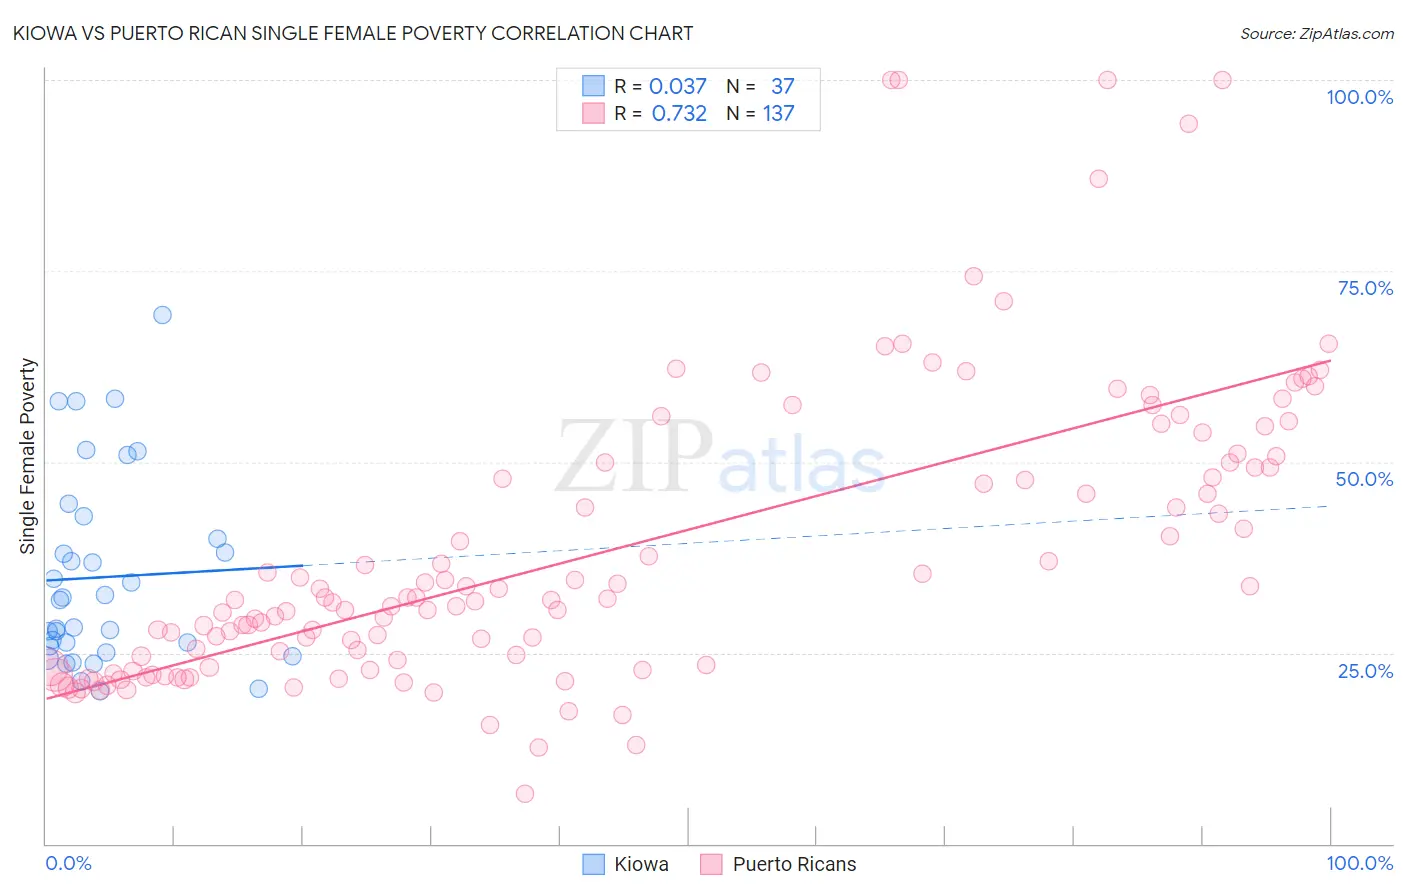
Kiowa vs Puerto Rican Single Female Poverty Correlation Chart
The statistical analysis conducted on geographies consisting of 55,984,677 people shows no correlation between the proportion of Kiowa and poverty level among single females in the United States with a correlation coefficient (R) of 0.037 and weighted average of 26.9%. Similarly, the statistical analysis conducted on geographies consisting of 515,297,886 people shows a strong positive correlation between the proportion of Puerto Ricans and poverty level among single females in the United States with a correlation coefficient (R) of 0.732 and weighted average of 34.1%, a difference of 26.6%.
Single Female Poverty Correlation Summary
| Measurement | Kiowa | Puerto Rican |
| Minimum | 20.0% | 6.5% |
| Maximum | 69.2% | 100.0% |
| Range | 49.2% | 93.5% |
| Mean | 34.9% | 38.4% |
| Median | 31.9% | 31.9% |
| Interquartile 25% (IQ1) | 25.4% | 23.2% |
| Interquartile 75% (IQ3) | 41.4% | 49.9% |
| Interquartile Range (IQR) | 16.0% | 26.7% |
| Standard Deviation (Sample) | 12.6% | 19.4% |
| Standard Deviation (Population) | 12.4% | 19.3% |
Similar Demographics by Single Female Poverty
Demographics Similar to Kiowa by Single Female Poverty
In terms of single female poverty, the demographic groups most similar to Kiowa are Chippewa (26.8%, a difference of 0.41%), Seminole (26.8%, a difference of 0.52%), Choctaw (27.2%, a difference of 0.98%), Yup'ik (26.6%, a difference of 1.3%), and Creek (27.4%, a difference of 1.9%).
| Demographics | Rating | Rank | Single Female Poverty |
| Ottawa | 0.0 /100 | #317 | Tragic 26.0% |
| Chickasaw | 0.0 /100 | #318 | Tragic 26.3% |
| Blacks/African Americans | 0.0 /100 | #319 | Tragic 26.4% |
| Arapaho | 0.0 /100 | #320 | Tragic 26.4% |
| Yup'ik | 0.0 /100 | #321 | Tragic 26.6% |
| Seminole | 0.0 /100 | #322 | Tragic 26.8% |
| Chippewa | 0.0 /100 | #323 | Tragic 26.8% |
| Kiowa | 0.0 /100 | #324 | Tragic 26.9% |
| Choctaw | 0.0 /100 | #325 | Tragic 27.2% |
| Creek | 0.0 /100 | #326 | Tragic 27.4% |
| Dutch West Indians | 0.0 /100 | #327 | Tragic 27.5% |
| Apache | 0.0 /100 | #328 | Tragic 27.7% |
| Menominee | 0.0 /100 | #329 | Tragic 27.8% |
| Hopi | 0.0 /100 | #330 | Tragic 28.0% |
| Natives/Alaskans | 0.0 /100 | #331 | Tragic 28.2% |
Demographics Similar to Puerto Ricans by Single Female Poverty
In terms of single female poverty, the demographic groups most similar to Puerto Ricans are Tohono O'odham (34.2%, a difference of 0.30%), Houma (33.8%, a difference of 0.92%), Lumbee (33.0%, a difference of 3.3%), Crow (32.4%, a difference of 5.2%), and Navajo (31.7%, a difference of 7.7%).
| Demographics | Rating | Rank | Single Female Poverty |
| Ute | 0.0 /100 | #333 | Tragic 28.4% |
| Pueblo | 0.0 /100 | #334 | Tragic 28.6% |
| Immigrants | Yemen | 0.0 /100 | #335 | Tragic 28.9% |
| Colville | 0.0 /100 | #336 | Tragic 29.1% |
| Yuman | 0.0 /100 | #337 | Tragic 29.4% |
| Pima | 0.0 /100 | #338 | Tragic 30.3% |
| Cheyenne | 0.0 /100 | #339 | Tragic 30.4% |
| Cajuns | 0.0 /100 | #340 | Tragic 30.6% |
| Sioux | 0.0 /100 | #341 | Tragic 31.3% |
| Navajo | 0.0 /100 | #342 | Tragic 31.7% |
| Crow | 0.0 /100 | #343 | Tragic 32.4% |
| Lumbee | 0.0 /100 | #344 | Tragic 33.0% |
| Houma | 0.0 /100 | #345 | Tragic 33.8% |
| Puerto Ricans | 0.0 /100 | #346 | Tragic 34.1% |
| Tohono O'odham | 0.0 /100 | #347 | Tragic 34.2% |