Kiowa vs Immigrants from Dominica Single Female Poverty
COMPARE
Kiowa
Immigrants from Dominica
Single Female Poverty
Single Female Poverty Comparison
Kiowa
Immigrants from Dominica
26.9%
SINGLE FEMALE POVERTY
0.0/ 100
METRIC RATING
324th/ 347
METRIC RANK
23.9%
SINGLE FEMALE POVERTY
0.0/ 100
METRIC RATING
284th/ 347
METRIC RANK
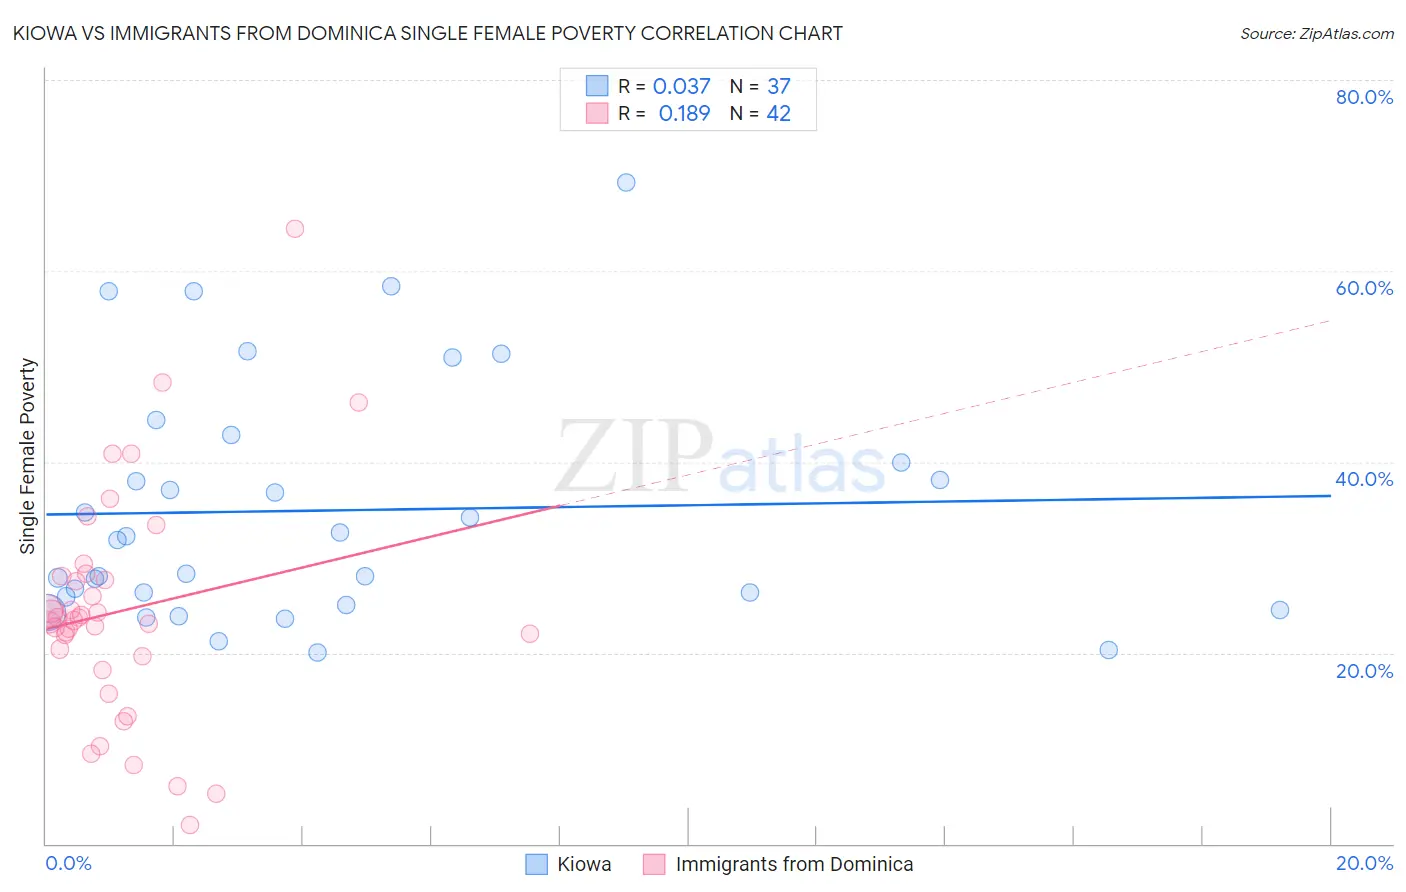
Kiowa vs Immigrants from Dominica Single Female Poverty Correlation Chart
The statistical analysis conducted on geographies consisting of 55,984,677 people shows no correlation between the proportion of Kiowa and poverty level among single females in the United States with a correlation coefficient (R) of 0.037 and weighted average of 26.9%. Similarly, the statistical analysis conducted on geographies consisting of 83,649,694 people shows a poor positive correlation between the proportion of Immigrants from Dominica and poverty level among single females in the United States with a correlation coefficient (R) of 0.189 and weighted average of 23.9%, a difference of 12.7%.
Single Female Poverty Correlation Summary
| Measurement | Kiowa | Immigrants from Dominica |
| Minimum | 20.0% | 2.0% |
| Maximum | 69.2% | 64.4% |
| Range | 49.2% | 62.4% |
| Mean | 34.9% | 24.4% |
| Median | 31.9% | 23.5% |
| Interquartile 25% (IQ1) | 25.4% | 19.7% |
| Interquartile 75% (IQ3) | 41.4% | 28.1% |
| Interquartile Range (IQR) | 16.0% | 8.4% |
| Standard Deviation (Sample) | 12.6% | 12.0% |
| Standard Deviation (Population) | 12.4% | 11.9% |
Similar Demographics by Single Female Poverty
Demographics Similar to Kiowa by Single Female Poverty
In terms of single female poverty, the demographic groups most similar to Kiowa are Chippewa (26.8%, a difference of 0.41%), Seminole (26.8%, a difference of 0.52%), Choctaw (27.2%, a difference of 0.98%), Yup'ik (26.6%, a difference of 1.3%), and Creek (27.4%, a difference of 1.9%).
| Demographics | Rating | Rank | Single Female Poverty |
| Ottawa | 0.0 /100 | #317 | Tragic 26.0% |
| Chickasaw | 0.0 /100 | #318 | Tragic 26.3% |
| Blacks/African Americans | 0.0 /100 | #319 | Tragic 26.4% |
| Arapaho | 0.0 /100 | #320 | Tragic 26.4% |
| Yup'ik | 0.0 /100 | #321 | Tragic 26.6% |
| Seminole | 0.0 /100 | #322 | Tragic 26.8% |
| Chippewa | 0.0 /100 | #323 | Tragic 26.8% |
| Kiowa | 0.0 /100 | #324 | Tragic 26.9% |
| Choctaw | 0.0 /100 | #325 | Tragic 27.2% |
| Creek | 0.0 /100 | #326 | Tragic 27.4% |
| Dutch West Indians | 0.0 /100 | #327 | Tragic 27.5% |
| Apache | 0.0 /100 | #328 | Tragic 27.7% |
| Menominee | 0.0 /100 | #329 | Tragic 27.8% |
| Hopi | 0.0 /100 | #330 | Tragic 28.0% |
| Natives/Alaskans | 0.0 /100 | #331 | Tragic 28.2% |
Demographics Similar to Immigrants from Dominica by Single Female Poverty
In terms of single female poverty, the demographic groups most similar to Immigrants from Dominica are German Russian (23.9%, a difference of 0.11%), Guatemalan (23.8%, a difference of 0.25%), Immigrants from Zaire (23.8%, a difference of 0.31%), Immigrants from Latin America (23.7%, a difference of 0.82%), and Immigrants from Guatemala (24.1%, a difference of 0.86%).
| Demographics | Rating | Rank | Single Female Poverty |
| Pennsylvania Germans | 0.0 /100 | #277 | Tragic 23.6% |
| Immigrants | Nonimmigrants | 0.0 /100 | #278 | Tragic 23.6% |
| Alaskan Athabascans | 0.0 /100 | #279 | Tragic 23.6% |
| Immigrants | Latin America | 0.0 /100 | #280 | Tragic 23.7% |
| Immigrants | Zaire | 0.0 /100 | #281 | Tragic 23.8% |
| Guatemalans | 0.0 /100 | #282 | Tragic 23.8% |
| German Russians | 0.0 /100 | #283 | Tragic 23.9% |
| Immigrants | Dominica | 0.0 /100 | #284 | Tragic 23.9% |
| Immigrants | Guatemala | 0.0 /100 | #285 | Tragic 24.1% |
| Cree | 0.0 /100 | #286 | Tragic 24.1% |
| Bangladeshis | 0.0 /100 | #287 | Tragic 24.2% |
| Spanish Americans | 0.0 /100 | #288 | Tragic 24.2% |
| U.S. Virgin Islanders | 0.0 /100 | #289 | Tragic 24.2% |
| Indonesians | 0.0 /100 | #290 | Tragic 24.3% |
| Osage | 0.0 /100 | #291 | Tragic 24.4% |