Zip Codes with the Highest Percentage of Population with a Degree in Visual and Performing Arts in Westerville, OH
RELATED REPORTS & OPTIONS
Visual and Performing Arts
Westerville
Compare Zip Codes
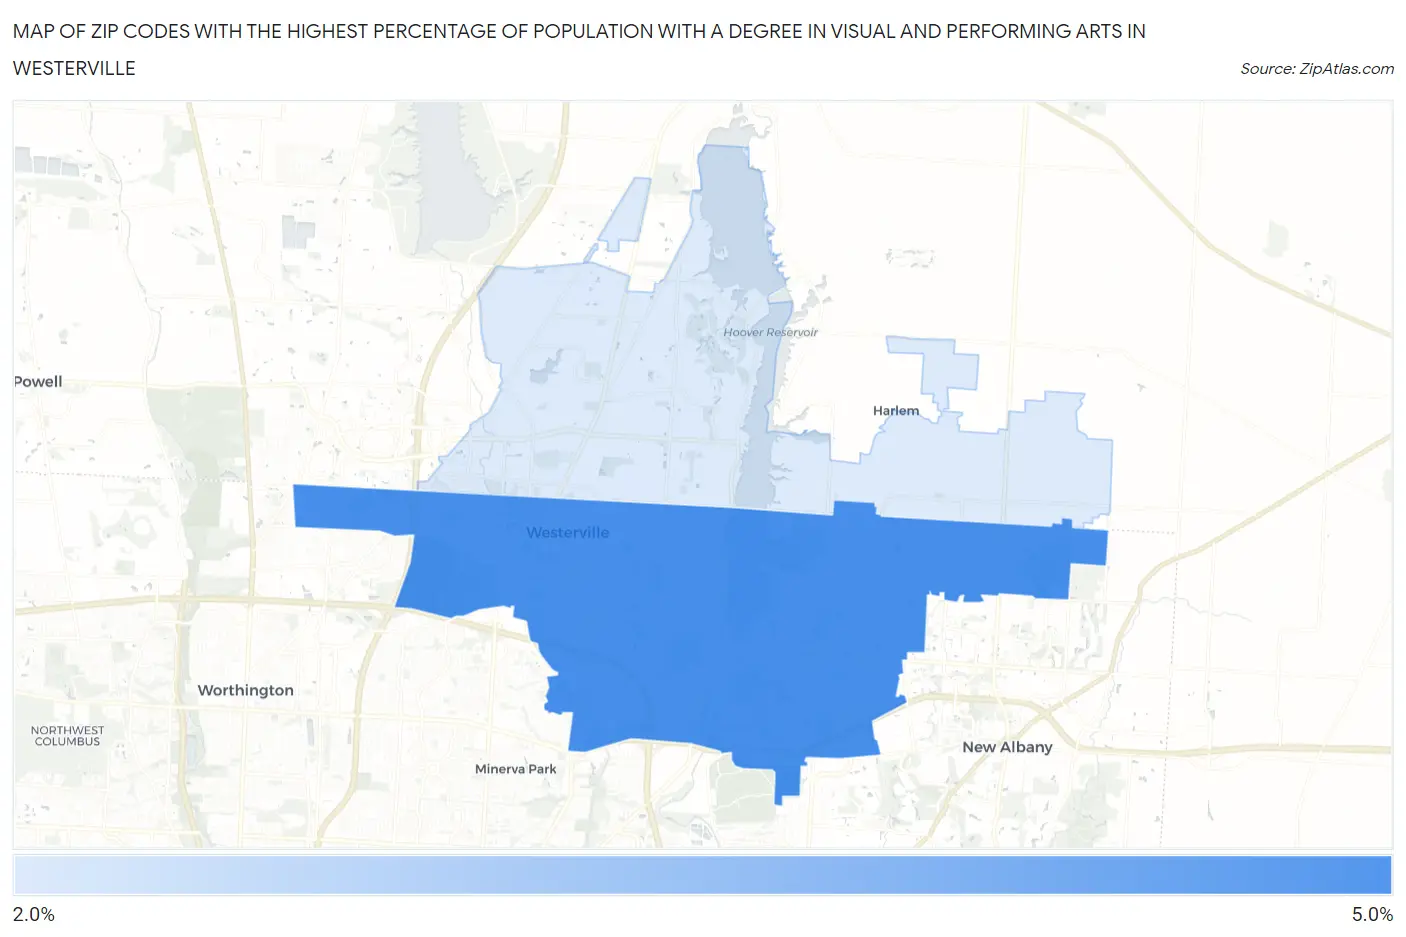
Map of Zip Codes with the Highest Percentage of Population with a Degree in Visual and Performing Arts in Westerville
2.5%
4.6%
Zip Codes with the Highest Percentage of Population with a Degree in Visual and Performing Arts in Westerville, OH
| Zip Code | % Graduates | vs State | vs National | |
| 1. | 43081 | 4.6% | 3.7%(+0.899)#268 | 4.3%(+0.358)#7,527 |
| 2. | 43082 | 2.5% | 3.7%(-1.24)#529 | 4.3%(-1.78)#14,728 |
1
Common Questions
What are the Top Zip Codes with the Highest Percentage of Population with a Degree in Visual and Performing Arts in Westerville, OH?
Top Zip Codes with the Highest Percentage of Population with a Degree in Visual and Performing Arts in Westerville, OH are:
What zip code has the Highest Percentage of Population with a Degree in Visual and Performing Arts in Westerville, OH?
43081 has the Highest Percentage of Population with a Degree in Visual and Performing Arts in Westerville, OH with 4.6%.
What is the Percentage of Population with a Degree in Visual and Performing Arts in Westerville, OH?
Percentage of Population with a Degree in Visual and Performing Arts in Westerville is 4.9%.
What is the Percentage of Population with a Degree in Visual and Performing Arts in Ohio?
Percentage of Population with a Degree in Visual and Performing Arts in Ohio is 3.7%.
What is the Percentage of Population with a Degree in Visual and Performing Arts in the United States?
Percentage of Population with a Degree in Visual and Performing Arts in the United States is 4.3%.