Zip Codes with the Highest Percentage of Population Employed in Life, Physical & Social Science in Westerville, OH
RELATED REPORTS & OPTIONS
Life, Physical & Social Science
Westerville
Compare Zip Codes
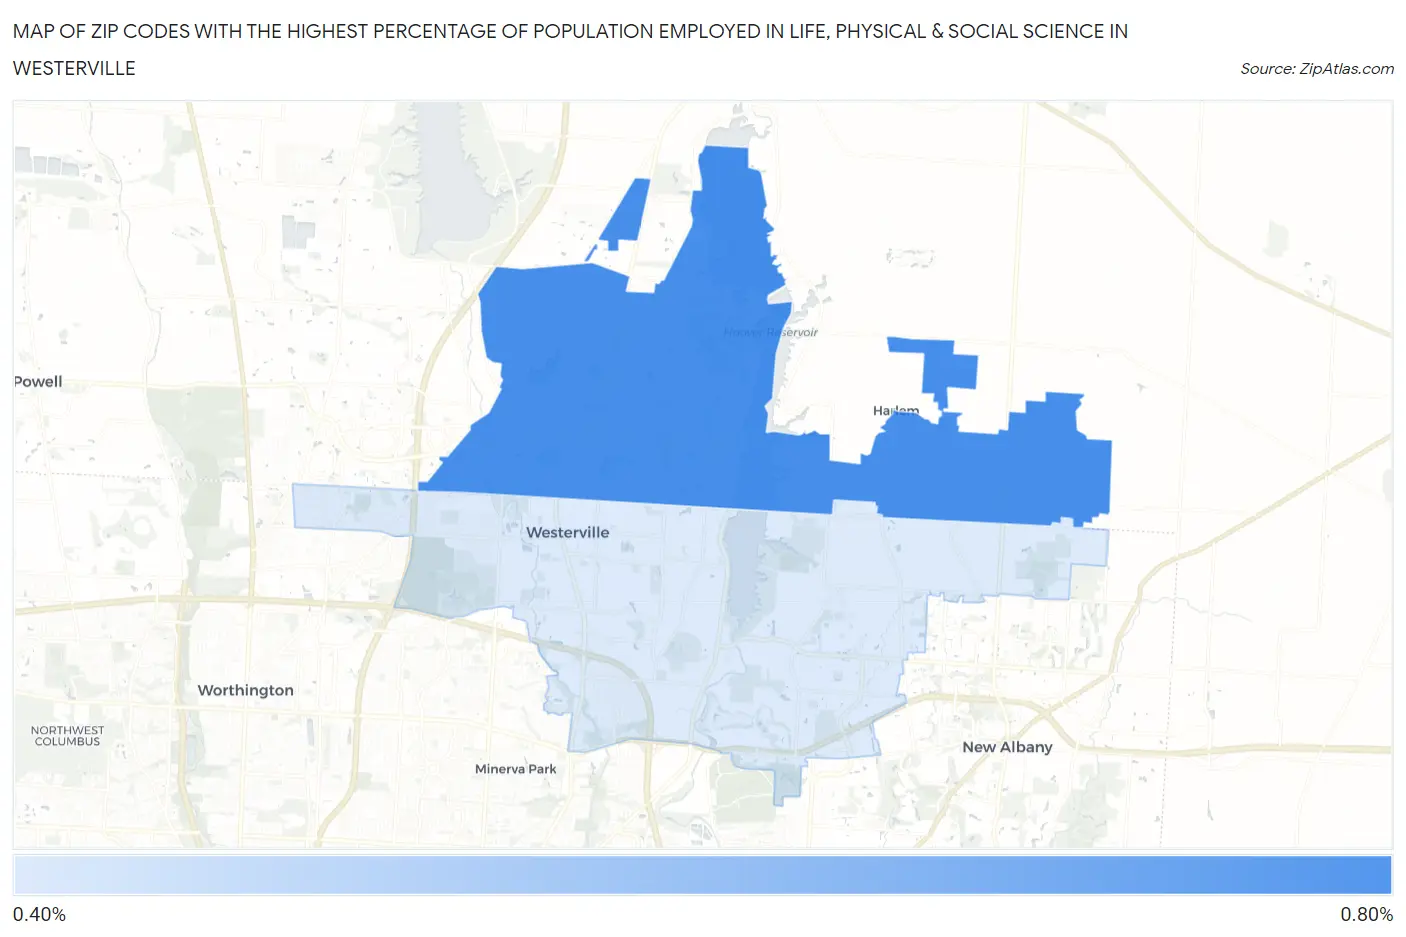
Map of Zip Codes with the Highest Percentage of Population Employed in Life, Physical & Social Science in Westerville
0.43%
0.66%
Zip Codes with the Highest Percentage of Population Employed in Life, Physical & Social Science in Westerville, OH
| Zip Code | % Employed | vs State | vs National | |
| 1. | 43082 | 0.66% | 0.90%(-0.234)#380 | 1.1%(-0.427)#12,489 |
| 2. | 43081 | 0.43% | 0.90%(-0.467)#498 | 1.1%(-0.660)#15,361 |
1
Common Questions
What are the Top Zip Codes with the Highest Percentage of Population Employed in Life, Physical & Social Science in Westerville, OH?
Top Zip Codes with the Highest Percentage of Population Employed in Life, Physical & Social Science in Westerville, OH are:
What zip code has the Highest Percentage of Population Employed in Life, Physical & Social Science in Westerville, OH?
43082 has the Highest Percentage of Population Employed in Life, Physical & Social Science in Westerville, OH with 0.66%.
What is the Percentage of Population Employed in Life, Physical & Social Science in Westerville, OH?
Percentage of Population Employed in Life, Physical & Social Science in Westerville is 0.77%.
What is the Percentage of Population Employed in Life, Physical & Social Science in Ohio?
Percentage of Population Employed in Life, Physical & Social Science in Ohio is 0.90%.
What is the Percentage of Population Employed in Life, Physical & Social Science in the United States?
Percentage of Population Employed in Life, Physical & Social Science in the United States is 1.1%.