Zip Codes with the Highest Percentage of Population Employed in Computer, Engineering & Science in Westerville, OH
RELATED REPORTS & OPTIONS
Computer, Engineering & Science
Westerville
Compare Zip Codes
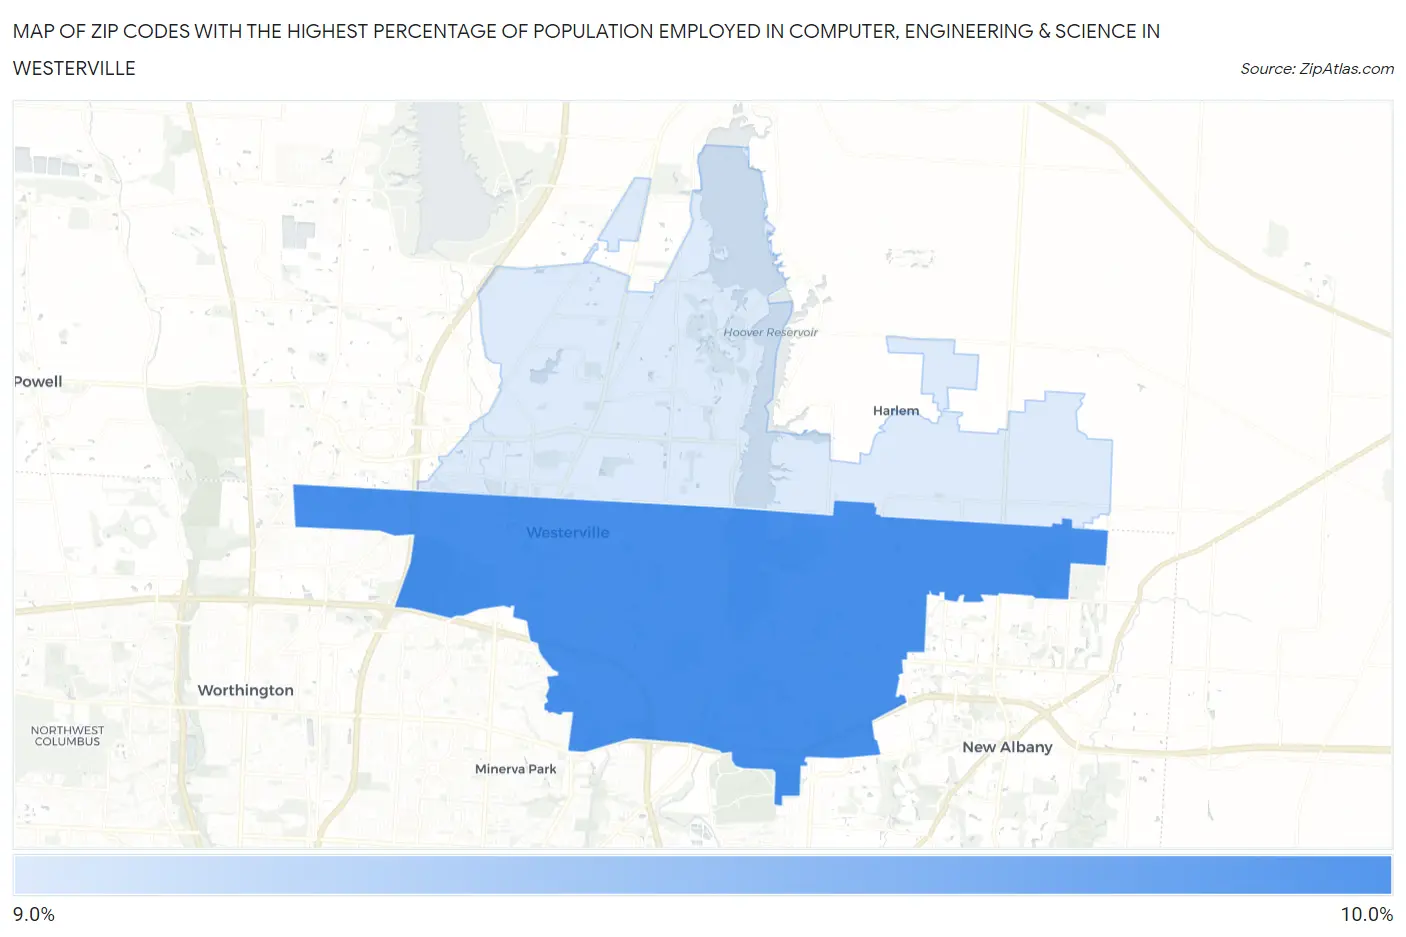
Map of Zip Codes with the Highest Percentage of Population Employed in Computer, Engineering & Science in Westerville
9.5%
9.6%
Zip Codes with the Highest Percentage of Population Employed in Computer, Engineering & Science in Westerville, OH
| Zip Code | % Employed | vs State | vs National | |
| 1. | 43081 | 9.6% | 6.1%(+3.50)#99 | 6.8%(+2.80)#3,551 |
| 2. | 43082 | 9.5% | 6.1%(+3.46)#102 | 6.8%(+2.76)#3,572 |
1
Common Questions
What are the Top Zip Codes with the Highest Percentage of Population Employed in Computer, Engineering & Science in Westerville, OH?
Top Zip Codes with the Highest Percentage of Population Employed in Computer, Engineering & Science in Westerville, OH are:
What zip code has the Highest Percentage of Population Employed in Computer, Engineering & Science in Westerville, OH?
43081 has the Highest Percentage of Population Employed in Computer, Engineering & Science in Westerville, OH with 9.6%.
What is the Percentage of Population Employed in Computer, Engineering & Science in Westerville, OH?
Percentage of Population Employed in Computer, Engineering & Science in Westerville is 9.3%.
What is the Percentage of Population Employed in Computer, Engineering & Science in Ohio?
Percentage of Population Employed in Computer, Engineering & Science in Ohio is 6.1%.
What is the Percentage of Population Employed in Computer, Engineering & Science in the United States?
Percentage of Population Employed in Computer, Engineering & Science in the United States is 6.8%.