Zip Codes with the Highest Percentage of Population Employed in Community & Social Service in Westerville, OH
RELATED REPORTS & OPTIONS
Community & Social Service
Westerville
Compare Zip Codes
Map of Zip Codes with the Highest Percentage of Population Employed in Community & Social Service in Westerville
12.2%
15.8%
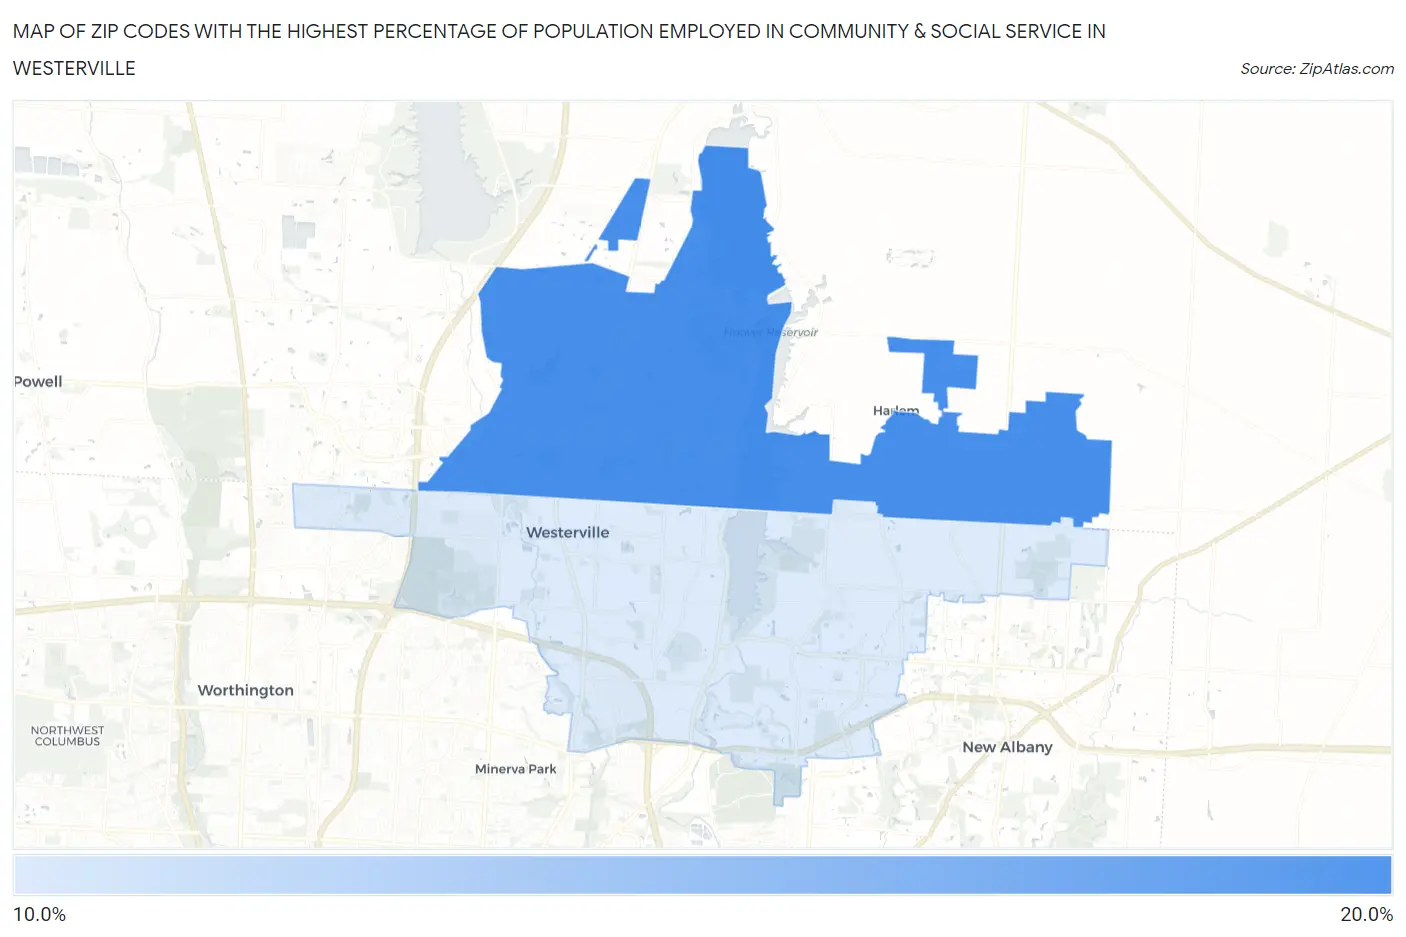
Zip Codes with the Highest Percentage of Population Employed in Community & Social Service in Westerville, OH
| Zip Code | % Employed | vs State | vs National | |
| 1. | 43082 | 15.8% | 10.0%(+5.83)#91 | 11.2%(+4.57)#4,262 |
| 2. | 43081 | 12.2% | 10.0%(+2.23)#214 | 11.2%(+0.967)#9,000 |
1
Common Questions
What are the Top Zip Codes with the Highest Percentage of Population Employed in Community & Social Service in Westerville, OH?
Top Zip Codes with the Highest Percentage of Population Employed in Community & Social Service in Westerville, OH are:
What zip code has the Highest Percentage of Population Employed in Community & Social Service in Westerville, OH?
43082 has the Highest Percentage of Population Employed in Community & Social Service in Westerville, OH with 15.8%.
What is the Percentage of Population Employed in Community & Social Service in Westerville, OH?
Percentage of Population Employed in Community & Social Service in Westerville is 16.9%.
What is the Percentage of Population Employed in Community & Social Service in Ohio?
Percentage of Population Employed in Community & Social Service in Ohio is 10.0%.
What is the Percentage of Population Employed in Community & Social Service in the United States?
Percentage of Population Employed in Community & Social Service in the United States is 11.2%.