De Baca County, NM Map & Demographics
De Baca County Map
De Baca County Overview
$27,710
PER CAPITA INCOME
$78,013
AVG FAMILY INCOME
$34,702
AVG HOUSEHOLD INCOME
18.3%
WAGE / INCOME GAP [ % ]
81.7¢/ $1
WAGE / INCOME GAP [ $ ]
0.45
INEQUALITY / GINI INDEX
1,695
TOTAL POPULATION
1,063
MALE POPULATION
632
FEMALE POPULATION
168.20
MALES / 100 FEMALES
59.45
FEMALES / 100 MALES
28.5
MEDIAN AGE
3.5
AVG FAMILY SIZE
2.3
AVG HOUSEHOLD SIZE
797
LABOR FORCE [ PEOPLE ]
60.9%
PERCENT IN LABOR FORCE
8.5%
UNEMPLOYMENT RATE
Income in De Baca County
Income Overview in De Baca County
Per Capita Income in De Baca County is $27,710, while median incomes of families and households are $78,013 and $34,702 respectively.
| Characteristic | Number | Measure |
| Per Capita Income | 1,695 | $27,710 |
| Median Family Income | 329 | $78,013 |
| Mean Family Income | 329 | $77,677 |
| Median Household Income | 741 | $34,702 |
| Mean Household Income | 741 | $55,224 |
| Income Deficit | 329 | $0 |
| Wage / Income Gap (%) | 1,695 | 18.30% |
| Wage / Income Gap ($) | 1,695 | 81.70¢ per $1 |
| Gini / Inequality Index | 1,695 | 0.45 |
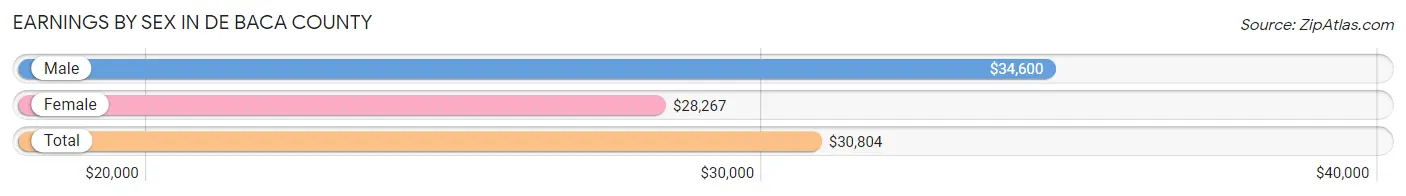
Earnings by Sex in De Baca County
Average Earnings in De Baca County are $30,804, $34,600 for men and $28,267 for women, a difference of 18.3%.
| Sex | Number | Average Earnings |
| Male | 640 (74.9%) | $34,600 |
| Female | 215 (25.2%) | $28,267 |
| Total | 855 (100.0%) | $30,804 |
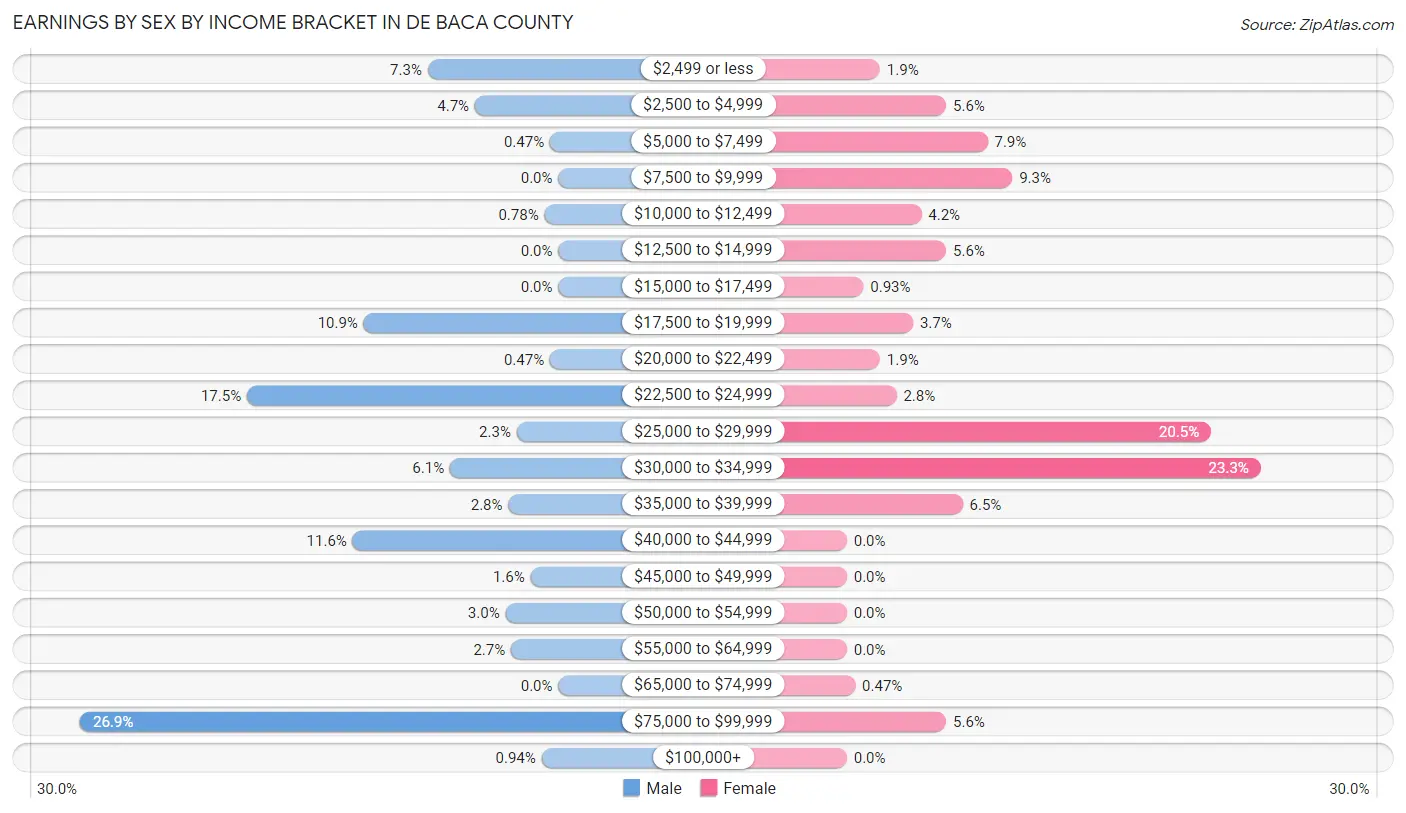
Earnings by Sex by Income Bracket in De Baca County
The most common earnings brackets in De Baca County are $75,000 to $99,999 for men (172 | 26.9%) and $30,000 to $34,999 for women (50 | 23.3%).
| Income | Male | Female |
| $2,499 or less | 47 (7.3%) | 4 (1.9%) |
| $2,500 to $4,999 | 30 (4.7%) | 12 (5.6%) |
| $5,000 to $7,499 | 3 (0.5%) | 17 (7.9%) |
| $7,500 to $9,999 | 0 (0.0%) | 20 (9.3%) |
| $10,000 to $12,499 | 5 (0.8%) | 9 (4.2%) |
| $12,500 to $14,999 | 0 (0.0%) | 12 (5.6%) |
| $15,000 to $17,499 | 0 (0.0%) | 2 (0.9%) |
| $17,500 to $19,999 | 70 (10.9%) | 8 (3.7%) |
| $20,000 to $22,499 | 3 (0.5%) | 4 (1.9%) |
| $22,500 to $24,999 | 112 (17.5%) | 6 (2.8%) |
| $25,000 to $29,999 | 15 (2.3%) | 44 (20.5%) |
| $30,000 to $34,999 | 39 (6.1%) | 50 (23.3%) |
| $35,000 to $39,999 | 18 (2.8%) | 14 (6.5%) |
| $40,000 to $44,999 | 74 (11.6%) | 0 (0.0%) |
| $45,000 to $49,999 | 10 (1.6%) | 0 (0.0%) |
| $50,000 to $54,999 | 19 (3.0%) | 0 (0.0%) |
| $55,000 to $64,999 | 17 (2.7%) | 0 (0.0%) |
| $65,000 to $74,999 | 0 (0.0%) | 1 (0.5%) |
| $75,000 to $99,999 | 172 (26.9%) | 12 (5.6%) |
| $100,000+ | 6 (0.9%) | 0 (0.0%) |
| Total | 640 (100.0%) | 215 (100.0%) |
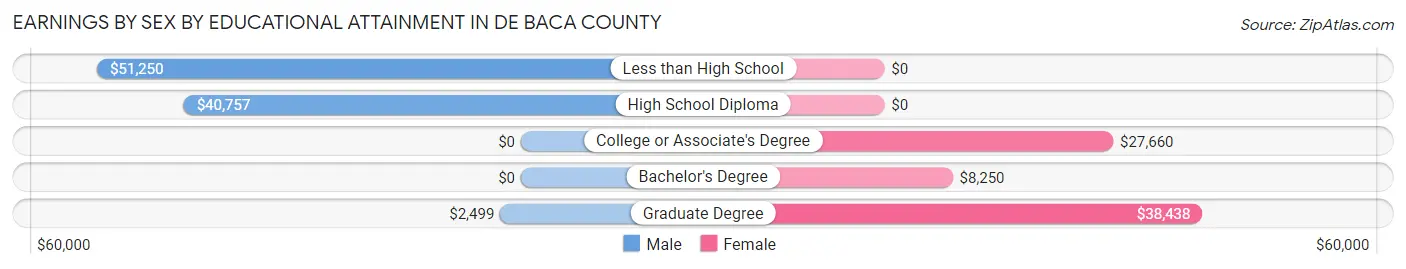
Earnings by Sex by Educational Attainment in De Baca County
Average earnings in De Baca County are $41,079 for men and $28,381 for women, a difference of 30.9%. Men with an educational attainment of less than high school enjoy the highest average annual earnings of $51,250, while those with graduate degree education earn the least with $2,499. Women with an educational attainment of graduate degree earn the most with the average annual earnings of $38,438, while those with bachelor's degree education have the smallest earnings of $8,250.
| Educational Attainment | Male Income | Female Income |
| Less than High School | $51,250 | $0 |
| High School Diploma | $40,757 | $0 |
| College or Associate's Degree | - | - |
| Bachelor's Degree | - | - |
| Graduate Degree | $2,499 | $38,438 |
| Total | $41,079 | $28,381 |
Family Income in De Baca County
Family Income Brackets in De Baca County
According to the De Baca County family income data, there are 154 families falling into the $75,000 to $99,999 income range, which is the most common income bracket and makes up 46.8% of all families.
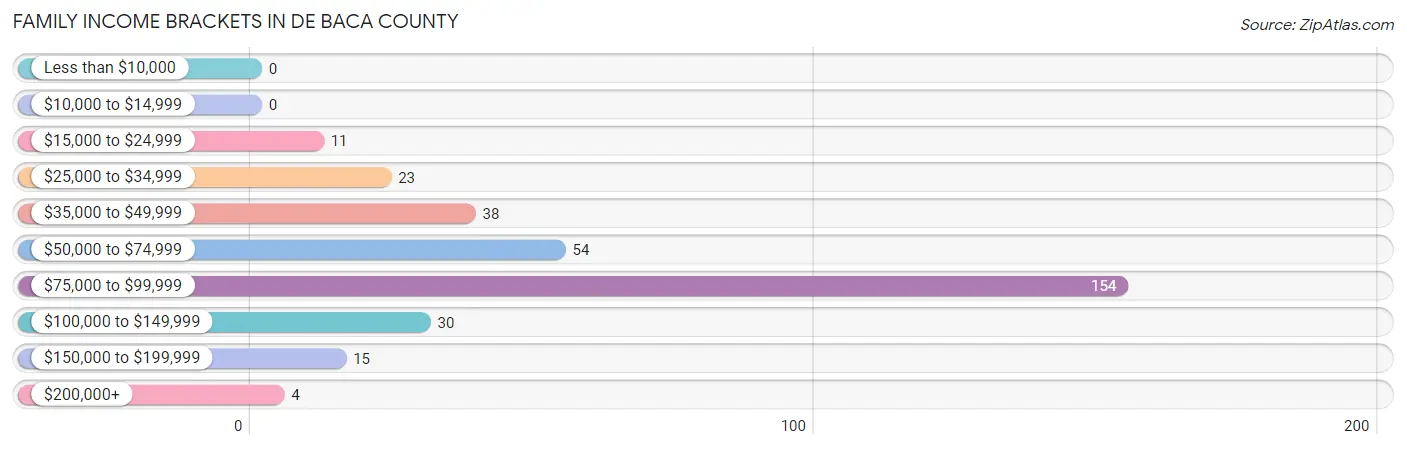
| Income Bracket | # Families | % Families |
| Less than $10,000 | 0 | 0.0% |
| $10,000 to $14,999 | 0 | 0.0% |
| $15,000 to $24,999 | 11 | 3.3% |
| $25,000 to $34,999 | 23 | 7.0% |
| $35,000 to $49,999 | 38 | 11.6% |
| $50,000 to $74,999 | 54 | 16.4% |
| $75,000 to $99,999 | 154 | 46.8% |
| $100,000 to $149,999 | 30 | 9.1% |
| $150,000 to $199,999 | 15 | 4.6% |
| $200,000+ | 4 | 1.2% |
Family Income by Famaliy Size in De Baca County
4-person families (171 | 52.0%) account for the highest median family income in De Baca County with $78,462 per family, while 2-person families (94 | 28.6%) have the highest median income of $35,250 per family member.
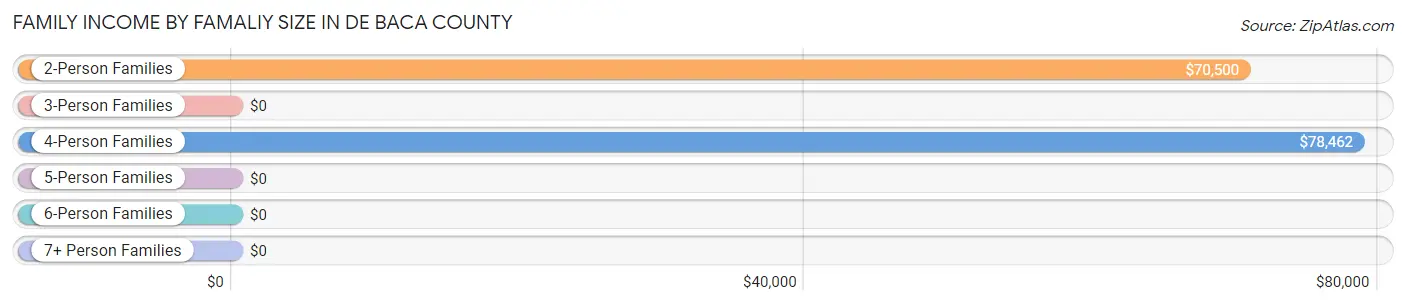
| Income Bracket | # Families | Median Income |
| 2-Person Families | 94 (28.6%) | $70,500 |
| 3-Person Families | 37 (11.3%) | $0 |
| 4-Person Families | 171 (52.0%) | $78,462 |
| 5-Person Families | 7 (2.1%) | $0 |
| 6-Person Families | 20 (6.1%) | $0 |
| 7+ Person Families | 0 (0.0%) | $0 |
| Total | 329 (100.0%) | $78,013 |
Family Income by Number of Earners in De Baca County
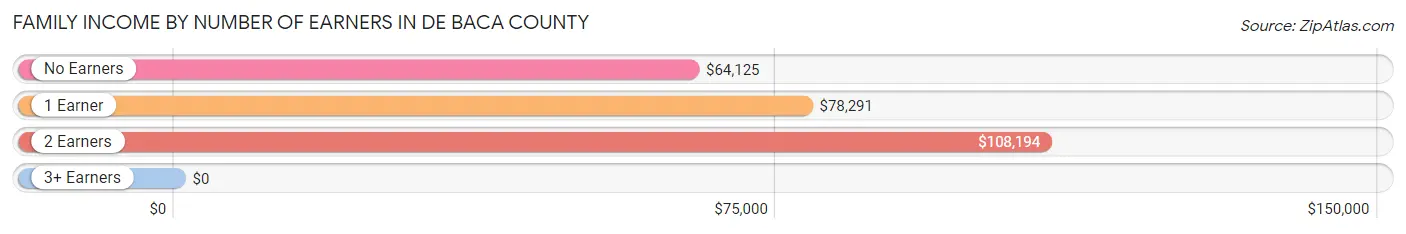
| Number of Earners | # Families | Median Income |
| No Earners | 47 (14.3%) | $64,125 |
| 1 Earner | 198 (60.2%) | $78,291 |
| 2 Earners | 65 (19.8%) | $108,194 |
| 3+ Earners | 19 (5.8%) | $0 |
| Total | 329 (100.0%) | $78,013 |
Household Income in De Baca County
Household Income Brackets in De Baca County
With 182 households falling in the category, the $100,000 to $149,999 income range is the most frequent in De Baca County, accounting for 24.6% of all households. In contrast, only 5 households (0.7%) fall into the $200,000+ income bracket, making it the least populous group.
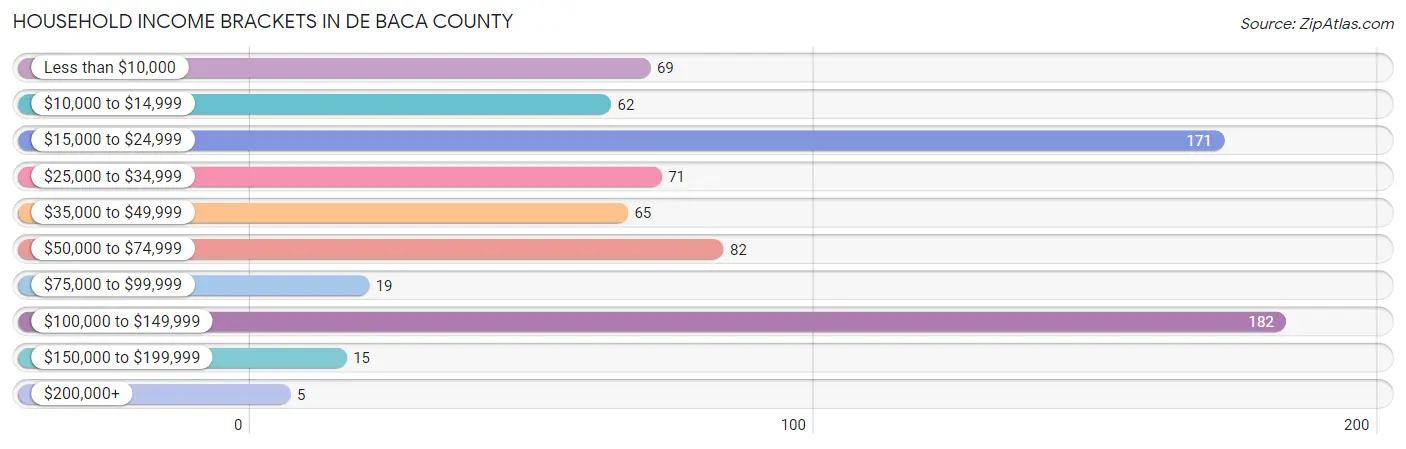
| Income Bracket | # Households | % Households |
| Less than $10,000 | 69 | 9.3% |
| $10,000 to $14,999 | 62 | 8.4% |
| $15,000 to $24,999 | 171 | 23.1% |
| $25,000 to $34,999 | 71 | 9.6% |
| $35,000 to $49,999 | 65 | 8.8% |
| $50,000 to $74,999 | 82 | 11.1% |
| $75,000 to $99,999 | 19 | 2.6% |
| $100,000 to $149,999 | 182 | 24.6% |
| $150,000 to $199,999 | 15 | 2.0% |
| $200,000+ | 5 | 0.7% |
Household Income by Householder Age in De Baca County
The median household income in De Baca County is $34,702, with the highest median household income of $33,250 found in the 65+ years age bracket for the primary householder. A total of 276 households (37.2%) fall into this category.
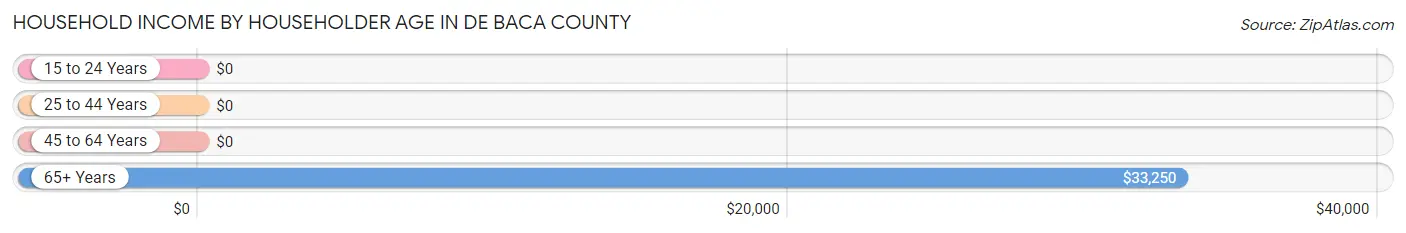
| Income Bracket | # Households | Median Income |
| 15 to 24 Years | 0 (0.0%) | $0 |
| 25 to 44 Years | 325 (43.9%) | $0 |
| 45 to 64 Years | 140 (18.9%) | $0 |
| 65+ Years | 276 (37.2%) | $33,250 |
| Total | 741 (100.0%) | $34,702 |
Poverty in De Baca County
Income Below Poverty by Sex and Age in De Baca County
With 12.0% poverty level for males and 23.4% for females among the residents of De Baca County, 35 to 44 year old males and 12 to 14 year old females are the most vulnerable to poverty, with 48 males (46.6%) and 10 females (83.3%) in their respective age groups living below the poverty level.
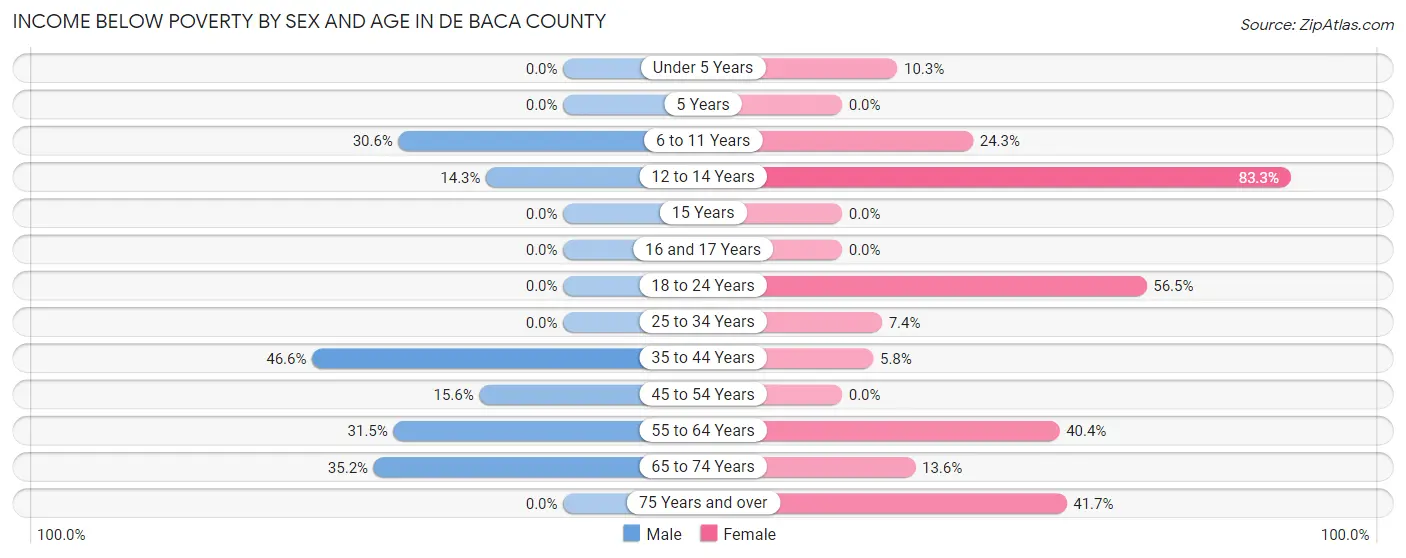
| Age Bracket | Male | Female |
| Under 5 Years | 0 (0.0%) | 8 (10.3%) |
| 5 Years | 0 (0.0%) | 0 (0.0%) |
| 6 to 11 Years | 11 (30.6%) | 18 (24.3%) |
| 12 to 14 Years | 5 (14.3%) | 10 (83.3%) |
| 15 Years | 0 (0.0%) | 0 (0.0%) |
| 16 and 17 Years | 0 (0.0%) | 0 (0.0%) |
| 18 to 24 Years | 0 (0.0%) | 26 (56.5%) |
| 25 to 34 Years | 0 (0.0%) | 4 (7.4%) |
| 35 to 44 Years | 48 (46.6%) | 4 (5.8%) |
| 45 to 54 Years | 7 (15.6%) | 0 (0.0%) |
| 55 to 64 Years | 23 (31.5%) | 23 (40.4%) |
| 65 to 74 Years | 32 (35.2%) | 14 (13.6%) |
| 75 Years and over | 0 (0.0%) | 40 (41.7%) |
| Total | 126 (12.0%) | 147 (23.4%) |
Income Above Poverty by Sex and Age in De Baca County
According to the poverty statistics in De Baca County, males aged under 5 years and females aged 15 years are the age groups that are most secure financially, with 100.0% of males and 100.0% of females in these age groups living above the poverty line.
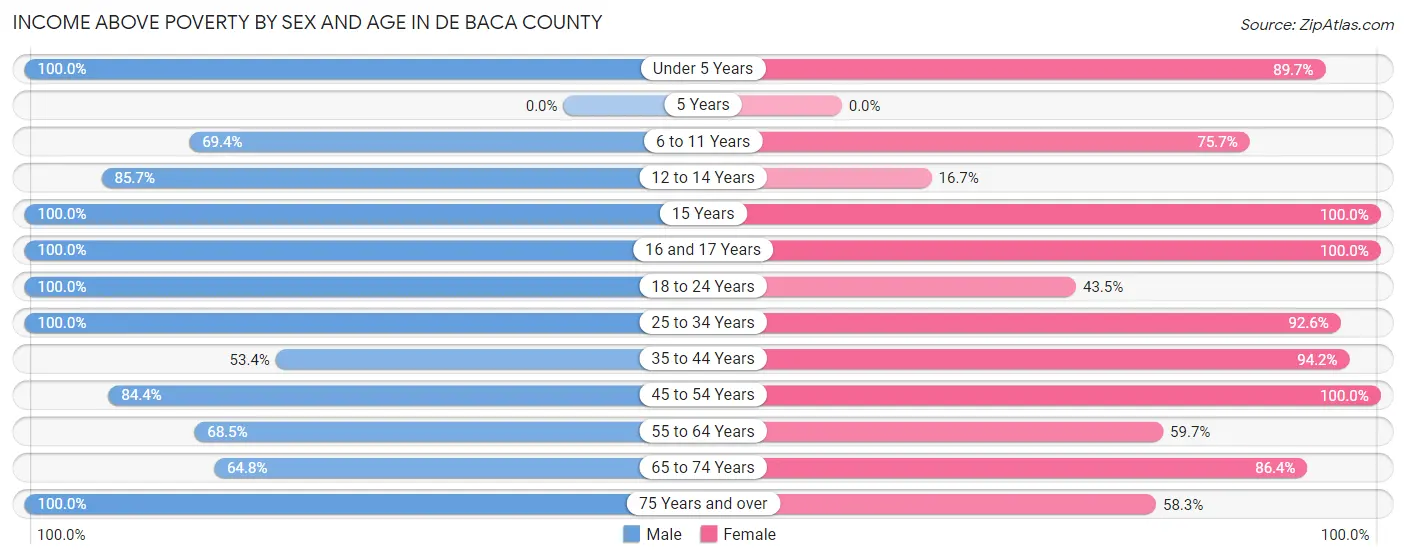
| Age Bracket | Male | Female |
| Under 5 Years | 142 (100.0%) | 70 (89.7%) |
| 5 Years | 0 (0.0%) | 0 (0.0%) |
| 6 to 11 Years | 25 (69.4%) | 56 (75.7%) |
| 12 to 14 Years | 30 (85.7%) | 2 (16.7%) |
| 15 Years | 2 (100.0%) | 7 (100.0%) |
| 16 and 17 Years | 41 (100.0%) | 4 (100.0%) |
| 18 to 24 Years | 77 (100.0%) | 20 (43.5%) |
| 25 to 34 Years | 337 (100.0%) | 50 (92.6%) |
| 35 to 44 Years | 55 (53.4%) | 65 (94.2%) |
| 45 to 54 Years | 38 (84.4%) | 29 (100.0%) |
| 55 to 64 Years | 50 (68.5%) | 34 (59.7%) |
| 65 to 74 Years | 59 (64.8%) | 89 (86.4%) |
| 75 Years and over | 68 (100.0%) | 56 (58.3%) |
| Total | 924 (88.0%) | 482 (76.6%) |
Income Below Poverty Among Married-Couple Families in De Baca County
The poverty statistics for married-couple families in De Baca County show that 3.7% or 6 of the total 164 families live below the poverty line. Families with 3 or 4 children have the highest poverty rate of 33.3%, comprising of 5 families. On the other hand, families with 1 or 2 children have the lowest poverty rate of 0.0%, which includes 0 families.
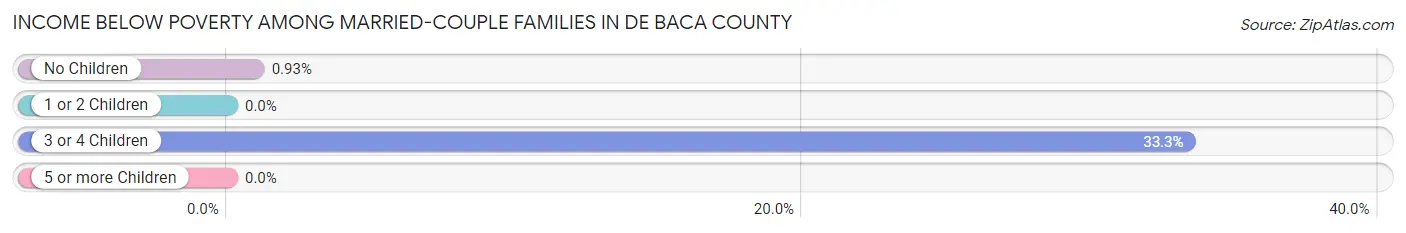
| Children | Above Poverty | Below Poverty |
| No Children | 106 (99.1%) | 1 (0.9%) |
| 1 or 2 Children | 42 (100.0%) | 0 (0.0%) |
| 3 or 4 Children | 10 (66.7%) | 5 (33.3%) |
| 5 or more Children | 0 (0.0%) | 0 (0.0%) |
| Total | 158 (96.3%) | 6 (3.7%) |
Income Below Poverty Among Single-Parent Households in De Baca County
According to the poverty data in De Baca County, 3.8% or 6 single-father households and 57.1% or 4 single-mother households are living below the poverty line. Among single-father households, those with 1 or 2 children have the highest poverty rate, with 6 households (100.0%) experiencing poverty. Likewise, among single-mother households, those with 1 or 2 children have the highest poverty rate, with 4 households (100.0%) falling below the poverty line.
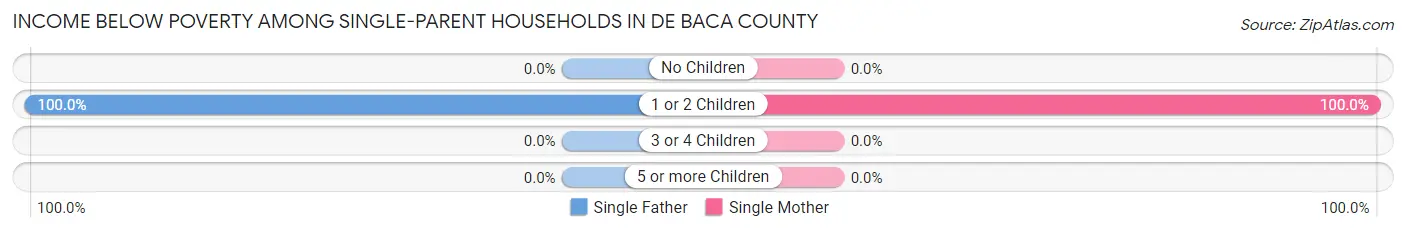
| Children | Single Father | Single Mother |
| No Children | 0 (0.0%) | 0 (0.0%) |
| 1 or 2 Children | 6 (100.0%) | 4 (100.0%) |
| 3 or 4 Children | 0 (0.0%) | 0 (0.0%) |
| 5 or more Children | 0 (0.0%) | 0 (0.0%) |
| Total | 6 (3.8%) | 4 (57.1%) |
Income Below Poverty Among Married-Couple vs Single-Parent Households in De Baca County
The poverty data for De Baca County shows that 6 of the married-couple family households (3.7%) and 10 of the single-parent households (6.1%) are living below the poverty level. Within the married-couple family households, those with 3 or 4 children have the highest poverty rate, with 5 households (33.3%) falling below the poverty line. Among the single-parent households, those with 1 or 2 children have the highest poverty rate, with 10 household (100.0%) living below poverty.
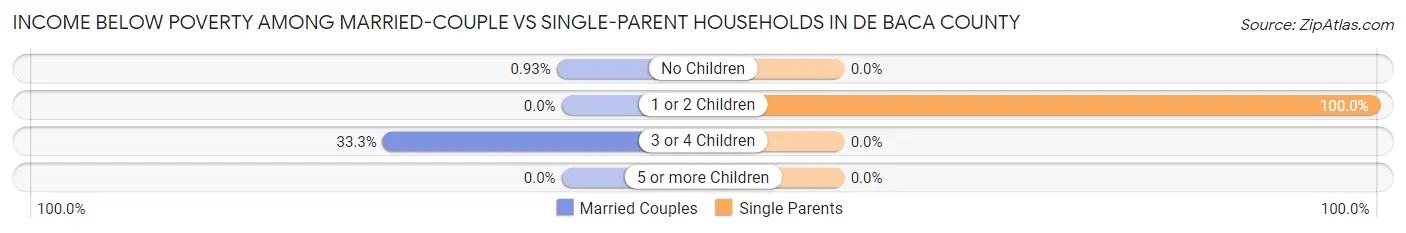
| Children | Married-Couple Families | Single-Parent Households |
| No Children | 1 (0.9%) | 0 (0.0%) |
| 1 or 2 Children | 0 (0.0%) | 10 (100.0%) |
| 3 or 4 Children | 5 (33.3%) | 0 (0.0%) |
| 5 or more Children | 0 (0.0%) | 0 (0.0%) |
| Total | 6 (3.7%) | 10 (6.1%) |
Race in De Baca County
The most populous races in De Baca County are Hispanic or Latino (1,076 | 63.5%), Some other Race (815 | 48.1%), and White / Caucasian (713 | 42.1%).
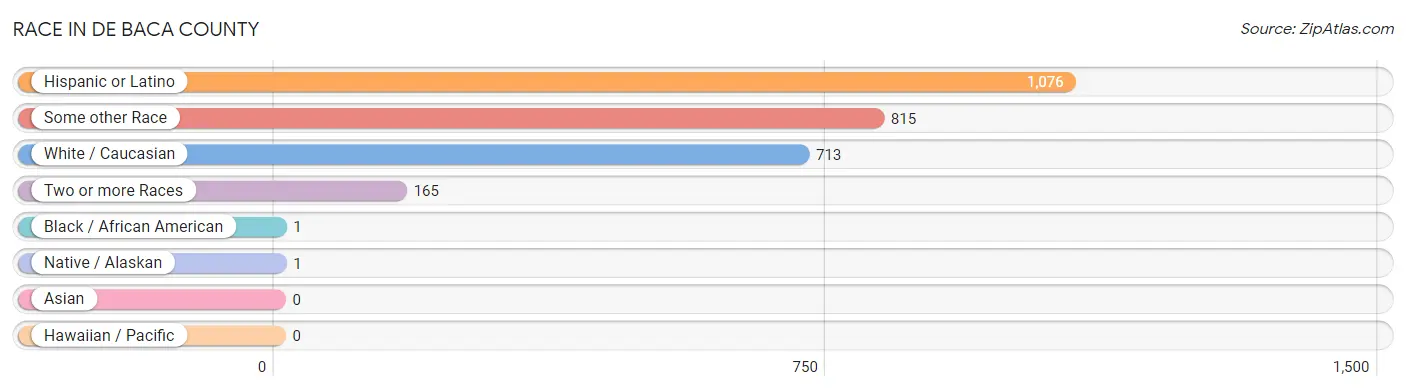
| Race | # Population | % Population |
| Asian | 0 | 0.0% |
| Black / African American | 1 | 0.1% |
| Hawaiian / Pacific | 0 | 0.0% |
| Hispanic or Latino | 1,076 | 63.5% |
| Native / Alaskan | 1 | 0.1% |
| White / Caucasian | 713 | 42.1% |
| Two or more Races | 165 | 9.7% |
| Some other Race | 815 | 48.1% |
| Total | 1,695 | 100.0% |
Ancestry in De Baca County
The most populous ancestries reported in De Baca County are Mexican (382 | 22.5%), Central American (235 | 13.9%), Salvadoran (235 | 13.9%), Irish (173 | 10.2%), and English (139 | 8.2%), together accounting for 68.7% of all De Baca County residents.
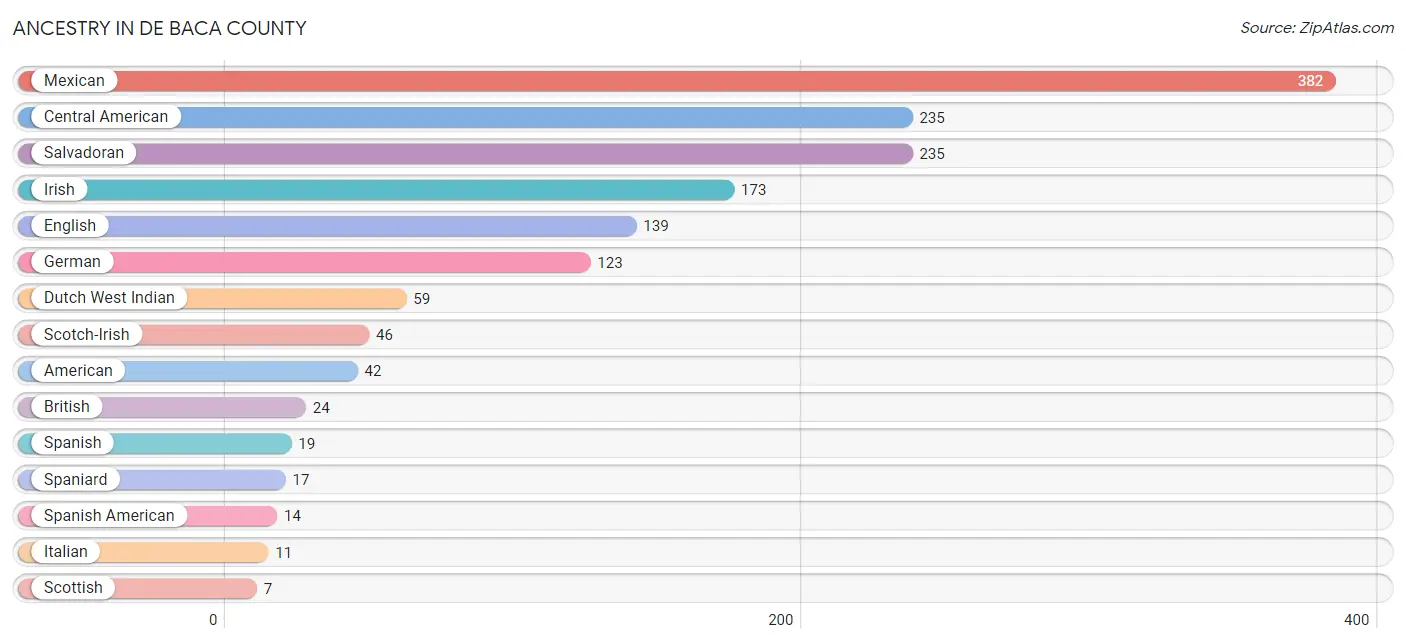
| Ancestry | # Population | % Population |
| American | 42 | 2.5% |
| Austrian | 1 | 0.1% |
| British | 24 | 1.4% |
| Central American | 235 | 13.9% |
| Cherokee | 1 | 0.1% |
| Dutch | 1 | 0.1% |
| Dutch West Indian | 59 | 3.5% |
| English | 139 | 8.2% |
| European | 2 | 0.1% |
| German | 123 | 7.3% |
| Irish | 173 | 10.2% |
| Italian | 11 | 0.6% |
| Mexican | 382 | 22.5% |
| Pueblo | 1 | 0.1% |
| Salvadoran | 235 | 13.9% |
| Scotch-Irish | 46 | 2.7% |
| Scottish | 7 | 0.4% |
| Spaniard | 17 | 1.0% |
| Spanish | 19 | 1.1% |
| Spanish American | 14 | 0.8% | View All 20 Rows |
Immigrants in De Baca County
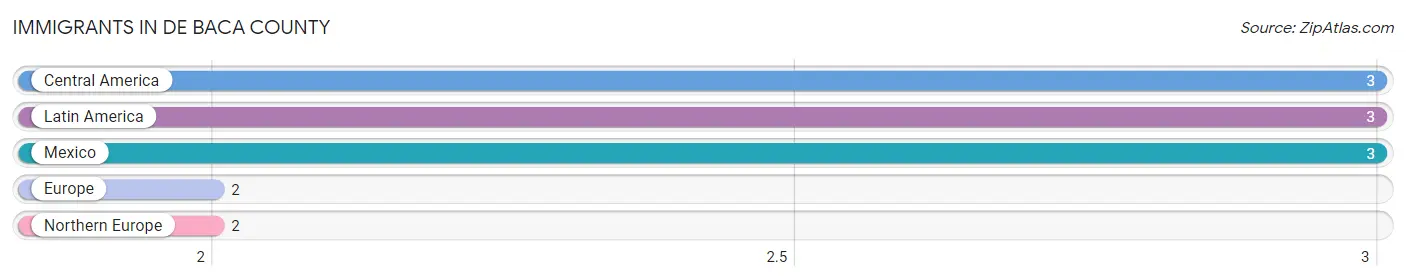
The most numerous immigrant groups reported in De Baca County came from Central America (3 | 0.2%), Latin America (3 | 0.2%), Mexico (3 | 0.2%), Europe (2 | 0.1%), and Northern Europe (2 | 0.1%), together accounting for 0.8% of all De Baca County residents.
| Immigration Origin | # Population | % Population |
| Central America | 3 | 0.2% |
| Europe | 2 | 0.1% |
| Latin America | 3 | 0.2% |
| Mexico | 3 | 0.2% |
| Northern Europe | 2 | 0.1% | View All 5 Rows |
Sex and Age in De Baca County
Sex and Age in De Baca County
The most populous age groups in De Baca County are 25 to 29 Years (322 | 30.3%) for men and Under 5 Years (78 | 12.3%) for women.
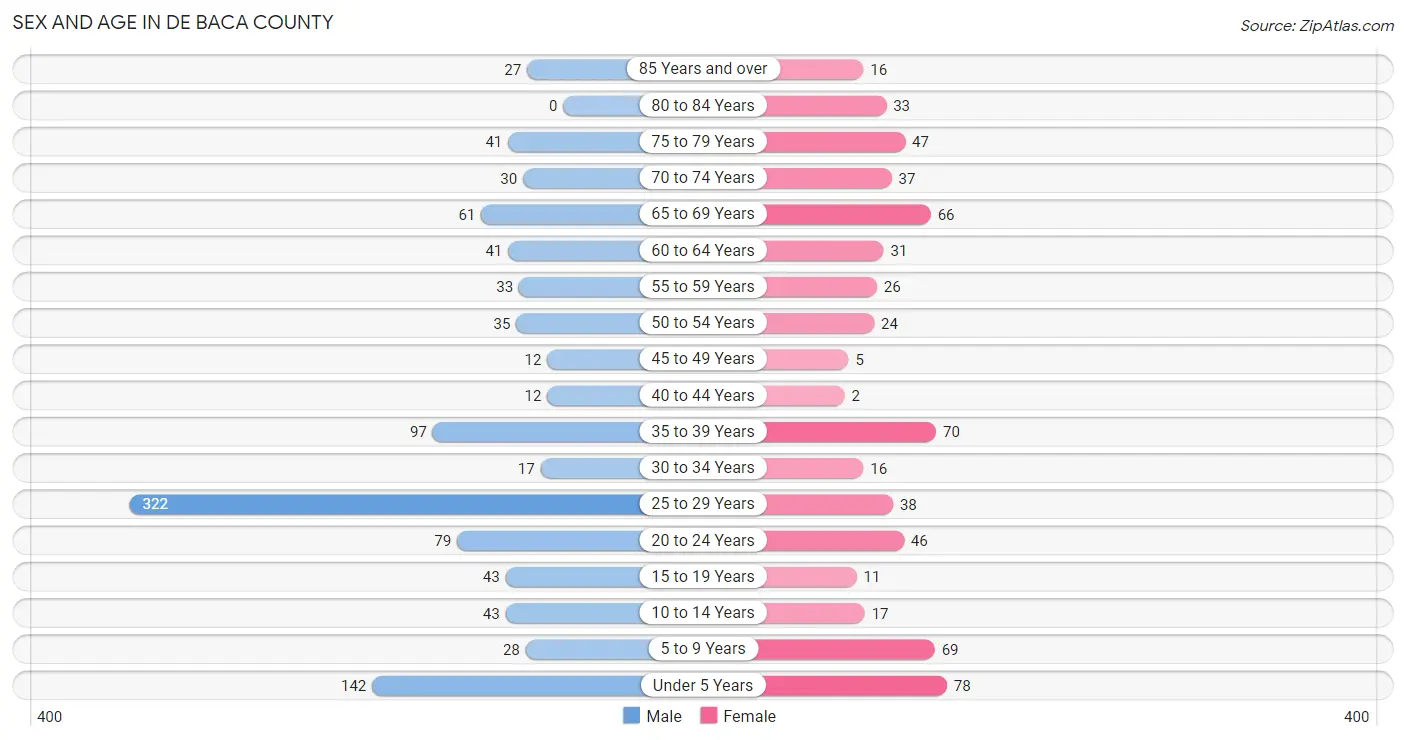
| Age Bracket | Male | Female |
| Under 5 Years | 142 (13.4%) | 78 (12.3%) |
| 5 to 9 Years | 28 (2.6%) | 69 (10.9%) |
| 10 to 14 Years | 43 (4.1%) | 17 (2.7%) |
| 15 to 19 Years | 43 (4.1%) | 11 (1.7%) |
| 20 to 24 Years | 79 (7.4%) | 46 (7.3%) |
| 25 to 29 Years | 322 (30.3%) | 38 (6.0%) |
| 30 to 34 Years | 17 (1.6%) | 16 (2.5%) |
| 35 to 39 Years | 97 (9.1%) | 70 (11.1%) |
| 40 to 44 Years | 12 (1.1%) | 2 (0.3%) |
| 45 to 49 Years | 12 (1.1%) | 5 (0.8%) |
| 50 to 54 Years | 35 (3.3%) | 24 (3.8%) |
| 55 to 59 Years | 33 (3.1%) | 26 (4.1%) |
| 60 to 64 Years | 41 (3.9%) | 31 (4.9%) |
| 65 to 69 Years | 61 (5.7%) | 66 (10.4%) |
| 70 to 74 Years | 30 (2.8%) | 37 (5.9%) |
| 75 to 79 Years | 41 (3.9%) | 47 (7.4%) |
| 80 to 84 Years | 0 (0.0%) | 33 (5.2%) |
| 85 Years and over | 27 (2.5%) | 16 (2.5%) |
| Total | 1,063 (100.0%) | 632 (100.0%) |
Families and Households in De Baca County
Median Family Size in De Baca County
The median family size in De Baca County is 3.51 persons per family, with single female/mother families (7 | 2.1%) accounting for the largest median family size of 4.86 persons per family. On the other hand, single male/father families (158 | 48.0%) represent the smallest median family size with 2.34 persons per family.
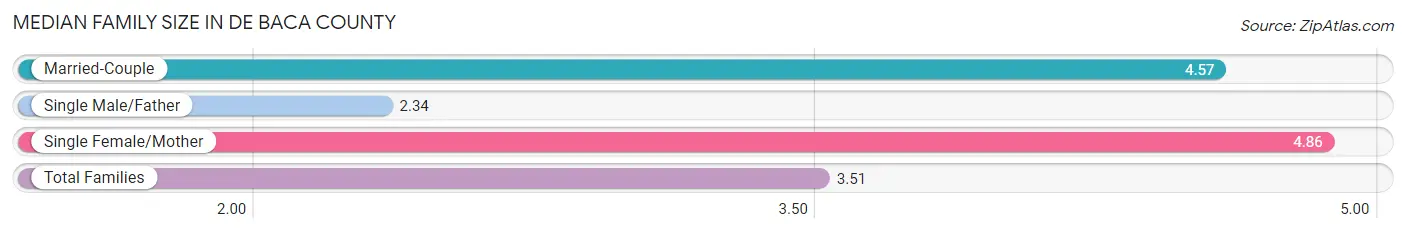
| Family Type | # Families | Family Size |
| Married-Couple | 164 (49.8%) | 4.57 |
| Single Male/Father | 158 (48.0%) | 2.34 |
| Single Female/Mother | 7 (2.1%) | 4.86 |
| Total Families | 329 (100.0%) | 3.51 |
Median Household Size in De Baca County
The median household size in De Baca County is 2.27 persons per household, with single female/mother households (7 | 0.9%) accounting for the largest median household size of 4.86 persons per household. non-family households (412 | 55.6%) represent the smallest median household size with 1.12 persons per household.
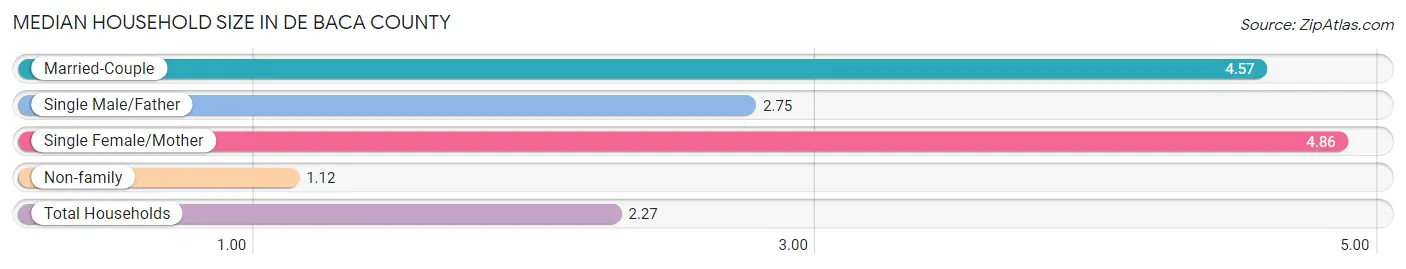
| Household Type | # Households | Household Size |
| Married-Couple | 164 (22.1%) | 4.57 |
| Single Male/Father | 158 (21.3%) | 2.75 |
| Single Female/Mother | 7 (0.9%) | 4.86 |
| Non-family | 412 (55.6%) | 1.12 |
| Total Households | 741 (100.0%) | 2.27 |
Household Size by Marriage Status in De Baca County
Out of a total of 741 households in De Baca County, 329 (44.4%) are family households, while 412 (55.6%) are nonfamily households. The most numerous type of family households are 5-person households, comprising 159, and the most common type of nonfamily households are 1-person households, comprising 397.
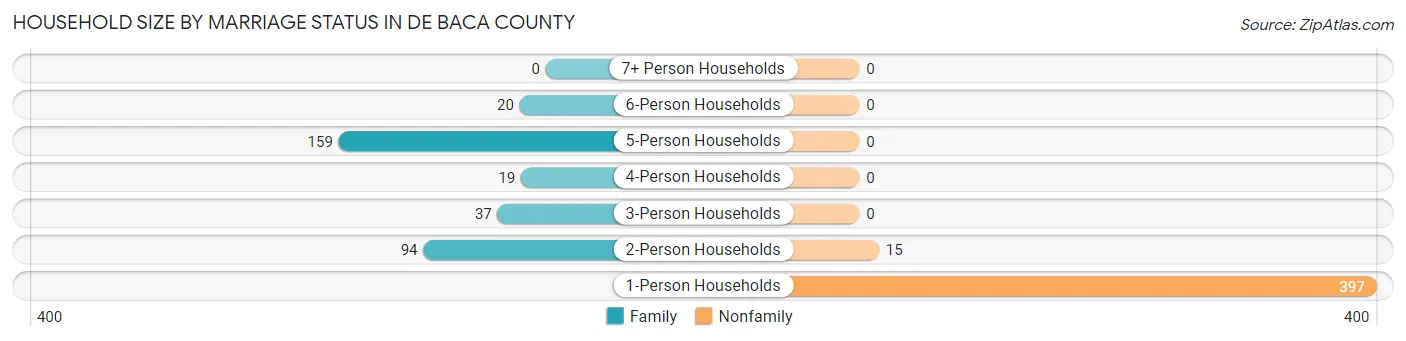
| Household Size | Family Households | Nonfamily Households |
| 1-Person Households | - | 397 (53.6%) |
| 2-Person Households | 94 (12.7%) | 15 (2.0%) |
| 3-Person Households | 37 (5.0%) | 0 (0.0%) |
| 4-Person Households | 19 (2.6%) | 0 (0.0%) |
| 5-Person Households | 159 (21.5%) | 0 (0.0%) |
| 6-Person Households | 20 (2.7%) | 0 (0.0%) |
| 7+ Person Households | 0 (0.0%) | 0 (0.0%) |
| Total | 329 (44.4%) | 412 (55.6%) |
Female Fertility in De Baca County
Fertility by Age in De Baca County
Average fertility rate in De Baca County is 387.0 births per 1,000 women. Women in the age bracket of 20 to 34 years have the highest fertility rate with 740.0 births per 1,000 women. Women in the age bracket of 20 to 34 years acount for 100.0% of all women with births.
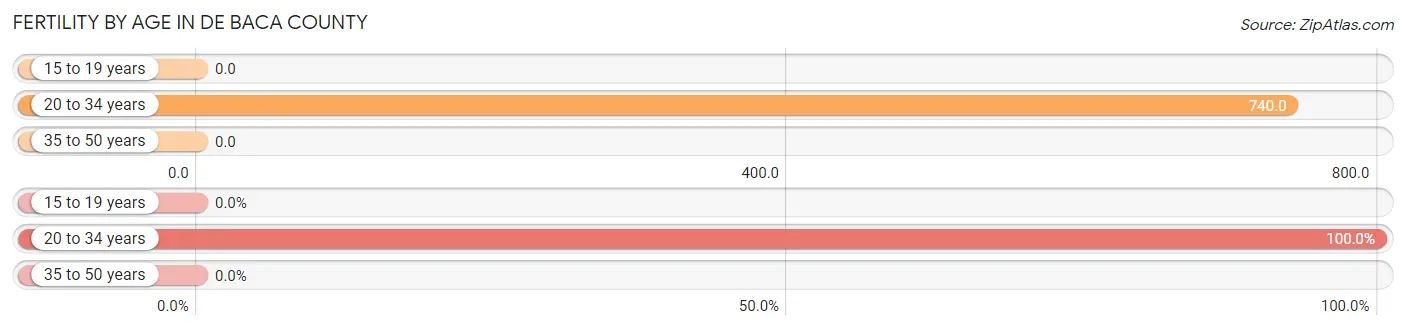
| Age Bracket | Women with Births | Births / 1,000 Women |
| 15 to 19 years | 0 (0.0%) | 0.0 |
| 20 to 34 years | 74 (100.0%) | 740.0 |
| 35 to 50 years | 0 (0.0%) | 0.0 |
| Total | 74 (100.0%) | 387.0 |
Fertility by Age by Marriage Status in De Baca County
13.5% of women with births (74) in De Baca County are married. The highest percentage of unmarried women with births falls into 20 to 34 years age bracket with 86.5% of them unmarried at the time of birth, while the lowest percentage of unmarried women with births belong to 20 to 34 years age bracket with 86.5% of them unmarried.
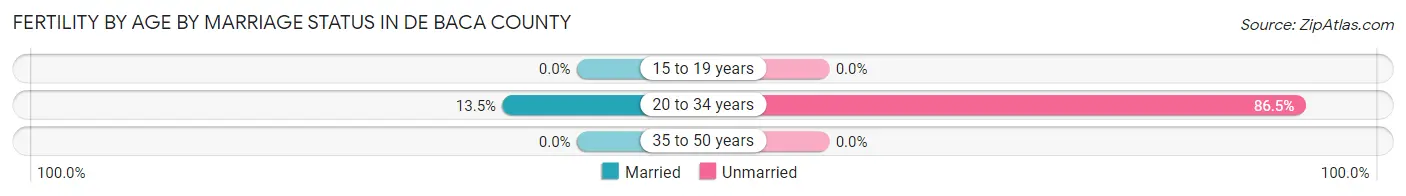
| Age Bracket | Married | Unmarried |
| 15 to 19 years | 0 (0.0%) | 0 (0.0%) |
| 20 to 34 years | 10 (13.5%) | 64 (86.5%) |
| 35 to 50 years | 0 (0.0%) | 0 (0.0%) |
| Total | 10 (13.5%) | 64 (86.5%) |
Fertility by Education in De Baca County
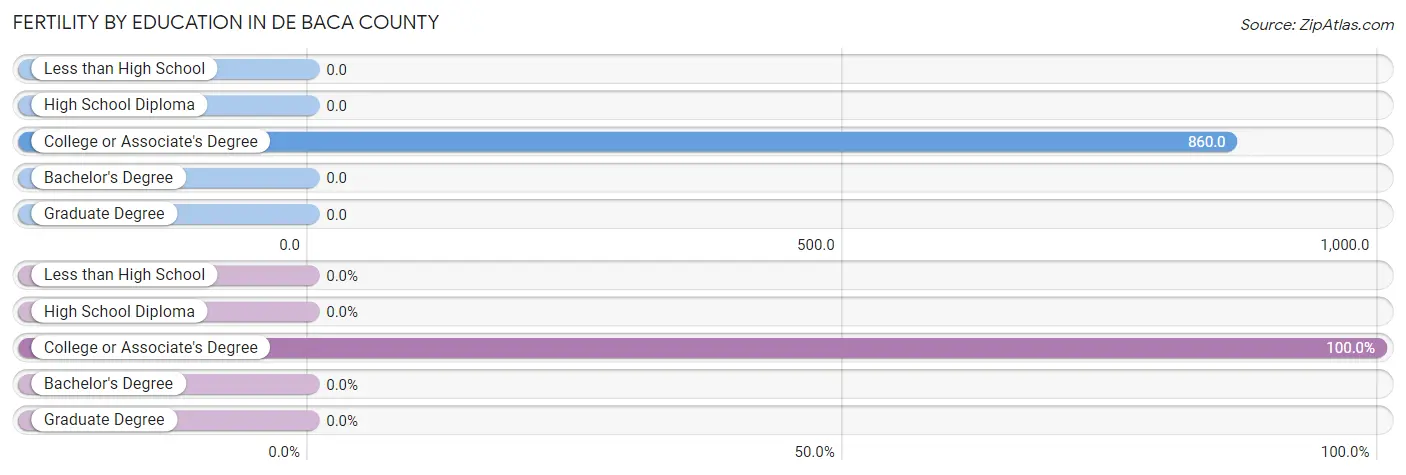
| Educational Attainment | Women with Births | Births / 1,000 Women |
| Less than High School | 0 (0.0%) | 0.0 |
| High School Diploma | 0 (0.0%) | 0.0 |
| College or Associate's Degree | 74 (100.0%) | 860.0 |
| Bachelor's Degree | 0 (0.0%) | 0.0 |
| Graduate Degree | 0 (0.0%) | 0.0 |
| Total | 74 (100.0%) | 387.0 |
Fertility by Education by Marriage Status in De Baca County
86.5% of women with births in De Baca County are unmarried. Women with the educational attainment of college or associate's degree are most likely to be married with 13.5% of them married at childbirth, while women with the educational attainment of college or associate's degree are least likely to be married with 86.5% of them unmarried at childbirth.
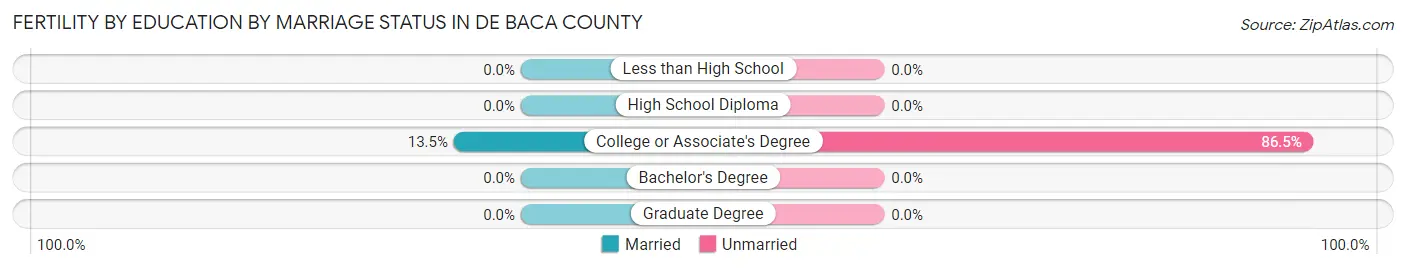
| Educational Attainment | Married | Unmarried |
| Less than High School | 0 (0.0%) | 0 (0.0%) |
| High School Diploma | 0 (0.0%) | 0 (0.0%) |
| College or Associate's Degree | 10 (13.5%) | 64 (86.5%) |
| Bachelor's Degree | 0 (0.0%) | 0 (0.0%) |
| Graduate Degree | 0 (0.0%) | 0 (0.0%) |
| Total | 10 (13.5%) | 64 (86.5%) |
Employment Characteristics in De Baca County
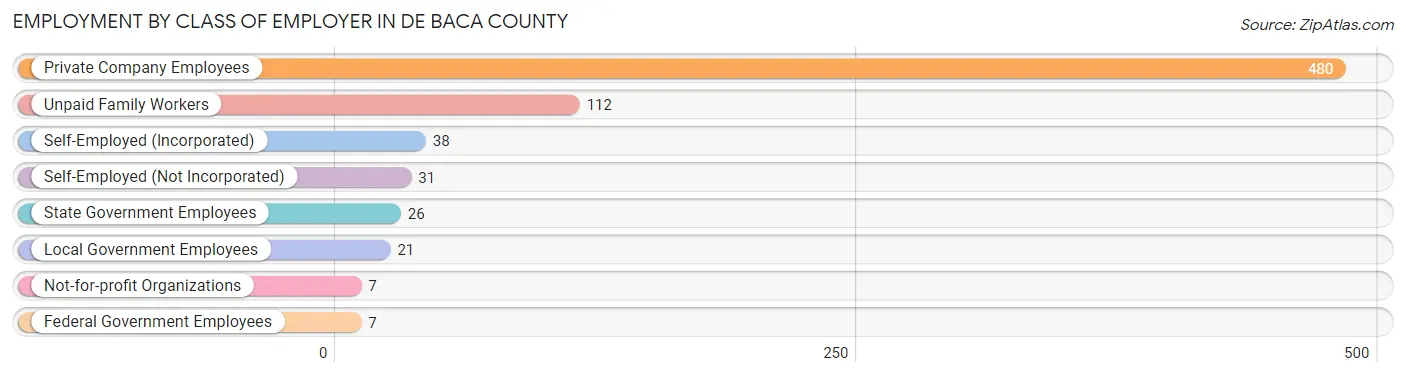
Employment by Class of Employer in De Baca County
Among the 722 employed individuals in De Baca County, private company employees (480 | 66.5%), unpaid family workers (112 | 15.5%), and self-employed (incorporated) (38 | 5.3%) make up the most common classes of employment.
| Employer Class | # Employees | % Employees |
| Private Company Employees | 480 | 66.5% |
| Self-Employed (Incorporated) | 38 | 5.3% |
| Self-Employed (Not Incorporated) | 31 | 4.3% |
| Not-for-profit Organizations | 7 | 1.0% |
| Local Government Employees | 21 | 2.9% |
| State Government Employees | 26 | 3.6% |
| Federal Government Employees | 7 | 1.0% |
| Unpaid Family Workers | 112 | 15.5% |
| Total | 722 | 100.0% |
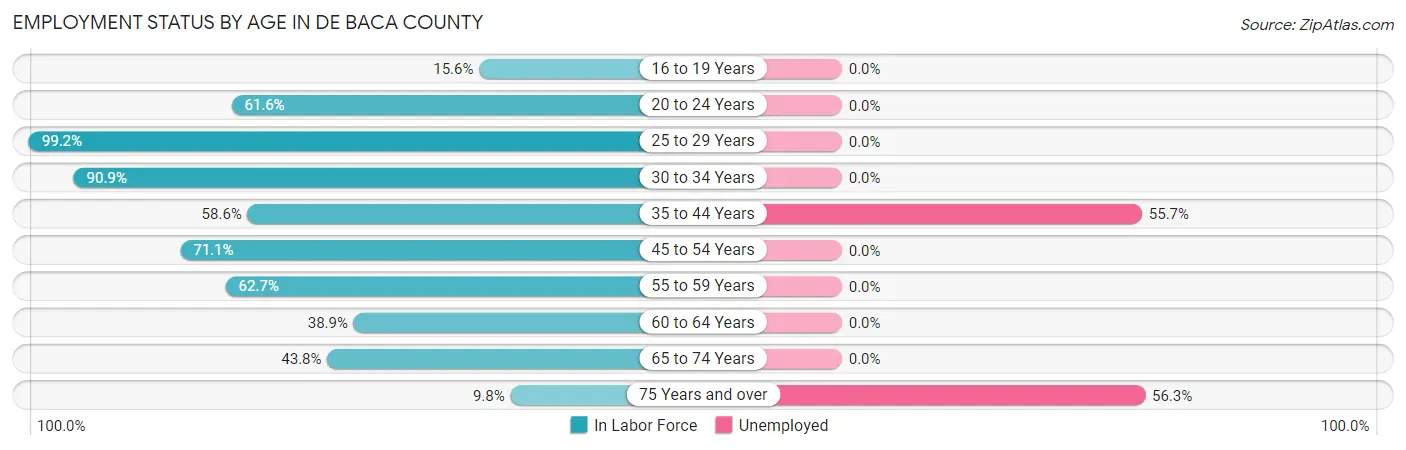
Employment Status by Age in De Baca County
According to the labor force statistics for De Baca County, out of the total population over 16 years of age (1,309), 60.9% or 797 individuals are in the labor force, with 8.5% or 68 of them unemployed. The age group with the highest labor force participation rate is 25 to 29 years, with 99.2% or 357 individuals in the labor force. Within the labor force, the 75 years and over age range has the highest percentage of unemployed individuals, with 56.3% or 9 of them being unemployed.
| Age Bracket | In Labor Force | Unemployed |
| 16 to 19 Years | 7 (15.6%) | 0 (0.0%) |
| 20 to 24 Years | 77 (61.6%) | 0 (0.0%) |
| 25 to 29 Years | 357 (99.2%) | 0 (0.0%) |
| 30 to 34 Years | 30 (90.9%) | 0 (0.0%) |
| 35 to 44 Years | 106 (58.6%) | 59 (55.7%) |
| 45 to 54 Years | 54 (71.1%) | 0 (0.0%) |
| 55 to 59 Years | 37 (62.7%) | 0 (0.0%) |
| 60 to 64 Years | 28 (38.9%) | 0 (0.0%) |
| 65 to 74 Years | 85 (43.8%) | 0 (0.0%) |
| 75 Years and over | 16 (9.8%) | 9 (56.3%) |
| Total | 797 (60.9%) | 68 (8.5%) |
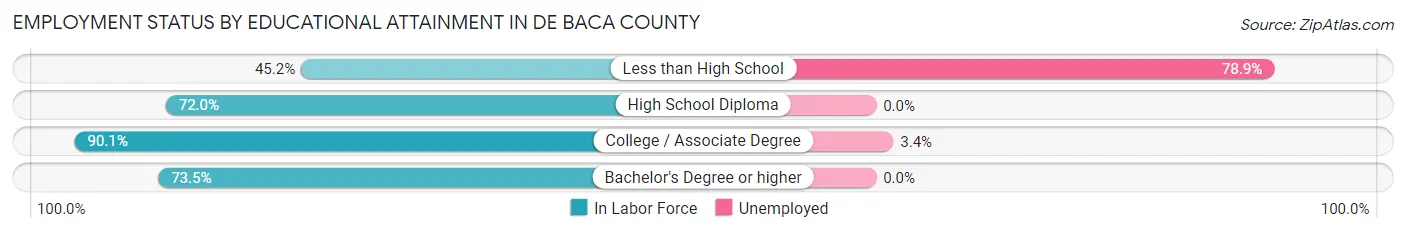
Employment Status by Educational Attainment in De Baca County
According to labor force statistics for De Baca County, 78.4% of individuals (612) out of the total population between 25 and 64 years of age (781) are in the labor force, with 9.6% or 59 of them being unemployed. The group with the highest labor force participation rate are those with the educational attainment of college / associate degree, with 90.1% or 411 individuals in the labor force. Within the labor force, individuals with less than high school education have the highest percentage of unemployment, with 78.9% or 45 of them being unemployed.
| Educational Attainment | In Labor Force | Unemployed |
| Less than High School | 57 (45.2%) | 99 (78.9%) |
| High School Diploma | 108 (72.0%) | 0 (0.0%) |
| College / Associate Degree | 411 (90.1%) | 16 (3.4%) |
| Bachelor's Degree or higher | 36 (73.5%) | 0 (0.0%) |
| Total | 612 (78.4%) | 75 (9.6%) |
Employment Occupations by Sex in De Baca County
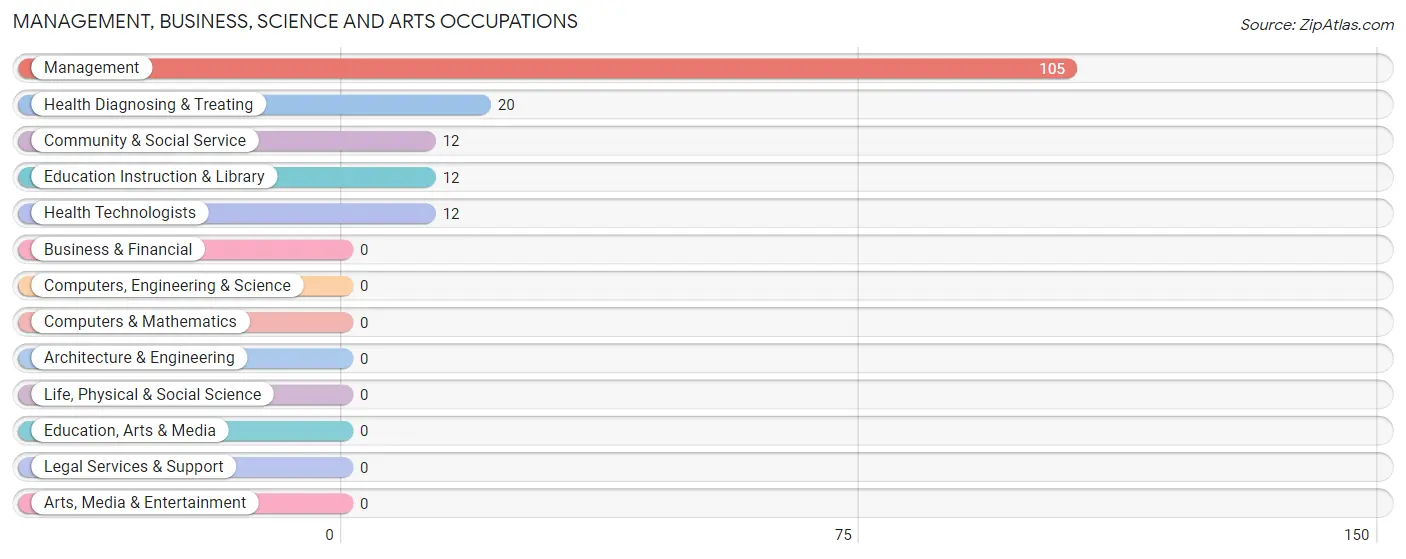
Management, Business, Science and Arts Occupations
The most common Management, Business, Science and Arts occupations in De Baca County are Management (105 | 14.4%), Health Diagnosing & Treating (20 | 2.7%), Community & Social Service (12 | 1.7%), Education Instruction & Library (12 | 1.7%), and Health Technologists (12 | 1.7%).
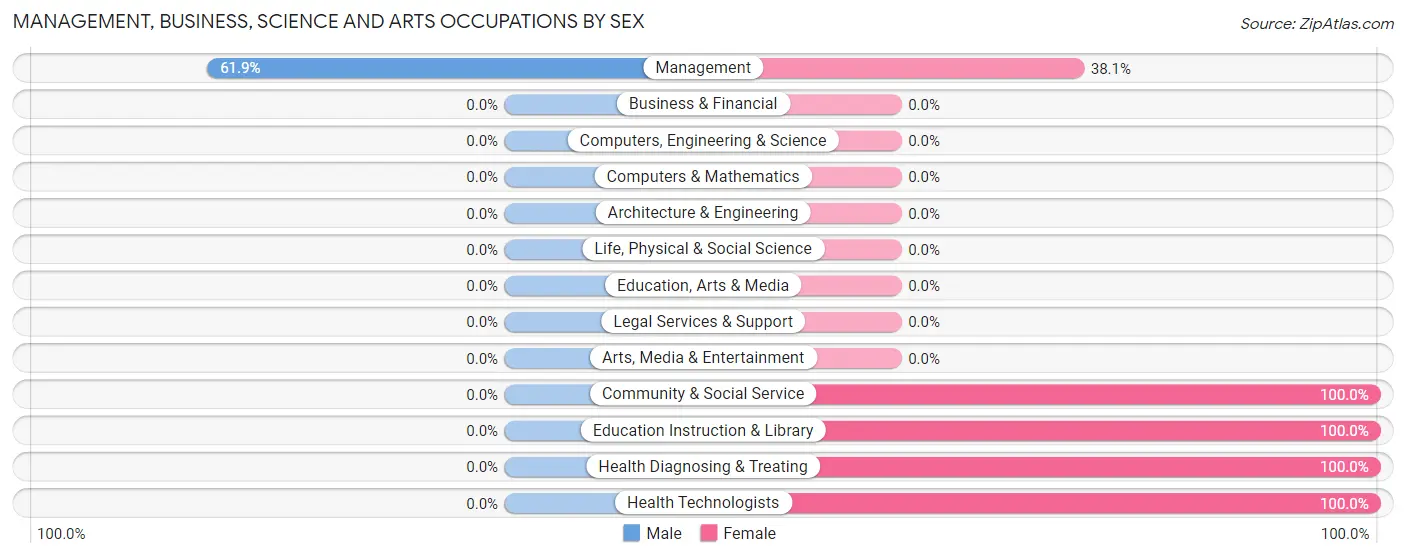
Management, Business, Science and Arts Occupations by Sex
| Occupation | Male | Female |
| Management | 65 (61.9%) | 40 (38.1%) |
| Business & Financial | 0 (0.0%) | 0 (0.0%) |
| Computers, Engineering & Science | 0 (0.0%) | 0 (0.0%) |
| Computers & Mathematics | 0 (0.0%) | 0 (0.0%) |
| Architecture & Engineering | 0 (0.0%) | 0 (0.0%) |
| Life, Physical & Social Science | 0 (0.0%) | 0 (0.0%) |
| Community & Social Service | 0 (0.0%) | 12 (100.0%) |
| Education, Arts & Media | 0 (0.0%) | 0 (0.0%) |
| Legal Services & Support | 0 (0.0%) | 0 (0.0%) |
| Education Instruction & Library | 0 (0.0%) | 12 (100.0%) |
| Arts, Media & Entertainment | 0 (0.0%) | 0 (0.0%) |
| Health Diagnosing & Treating | 0 (0.0%) | 20 (100.0%) |
| Health Technologists | 0 (0.0%) | 12 (100.0%) |
| Total (Category) | 65 (47.4%) | 72 (52.5%) |
| Total (Overall) | 578 (79.3%) | 151 (20.7%) |
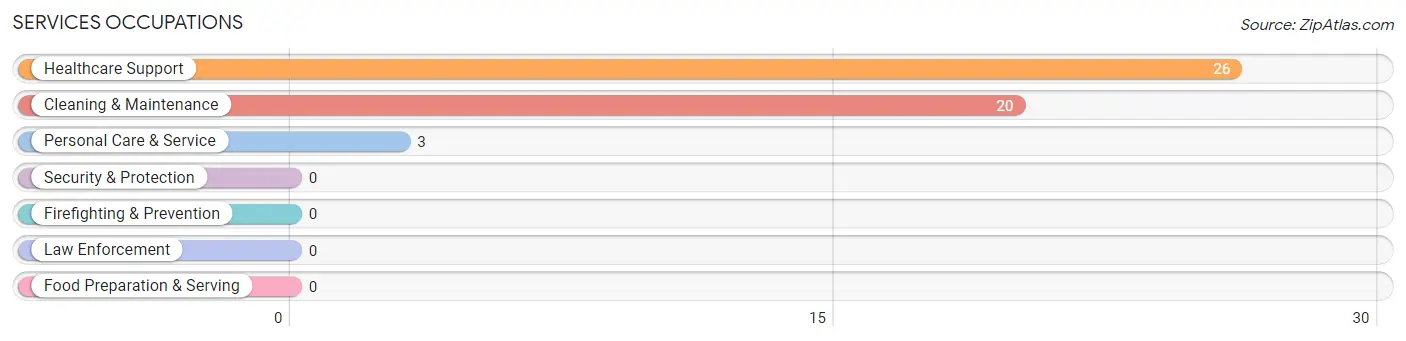
Services Occupations
The most common Services occupations in De Baca County are Healthcare Support (26 | 3.6%), Cleaning & Maintenance (20 | 2.7%), and Personal Care & Service (3 | 0.4%).
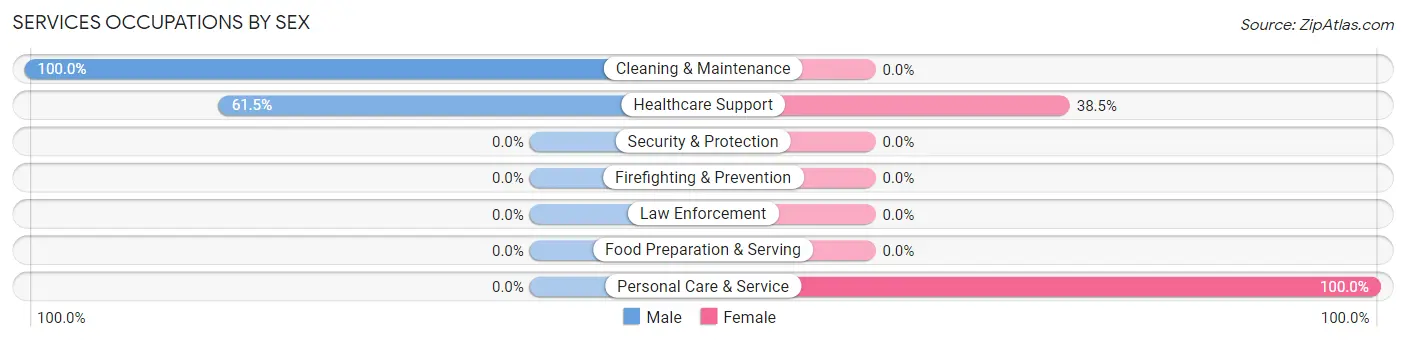
Services Occupations by Sex
Within the Services occupations in De Baca County, the most male-oriented occupations are Cleaning & Maintenance (100.0%), and Healthcare Support (61.5%), while the most female-oriented occupations are Personal Care & Service (100.0%), and Healthcare Support (38.5%).
| Occupation | Male | Female |
| Healthcare Support | 16 (61.5%) | 10 (38.5%) |
| Security & Protection | 0 (0.0%) | 0 (0.0%) |
| Firefighting & Prevention | 0 (0.0%) | 0 (0.0%) |
| Law Enforcement | 0 (0.0%) | 0 (0.0%) |
| Food Preparation & Serving | 0 (0.0%) | 0 (0.0%) |
| Cleaning & Maintenance | 20 (100.0%) | 0 (0.0%) |
| Personal Care & Service | 0 (0.0%) | 3 (100.0%) |
| Total (Category) | 36 (73.5%) | 13 (26.5%) |
| Total (Overall) | 578 (79.3%) | 151 (20.7%) |
Sales and Office Occupations
The most common Sales and Office occupations in De Baca County are Office & Administration (65 | 8.9%), and Sales & Related (14 | 1.9%).

Sales and Office Occupations by Sex

| Occupation | Male | Female |
| Sales & Related | 5 (35.7%) | 9 (64.3%) |
| Office & Administration | 12 (18.5%) | 53 (81.5%) |
| Total (Category) | 17 (21.5%) | 62 (78.5%) |
| Total (Overall) | 578 (79.3%) | 151 (20.7%) |
Natural Resources, Construction and Maintenance Occupations
The most common Natural Resources, Construction and Maintenance occupations in De Baca County are Installation, Maintenance & Repair (156 | 21.4%), Farming, Fishing & Forestry (112 | 15.4%), and Construction & Extraction (97 | 13.3%).
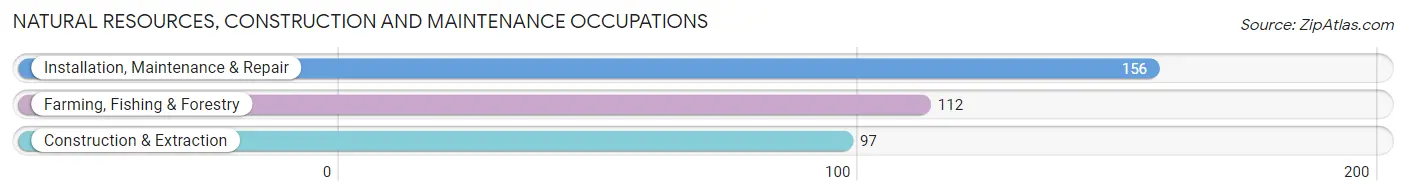
Natural Resources, Construction and Maintenance Occupations by Sex

| Occupation | Male | Female |
| Farming, Fishing & Forestry | 112 (100.0%) | 0 (0.0%) |
| Construction & Extraction | 97 (100.0%) | 0 (0.0%) |
| Installation, Maintenance & Repair | 156 (100.0%) | 0 (0.0%) |
| Total (Category) | 365 (100.0%) | 0 (0.0%) |
| Total (Overall) | 578 (79.3%) | 151 (20.7%) |
Production, Transportation and Moving Occupations
The most common Production, Transportation and Moving occupations in De Baca County are Production (88 | 12.1%), and Transportation (11 | 1.5%).
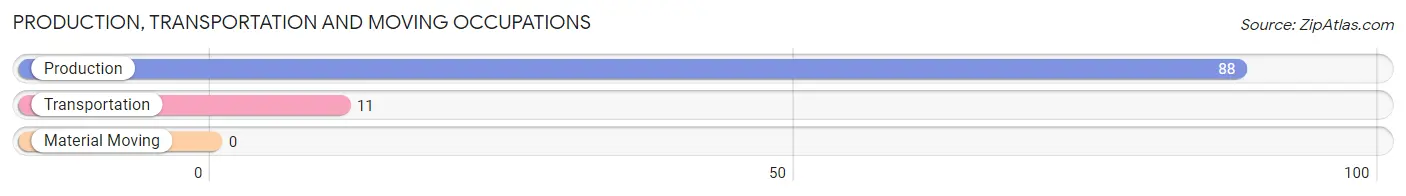
Production, Transportation and Moving Occupations by Sex
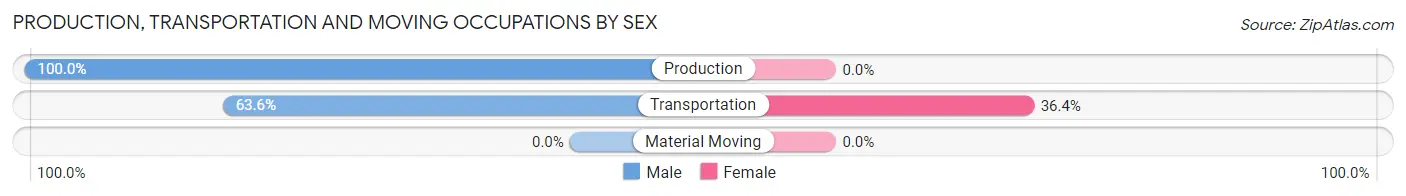
| Occupation | Male | Female |
| Production | 88 (100.0%) | 0 (0.0%) |
| Transportation | 7 (63.6%) | 4 (36.4%) |
| Material Moving | 0 (0.0%) | 0 (0.0%) |
| Total (Category) | 95 (96.0%) | 4 (4.0%) |
| Total (Overall) | 578 (79.3%) | 151 (20.7%) |
Employment Industries by Sex in De Baca County
Employment Industries in De Baca County
The major employment industries in De Baca County include Agriculture, Fishing & Hunting (184 | 25.2%), Construction (170 | 23.3%), Utilities (152 | 20.8%), Health Care & Social Assistance (62 | 8.5%), and Manufacturing (39 | 5.3%).
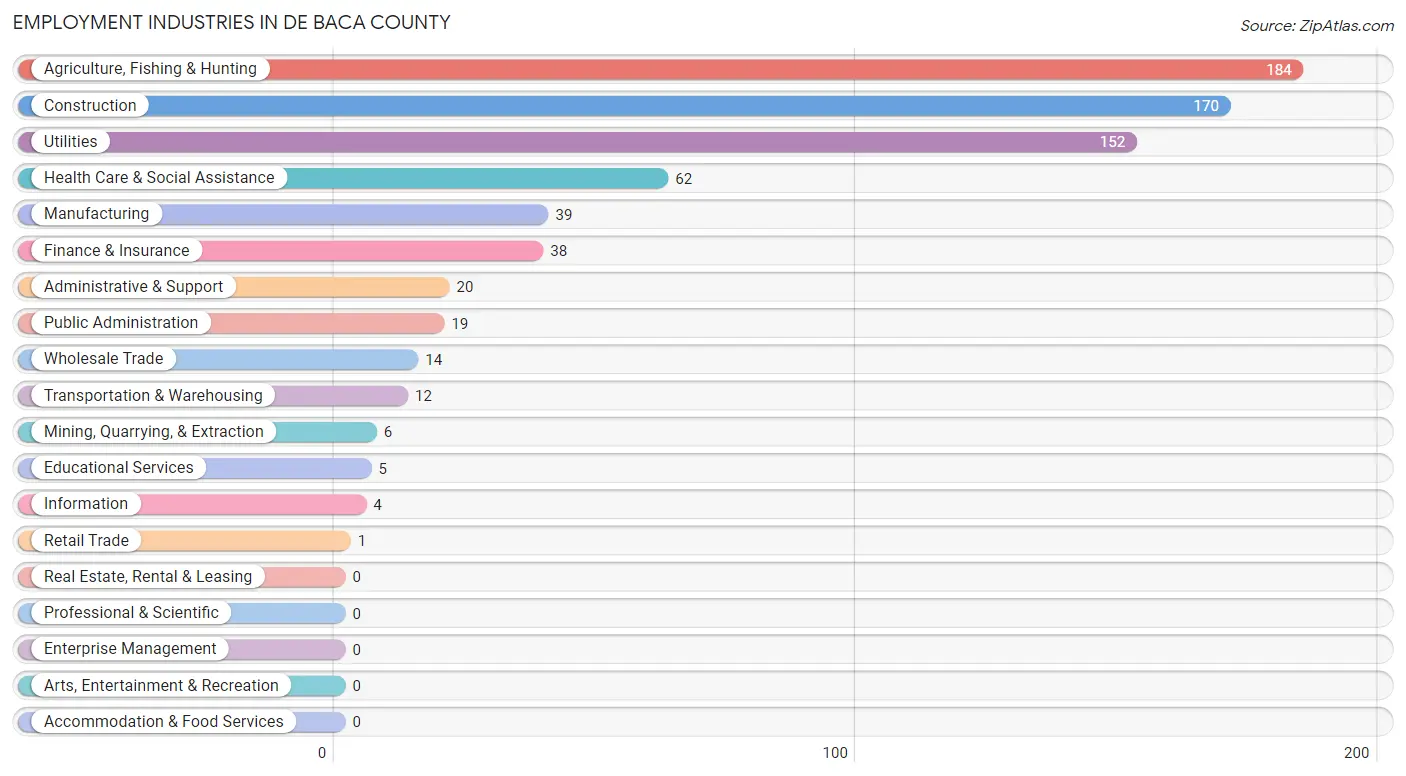
Employment Industries by Sex in De Baca County
The De Baca County industries that see more men than women are Mining, Quarrying, & Extraction (100.0%), Manufacturing (100.0%), and Retail Trade (100.0%), whereas the industries that tend to have a higher number of women are Finance & Insurance (100.0%), Educational Services (100.0%), and Public Administration (78.9%).
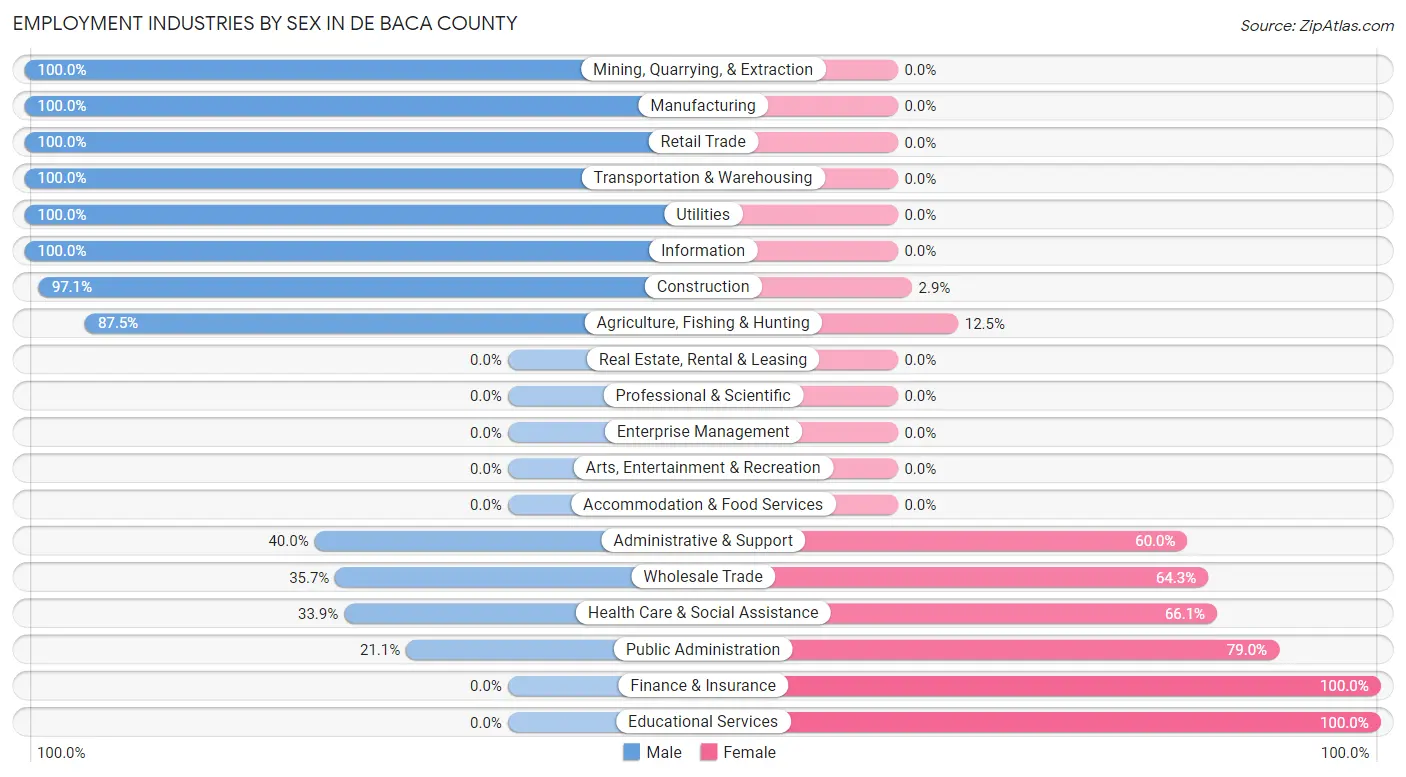
| Industry | Male | Female |
| Agriculture, Fishing & Hunting | 161 (87.5%) | 23 (12.5%) |
| Mining, Quarrying, & Extraction | 6 (100.0%) | 0 (0.0%) |
| Construction | 165 (97.1%) | 5 (2.9%) |
| Manufacturing | 39 (100.0%) | 0 (0.0%) |
| Wholesale Trade | 5 (35.7%) | 9 (64.3%) |
| Retail Trade | 1 (100.0%) | 0 (0.0%) |
| Transportation & Warehousing | 12 (100.0%) | 0 (0.0%) |
| Utilities | 152 (100.0%) | 0 (0.0%) |
| Information | 4 (100.0%) | 0 (0.0%) |
| Finance & Insurance | 0 (0.0%) | 38 (100.0%) |
| Real Estate, Rental & Leasing | 0 (0.0%) | 0 (0.0%) |
| Professional & Scientific | 0 (0.0%) | 0 (0.0%) |
| Enterprise Management | 0 (0.0%) | 0 (0.0%) |
| Administrative & Support | 8 (40.0%) | 12 (60.0%) |
| Educational Services | 0 (0.0%) | 5 (100.0%) |
| Health Care & Social Assistance | 21 (33.9%) | 41 (66.1%) |
| Arts, Entertainment & Recreation | 0 (0.0%) | 0 (0.0%) |
| Accommodation & Food Services | 0 (0.0%) | 0 (0.0%) |
| Public Administration | 4 (21.0%) | 15 (78.9%) |
| Total | 578 (79.3%) | 151 (20.7%) |
Education in De Baca County
School Enrollment in De Baca County
The most common levels of schooling among the 201 students in De Baca County are elementary school (88 | 43.8%), middle school (54 | 26.9%), and high school (52 | 25.9%).
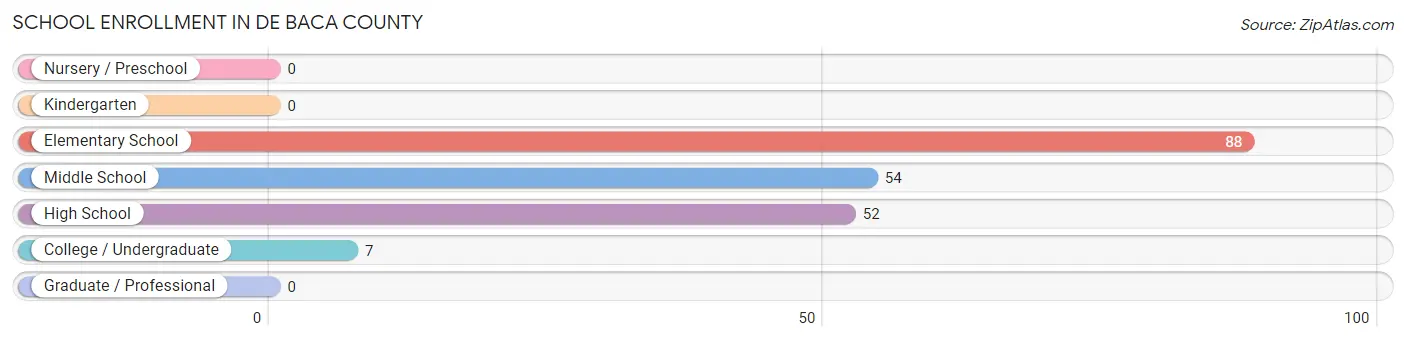
| School Level | # Students | % Students |
| Nursery / Preschool | 0 | 0.0% |
| Kindergarten | 0 | 0.0% |
| Elementary School | 88 | 43.8% |
| Middle School | 54 | 26.9% |
| High School | 52 | 25.9% |
| College / Undergraduate | 7 | 3.5% |
| Graduate / Professional | 0 | 0.0% |
| Total | 201 | 100.0% |
School Enrollment by Age by Funding Source in De Baca County
Out of a total of 201 students who are enrolled in schools in De Baca County, 16 (8.0%) attend a private institution, while the remaining 185 (92.0%) are enrolled in public schools. The age group of 10 to 14 year olds has the highest likelihood of being enrolled in private schools, with 16 (30.8% in the age bracket) enrolled. Conversely, the age group of 5 to 9 year old has the lowest likelihood of being enrolled in a private school, with 88 (100.0% in the age bracket) attending a public institution.
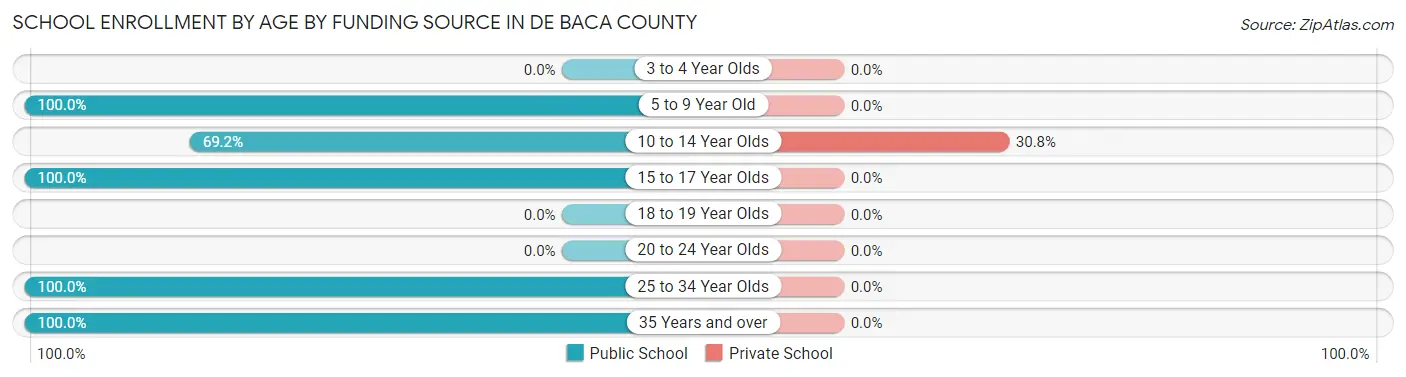
| Age Bracket | Public School | Private School |
| 3 to 4 Year Olds | 0 (0.0%) | 0 (0.0%) |
| 5 to 9 Year Old | 88 (100.0%) | 0 (0.0%) |
| 10 to 14 Year Olds | 36 (69.2%) | 16 (30.8%) |
| 15 to 17 Year Olds | 54 (100.0%) | 0 (0.0%) |
| 18 to 19 Year Olds | 0 (0.0%) | 0 (0.0%) |
| 20 to 24 Year Olds | 0 (0.0%) | 0 (0.0%) |
| 25 to 34 Year Olds | 4 (100.0%) | 0 (0.0%) |
| 35 Years and over | 3 (100.0%) | 0 (0.0%) |
| Total | 185 (92.0%) | 16 (8.0%) |
Educational Attainment by Field of Study in De Baca County
Education (41 | 38.0%), business (22 | 20.4%), bio, nature & agricultural (21 | 19.4%), physical & health sciences (13 | 12.0%), and arts & humanities (8 | 7.4%) are the most common fields of study among 108 individuals in De Baca County who have obtained a bachelor's degree or higher.
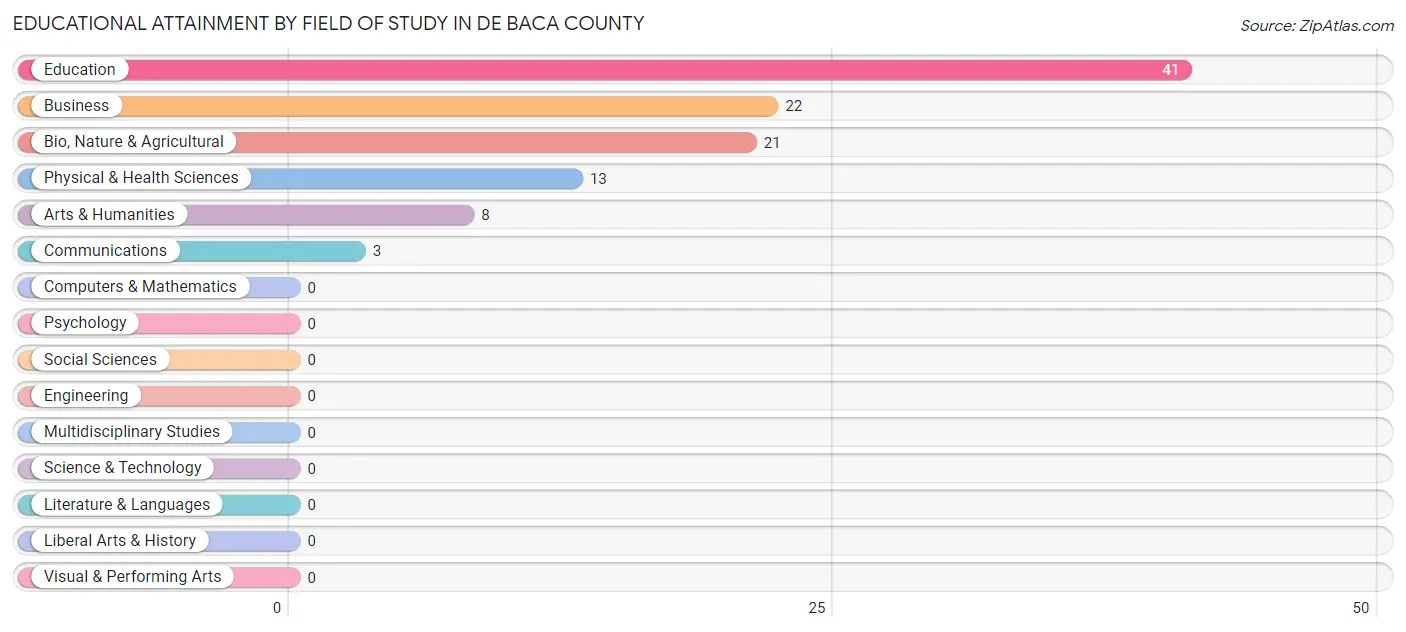
| Field of Study | # Graduates | % Graduates |
| Computers & Mathematics | 0 | 0.0% |
| Bio, Nature & Agricultural | 21 | 19.4% |
| Physical & Health Sciences | 13 | 12.0% |
| Psychology | 0 | 0.0% |
| Social Sciences | 0 | 0.0% |
| Engineering | 0 | 0.0% |
| Multidisciplinary Studies | 0 | 0.0% |
| Science & Technology | 0 | 0.0% |
| Business | 22 | 20.4% |
| Education | 41 | 38.0% |
| Literature & Languages | 0 | 0.0% |
| Liberal Arts & History | 0 | 0.0% |
| Visual & Performing Arts | 0 | 0.0% |
| Communications | 3 | 2.8% |
| Arts & Humanities | 8 | 7.4% |
| Total | 108 | 100.0% |
Transportation & Commute in De Baca County
Vehicle Availability by Sex in De Baca County
The most prevalent vehicle ownership categories in De Baca County are males with 2 vehicles (302, accounting for 52.4%) and females with 2 vehicles (79, making up 206.8%).
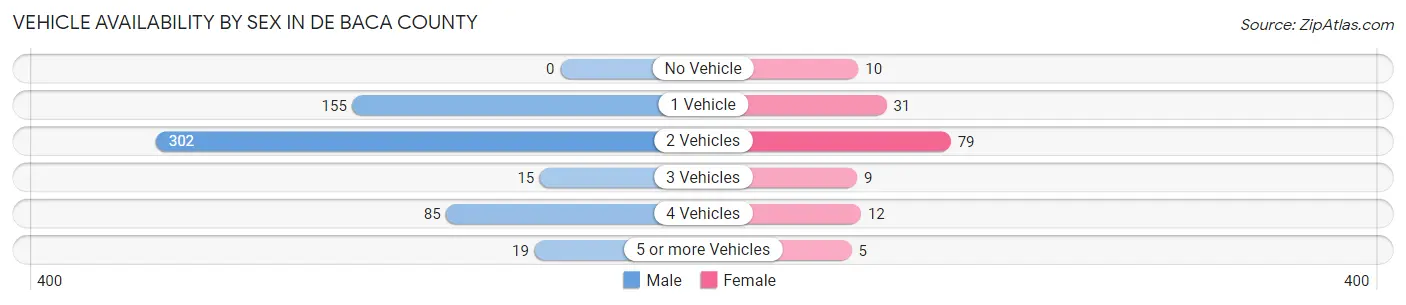
| Vehicles Available | Male | Female |
| No Vehicle | 0 (0.0%) | 10 (6.9%) |
| 1 Vehicle | 155 (26.9%) | 31 (21.2%) |
| 2 Vehicles | 302 (52.4%) | 79 (54.1%) |
| 3 Vehicles | 15 (2.6%) | 9 (6.2%) |
| 4 Vehicles | 85 (14.8%) | 12 (8.2%) |
| 5 or more Vehicles | 19 (3.3%) | 5 (3.4%) |
| Total | 576 (100.0%) | 146 (100.0%) |
Commute Time in De Baca County
The most frequently occuring commute durations in De Baca County are 5 to 9 minutes (330 commuters, 46.6%), 10 to 14 minutes (197 commuters, 27.8%), and less than 5 minutes (92 commuters, 13.0%).
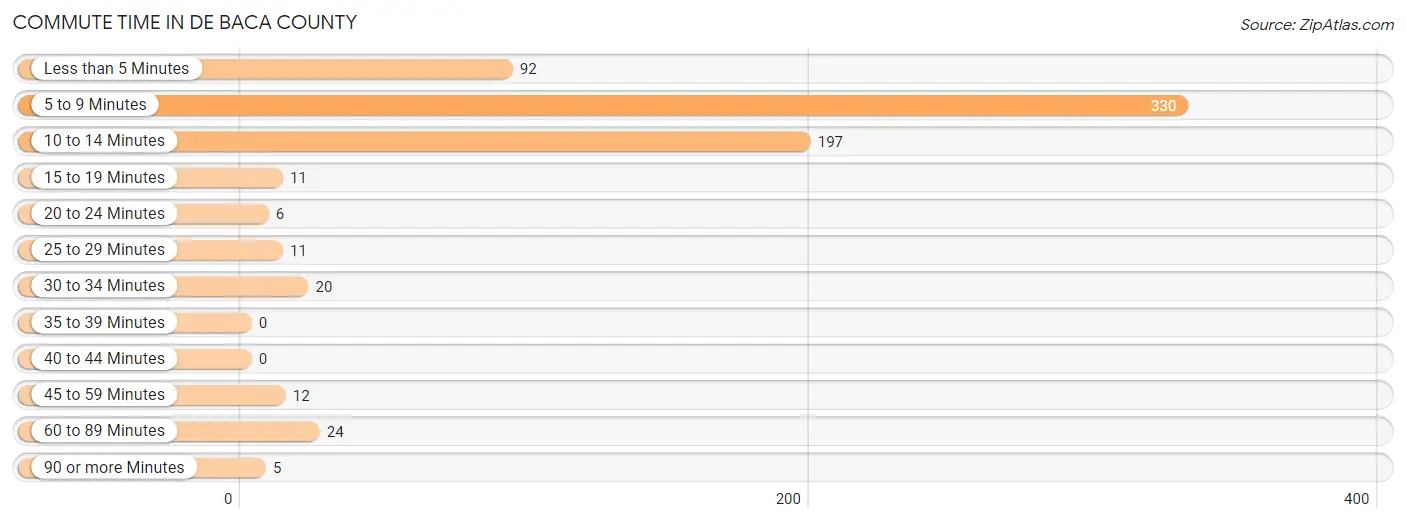
| Commute Time | # Commuters | % Commuters |
| Less than 5 Minutes | 92 | 13.0% |
| 5 to 9 Minutes | 330 | 46.6% |
| 10 to 14 Minutes | 197 | 27.8% |
| 15 to 19 Minutes | 11 | 1.5% |
| 20 to 24 Minutes | 6 | 0.9% |
| 25 to 29 Minutes | 11 | 1.5% |
| 30 to 34 Minutes | 20 | 2.8% |
| 35 to 39 Minutes | 0 | 0.0% |
| 40 to 44 Minutes | 0 | 0.0% |
| 45 to 59 Minutes | 12 | 1.7% |
| 60 to 89 Minutes | 24 | 3.4% |
| 90 or more Minutes | 5 | 0.7% |
Commute Time by Sex in De Baca County
The most common commute times in De Baca County are 5 to 9 minutes (245 commuters, 42.9%) for males and 5 to 9 minutes (85 commuters, 62.0%) for females.
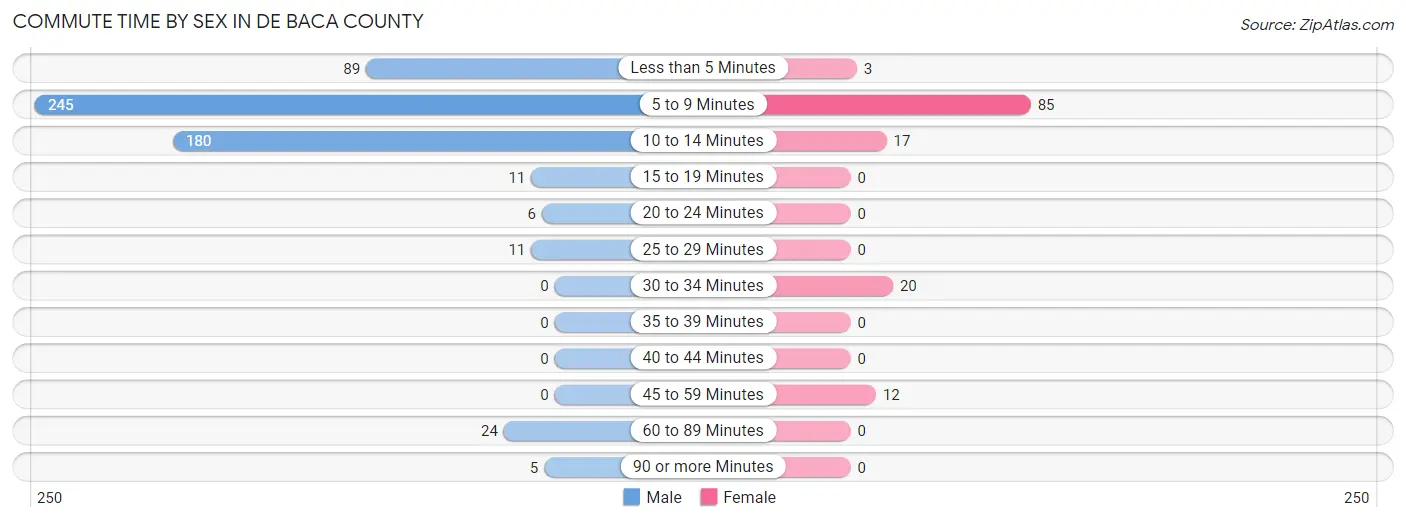
| Commute Time | Male | Female |
| Less than 5 Minutes | 89 (15.6%) | 3 (2.2%) |
| 5 to 9 Minutes | 245 (42.9%) | 85 (62.0%) |
| 10 to 14 Minutes | 180 (31.5%) | 17 (12.4%) |
| 15 to 19 Minutes | 11 (1.9%) | 0 (0.0%) |
| 20 to 24 Minutes | 6 (1.1%) | 0 (0.0%) |
| 25 to 29 Minutes | 11 (1.9%) | 0 (0.0%) |
| 30 to 34 Minutes | 0 (0.0%) | 20 (14.6%) |
| 35 to 39 Minutes | 0 (0.0%) | 0 (0.0%) |
| 40 to 44 Minutes | 0 (0.0%) | 0 (0.0%) |
| 45 to 59 Minutes | 0 (0.0%) | 12 (8.8%) |
| 60 to 89 Minutes | 24 (4.2%) | 0 (0.0%) |
| 90 or more Minutes | 5 (0.9%) | 0 (0.0%) |
Time of Departure to Work by Sex in De Baca County
The most frequent times of departure to work in De Baca County are 7:30 AM to 7:59 AM (166, 29.1%) for males and 7:30 AM to 7:59 AM (53, 38.7%) for females.
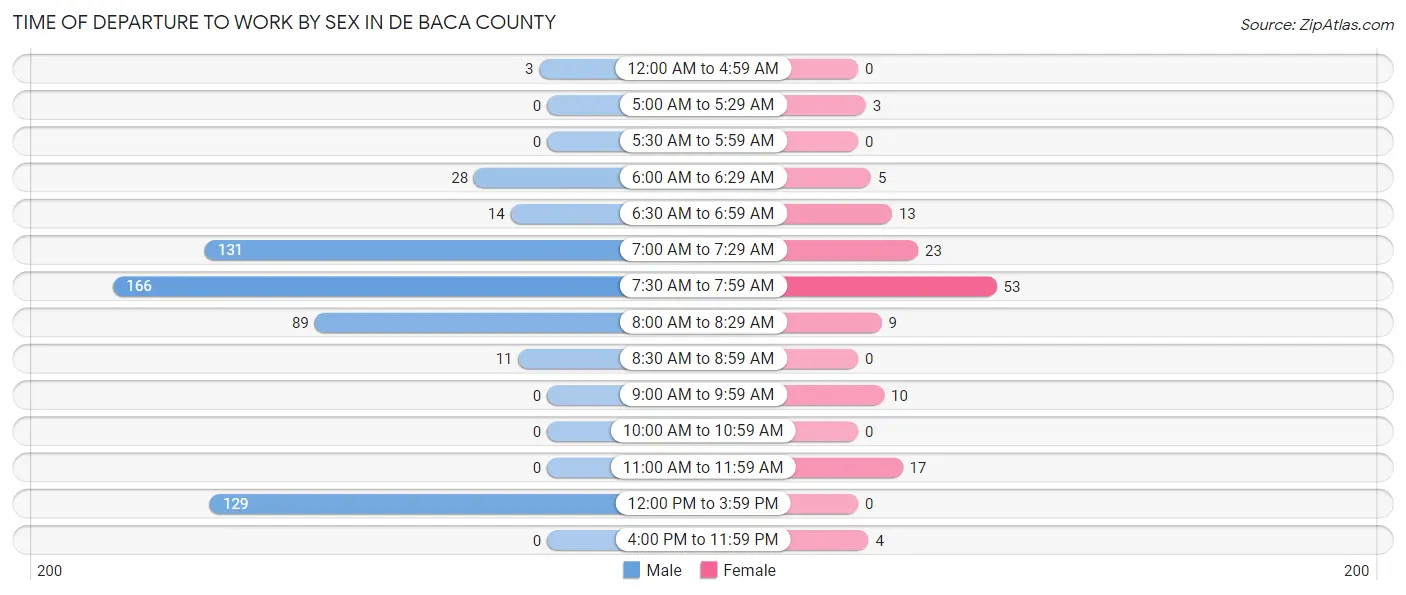
| Time of Departure | Male | Female |
| 12:00 AM to 4:59 AM | 3 (0.5%) | 0 (0.0%) |
| 5:00 AM to 5:29 AM | 0 (0.0%) | 3 (2.2%) |
| 5:30 AM to 5:59 AM | 0 (0.0%) | 0 (0.0%) |
| 6:00 AM to 6:29 AM | 28 (4.9%) | 5 (3.6%) |
| 6:30 AM to 6:59 AM | 14 (2.5%) | 13 (9.5%) |
| 7:00 AM to 7:29 AM | 131 (22.9%) | 23 (16.8%) |
| 7:30 AM to 7:59 AM | 166 (29.1%) | 53 (38.7%) |
| 8:00 AM to 8:29 AM | 89 (15.6%) | 9 (6.6%) |
| 8:30 AM to 8:59 AM | 11 (1.9%) | 0 (0.0%) |
| 9:00 AM to 9:59 AM | 0 (0.0%) | 10 (7.3%) |
| 10:00 AM to 10:59 AM | 0 (0.0%) | 0 (0.0%) |
| 11:00 AM to 11:59 AM | 0 (0.0%) | 17 (12.4%) |
| 12:00 PM to 3:59 PM | 129 (22.6%) | 0 (0.0%) |
| 4:00 PM to 11:59 PM | 0 (0.0%) | 4 (2.9%) |
| Total | 571 (100.0%) | 137 (100.0%) |
Housing Occupancy in De Baca County
Occupancy by Ownership in De Baca County
Of the total 741 dwellings in De Baca County, owner-occupied units account for 502 (67.7%), while renter-occupied units make up 239 (32.3%).
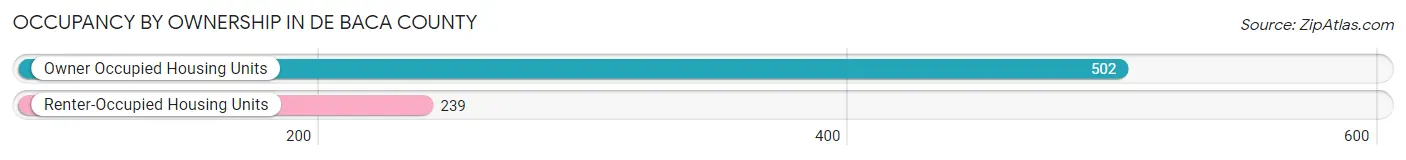
| Occupancy | # Housing Units | % Housing Units |
| Owner Occupied Housing Units | 502 | 67.7% |
| Renter-Occupied Housing Units | 239 | 32.3% |
| Total Occupied Housing Units | 741 | 100.0% |
Occupancy by Household Size in De Baca County
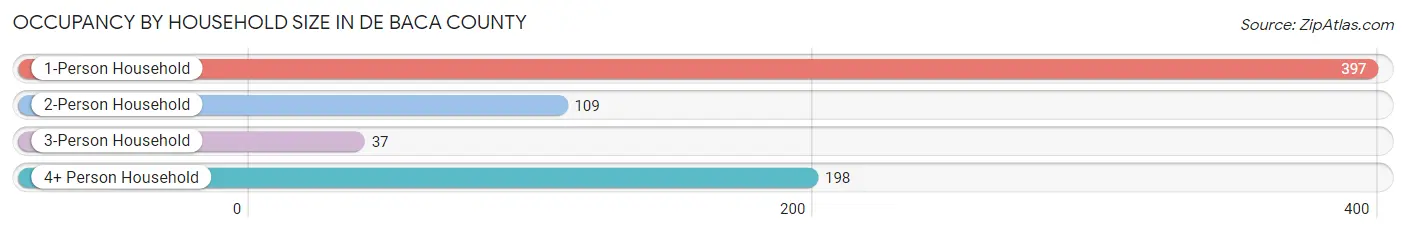
| Household Size | # Housing Units | % Housing Units |
| 1-Person Household | 397 | 53.6% |
| 2-Person Household | 109 | 14.7% |
| 3-Person Household | 37 | 5.0% |
| 4+ Person Household | 198 | 26.7% |
| Total Housing Units | 741 | 100.0% |
Occupancy by Ownership by Household Size in De Baca County
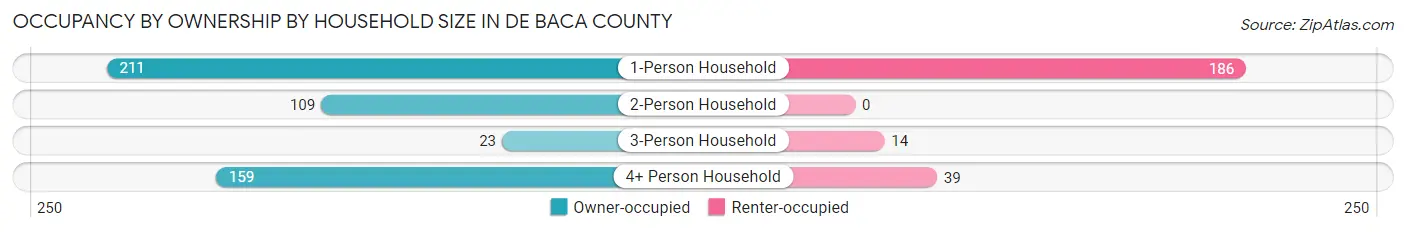
| Household Size | Owner-occupied | Renter-occupied |
| 1-Person Household | 211 (53.1%) | 186 (46.9%) |
| 2-Person Household | 109 (100.0%) | 0 (0.0%) |
| 3-Person Household | 23 (62.2%) | 14 (37.8%) |
| 4+ Person Household | 159 (80.3%) | 39 (19.7%) |
| Total Housing Units | 502 (67.7%) | 239 (32.3%) |
Occupancy by Educational Attainment in De Baca County
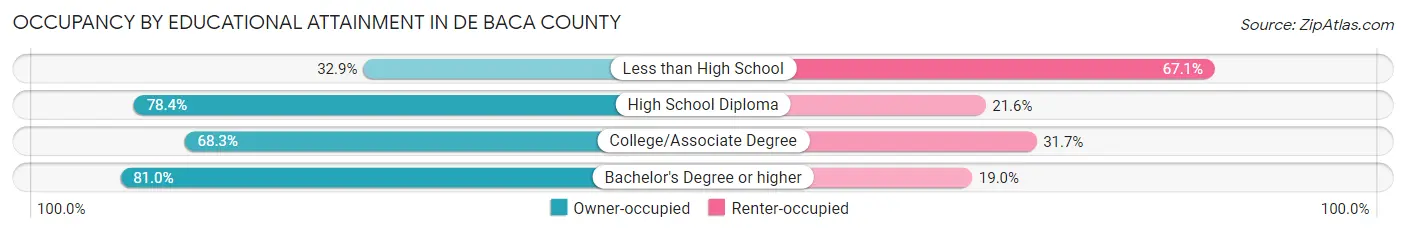
| Household Size | Owner-occupied | Renter-occupied |
| Less than High School | 23 (32.9%) | 47 (67.1%) |
| High School Diploma | 105 (78.4%) | 29 (21.6%) |
| College/Associate Degree | 327 (68.3%) | 152 (31.7%) |
| Bachelor's Degree or higher | 47 (81.0%) | 11 (19.0%) |
Occupancy by Age of Householder in De Baca County
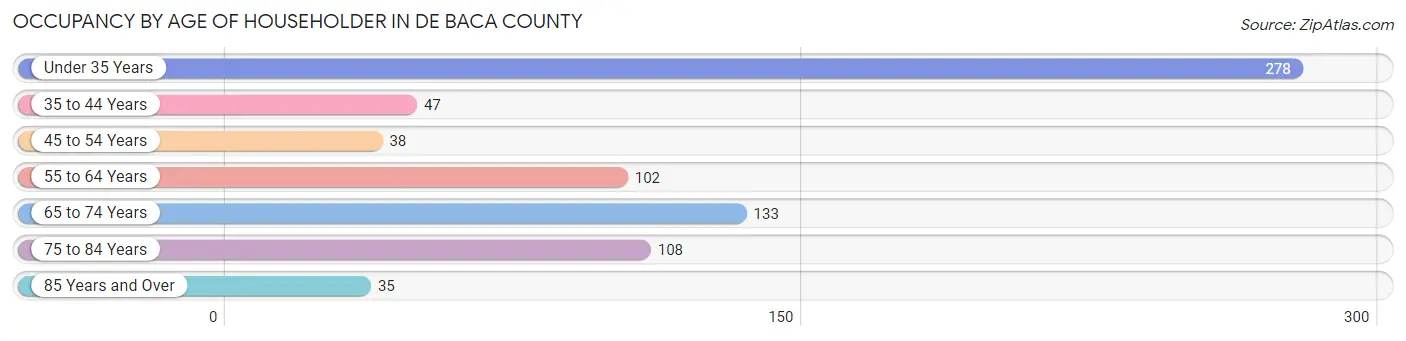
| Age Bracket | # Households | % Households |
| Under 35 Years | 278 | 37.5% |
| 35 to 44 Years | 47 | 6.3% |
| 45 to 54 Years | 38 | 5.1% |
| 55 to 64 Years | 102 | 13.8% |
| 65 to 74 Years | 133 | 17.9% |
| 75 to 84 Years | 108 | 14.6% |
| 85 Years and Over | 35 | 4.7% |
| Total | 741 | 100.0% |
Housing Finances in De Baca County
Median Income by Occupancy in De Baca County
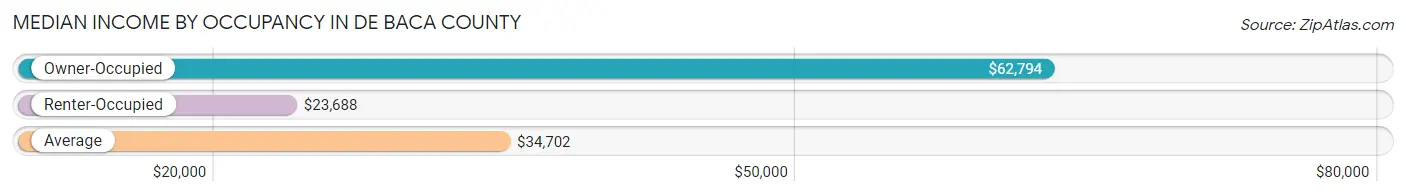
| Occupancy Type | # Households | Median Income |
| Owner-Occupied | 502 (67.7%) | $62,794 |
| Renter-Occupied | 239 (32.3%) | $23,688 |
| Average | 741 (100.0%) | $34,702 |
Occupancy by Householder Income Bracket in De Baca County
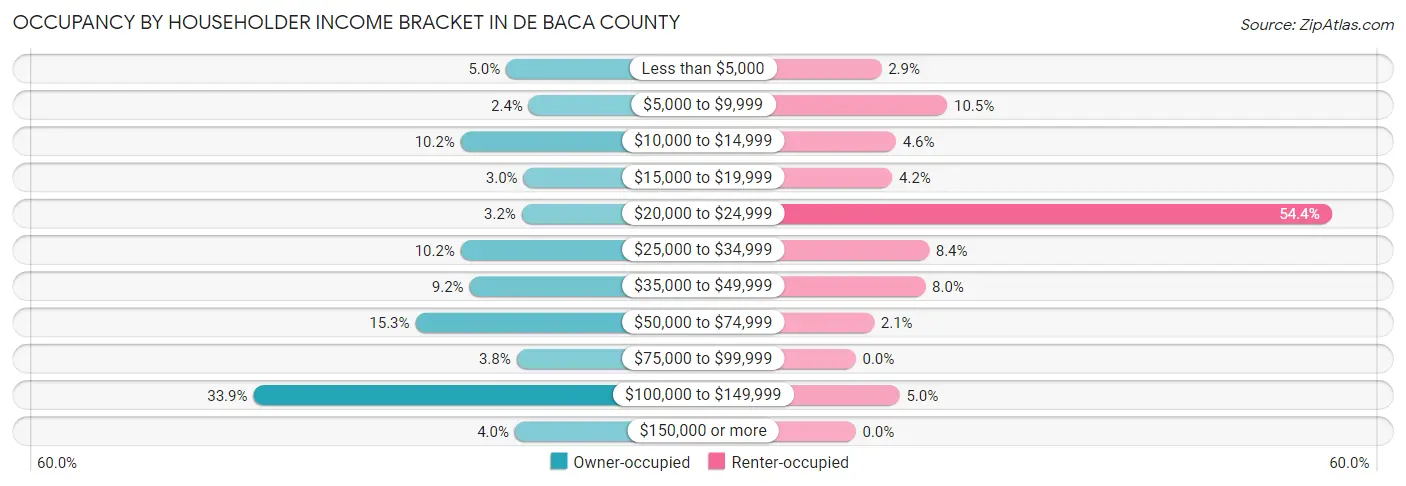
| Income Bracket | Owner-occupied | Renter-occupied |
| Less than $5,000 | 25 (5.0%) | 7 (2.9%) |
| $5,000 to $9,999 | 12 (2.4%) | 25 (10.5%) |
| $10,000 to $14,999 | 51 (10.2%) | 11 (4.6%) |
| $15,000 to $19,999 | 15 (3.0%) | 10 (4.2%) |
| $20,000 to $24,999 | 16 (3.2%) | 130 (54.4%) |
| $25,000 to $34,999 | 51 (10.2%) | 20 (8.4%) |
| $35,000 to $49,999 | 46 (9.2%) | 19 (8.0%) |
| $50,000 to $74,999 | 77 (15.3%) | 5 (2.1%) |
| $75,000 to $99,999 | 19 (3.8%) | 0 (0.0%) |
| $100,000 to $149,999 | 170 (33.9%) | 12 (5.0%) |
| $150,000 or more | 20 (4.0%) | 0 (0.0%) |
| Total | 502 (100.0%) | 239 (100.0%) |
Monthly Housing Cost Tiers in De Baca County
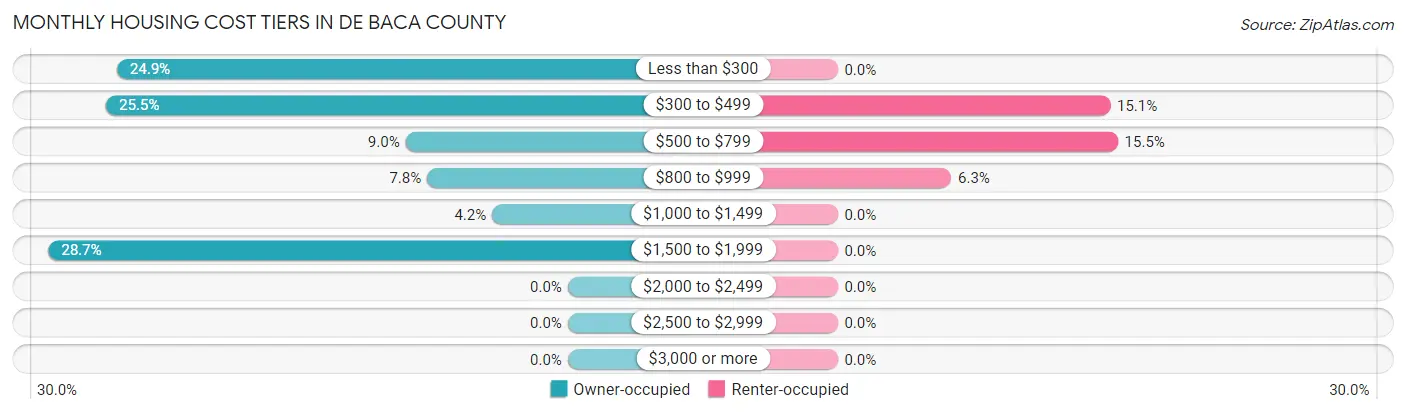
| Monthly Cost | Owner-occupied | Renter-occupied |
| Less than $300 | 125 (24.9%) | 0 (0.0%) |
| $300 to $499 | 128 (25.5%) | 36 (15.1%) |
| $500 to $799 | 45 (9.0%) | 37 (15.5%) |
| $800 to $999 | 39 (7.8%) | 15 (6.3%) |
| $1,000 to $1,499 | 21 (4.2%) | 0 (0.0%) |
| $1,500 to $1,999 | 144 (28.7%) | 0 (0.0%) |
| $2,000 to $2,499 | 0 (0.0%) | 0 (0.0%) |
| $2,500 to $2,999 | 0 (0.0%) | 0 (0.0%) |
| $3,000 or more | 0 (0.0%) | 0 (0.0%) |
| Total | 502 (100.0%) | 239 (100.0%) |
Physical Housing Characteristics in De Baca County
Housing Structures in De Baca County
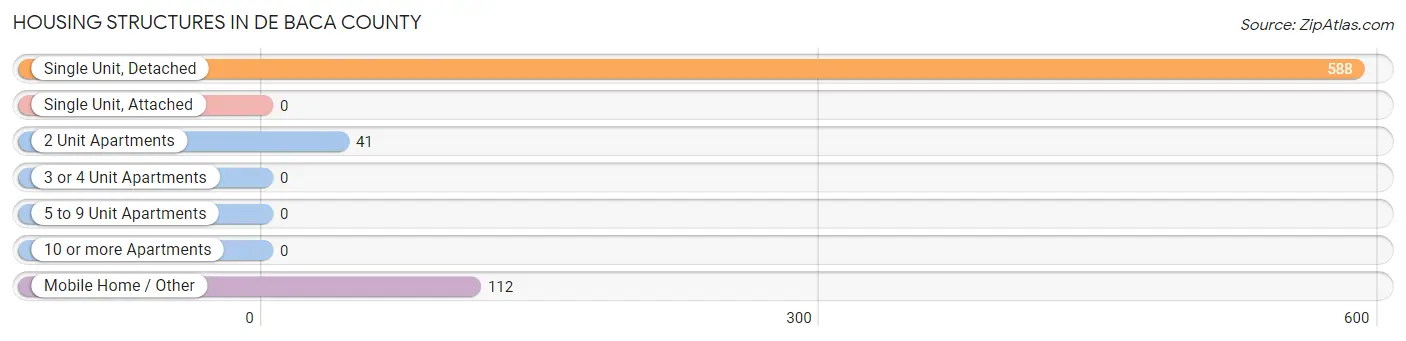
| Structure Type | # Housing Units | % Housing Units |
| Single Unit, Detached | 588 | 79.3% |
| Single Unit, Attached | 0 | 0.0% |
| 2 Unit Apartments | 41 | 5.5% |
| 3 or 4 Unit Apartments | 0 | 0.0% |
| 5 to 9 Unit Apartments | 0 | 0.0% |
| 10 or more Apartments | 0 | 0.0% |
| Mobile Home / Other | 112 | 15.1% |
| Total | 741 | 100.0% |
Housing Structures by Occupancy in De Baca County
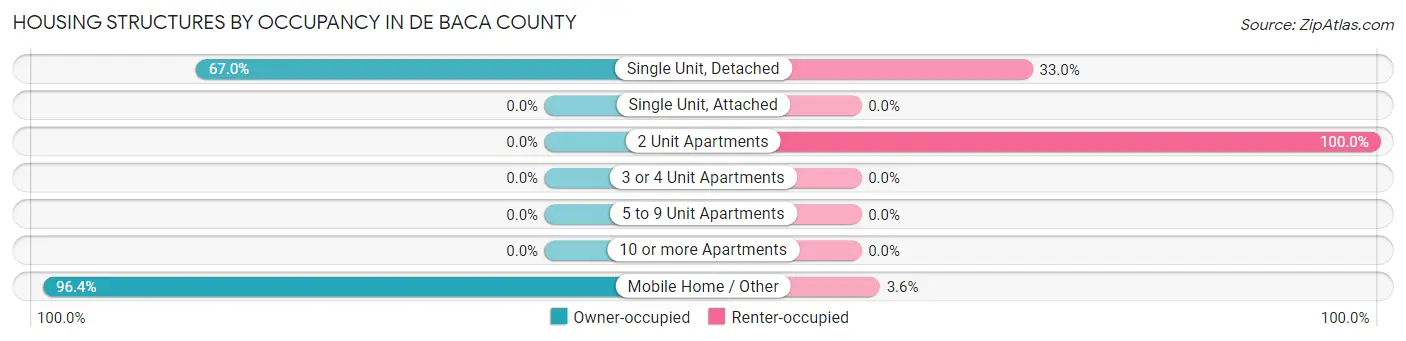
| Structure Type | Owner-occupied | Renter-occupied |
| Single Unit, Detached | 394 (67.0%) | 194 (33.0%) |
| Single Unit, Attached | 0 (0.0%) | 0 (0.0%) |
| 2 Unit Apartments | 0 (0.0%) | 41 (100.0%) |
| 3 or 4 Unit Apartments | 0 (0.0%) | 0 (0.0%) |
| 5 to 9 Unit Apartments | 0 (0.0%) | 0 (0.0%) |
| 10 or more Apartments | 0 (0.0%) | 0 (0.0%) |
| Mobile Home / Other | 108 (96.4%) | 4 (3.6%) |
| Total | 502 (67.7%) | 239 (32.3%) |
Housing Structures by Number of Rooms in De Baca County
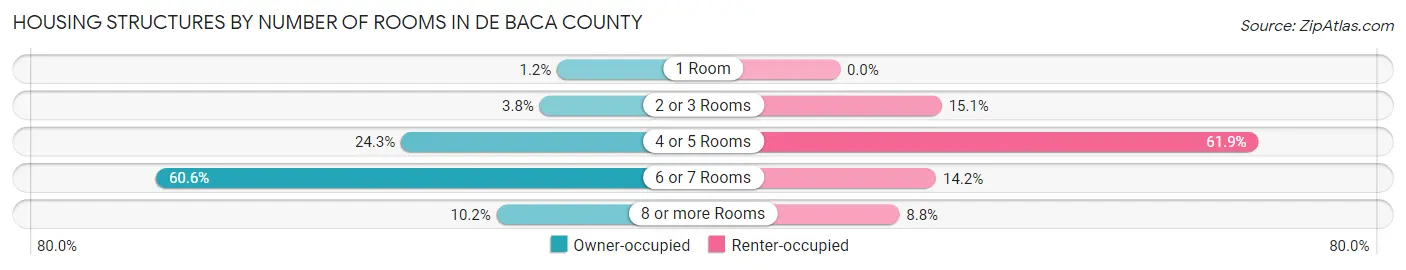
| Number of Rooms | Owner-occupied | Renter-occupied |
| 1 Room | 6 (1.2%) | 0 (0.0%) |
| 2 or 3 Rooms | 19 (3.8%) | 36 (15.1%) |
| 4 or 5 Rooms | 122 (24.3%) | 148 (61.9%) |
| 6 or 7 Rooms | 304 (60.6%) | 34 (14.2%) |
| 8 or more Rooms | 51 (10.2%) | 21 (8.8%) |
| Total | 502 (100.0%) | 239 (100.0%) |
Housing Structure by Heating Type in De Baca County
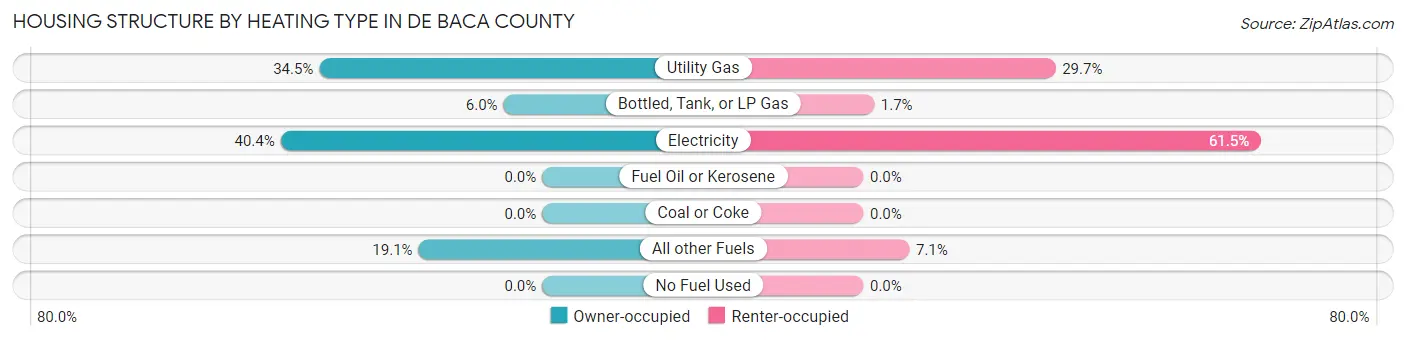
| Heating Type | Owner-occupied | Renter-occupied |
| Utility Gas | 173 (34.5%) | 71 (29.7%) |
| Bottled, Tank, or LP Gas | 30 (6.0%) | 4 (1.7%) |
| Electricity | 203 (40.4%) | 147 (61.5%) |
| Fuel Oil or Kerosene | 0 (0.0%) | 0 (0.0%) |
| Coal or Coke | 0 (0.0%) | 0 (0.0%) |
| All other Fuels | 96 (19.1%) | 17 (7.1%) |
| No Fuel Used | 0 (0.0%) | 0 (0.0%) |
| Total | 502 (100.0%) | 239 (100.0%) |
Household Vehicle Usage in De Baca County
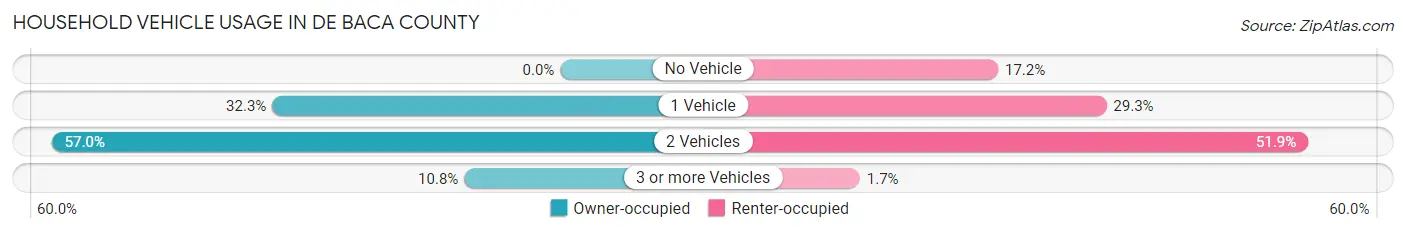
| Vehicles per Household | Owner-occupied | Renter-occupied |
| No Vehicle | 0 (0.0%) | 41 (17.2%) |
| 1 Vehicle | 162 (32.3%) | 70 (29.3%) |
| 2 Vehicles | 286 (57.0%) | 124 (51.9%) |
| 3 or more Vehicles | 54 (10.8%) | 4 (1.7%) |
| Total | 502 (100.0%) | 239 (100.0%) |
Real Estate & Mortgages in De Baca County
Real Estate and Mortgage Overview in De Baca County
| Characteristic | Without Mortgage | With Mortgage |
| Housing Units | 310 | 192 |
| Median Property Value | $142,400 | $266,500 |
| Median Household Income | $34,000 | $0 |
| Monthly Housing Costs | $337 | $0 |
| Real Estate Taxes | $598 | $2 |
Property Value by Mortgage Status in De Baca County
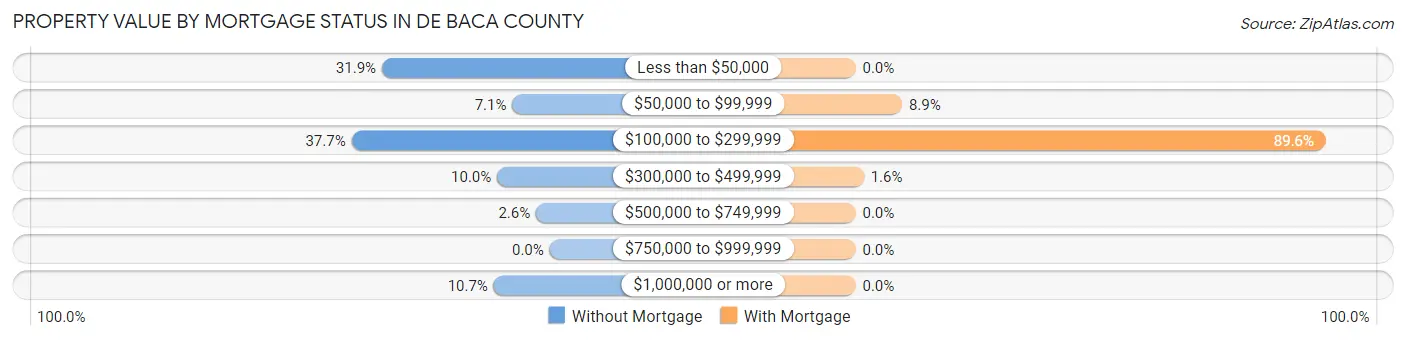
| Property Value | Without Mortgage | With Mortgage |
| Less than $50,000 | 99 (31.9%) | 0 (0.0%) |
| $50,000 to $99,999 | 22 (7.1%) | 17 (8.8%) |
| $100,000 to $299,999 | 117 (37.7%) | 172 (89.6%) |
| $300,000 to $499,999 | 31 (10.0%) | 3 (1.6%) |
| $500,000 to $749,999 | 8 (2.6%) | 0 (0.0%) |
| $750,000 to $999,999 | 0 (0.0%) | 0 (0.0%) |
| $1,000,000 or more | 33 (10.6%) | 0 (0.0%) |
| Total | 310 (100.0%) | 192 (100.0%) |
Household Income by Mortgage Status in De Baca County
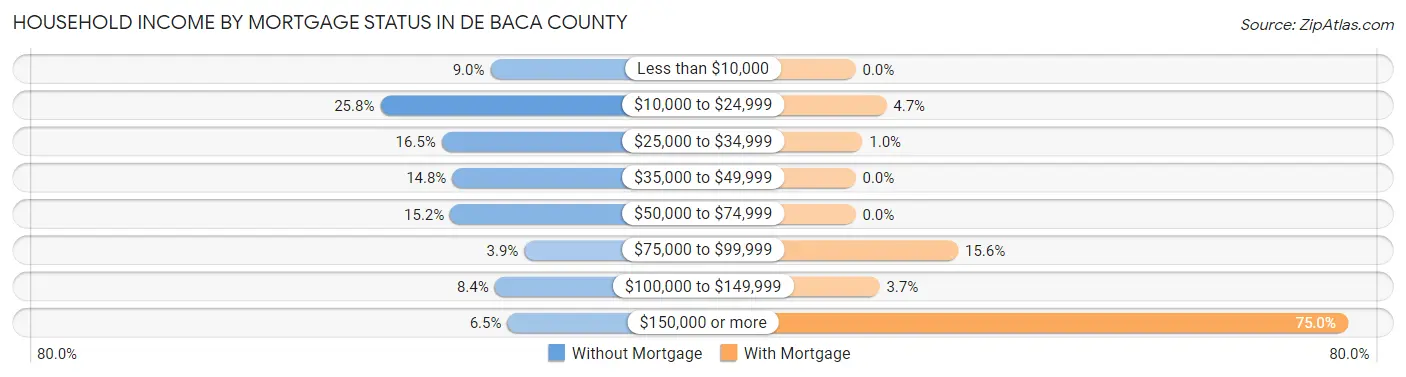
| Household Income | Without Mortgage | With Mortgage |
| Less than $10,000 | 28 (9.0%) | 0 (0.0%) |
| $10,000 to $24,999 | 80 (25.8%) | 9 (4.7%) |
| $25,000 to $34,999 | 51 (16.5%) | 2 (1.0%) |
| $35,000 to $49,999 | 46 (14.8%) | 0 (0.0%) |
| $50,000 to $74,999 | 47 (15.2%) | 0 (0.0%) |
| $75,000 to $99,999 | 12 (3.9%) | 30 (15.6%) |
| $100,000 to $149,999 | 26 (8.4%) | 7 (3.6%) |
| $150,000 or more | 20 (6.5%) | 144 (75.0%) |
| Total | 310 (100.0%) | 192 (100.0%) |
Property Value to Household Income Ratio in De Baca County
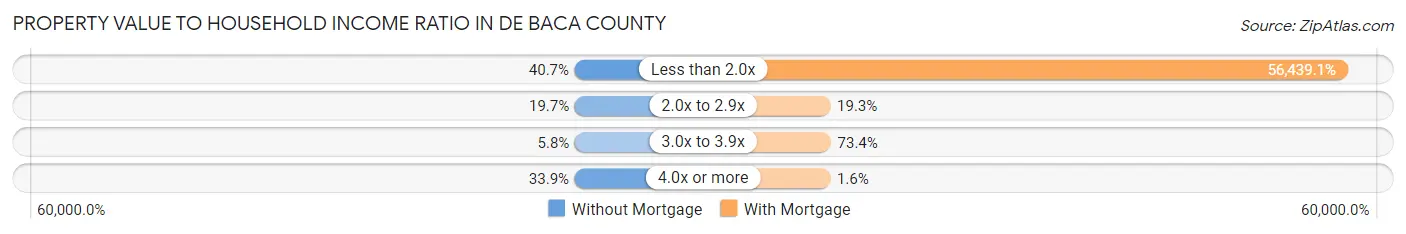
| Value-to-Income Ratio | Without Mortgage | With Mortgage |
| Less than 2.0x | 126 (40.6%) | 108,363 (56,439.1%) |
| 2.0x to 2.9x | 61 (19.7%) | 37 (19.3%) |
| 3.0x to 3.9x | 18 (5.8%) | 141 (73.4%) |
| 4.0x or more | 105 (33.9%) | 3 (1.6%) |
| Total | 310 (100.0%) | 192 (100.0%) |
Real Estate Taxes by Mortgage Status in De Baca County
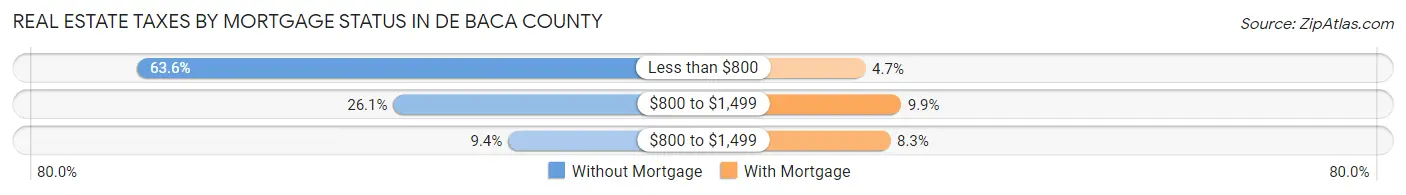
| Property Taxes | Without Mortgage | With Mortgage |
| Less than $800 | 197 (63.5%) | 9 (4.7%) |
| $800 to $1,499 | 81 (26.1%) | 19 (9.9%) |
| $800 to $1,499 | 29 (9.3%) | 16 (8.3%) |
| Total | 310 (100.0%) | 192 (100.0%) |
Health & Disability in De Baca County
Health Insurance Coverage by Age in De Baca County
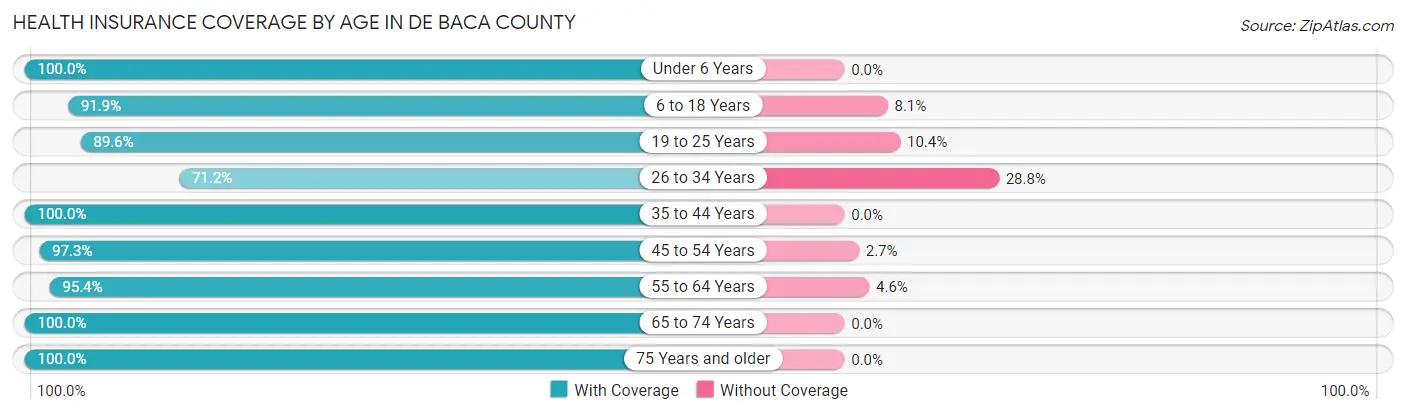
| Age Bracket | With Coverage | Without Coverage |
| Under 6 Years | 220 (100.0%) | 0 (0.0%) |
| 6 to 18 Years | 194 (91.9%) | 17 (8.1%) |
| 19 to 25 Years | 112 (89.6%) | 13 (10.4%) |
| 26 to 34 Years | 277 (71.2%) | 112 (28.8%) |
| 35 to 44 Years | 172 (100.0%) | 0 (0.0%) |
| 45 to 54 Years | 72 (97.3%) | 2 (2.7%) |
| 55 to 64 Years | 124 (95.4%) | 6 (4.6%) |
| 65 to 74 Years | 194 (100.0%) | 0 (0.0%) |
| 75 Years and older | 164 (100.0%) | 0 (0.0%) |
| Total | 1,529 (91.1%) | 150 (8.9%) |
Health Insurance Coverage by Citizenship Status in De Baca County
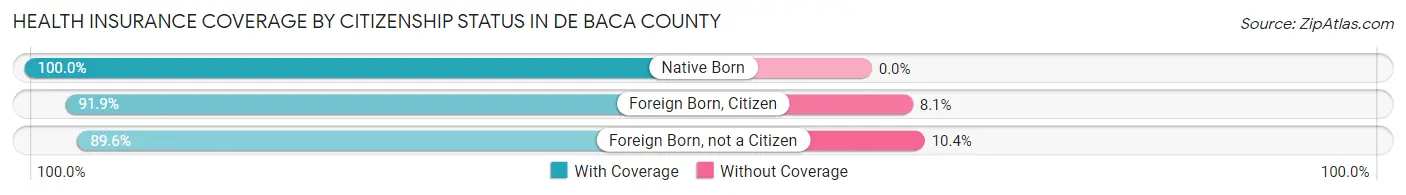
| Citizenship Status | With Coverage | Without Coverage |
| Native Born | 220 (100.0%) | 0 (0.0%) |
| Foreign Born, Citizen | 194 (91.9%) | 17 (8.1%) |
| Foreign Born, not a Citizen | 112 (89.6%) | 13 (10.4%) |
Health Insurance Coverage by Household Income in De Baca County
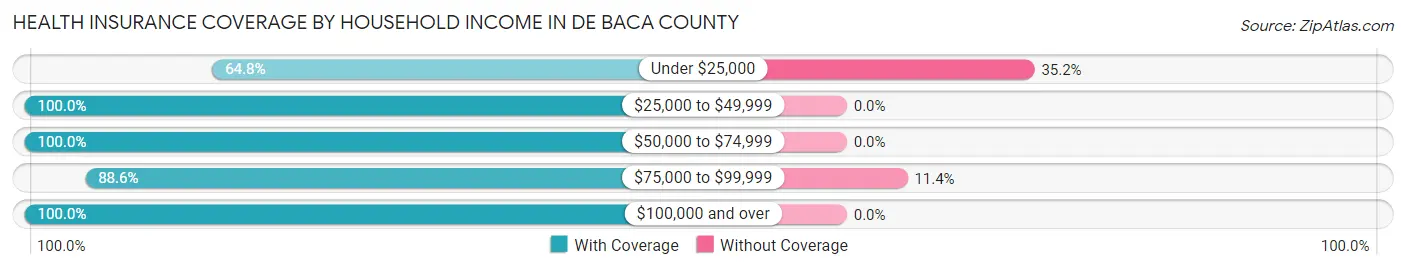
| Household Income | With Coverage | Without Coverage |
| Under $25,000 | 249 (64.8%) | 135 (35.2%) |
| $25,000 to $49,999 | 285 (100.0%) | 0 (0.0%) |
| $50,000 to $74,999 | 212 (100.0%) | 0 (0.0%) |
| $75,000 to $99,999 | 117 (88.6%) | 15 (11.4%) |
| $100,000 and over | 666 (100.0%) | 0 (0.0%) |
Public vs Private Health Insurance Coverage by Age in De Baca County
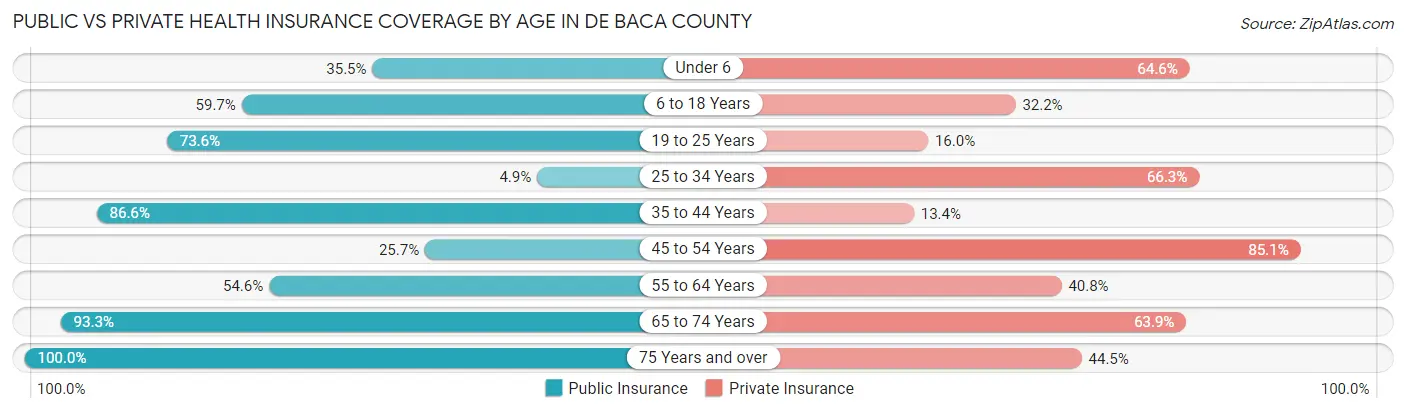
| Age Bracket | Public Insurance | Private Insurance |
| Under 6 | 78 (35.4%) | 142 (64.5%) |
| 6 to 18 Years | 126 (59.7%) | 68 (32.2%) |
| 19 to 25 Years | 92 (73.6%) | 20 (16.0%) |
| 25 to 34 Years | 19 (4.9%) | 258 (66.3%) |
| 35 to 44 Years | 149 (86.6%) | 23 (13.4%) |
| 45 to 54 Years | 19 (25.7%) | 63 (85.1%) |
| 55 to 64 Years | 71 (54.6%) | 53 (40.8%) |
| 65 to 74 Years | 181 (93.3%) | 124 (63.9%) |
| 75 Years and over | 164 (100.0%) | 73 (44.5%) |
| Total | 899 (53.5%) | 824 (49.1%) |
Disability Status by Sex by Age in De Baca County
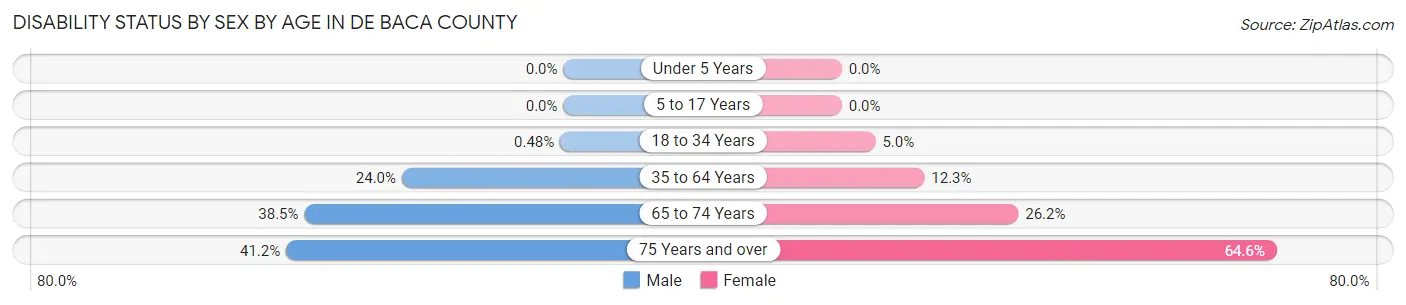
| Age Bracket | Male | Female |
| Under 5 Years | 0 (0.0%) | 0 (0.0%) |
| 5 to 17 Years | 0 (0.0%) | 0 (0.0%) |
| 18 to 34 Years | 2 (0.5%) | 5 (5.0%) |
| 35 to 64 Years | 53 (24.0%) | 19 (12.3%) |
| 65 to 74 Years | 35 (38.5%) | 27 (26.2%) |
| 75 Years and over | 28 (41.2%) | 62 (64.6%) |
Disability Class by Sex by Age in De Baca County
Disability Class: Hearing Difficulty
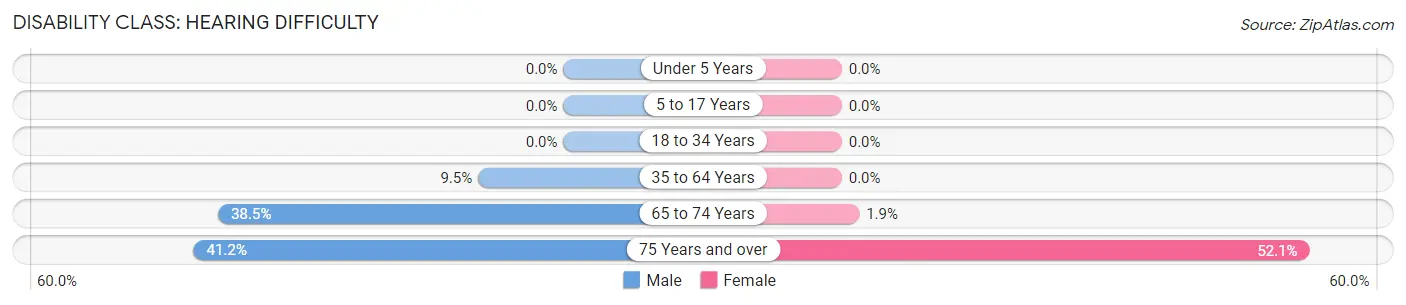
| Age Bracket | Male | Female |
| Under 5 Years | 0 (0.0%) | 0 (0.0%) |
| 5 to 17 Years | 0 (0.0%) | 0 (0.0%) |
| 18 to 34 Years | 0 (0.0%) | 0 (0.0%) |
| 35 to 64 Years | 21 (9.5%) | 0 (0.0%) |
| 65 to 74 Years | 35 (38.5%) | 2 (1.9%) |
| 75 Years and over | 28 (41.2%) | 50 (52.1%) |
Disability Class: Vision Difficulty
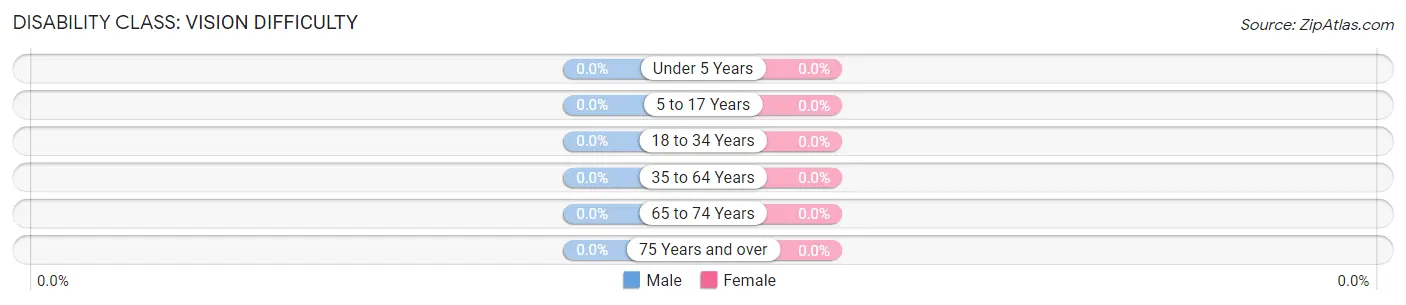
| Age Bracket | Male | Female |
| Under 5 Years | 0 (0.0%) | 0 (0.0%) |
| 5 to 17 Years | 0 (0.0%) | 0 (0.0%) |
| 18 to 34 Years | 0 (0.0%) | 0 (0.0%) |
| 35 to 64 Years | 0 (0.0%) | 0 (0.0%) |
| 65 to 74 Years | 0 (0.0%) | 0 (0.0%) |
| 75 Years and over | 0 (0.0%) | 0 (0.0%) |
Disability Class: Cognitive Difficulty
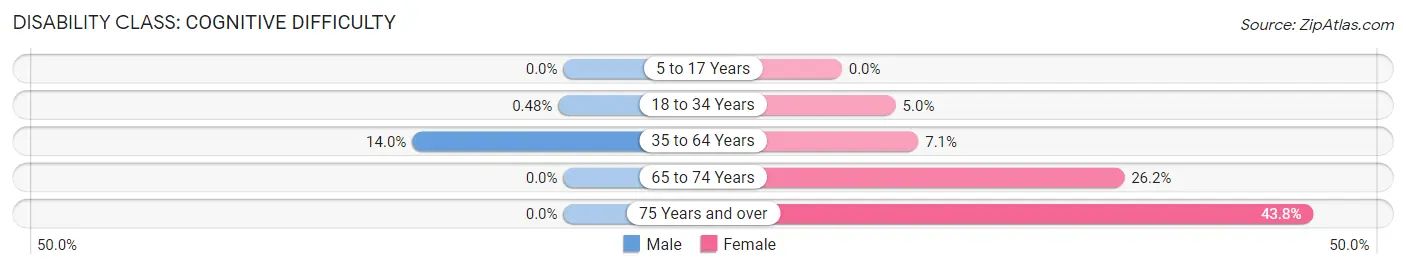
| Age Bracket | Male | Female |
| 5 to 17 Years | 0 (0.0%) | 0 (0.0%) |
| 18 to 34 Years | 2 (0.5%) | 5 (5.0%) |
| 35 to 64 Years | 31 (14.0%) | 11 (7.1%) |
| 65 to 74 Years | 0 (0.0%) | 27 (26.2%) |
| 75 Years and over | 0 (0.0%) | 42 (43.8%) |
Disability Class: Ambulatory Difficulty
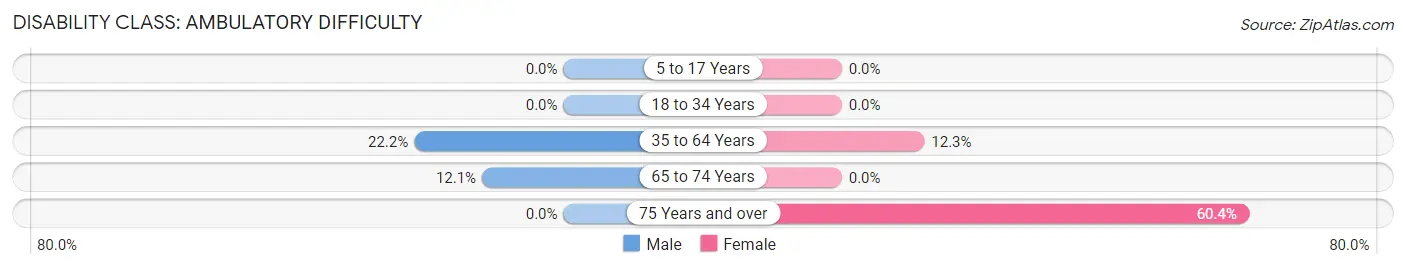
| Age Bracket | Male | Female |
| 5 to 17 Years | 0 (0.0%) | 0 (0.0%) |
| 18 to 34 Years | 0 (0.0%) | 0 (0.0%) |
| 35 to 64 Years | 49 (22.2%) | 19 (12.3%) |
| 65 to 74 Years | 11 (12.1%) | 0 (0.0%) |
| 75 Years and over | 0 (0.0%) | 58 (60.4%) |
Disability Class: Self-Care Difficulty
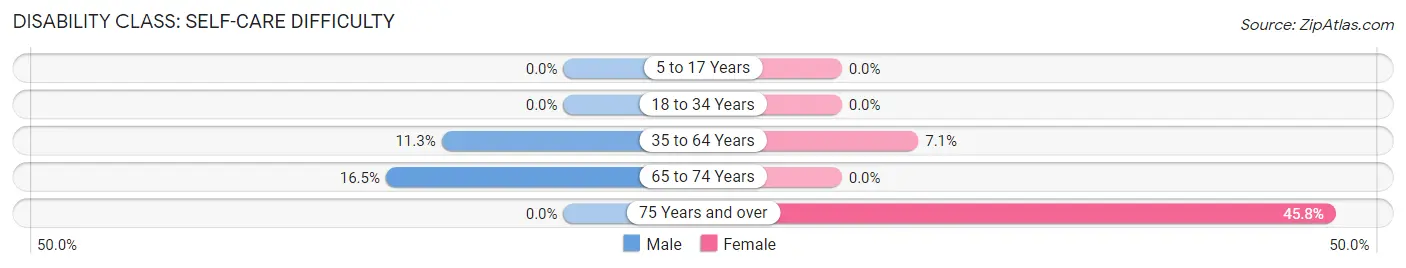
| Age Bracket | Male | Female |
| 5 to 17 Years | 0 (0.0%) | 0 (0.0%) |
| 18 to 34 Years | 0 (0.0%) | 0 (0.0%) |
| 35 to 64 Years | 25 (11.3%) | 11 (7.1%) |
| 65 to 74 Years | 15 (16.5%) | 0 (0.0%) |
| 75 Years and over | 0 (0.0%) | 44 (45.8%) |
Technology Access in De Baca County
Computing Device Access in De Baca County
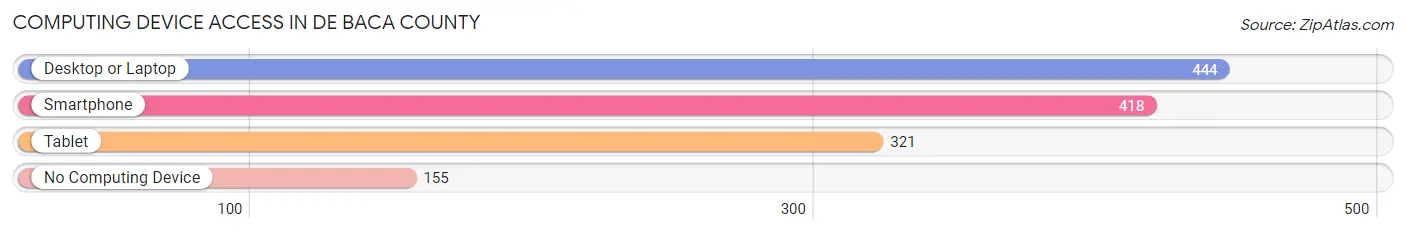
| Device Type | # Households | % Households |
| Desktop or Laptop | 444 | 59.9% |
| Smartphone | 418 | 56.4% |
| Tablet | 321 | 43.3% |
| No Computing Device | 155 | 20.9% |
| Total | 741 | 100.0% |
Internet Access in De Baca County
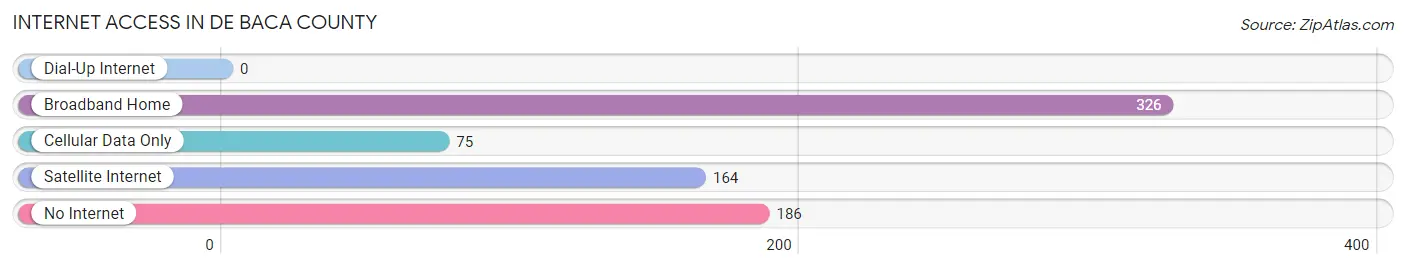
| Internet Type | # Households | % Households |
| Dial-Up Internet | 0 | 0.0% |
| Broadband Home | 326 | 44.0% |
| Cellular Data Only | 75 | 10.1% |
| Satellite Internet | 164 | 22.1% |
| No Internet | 186 | 25.1% |
| Total | 741 | 100.0% |
De Baca County Summary
De Baca County is a county located in the state of New Mexico, United States. As of the 2010 census, the population was 2,022, making it the least populous county in the state. The county seat is Fort Sumner. The county was created in 1917 from the eastern portion of Lincoln County.
Geography
De Baca County is located in the eastern part of the state of New Mexico. It is bordered by Chaves County to the north, Roosevelt County to the east, Curry County to the south, and Lincoln County to the west. The county covers an area of 1,945 square miles, making it the fifth-largest county in the state. The county is mostly flat, with some rolling hills in the western part. The Pecos River runs through the county, and there are several small lakes and reservoirs in the area.
The county is part of the Llano Estacado, a large region of flat land in the southwestern United States. The county is also part of the High Plains, a region of the Great Plains that extends from Texas to South Dakota. The county is mostly covered in shortgrass prairie, with some areas of sand dunes and sagebrush.
Demographics
As of the 2010 census, there were 2,022 people, 745 households, and 545 families living in the county. The population density was 1.1 people per square mile. The racial makeup of the county was 79.2% White, 0.7% Black or African American, 0.7% Native American, 0.2% Asian, 0.1% Pacific Islander, 16.2% from other races, and 2.9% from two or more races. Hispanic or Latino of any race were 44.2% of the population.
The median income for a household in the county was $30,938, and the median income for a family was $35,000. The per capita income for the county was $14,845. About 18.2% of families and 22.2% of the population were below the poverty line, including 28.2% of those under age 18 and 16.2% of those age 65 or over.
Economy
The economy of De Baca County is largely based on agriculture and ranching. The county is home to several large cattle ranches, and the county is known for its production of beef and dairy products. The county also produces wheat, corn, and hay.
The county is also home to several oil and gas fields, and the county is a major producer of oil and natural gas. The county is also home to several wind farms, which provide electricity to the region.
The county is home to several small businesses, including restaurants, stores, and other services. The county is also home to several tourist attractions, including the Fort Sumner Historic Site and the Billy the Kid Museum.
Conclusion
De Baca County is a rural county located in the eastern part of New Mexico. The county is mostly flat, with some rolling hills in the western part. The county is home to several large cattle ranches, and the county is known for its production of beef and dairy products. The county is also home to several oil and gas fields, and the county is a major producer of oil and natural gas. The county is also home to several small businesses, including restaurants, stores, and other services. The county is also home to several tourist attractions, including the Fort Sumner Historic Site and the Billy the Kid Museum.
Common Questions
What is Per Capita Income in De Baca County?
Per Capita income in De Baca County is $27,710.
What is the Median Family Income in De Baca County?
Median Family Income in De Baca County is $78,013.
What is the Median Household income in De Baca County?
Median Household Income in De Baca County is $34,702.
What is Income or Wage Gap in De Baca County?
Income or Wage Gap in De Baca County is 18.3%.
Women in De Baca County earn 81.7 cents for every dollar earned by a man.
What is Inequality or Gini Index in De Baca County?
Inequality or Gini Index in De Baca County is 0.45.
What is the Total Population of De Baca County?
Total Population of De Baca County is 1,695.
What is the Total Male Population of De Baca County?
Total Male Population of De Baca County is 1,063.
What is the Total Female Population of De Baca County?
Total Female Population of De Baca County is 632.
What is the Ratio of Males per 100 Females in De Baca County?
There are 168.20 Males per 100 Females in De Baca County.
What is the Ratio of Females per 100 Males in De Baca County?
There are 59.45 Females per 100 Males in De Baca County.
What is the Median Population Age in De Baca County?
Median Population Age in De Baca County is 28.5 Years.
What is the Average Family Size in De Baca County
Average Family Size in De Baca County is 3.5 People.
What is the Average Household Size in De Baca County
Average Household Size in De Baca County is 2.3 People.
How Large is the Labor Force in De Baca County?
There are 797 People in the Labor Forcein in De Baca County.
What is the Percentage of People in the Labor Force in De Baca County?
60.9% of People are in the Labor Force in De Baca County.
What is the Unemployment Rate in De Baca County?
Unemployment Rate in De Baca County is 8.5%.