Catron County, NM Map & Demographics
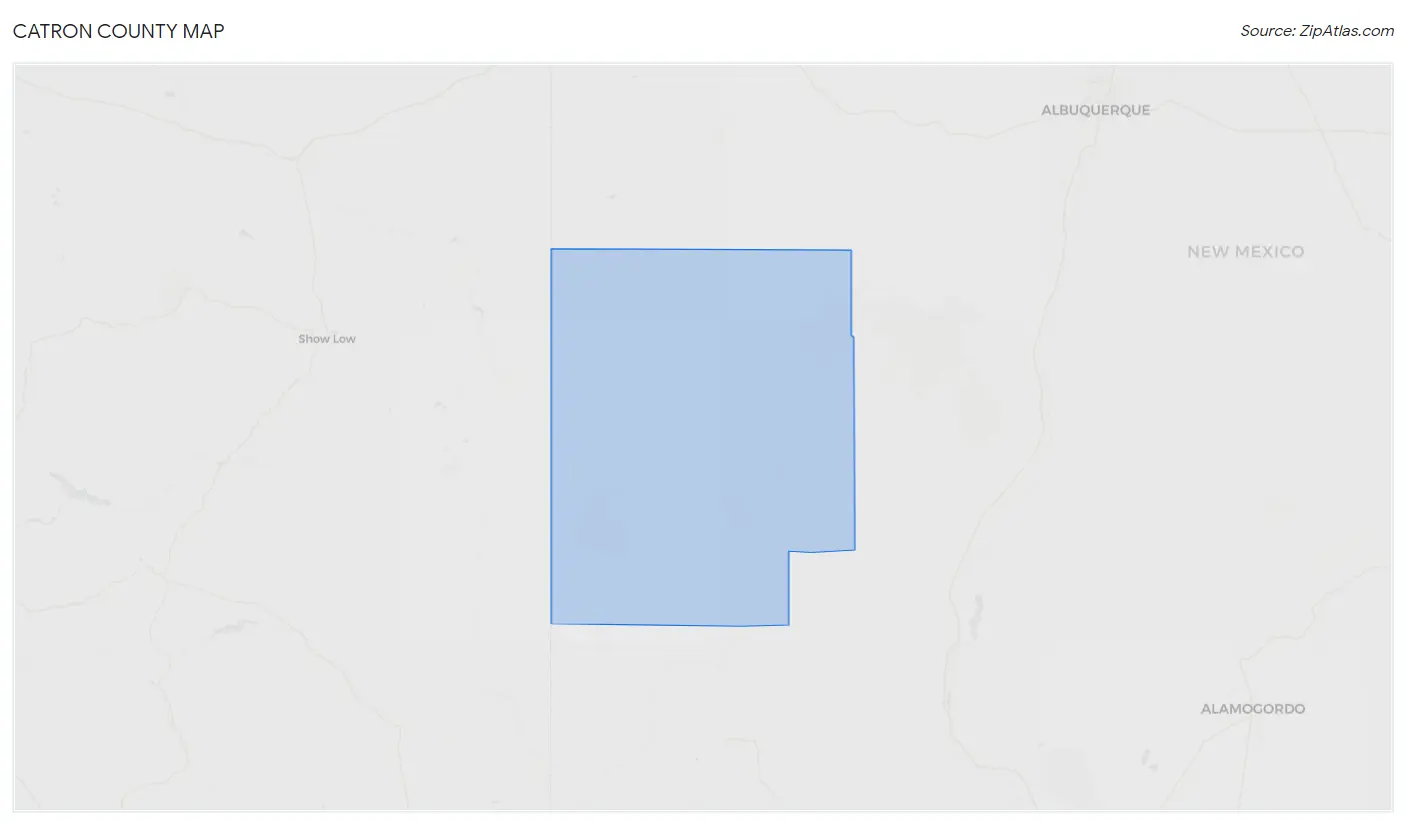
Catron County Map
Catron County Overview
$26,678
PER CAPITA INCOME
$60,273
AVG FAMILY INCOME
$44,777
AVG HOUSEHOLD INCOME
15.4%
WAGE / INCOME GAP [ % ]
84.6¢/ $1
WAGE / INCOME GAP [ $ ]
$2,776
FAMILY INCOME DEFICIT
0.41
INEQUALITY / GINI INDEX
3,635
TOTAL POPULATION
1,903
MALE POPULATION
1,732
FEMALE POPULATION
109.87
MALES / 100 FEMALES
91.01
FEMALES / 100 MALES
59.5
MEDIAN AGE
2.9
AVG FAMILY SIZE
2.1
AVG HOUSEHOLD SIZE
1,019
LABOR FORCE [ PEOPLE ]
30.7%
PERCENT IN LABOR FORCE
5.7%
UNEMPLOYMENT RATE
Income in Catron County
Income Overview in Catron County
Per Capita Income in Catron County is $26,678, while median incomes of families and households are $60,273 and $44,777 respectively.
| Characteristic | Number | Measure |
| Per Capita Income | 3,635 | $26,678 |
| Median Family Income | 835 | $60,273 |
| Mean Family Income | 835 | $65,567 |
| Median Household Income | 1,609 | $44,777 |
| Mean Household Income | 1,609 | $55,132 |
| Income Deficit | 835 | $2,776 |
| Wage / Income Gap (%) | 3,635 | 15.43% |
| Wage / Income Gap ($) | 3,635 | 84.57¢ per $1 |
| Gini / Inequality Index | 3,635 | 0.41 |
Earnings by Sex in Catron County
Average Earnings in Catron County are $26,942, $30,977 for men and $26,196 for women, a difference of 15.4%.
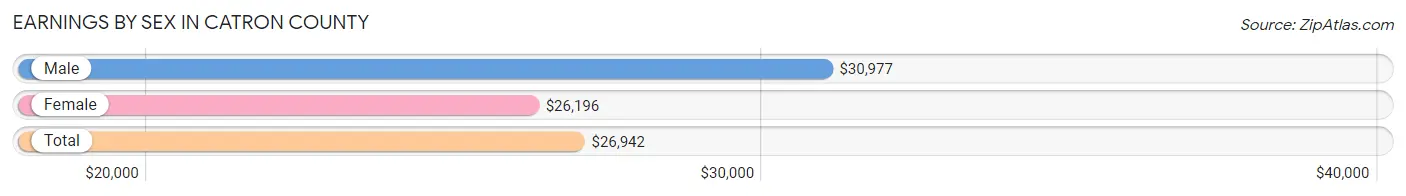
| Sex | Number | Average Earnings |
| Male | 509 (43.6%) | $30,977 |
| Female | 658 (56.4%) | $26,196 |
| Total | 1,167 (100.0%) | $26,942 |
Earnings by Sex by Income Bracket in Catron County
The most common earnings brackets in Catron County are $7,500 to $9,999 for men (74 | 14.5%) and $25,000 to $29,999 for women (138 | 21.0%).
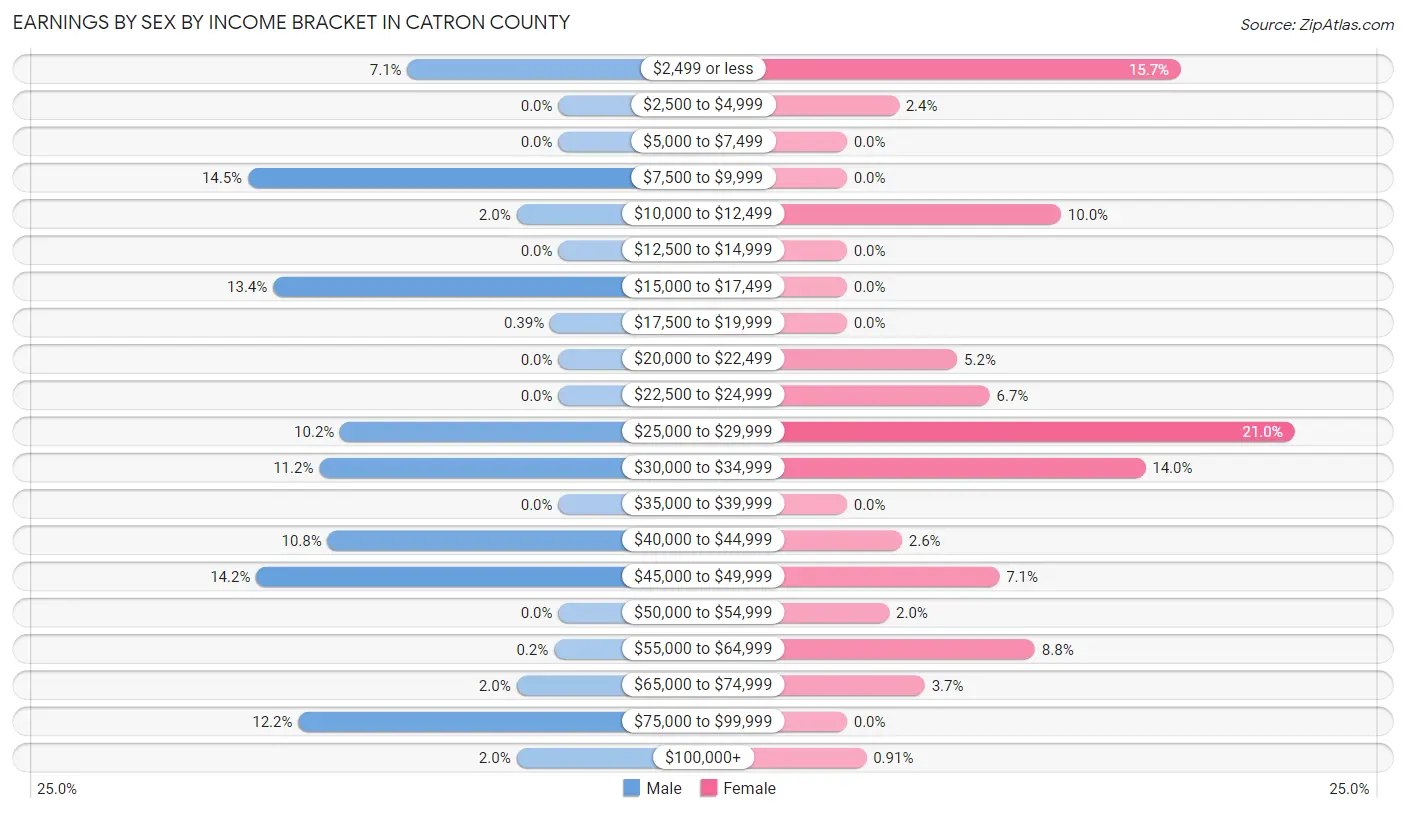
| Income | Male | Female |
| $2,499 or less | 36 (7.1%) | 103 (15.7%) |
| $2,500 to $4,999 | 0 (0.0%) | 16 (2.4%) |
| $5,000 to $7,499 | 0 (0.0%) | 0 (0.0%) |
| $7,500 to $9,999 | 74 (14.5%) | 0 (0.0%) |
| $10,000 to $12,499 | 10 (2.0%) | 66 (10.0%) |
| $12,500 to $14,999 | 0 (0.0%) | 0 (0.0%) |
| $15,000 to $17,499 | 68 (13.4%) | 0 (0.0%) |
| $17,500 to $19,999 | 2 (0.4%) | 0 (0.0%) |
| $20,000 to $22,499 | 0 (0.0%) | 34 (5.2%) |
| $22,500 to $24,999 | 0 (0.0%) | 44 (6.7%) |
| $25,000 to $29,999 | 52 (10.2%) | 138 (21.0%) |
| $30,000 to $34,999 | 57 (11.2%) | 92 (14.0%) |
| $35,000 to $39,999 | 0 (0.0%) | 0 (0.0%) |
| $40,000 to $44,999 | 55 (10.8%) | 17 (2.6%) |
| $45,000 to $49,999 | 72 (14.1%) | 47 (7.1%) |
| $50,000 to $54,999 | 0 (0.0%) | 13 (2.0%) |
| $55,000 to $64,999 | 1 (0.2%) | 58 (8.8%) |
| $65,000 to $74,999 | 10 (2.0%) | 24 (3.6%) |
| $75,000 to $99,999 | 62 (12.2%) | 0 (0.0%) |
| $100,000+ | 10 (2.0%) | 6 (0.9%) |
| Total | 509 (100.0%) | 658 (100.0%) |
Earnings by Sex by Educational Attainment in Catron County
Average earnings in Catron County are $41,000 for men and $27,113 for women, a difference of 33.9%. Men with an educational attainment of college or associate's degree enjoy the highest average annual earnings of $45,400, while those with college or associate's degree education earn the least with $45,400. Women with an educational attainment of graduate degree earn the most with the average annual earnings of $59,519, while those with high school diploma education have the smallest earnings of $26,614.
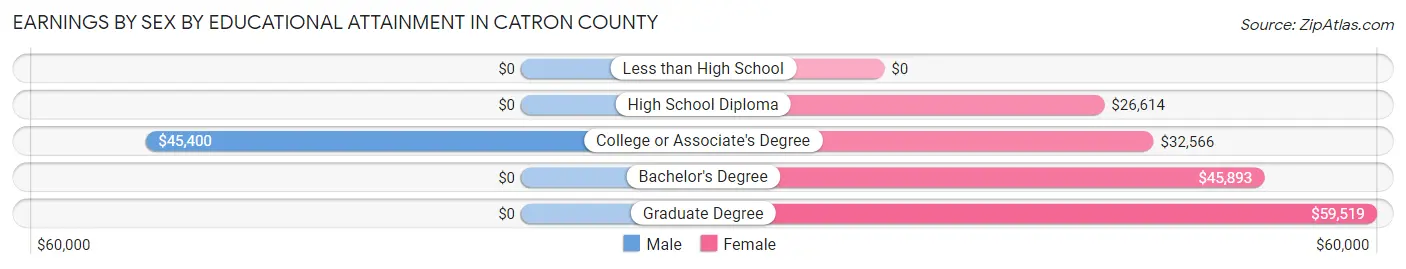
| Educational Attainment | Male Income | Female Income |
| Less than High School | - | - |
| High School Diploma | - | - |
| College or Associate's Degree | $45,400 | $32,566 |
| Bachelor's Degree | - | - |
| Graduate Degree | - | - |
| Total | $41,000 | $27,113 |
Family Income in Catron County
Family Income Brackets in Catron County
According to the Catron County family income data, there are 231 families falling into the $50,000 to $74,999 income range, which is the most common income bracket and makes up 27.7% of all families.
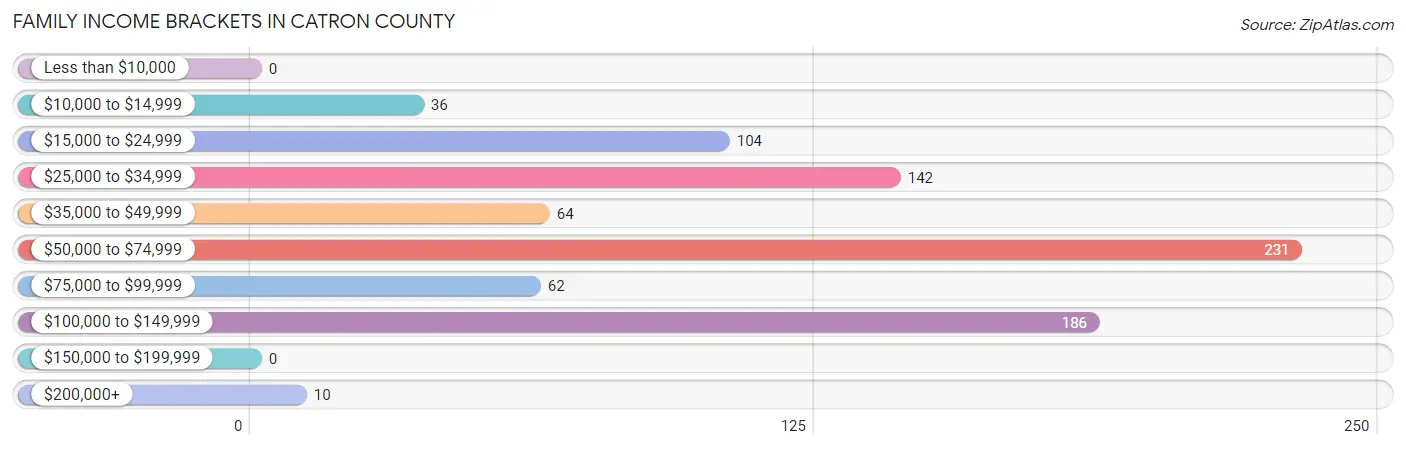
| Income Bracket | # Families | % Families |
| Less than $10,000 | 0 | 0.0% |
| $10,000 to $14,999 | 36 | 4.3% |
| $15,000 to $24,999 | 104 | 12.5% |
| $25,000 to $34,999 | 142 | 17.0% |
| $35,000 to $49,999 | 64 | 7.7% |
| $50,000 to $74,999 | 231 | 27.7% |
| $75,000 to $99,999 | 62 | 7.4% |
| $100,000 to $149,999 | 186 | 22.3% |
| $150,000 to $199,999 | 0 | 0.0% |
| $200,000+ | 10 | 1.2% |
Family Income by Famaliy Size in Catron County
2-person families (654 | 78.3%) account for the highest median family income in Catron County with $61,563 per family, while 2-person families (654 | 78.3%) have the highest median income of $30,782 per family member.
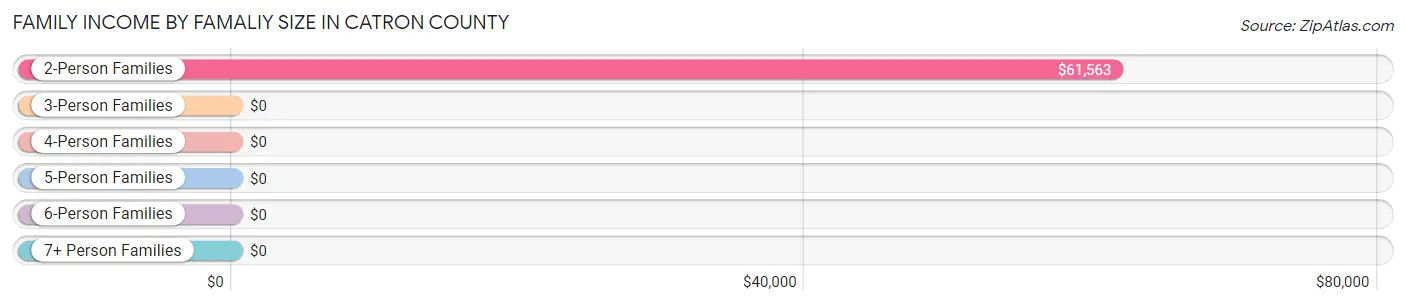
| Income Bracket | # Families | Median Income |
| 2-Person Families | 654 (78.3%) | $61,563 |
| 3-Person Families | 31 (3.7%) | $0 |
| 4-Person Families | 101 (12.1%) | $0 |
| 5-Person Families | 38 (4.5%) | $0 |
| 6-Person Families | 8 (1.0%) | $0 |
| 7+ Person Families | 3 (0.4%) | $0 |
| Total | 835 (100.0%) | $60,273 |
Family Income by Number of Earners in Catron County
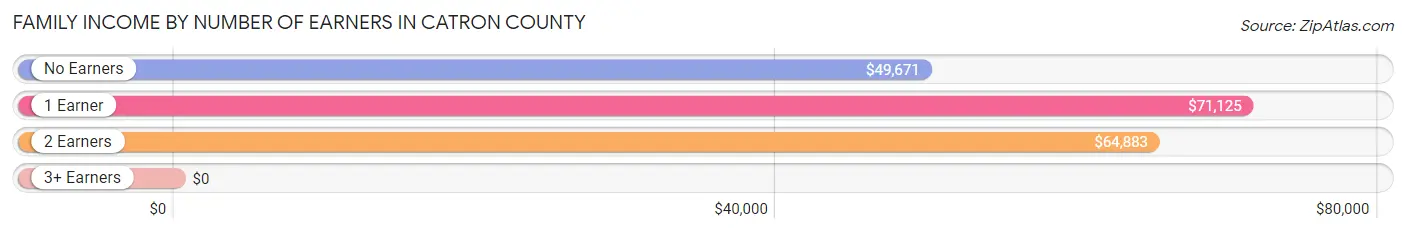
| Number of Earners | # Families | Median Income |
| No Earners | 421 (50.4%) | $49,671 |
| 1 Earner | 175 (21.0%) | $71,125 |
| 2 Earners | 239 (28.6%) | $64,883 |
| 3+ Earners | 0 (0.0%) | $0 |
| Total | 835 (100.0%) | $60,273 |
Household Income in Catron County
Household Income Brackets in Catron County
With 320 households falling in the category, the $50,000 to $74,999 income range is the most frequent in Catron County, accounting for 19.9% of all households. In contrast, only 10 households (0.6%) fall into the $200,000+ income bracket, making it the least populous group.
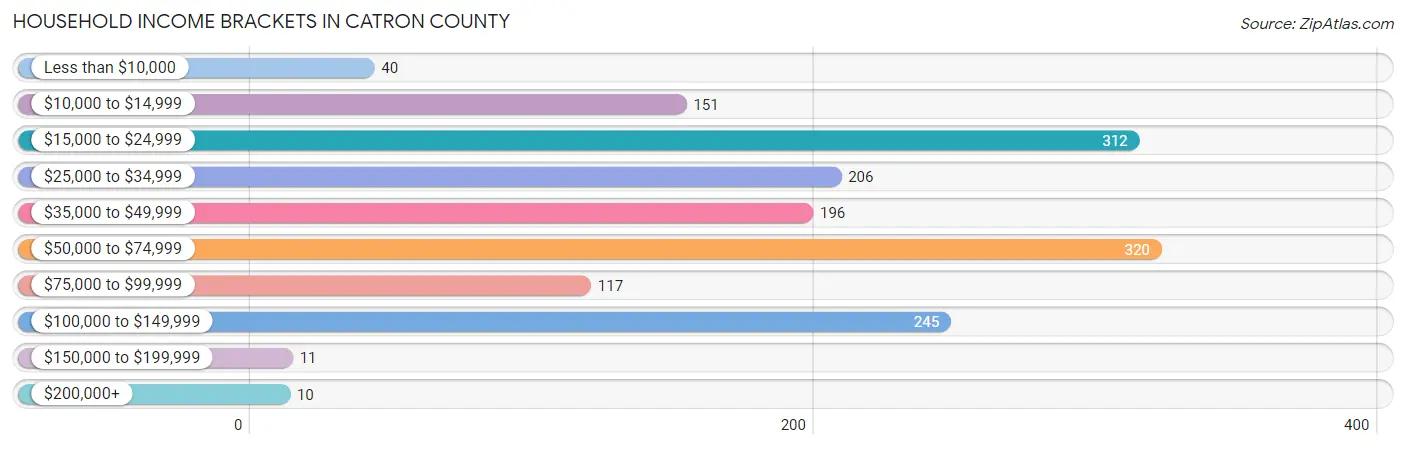
| Income Bracket | # Households | % Households |
| Less than $10,000 | 40 | 2.5% |
| $10,000 to $14,999 | 151 | 9.4% |
| $15,000 to $24,999 | 312 | 19.4% |
| $25,000 to $34,999 | 206 | 12.8% |
| $35,000 to $49,999 | 196 | 12.2% |
| $50,000 to $74,999 | 320 | 19.9% |
| $75,000 to $99,999 | 117 | 7.3% |
| $100,000 to $149,999 | 245 | 15.2% |
| $150,000 to $199,999 | 11 | 0.7% |
| $200,000+ | 10 | 0.6% |
Household Income by Householder Age in Catron County
The median household income in Catron County is $44,777, with the highest median household income of $59,904 found in the 45 to 64 years age bracket for the primary householder. A total of 357 households (22.2%) fall into this category. Meanwhile, the 15 to 24 years age bracket for the primary householder has the lowest median household income of $0, with 6 households (0.4%) in this group.
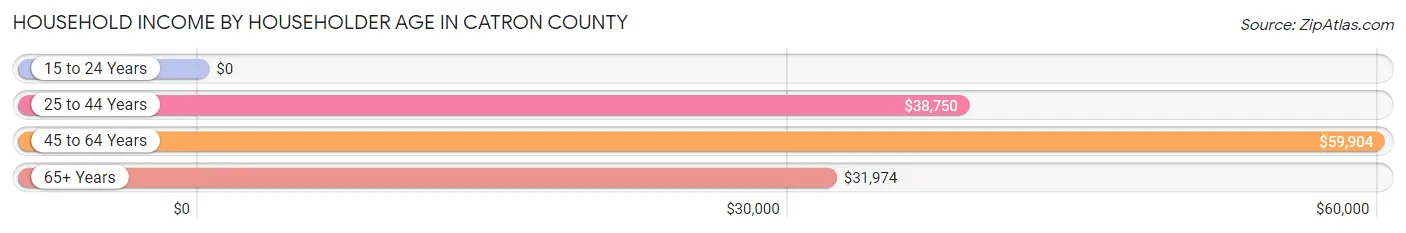
| Income Bracket | # Households | Median Income |
| 15 to 24 Years | 6 (0.4%) | $0 |
| 25 to 44 Years | 164 (10.2%) | $38,750 |
| 45 to 64 Years | 357 (22.2%) | $59,904 |
| 65+ Years | 1,082 (67.2%) | $31,974 |
| Total | 1,609 (100.0%) | $44,777 |
Poverty in Catron County
Income Below Poverty by Sex and Age in Catron County
With 13.4% poverty level for males and 29.6% for females among the residents of Catron County, 6 to 11 year old males and 5 year old females are the most vulnerable to poverty, with 9 males (30.0%) and 9 females (100.0%) in their respective age groups living below the poverty level.
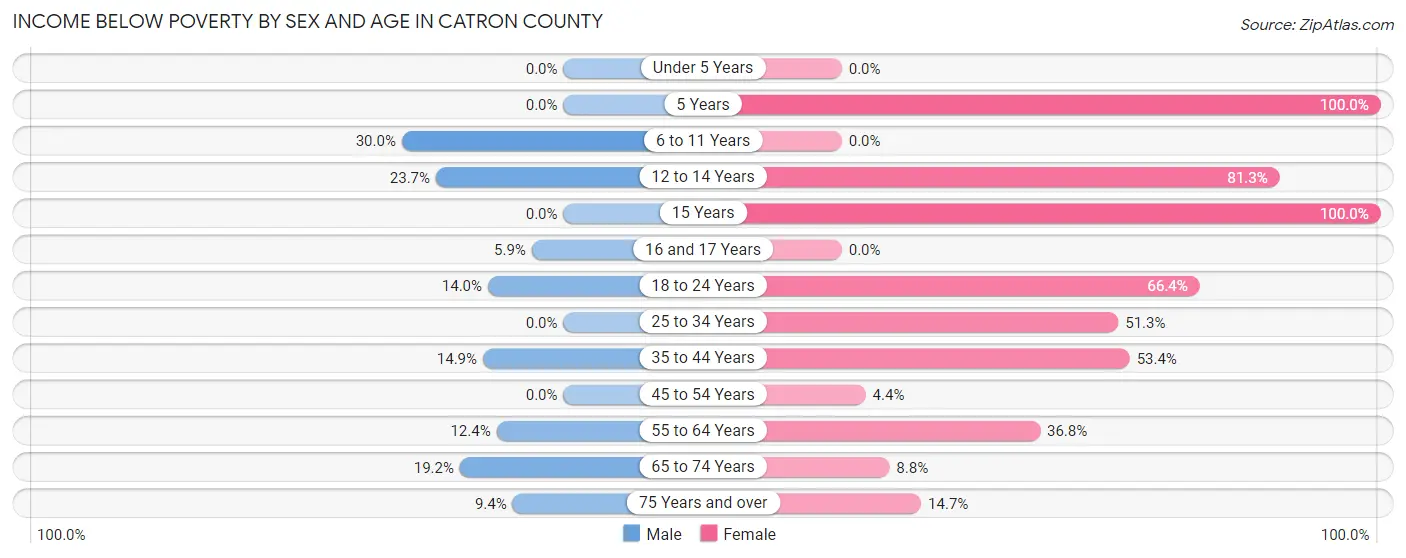
| Age Bracket | Male | Female |
| Under 5 Years | 0 (0.0%) | 0 (0.0%) |
| 5 Years | 0 (0.0%) | 9 (100.0%) |
| 6 to 11 Years | 9 (30.0%) | 0 (0.0%) |
| 12 to 14 Years | 31 (23.7%) | 65 (81.2%) |
| 15 Years | 0 (0.0%) | 4 (100.0%) |
| 16 and 17 Years | 4 (5.9%) | 0 (0.0%) |
| 18 to 24 Years | 22 (14.0%) | 87 (66.4%) |
| 25 to 34 Years | 0 (0.0%) | 39 (51.3%) |
| 35 to 44 Years | 23 (14.9%) | 101 (53.4%) |
| 45 to 54 Years | 0 (0.0%) | 9 (4.4%) |
| 55 to 64 Years | 35 (12.4%) | 110 (36.8%) |
| 65 to 74 Years | 84 (19.2%) | 26 (8.8%) |
| 75 Years and over | 46 (9.4%) | 52 (14.7%) |
| Total | 254 (13.4%) | 502 (29.6%) |
Income Above Poverty by Sex and Age in Catron County
According to the poverty statistics in Catron County, males aged under 5 years and females aged 6 to 11 years are the age groups that are most secure financially, with 100.0% of males and 100.0% of females in these age groups living above the poverty line.
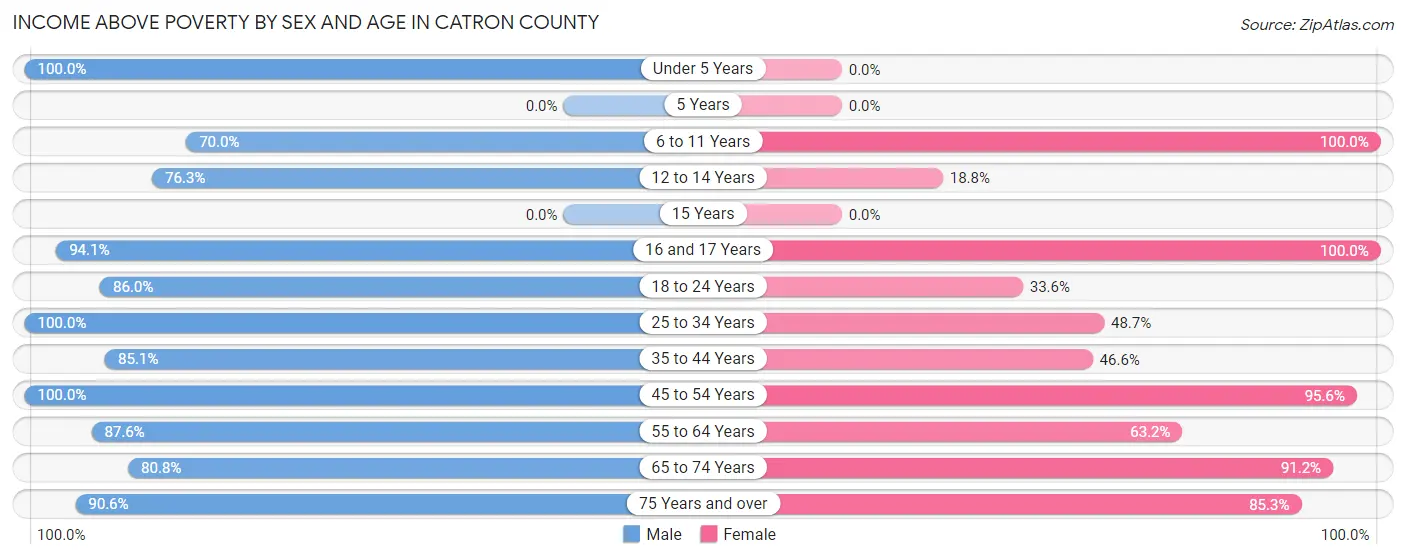
| Age Bracket | Male | Female |
| Under 5 Years | 6 (100.0%) | 0 (0.0%) |
| 5 Years | 0 (0.0%) | 0 (0.0%) |
| 6 to 11 Years | 21 (70.0%) | 20 (100.0%) |
| 12 to 14 Years | 100 (76.3%) | 15 (18.8%) |
| 15 Years | 0 (0.0%) | 0 (0.0%) |
| 16 and 17 Years | 64 (94.1%) | 39 (100.0%) |
| 18 to 24 Years | 135 (86.0%) | 44 (33.6%) |
| 25 to 34 Years | 59 (100.0%) | 37 (48.7%) |
| 35 to 44 Years | 131 (85.1%) | 88 (46.6%) |
| 45 to 54 Years | 85 (100.0%) | 194 (95.6%) |
| 55 to 64 Years | 247 (87.6%) | 189 (63.2%) |
| 65 to 74 Years | 353 (80.8%) | 268 (91.2%) |
| 75 Years and over | 442 (90.6%) | 301 (85.3%) |
| Total | 1,643 (86.6%) | 1,195 (70.4%) |
Income Below Poverty Among Married-Couple Families in Catron County
The poverty statistics for married-couple families in Catron County show that 11.9% or 85 of the total 714 families live below the poverty line. Families with 1 or 2 children have the highest poverty rate of 56.6%, comprising of 69 families. On the other hand, families with 3 or 4 children have the lowest poverty rate of 0.0%, which includes 0 families.
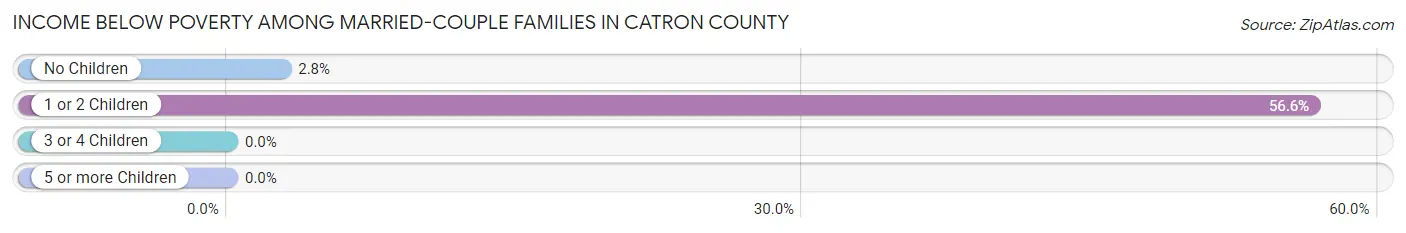
| Children | Above Poverty | Below Poverty |
| No Children | 559 (97.2%) | 16 (2.8%) |
| 1 or 2 Children | 53 (43.4%) | 69 (56.6%) |
| 3 or 4 Children | 17 (100.0%) | 0 (0.0%) |
| 5 or more Children | 0 (0.0%) | 0 (0.0%) |
| Total | 629 (88.1%) | 85 (11.9%) |
Income Below Poverty Among Single-Parent Households in Catron County
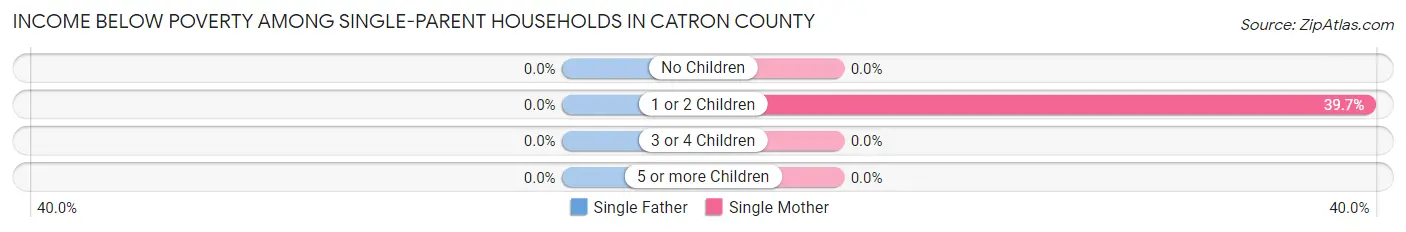
| Children | Single Father | Single Mother |
| No Children | 0 (0.0%) | 0 (0.0%) |
| 1 or 2 Children | 0 (0.0%) | 23 (39.7%) |
| 3 or 4 Children | 0 (0.0%) | 0 (0.0%) |
| 5 or more Children | 0 (0.0%) | 0 (0.0%) |
| Total | 0 (0.0%) | 23 (22.3%) |
Income Below Poverty Among Married-Couple vs Single-Parent Households in Catron County
The poverty data for Catron County shows that 85 of the married-couple family households (11.9%) and 23 of the single-parent households (19.0%) are living below the poverty level. Within the married-couple family households, those with 1 or 2 children have the highest poverty rate, with 69 households (56.6%) falling below the poverty line. Among the single-parent households, those with 1 or 2 children have the highest poverty rate, with 23 household (39.7%) living below poverty.
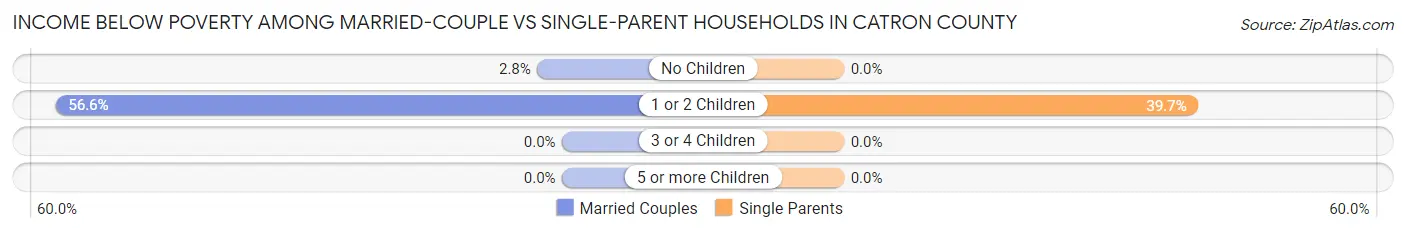
| Children | Married-Couple Families | Single-Parent Households |
| No Children | 16 (2.8%) | 0 (0.0%) |
| 1 or 2 Children | 69 (56.6%) | 23 (39.7%) |
| 3 or 4 Children | 0 (0.0%) | 0 (0.0%) |
| 5 or more Children | 0 (0.0%) | 0 (0.0%) |
| Total | 85 (11.9%) | 23 (19.0%) |
Race in Catron County
The most populous races in Catron County are White / Caucasian (3,228 | 88.8%), Hispanic or Latino (563 | 15.5%), and Two or more Races (247 | 6.8%).
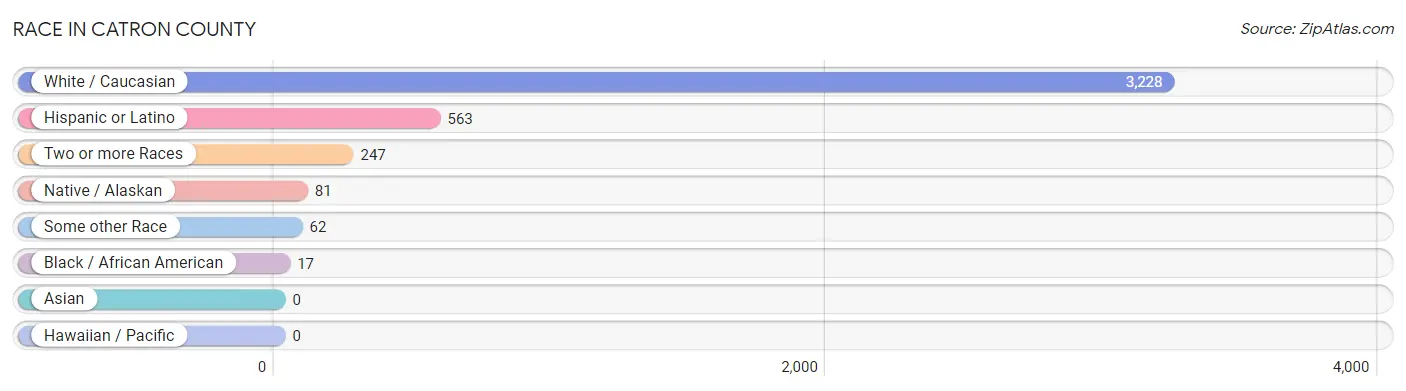
| Race | # Population | % Population |
| Asian | 0 | 0.0% |
| Black / African American | 17 | 0.5% |
| Hawaiian / Pacific | 0 | 0.0% |
| Hispanic or Latino | 563 | 15.5% |
| Native / Alaskan | 81 | 2.2% |
| White / Caucasian | 3,228 | 88.8% |
| Two or more Races | 247 | 6.8% |
| Some other Race | 62 | 1.7% |
| Total | 3,635 | 100.0% |
Ancestry in Catron County
The most populous ancestries reported in Catron County are English (528 | 14.5%), German (432 | 11.9%), Irish (325 | 8.9%), Mexican (196 | 5.4%), and American (187 | 5.1%), together accounting for 45.9% of all Catron County residents.
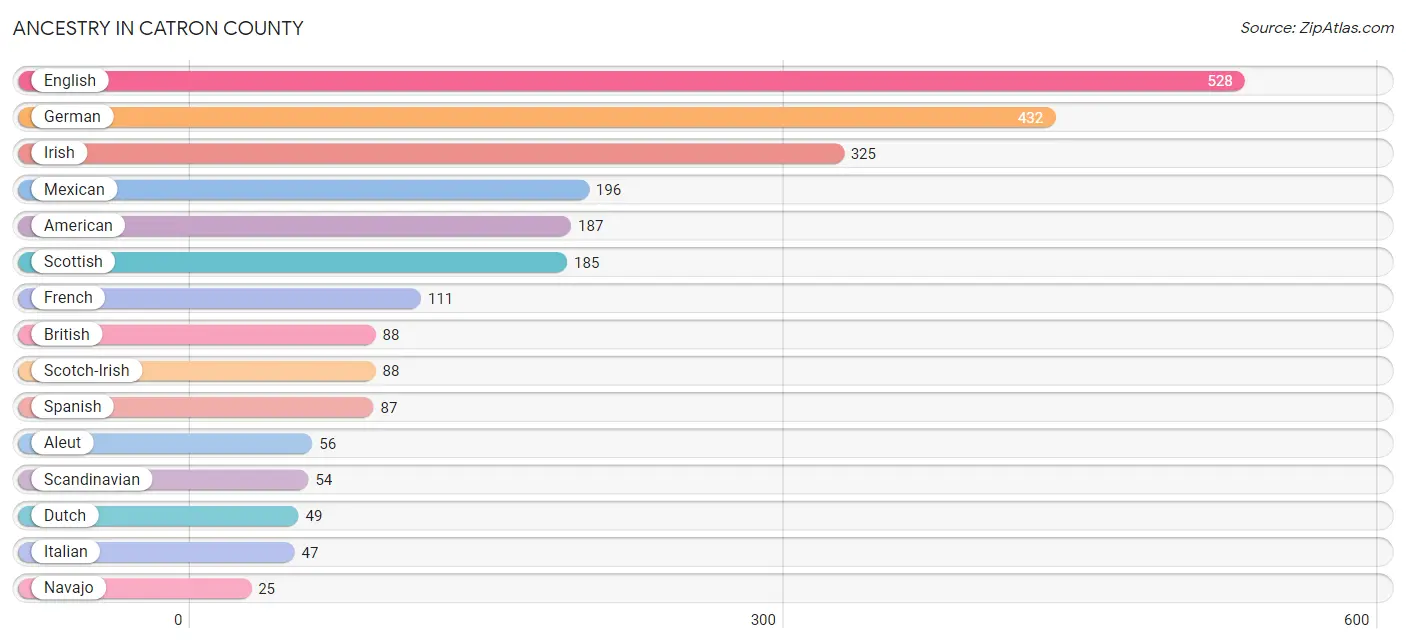
| Ancestry | # Population | % Population |
| African | 5 | 0.1% |
| Aleut | 56 | 1.5% |
| American | 187 | 5.1% |
| Basque | 10 | 0.3% |
| British | 88 | 2.4% |
| Cherokee | 19 | 0.5% |
| Choctaw | 12 | 0.3% |
| Colombian | 14 | 0.4% |
| Dutch | 49 | 1.3% |
| English | 528 | 14.5% |
| European | 20 | 0.5% |
| French | 111 | 3.0% |
| German | 432 | 11.9% |
| Greek | 6 | 0.2% |
| Irish | 325 | 8.9% |
| Italian | 47 | 1.3% |
| Mexican | 196 | 5.4% |
| Navajo | 25 | 0.7% |
| Northern European | 8 | 0.2% |
| Norwegian | 14 | 0.4% |
| Polish | 13 | 0.4% |
| Scandinavian | 54 | 1.5% |
| Scotch-Irish | 88 | 2.4% |
| Scottish | 185 | 5.1% |
| Slovak | 12 | 0.3% |
| South American | 14 | 0.4% |
| Spaniard | 1 | 0.0% |
| Spanish | 87 | 2.4% |
| Subsaharan African | 5 | 0.1% | View All 29 Rows |
Immigrants in Catron County
The most numerous immigrant groups reported in Catron County came from Europe (89 | 2.5%), Northern Europe (55 | 1.5%), Scotland (28 | 0.8%), Eastern Europe (27 | 0.7%), and Poland (27 | 0.7%), together accounting for 6.2% of all Catron County residents.
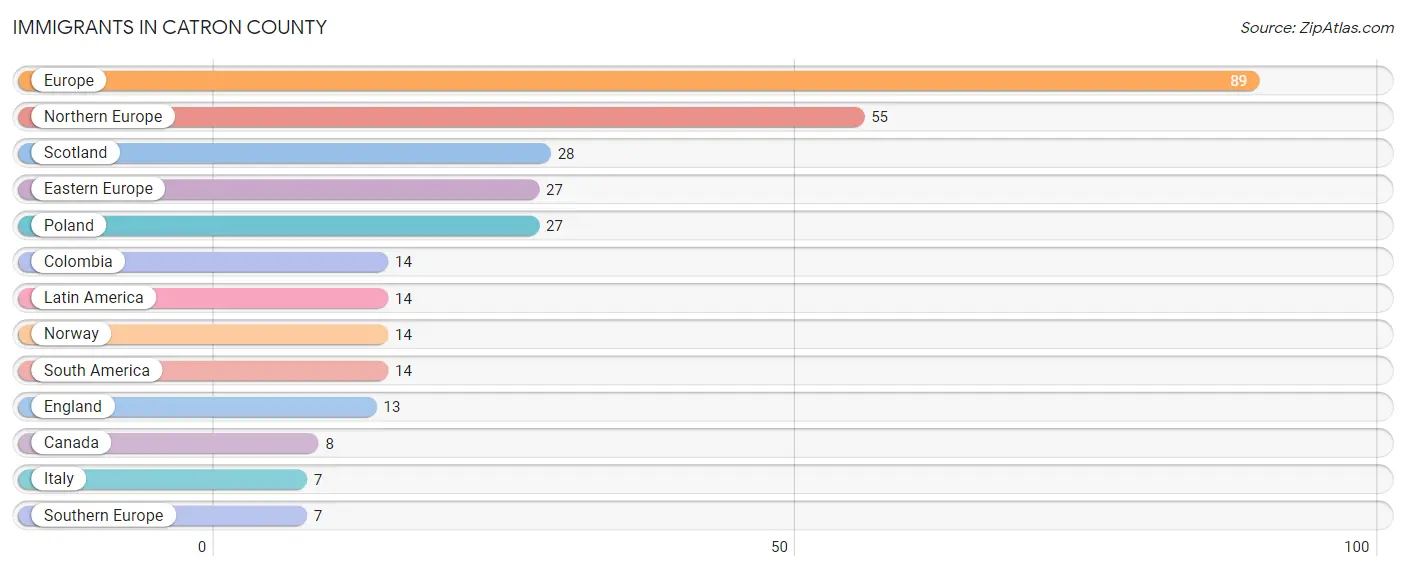
| Immigration Origin | # Population | % Population |
| Canada | 8 | 0.2% |
| Colombia | 14 | 0.4% |
| Eastern Europe | 27 | 0.7% |
| England | 13 | 0.4% |
| Europe | 89 | 2.5% |
| Italy | 7 | 0.2% |
| Latin America | 14 | 0.4% |
| Northern Europe | 55 | 1.5% |
| Norway | 14 | 0.4% |
| Poland | 27 | 0.7% |
| Scotland | 28 | 0.8% |
| South America | 14 | 0.4% |
| Southern Europe | 7 | 0.2% | View All 13 Rows |
Sex and Age in Catron County
Sex and Age in Catron County
The most populous age groups in Catron County are 70 to 74 Years (235 | 12.3%) for men and 65 to 69 Years (212 | 12.2%) for women.
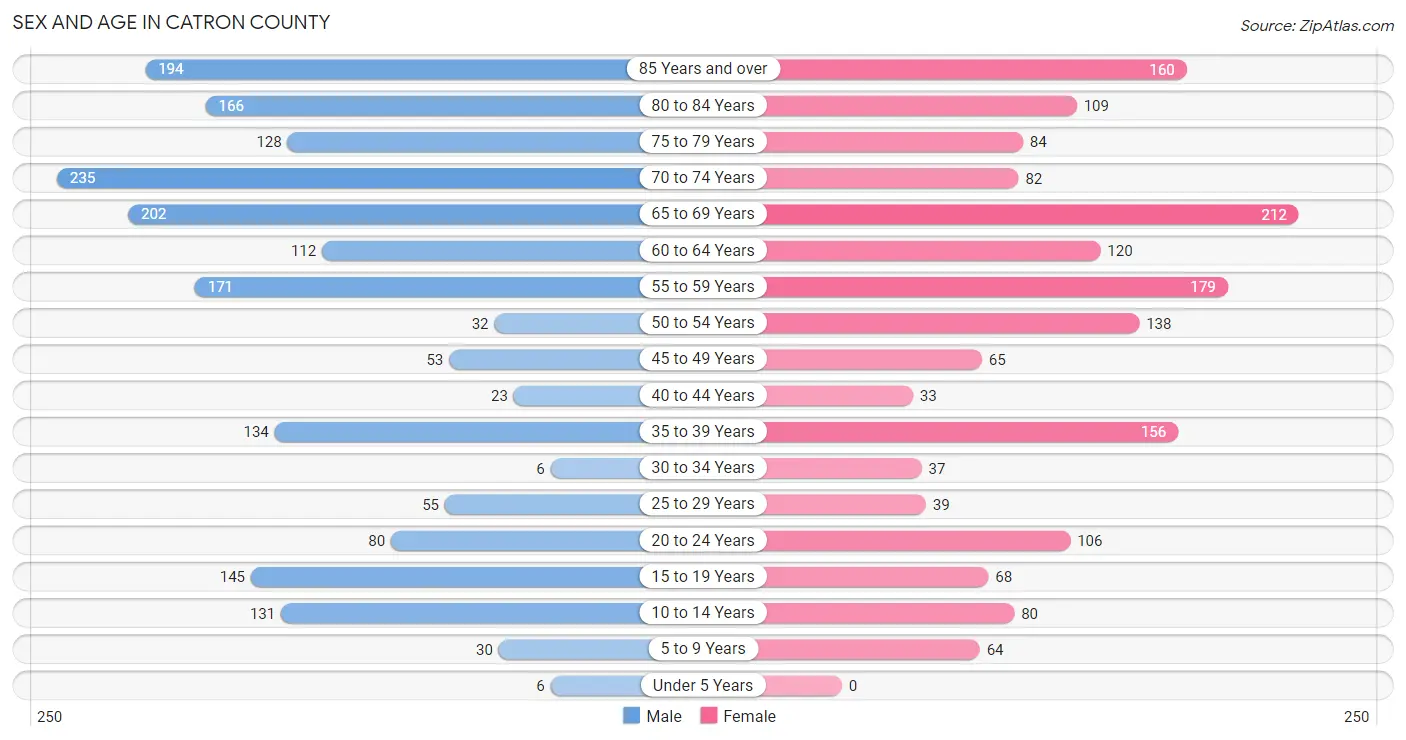
| Age Bracket | Male | Female |
| Under 5 Years | 6 (0.3%) | 0 (0.0%) |
| 5 to 9 Years | 30 (1.6%) | 64 (3.7%) |
| 10 to 14 Years | 131 (6.9%) | 80 (4.6%) |
| 15 to 19 Years | 145 (7.6%) | 68 (3.9%) |
| 20 to 24 Years | 80 (4.2%) | 106 (6.1%) |
| 25 to 29 Years | 55 (2.9%) | 39 (2.2%) |
| 30 to 34 Years | 6 (0.3%) | 37 (2.1%) |
| 35 to 39 Years | 134 (7.0%) | 156 (9.0%) |
| 40 to 44 Years | 23 (1.2%) | 33 (1.9%) |
| 45 to 49 Years | 53 (2.8%) | 65 (3.7%) |
| 50 to 54 Years | 32 (1.7%) | 138 (8.0%) |
| 55 to 59 Years | 171 (9.0%) | 179 (10.3%) |
| 60 to 64 Years | 112 (5.9%) | 120 (6.9%) |
| 65 to 69 Years | 202 (10.6%) | 212 (12.2%) |
| 70 to 74 Years | 235 (12.3%) | 82 (4.7%) |
| 75 to 79 Years | 128 (6.7%) | 84 (4.9%) |
| 80 to 84 Years | 166 (8.7%) | 109 (6.3%) |
| 85 Years and over | 194 (10.2%) | 160 (9.2%) |
| Total | 1,903 (100.0%) | 1,732 (100.0%) |
Families and Households in Catron County
Median Family Size in Catron County
The median family size in Catron County is 2.86 persons per family, with single female/mother families (103 | 12.3%) accounting for the largest median family size of 3.62 persons per family. On the other hand, married-couple families (714 | 85.5%) represent the smallest median family size with 2.74 persons per family.
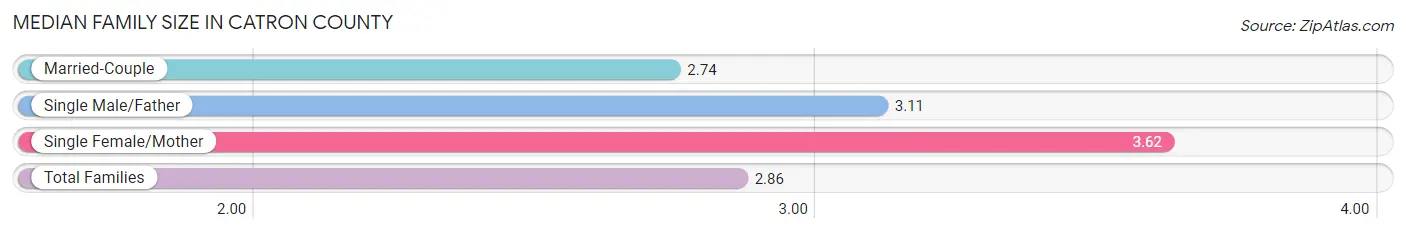
| Family Type | # Families | Family Size |
| Married-Couple | 714 (85.5%) | 2.74 |
| Single Male/Father | 18 (2.2%) | 3.11 |
| Single Female/Mother | 103 (12.3%) | 3.62 |
| Total Families | 835 (100.0%) | 2.86 |
Median Household Size in Catron County
The median household size in Catron County is 2.15 persons per household, with single female/mother households (103 | 6.4%) accounting for the largest median household size of 4.68 persons per household. non-family households (774 | 48.1%) represent the smallest median household size with 1.20 persons per household.
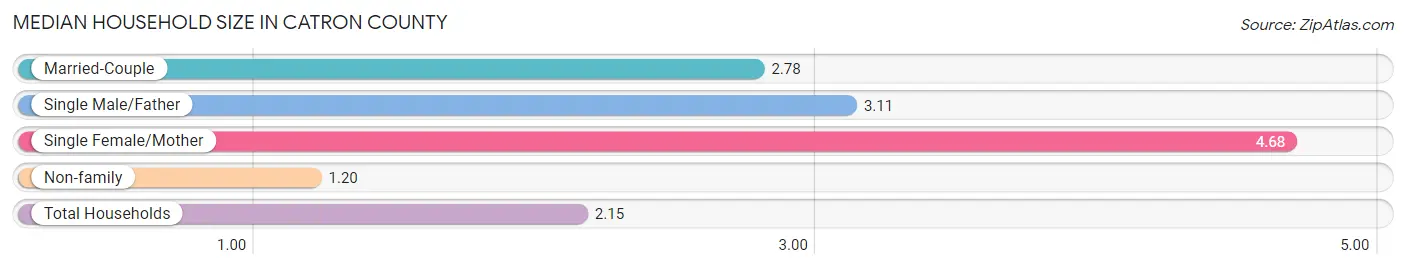
| Household Type | # Households | Household Size |
| Married-Couple | 714 (44.4%) | 2.78 |
| Single Male/Father | 18 (1.1%) | 3.11 |
| Single Female/Mother | 103 (6.4%) | 4.68 |
| Non-family | 774 (48.1%) | 1.20 |
| Total Households | 1,609 (100.0%) | 2.15 |
Household Size by Marriage Status in Catron County
Out of a total of 1,609 households in Catron County, 835 (51.9%) are family households, while 774 (48.1%) are nonfamily households. The most numerous type of family households are 2-person households, comprising 612, and the most common type of nonfamily households are 1-person households, comprising 655.
| Household Size | Family Households | Nonfamily Households |
| 1-Person Households | - | 655 (40.7%) |
| 2-Person Households | 612 (38.0%) | 119 (7.4%) |
| 3-Person Households | 43 (2.7%) | 0 (0.0%) |
| 4-Person Households | 131 (8.1%) | 0 (0.0%) |
| 5-Person Households | 38 (2.4%) | 0 (0.0%) |
| 6-Person Households | 8 (0.5%) | 0 (0.0%) |
| 7+ Person Households | 3 (0.2%) | 0 (0.0%) |
| Total | 835 (51.9%) | 774 (48.1%) |
Female Fertility in Catron County
Fertility by Age in Catron County
| Age Bracket | Women with Births | Births / 1,000 Women |
| 15 to 19 years | 0 (0.0%) | 0.0 |
| 20 to 34 years | 0 (0.0%) | 0.0 |
| 35 to 50 years | 0 (0.0%) | 0.0 |
| Total | 0 (0.0%) | 0.0 |
Fertility by Age by Marriage Status in Catron County
| Age Bracket | Married | Unmarried |
| 15 to 19 years | 0 (0.0%) | 0 (0.0%) |
| 20 to 34 years | 0 (0.0%) | 0 (0.0%) |
| 35 to 50 years | 0 (0.0%) | 0 (0.0%) |
| Total | 0 (0.0%) | 0 (0.0%) |
Fertility by Education in Catron County
| Educational Attainment | Women with Births | Births / 1,000 Women |
| Less than High School | 0 (0.0%) | 0.0 |
| High School Diploma | 0 (0.0%) | 0.0 |
| College or Associate's Degree | 0 (0.0%) | 0.0 |
| Bachelor's Degree | 0 (0.0%) | 0.0 |
| Graduate Degree | 0 (0.0%) | 0.0 |
| Total | 0 (0.0%) | 0.0 |
Fertility by Education by Marriage Status in Catron County
| Educational Attainment | Married | Unmarried |
| Less than High School | 0 (0.0%) | 0 (0.0%) |
| High School Diploma | 0 (0.0%) | 0 (0.0%) |
| College or Associate's Degree | 0 (0.0%) | 0 (0.0%) |
| Bachelor's Degree | 0 (0.0%) | 0 (0.0%) |
| Graduate Degree | 0 (0.0%) | 0 (0.0%) |
| Total | 0 (0.0%) | 0 (0.0%) |
Employment Characteristics in Catron County
Employment by Class of Employer in Catron County
Among the 961 employed individuals in Catron County, private company employees (429 | 44.6%), self-employed (not incorporated) (164 | 17.1%), and self-employed (incorporated) (94 | 9.8%) make up the most common classes of employment.
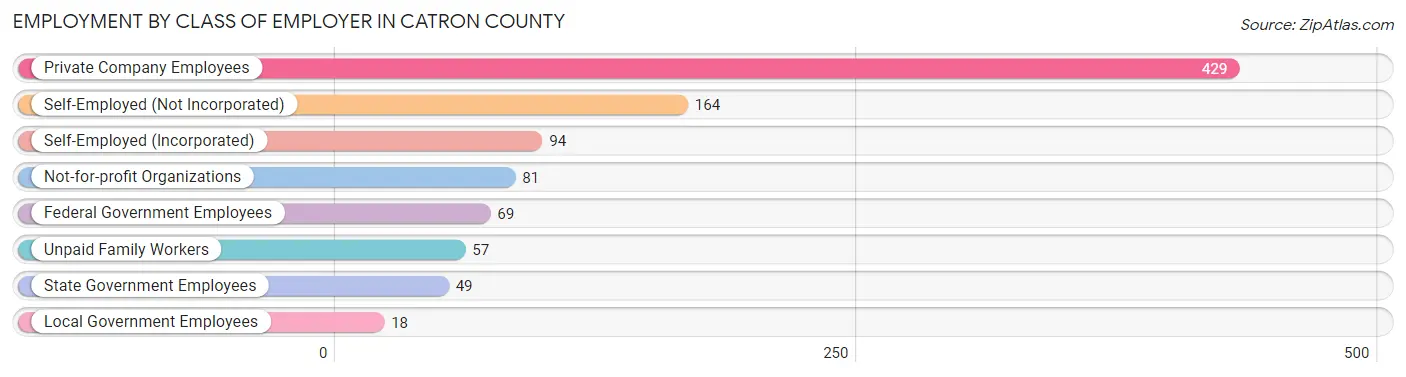
| Employer Class | # Employees | % Employees |
| Private Company Employees | 429 | 44.6% |
| Self-Employed (Incorporated) | 94 | 9.8% |
| Self-Employed (Not Incorporated) | 164 | 17.1% |
| Not-for-profit Organizations | 81 | 8.4% |
| Local Government Employees | 18 | 1.9% |
| State Government Employees | 49 | 5.1% |
| Federal Government Employees | 69 | 7.2% |
| Unpaid Family Workers | 57 | 5.9% |
| Total | 961 | 100.0% |
Employment Status by Age in Catron County
According to the labor force statistics for Catron County, out of the total population over 16 years of age (3,320), 30.7% or 1,019 individuals are in the labor force, with 5.7% or 58 of them unemployed. The age group with the highest labor force participation rate is 45 to 54 years, with 75.3% or 217 individuals in the labor force. Within the labor force, the 55 to 59 years age range has the highest percentage of unemployed individuals, with 22.9% or 41 of them being unemployed.
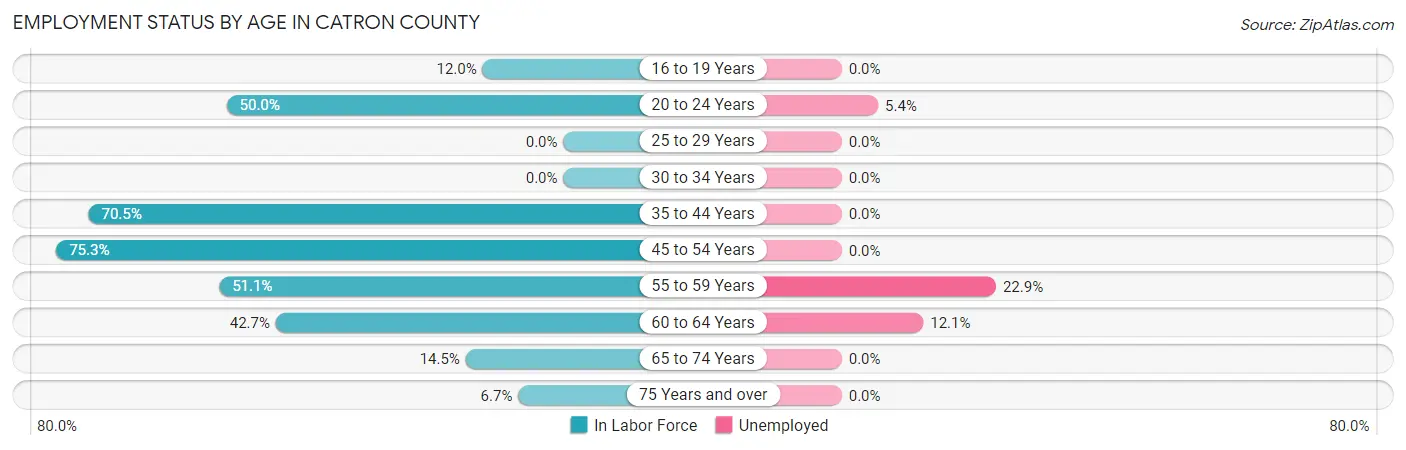
| Age Bracket | In Labor Force | Unemployed |
| 16 to 19 Years | 25 (12.0%) | 0 (0.0%) |
| 20 to 24 Years | 93 (50.0%) | 5 (5.4%) |
| 25 to 29 Years | 0 (0.0%) | 0 (0.0%) |
| 30 to 34 Years | 0 (0.0%) | 0 (0.0%) |
| 35 to 44 Years | 244 (70.5%) | 0 (0.0%) |
| 45 to 54 Years | 217 (75.3%) | 0 (0.0%) |
| 55 to 59 Years | 179 (51.1%) | 41 (22.9%) |
| 60 to 64 Years | 99 (42.7%) | 12 (12.1%) |
| 65 to 74 Years | 106 (14.5%) | 0 (0.0%) |
| 75 Years and over | 56 (6.7%) | 0 (0.0%) |
| Total | 1,019 (30.7%) | 58 (5.7%) |
Employment Status by Educational Attainment in Catron County
According to labor force statistics for Catron County, 54.6% of individuals (739) out of the total population between 25 and 64 years of age (1,353) are in the labor force, with 7.2% or 53 of them being unemployed. The group with the highest labor force participation rate are those with the educational attainment of bachelor's degree or higher, with 100.0% or 94 individuals in the labor force. Within the labor force, individuals with high school diploma education have the highest percentage of unemployment, with 10.5% or 41 of them being unemployed.
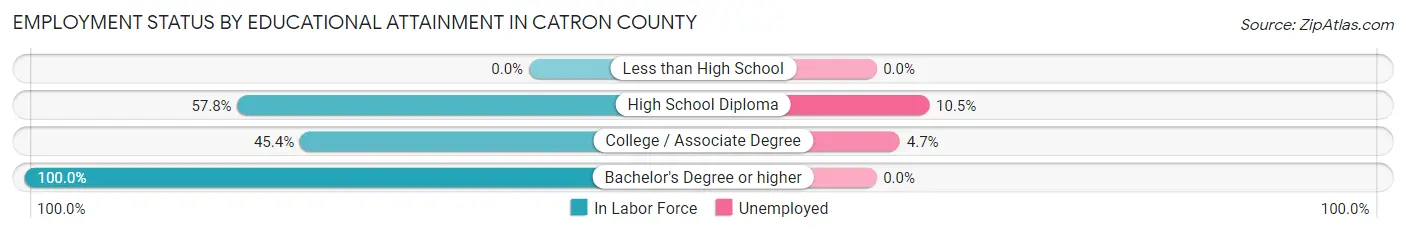
| Educational Attainment | In Labor Force | Unemployed |
| Less than High School | 0 (0.0%) | 0 (0.0%) |
| High School Diploma | 391 (57.8%) | 71 (10.5%) |
| College / Associate Degree | 254 (45.4%) | 26 (4.7%) |
| Bachelor's Degree or higher | 94 (100.0%) | 0 (0.0%) |
| Total | 739 (54.6%) | 97 (7.2%) |
Employment Occupations by Sex in Catron County
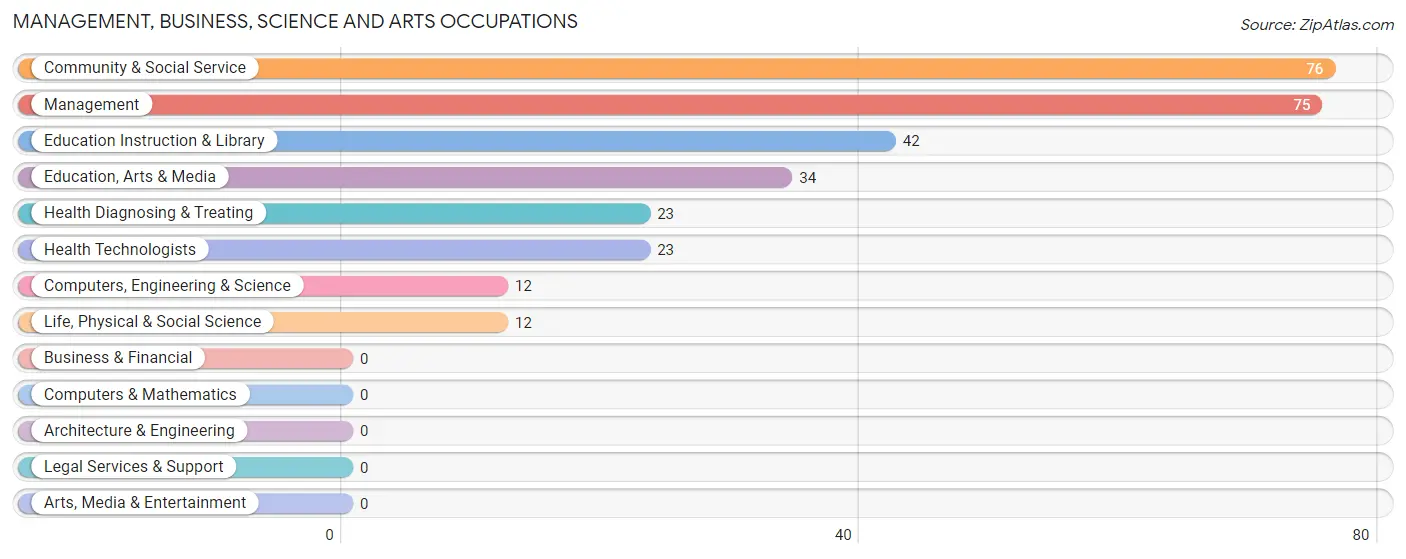
Management, Business, Science and Arts Occupations
The most common Management, Business, Science and Arts occupations in Catron County are Community & Social Service (76 | 7.9%), Management (75 | 7.8%), Education Instruction & Library (42 | 4.4%), Education, Arts & Media (34 | 3.5%), and Health Diagnosing & Treating (23 | 2.4%).
Management, Business, Science and Arts Occupations by Sex
Within the Management, Business, Science and Arts occupations in Catron County, the most male-oriented occupations are Management (88.0%), Education, Arts & Media (58.8%), and Health Diagnosing & Treating (43.5%), while the most female-oriented occupations are Computers, Engineering & Science (100.0%), Life, Physical & Social Science (100.0%), and Education Instruction & Library (69.1%).
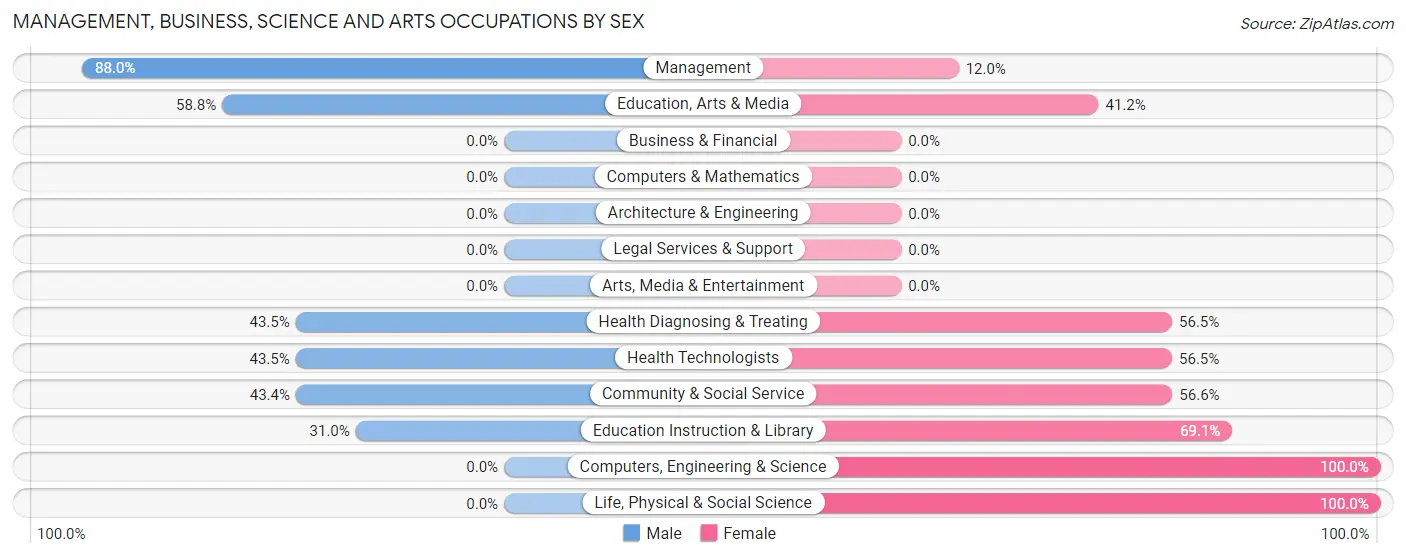
| Occupation | Male | Female |
| Management | 66 (88.0%) | 9 (12.0%) |
| Business & Financial | 0 (0.0%) | 0 (0.0%) |
| Computers, Engineering & Science | 0 (0.0%) | 12 (100.0%) |
| Computers & Mathematics | 0 (0.0%) | 0 (0.0%) |
| Architecture & Engineering | 0 (0.0%) | 0 (0.0%) |
| Life, Physical & Social Science | 0 (0.0%) | 12 (100.0%) |
| Community & Social Service | 33 (43.4%) | 43 (56.6%) |
| Education, Arts & Media | 20 (58.8%) | 14 (41.2%) |
| Legal Services & Support | 0 (0.0%) | 0 (0.0%) |
| Education Instruction & Library | 13 (30.9%) | 29 (69.1%) |
| Arts, Media & Entertainment | 0 (0.0%) | 0 (0.0%) |
| Health Diagnosing & Treating | 10 (43.5%) | 13 (56.5%) |
| Health Technologists | 10 (43.5%) | 13 (56.5%) |
| Total (Category) | 109 (58.6%) | 77 (41.4%) |
| Total (Overall) | 417 (43.4%) | 544 (56.6%) |
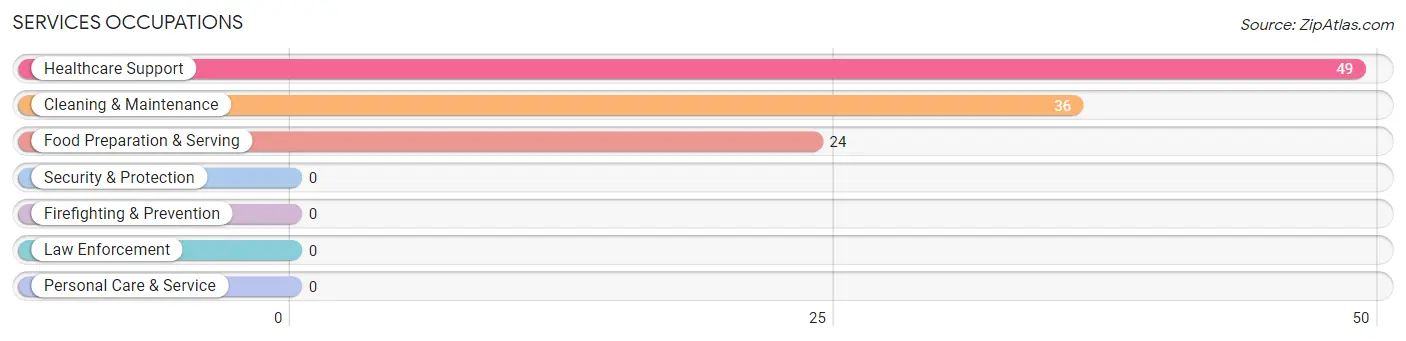
Services Occupations
The most common Services occupations in Catron County are Healthcare Support (49 | 5.1%), Cleaning & Maintenance (36 | 3.7%), and Food Preparation & Serving (24 | 2.5%).
Services Occupations by Sex
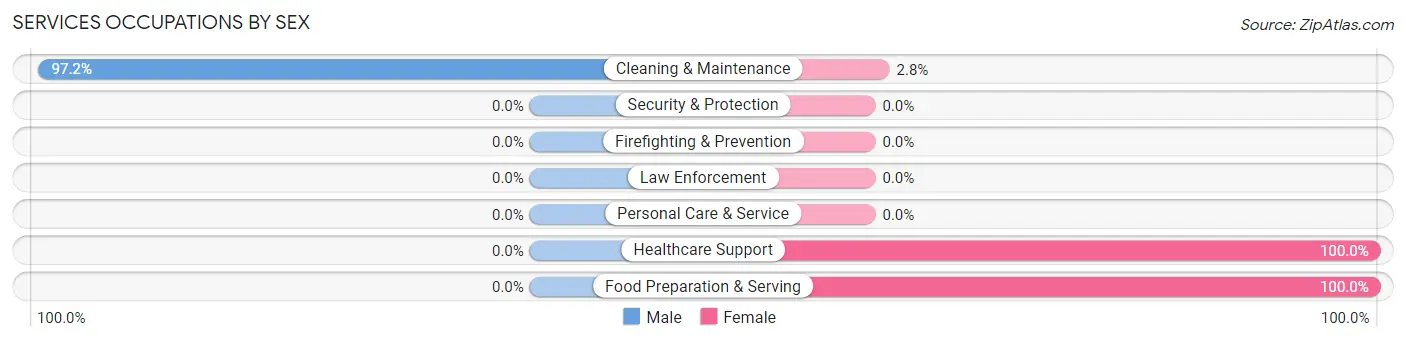
| Occupation | Male | Female |
| Healthcare Support | 0 (0.0%) | 49 (100.0%) |
| Security & Protection | 0 (0.0%) | 0 (0.0%) |
| Firefighting & Prevention | 0 (0.0%) | 0 (0.0%) |
| Law Enforcement | 0 (0.0%) | 0 (0.0%) |
| Food Preparation & Serving | 0 (0.0%) | 24 (100.0%) |
| Cleaning & Maintenance | 35 (97.2%) | 1 (2.8%) |
| Personal Care & Service | 0 (0.0%) | 0 (0.0%) |
| Total (Category) | 35 (32.1%) | 74 (67.9%) |
| Total (Overall) | 417 (43.4%) | 544 (56.6%) |
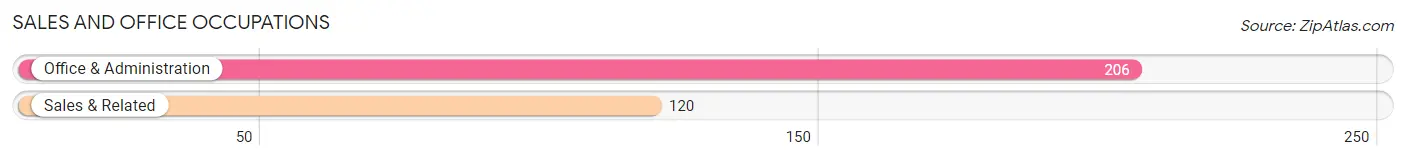
Sales and Office Occupations
The most common Sales and Office occupations in Catron County are Office & Administration (206 | 21.4%), and Sales & Related (120 | 12.5%).
Sales and Office Occupations by Sex

| Occupation | Male | Female |
| Sales & Related | 20 (16.7%) | 100 (83.3%) |
| Office & Administration | 13 (6.3%) | 193 (93.7%) |
| Total (Category) | 33 (10.1%) | 293 (89.9%) |
| Total (Overall) | 417 (43.4%) | 544 (56.6%) |
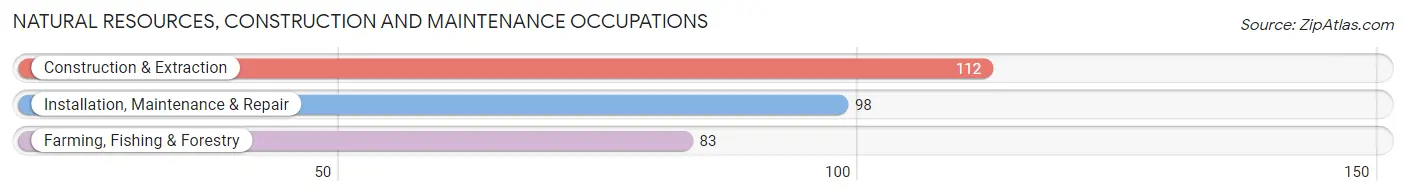
Natural Resources, Construction and Maintenance Occupations
The most common Natural Resources, Construction and Maintenance occupations in Catron County are Construction & Extraction (112 | 11.7%), Installation, Maintenance & Repair (98 | 10.2%), and Farming, Fishing & Forestry (83 | 8.6%).
Natural Resources, Construction and Maintenance Occupations by Sex
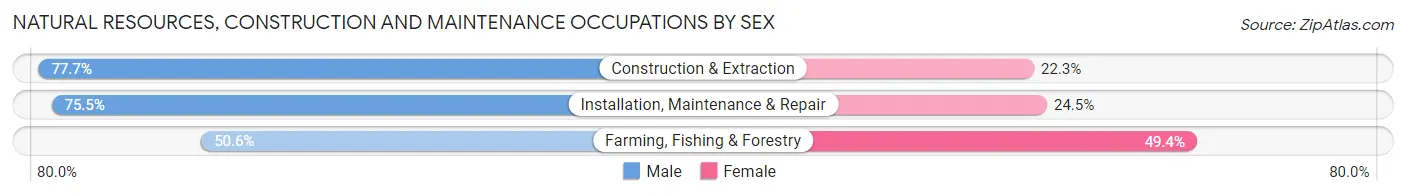
| Occupation | Male | Female |
| Farming, Fishing & Forestry | 42 (50.6%) | 41 (49.4%) |
| Construction & Extraction | 87 (77.7%) | 25 (22.3%) |
| Installation, Maintenance & Repair | 74 (75.5%) | 24 (24.5%) |
| Total (Category) | 203 (69.3%) | 90 (30.7%) |
| Total (Overall) | 417 (43.4%) | 544 (56.6%) |
Production, Transportation and Moving Occupations
The most common Production, Transportation and Moving occupations in Catron County are Production (32 | 3.3%), and Transportation (15 | 1.6%).
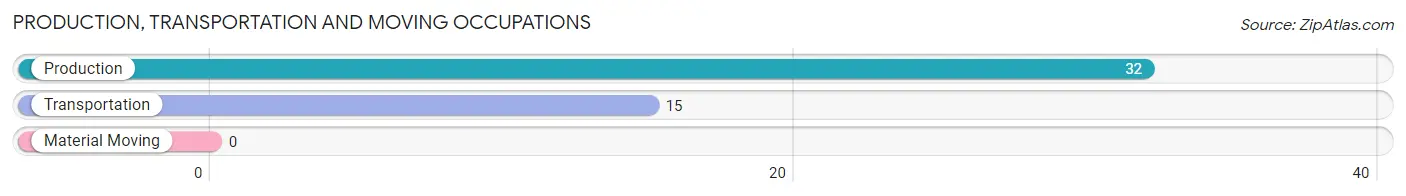
Production, Transportation and Moving Occupations by Sex
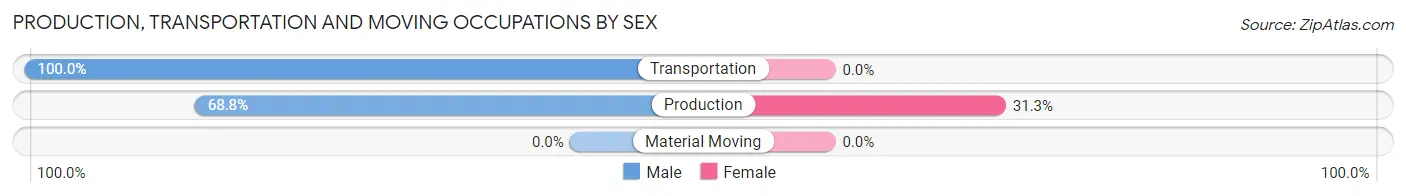
| Occupation | Male | Female |
| Production | 22 (68.8%) | 10 (31.2%) |
| Transportation | 15 (100.0%) | 0 (0.0%) |
| Material Moving | 0 (0.0%) | 0 (0.0%) |
| Total (Category) | 37 (78.7%) | 10 (21.3%) |
| Total (Overall) | 417 (43.4%) | 544 (56.6%) |
Employment Industries by Sex in Catron County
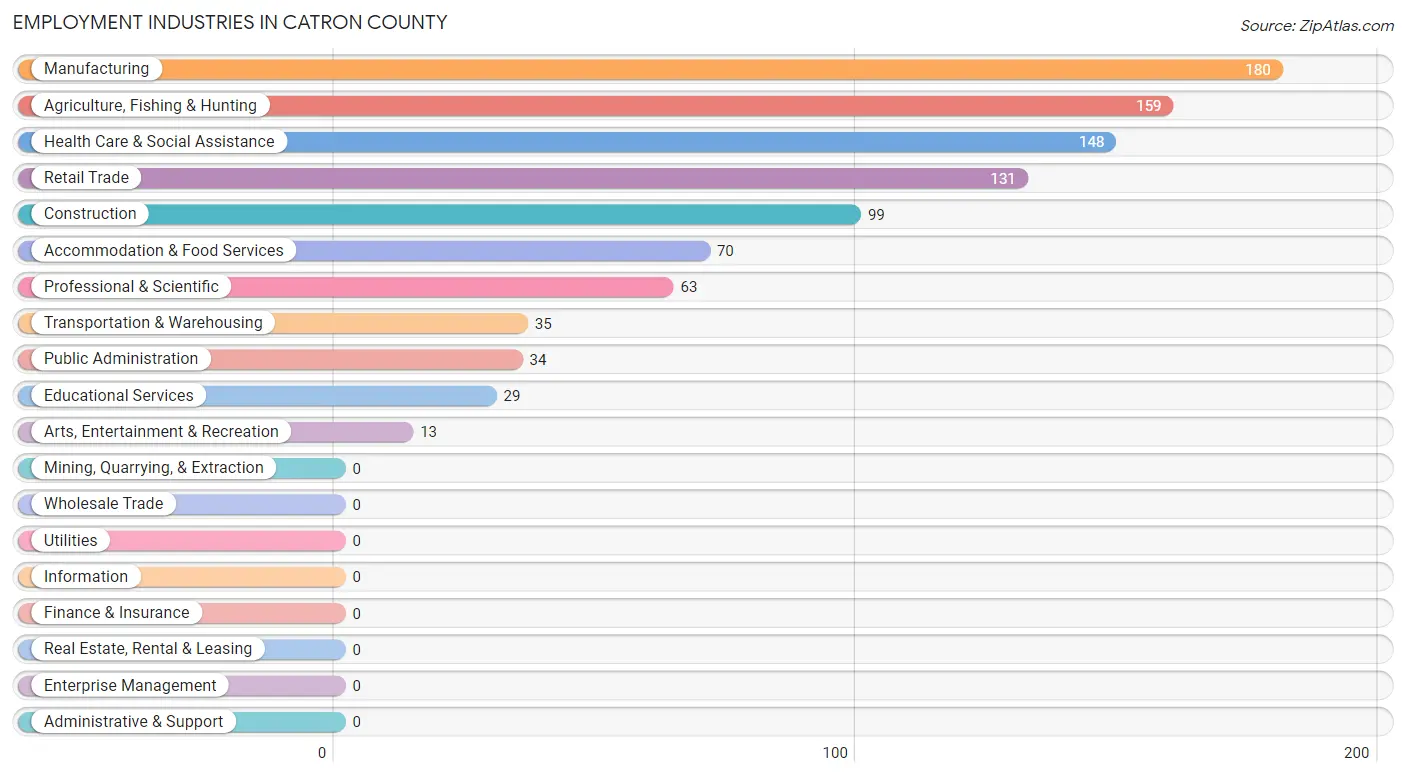
Employment Industries in Catron County
The major employment industries in Catron County include Manufacturing (180 | 18.7%), Agriculture, Fishing & Hunting (159 | 16.6%), Health Care & Social Assistance (148 | 15.4%), Retail Trade (131 | 13.6%), and Construction (99 | 10.3%).
Employment Industries by Sex in Catron County
The Catron County industries that see more men than women are Construction (100.0%), Arts, Entertainment & Recreation (100.0%), and Agriculture, Fishing & Hunting (74.2%), whereas the industries that tend to have a higher number of women are Professional & Scientific (100.0%), Accommodation & Food Services (100.0%), and Health Care & Social Assistance (93.2%).
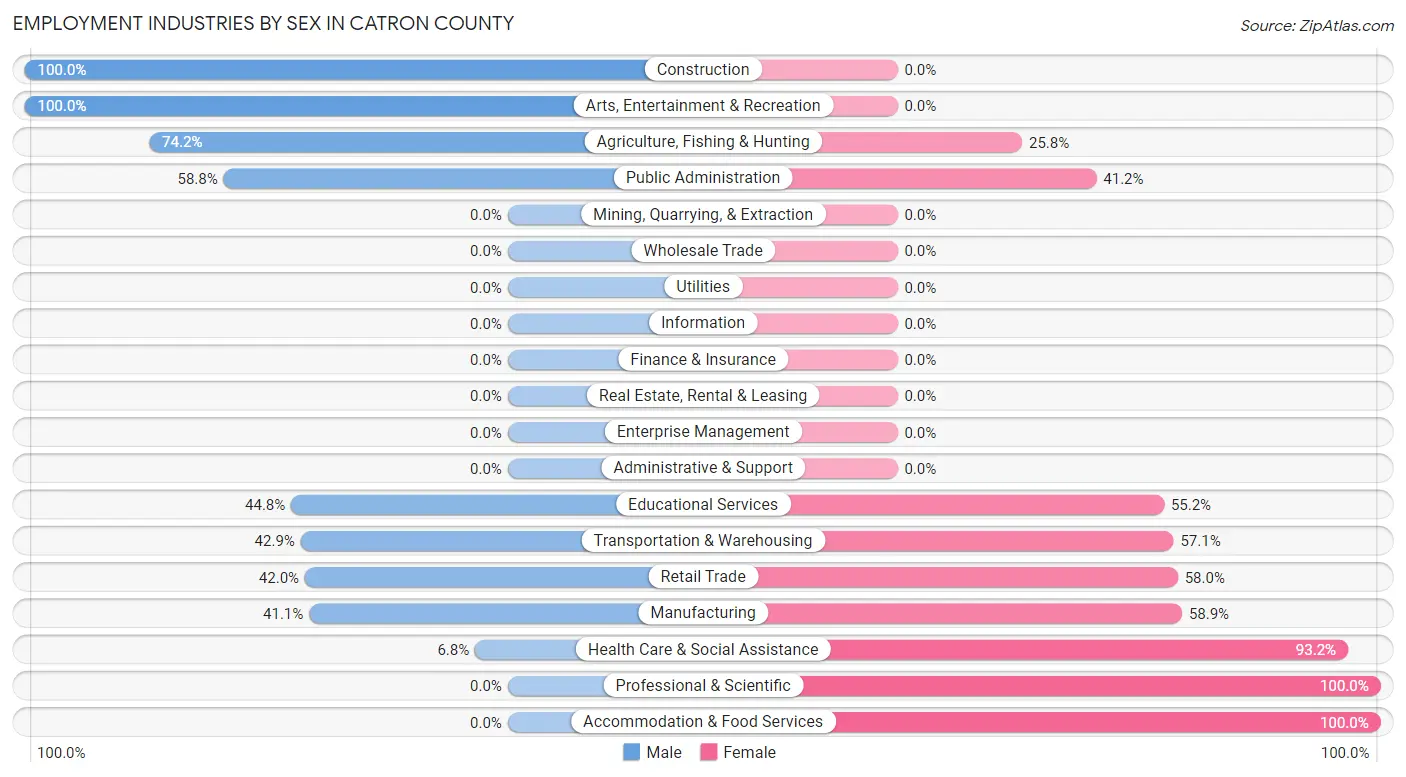
| Industry | Male | Female |
| Agriculture, Fishing & Hunting | 118 (74.2%) | 41 (25.8%) |
| Mining, Quarrying, & Extraction | 0 (0.0%) | 0 (0.0%) |
| Construction | 99 (100.0%) | 0 (0.0%) |
| Manufacturing | 74 (41.1%) | 106 (58.9%) |
| Wholesale Trade | 0 (0.0%) | 0 (0.0%) |
| Retail Trade | 55 (42.0%) | 76 (58.0%) |
| Transportation & Warehousing | 15 (42.9%) | 20 (57.1%) |
| Utilities | 0 (0.0%) | 0 (0.0%) |
| Information | 0 (0.0%) | 0 (0.0%) |
| Finance & Insurance | 0 (0.0%) | 0 (0.0%) |
| Real Estate, Rental & Leasing | 0 (0.0%) | 0 (0.0%) |
| Professional & Scientific | 0 (0.0%) | 63 (100.0%) |
| Enterprise Management | 0 (0.0%) | 0 (0.0%) |
| Administrative & Support | 0 (0.0%) | 0 (0.0%) |
| Educational Services | 13 (44.8%) | 16 (55.2%) |
| Health Care & Social Assistance | 10 (6.8%) | 138 (93.2%) |
| Arts, Entertainment & Recreation | 13 (100.0%) | 0 (0.0%) |
| Accommodation & Food Services | 0 (0.0%) | 70 (100.0%) |
| Public Administration | 20 (58.8%) | 14 (41.2%) |
| Total | 417 (43.4%) | 544 (56.6%) |
Education in Catron County
School Enrollment in Catron County
The most common levels of schooling among the 537 students in Catron County are middle school (195 | 36.3%), college / undergraduate (131 | 24.4%), and high school (111 | 20.7%).
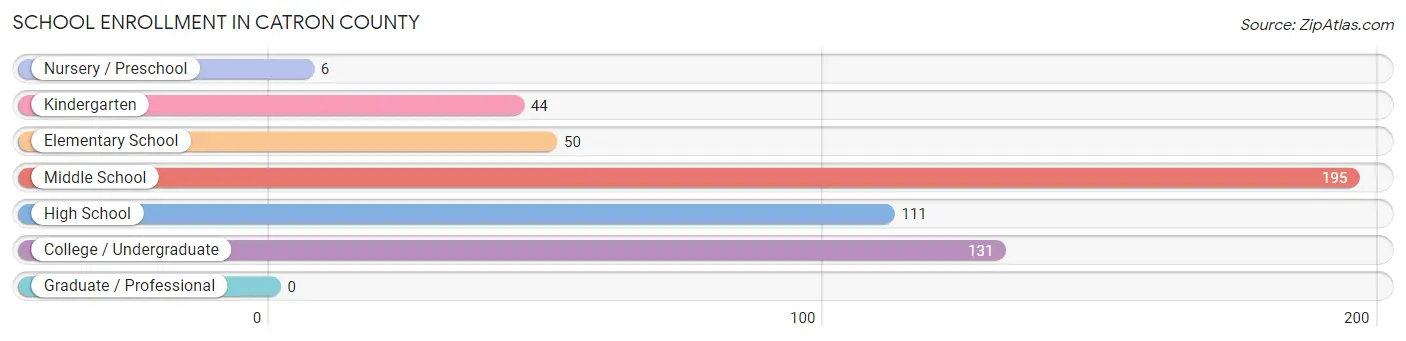
| School Level | # Students | % Students |
| Nursery / Preschool | 6 | 1.1% |
| Kindergarten | 44 | 8.2% |
| Elementary School | 50 | 9.3% |
| Middle School | 195 | 36.3% |
| High School | 111 | 20.7% |
| College / Undergraduate | 131 | 24.4% |
| Graduate / Professional | 0 | 0.0% |
| Total | 537 | 100.0% |
School Enrollment by Age by Funding Source in Catron County
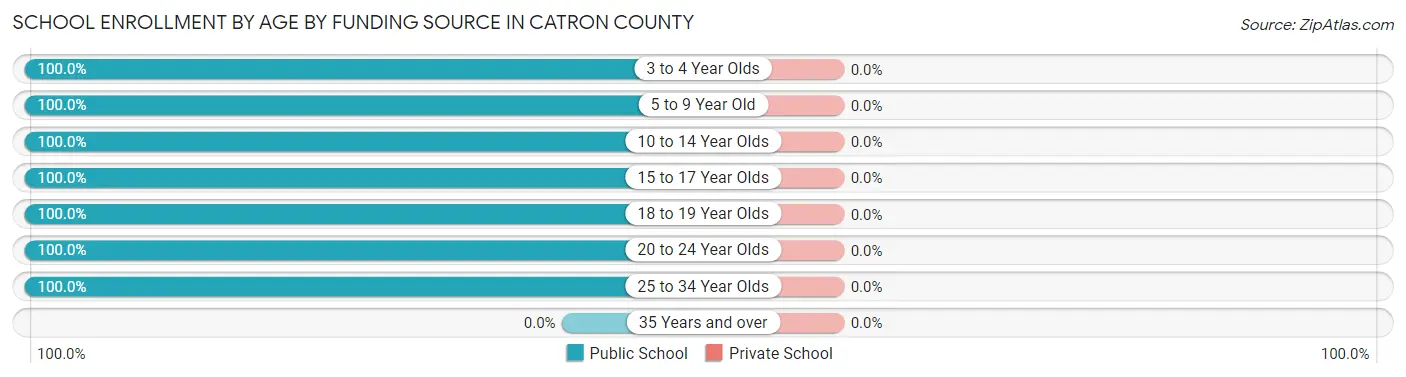
| Age Bracket | Public School | Private School |
| 3 to 4 Year Olds | 6 (100.0%) | 0 (0.0%) |
| 5 to 9 Year Old | 94 (100.0%) | 0 (0.0%) |
| 10 to 14 Year Olds | 211 (100.0%) | 0 (0.0%) |
| 15 to 17 Year Olds | 111 (100.0%) | 0 (0.0%) |
| 18 to 19 Year Olds | 25 (100.0%) | 0 (0.0%) |
| 20 to 24 Year Olds | 41 (100.0%) | 0 (0.0%) |
| 25 to 34 Year Olds | 49 (100.0%) | 0 (0.0%) |
| 35 Years and over | 0 (0.0%) | 0 (0.0%) |
| Total | 537 (100.0%) | 0 (0.0%) |
Educational Attainment by Field of Study in Catron County
Science & technology (132 | 27.8%), psychology (84 | 17.7%), social sciences (84 | 17.7%), literature & languages (42 | 8.8%), and arts & humanities (34 | 7.2%) are the most common fields of study among 475 individuals in Catron County who have obtained a bachelor's degree or higher.
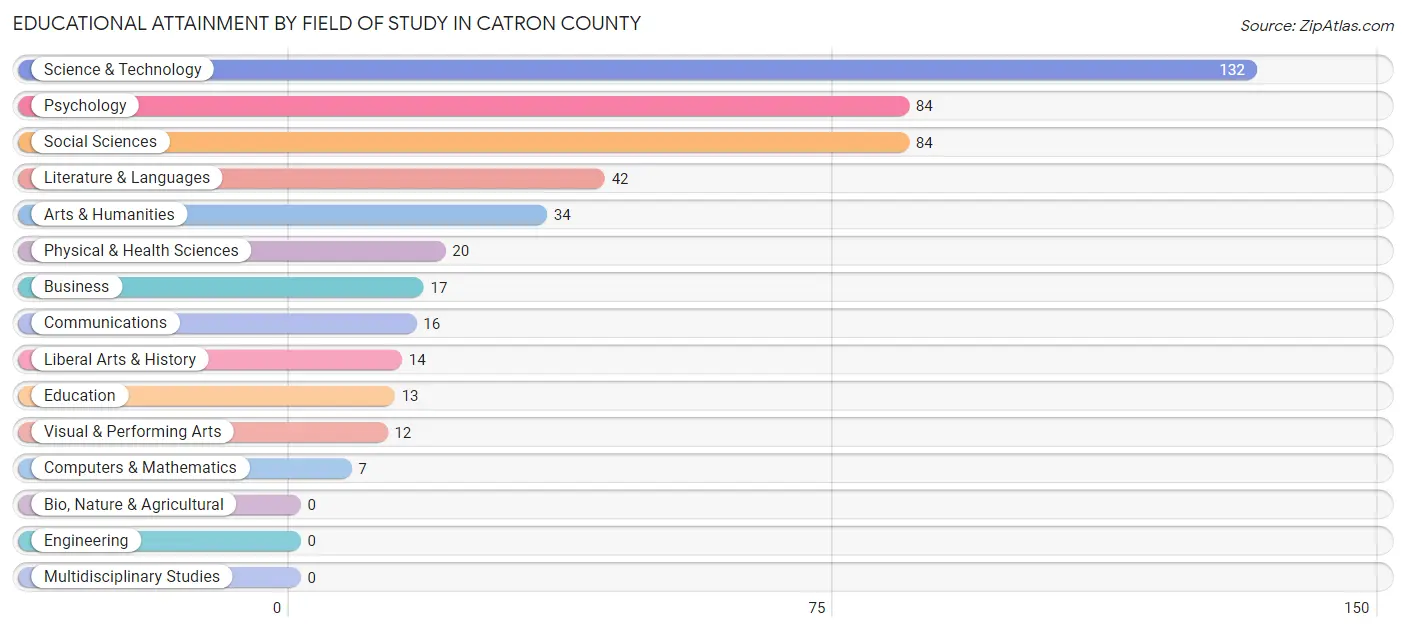
| Field of Study | # Graduates | % Graduates |
| Computers & Mathematics | 7 | 1.5% |
| Bio, Nature & Agricultural | 0 | 0.0% |
| Physical & Health Sciences | 20 | 4.2% |
| Psychology | 84 | 17.7% |
| Social Sciences | 84 | 17.7% |
| Engineering | 0 | 0.0% |
| Multidisciplinary Studies | 0 | 0.0% |
| Science & Technology | 132 | 27.8% |
| Business | 17 | 3.6% |
| Education | 13 | 2.7% |
| Literature & Languages | 42 | 8.8% |
| Liberal Arts & History | 14 | 2.9% |
| Visual & Performing Arts | 12 | 2.5% |
| Communications | 16 | 3.4% |
| Arts & Humanities | 34 | 7.2% |
| Total | 475 | 100.0% |
Transportation & Commute in Catron County
Vehicle Availability by Sex in Catron County
The most prevalent vehicle ownership categories in Catron County are males with 4 vehicles (208, accounting for 51.5%) and females with 4 vehicles (163, making up 43.9%).
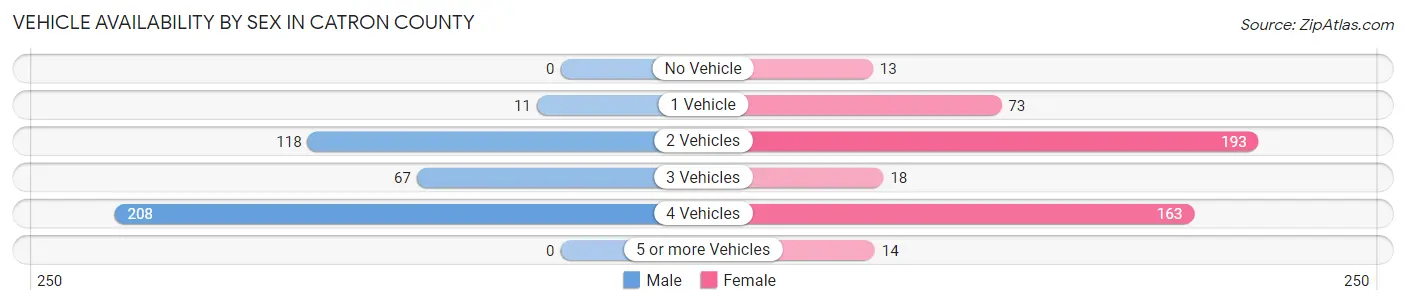
| Vehicles Available | Male | Female |
| No Vehicle | 0 (0.0%) | 13 (2.7%) |
| 1 Vehicle | 11 (2.7%) | 73 (15.4%) |
| 2 Vehicles | 118 (29.2%) | 193 (40.7%) |
| 3 Vehicles | 67 (16.6%) | 18 (3.8%) |
| 4 Vehicles | 208 (51.5%) | 163 (34.4%) |
| 5 or more Vehicles | 0 (0.0%) | 14 (2.9%) |
| Total | 404 (100.0%) | 474 (100.0%) |
Commute Time in Catron County
The most frequently occuring commute durations in Catron County are less than 5 minutes (213 commuters, 27.7%), 30 to 34 minutes (179 commuters, 23.3%), and 5 to 9 minutes (166 commuters, 21.6%).
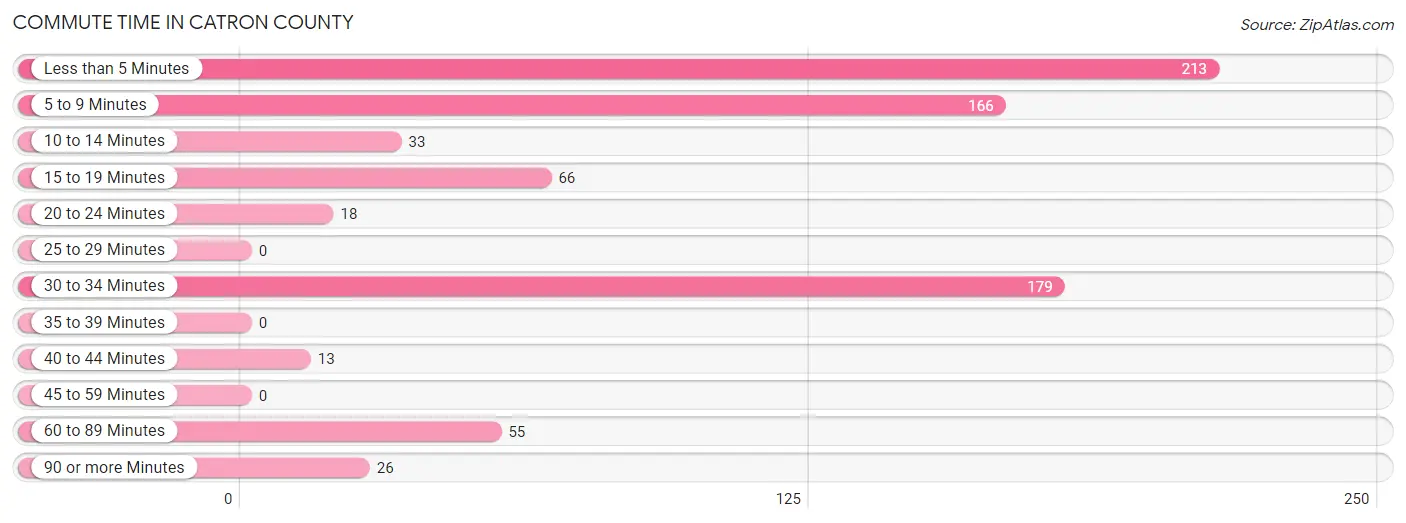
| Commute Time | # Commuters | % Commuters |
| Less than 5 Minutes | 213 | 27.7% |
| 5 to 9 Minutes | 166 | 21.6% |
| 10 to 14 Minutes | 33 | 4.3% |
| 15 to 19 Minutes | 66 | 8.6% |
| 20 to 24 Minutes | 18 | 2.3% |
| 25 to 29 Minutes | 0 | 0.0% |
| 30 to 34 Minutes | 179 | 23.3% |
| 35 to 39 Minutes | 0 | 0.0% |
| 40 to 44 Minutes | 13 | 1.7% |
| 45 to 59 Minutes | 0 | 0.0% |
| 60 to 89 Minutes | 55 | 7.1% |
| 90 or more Minutes | 26 | 3.4% |
Commute Time by Sex in Catron County
The most common commute times in Catron County are less than 5 minutes (167 commuters, 47.8%) for males and 5 to 9 minutes (109 commuters, 26.0%) for females.
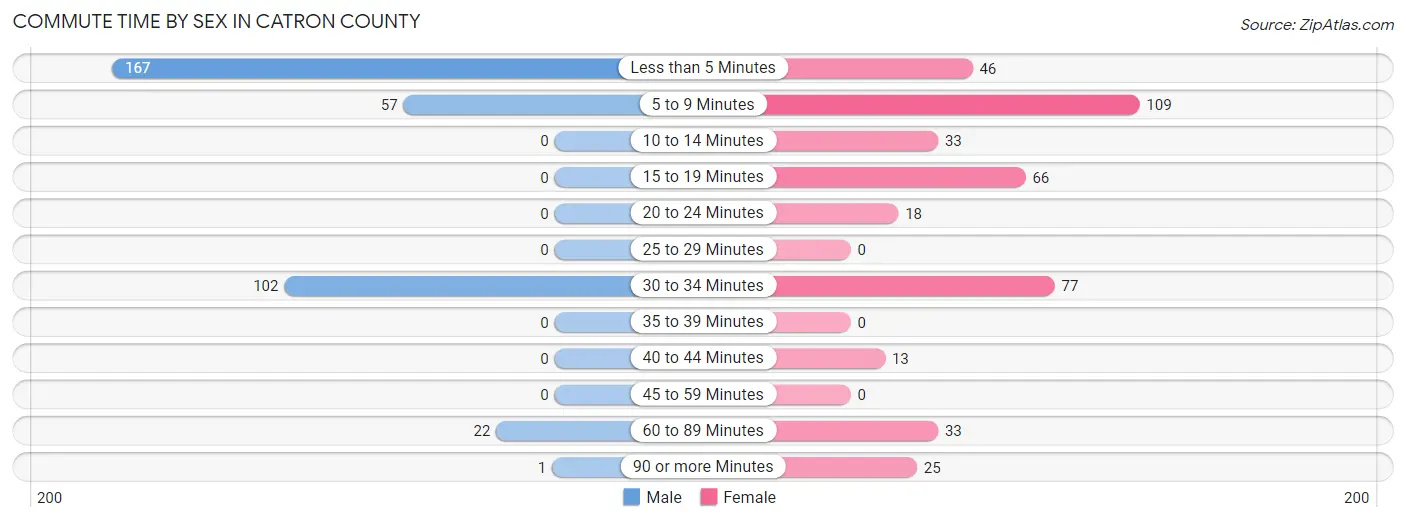
| Commute Time | Male | Female |
| Less than 5 Minutes | 167 (47.8%) | 46 (11.0%) |
| 5 to 9 Minutes | 57 (16.3%) | 109 (26.0%) |
| 10 to 14 Minutes | 0 (0.0%) | 33 (7.9%) |
| 15 to 19 Minutes | 0 (0.0%) | 66 (15.7%) |
| 20 to 24 Minutes | 0 (0.0%) | 18 (4.3%) |
| 25 to 29 Minutes | 0 (0.0%) | 0 (0.0%) |
| 30 to 34 Minutes | 102 (29.2%) | 77 (18.3%) |
| 35 to 39 Minutes | 0 (0.0%) | 0 (0.0%) |
| 40 to 44 Minutes | 0 (0.0%) | 13 (3.1%) |
| 45 to 59 Minutes | 0 (0.0%) | 0 (0.0%) |
| 60 to 89 Minutes | 22 (6.3%) | 33 (7.9%) |
| 90 or more Minutes | 1 (0.3%) | 25 (5.9%) |
Time of Departure to Work by Sex in Catron County
The most frequent times of departure to work in Catron County are 7:30 AM to 7:59 AM (149, 42.7%) for males and 9:00 AM to 9:59 AM (125, 29.8%) for females.
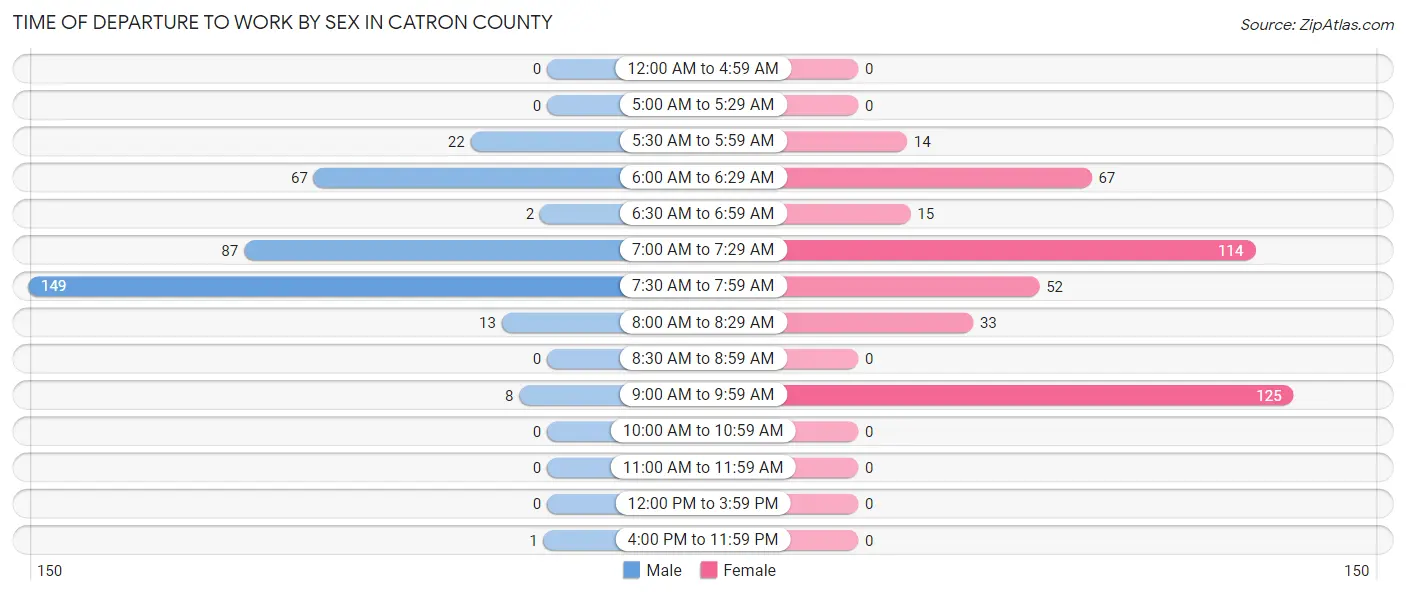
| Time of Departure | Male | Female |
| 12:00 AM to 4:59 AM | 0 (0.0%) | 0 (0.0%) |
| 5:00 AM to 5:29 AM | 0 (0.0%) | 0 (0.0%) |
| 5:30 AM to 5:59 AM | 22 (6.3%) | 14 (3.3%) |
| 6:00 AM to 6:29 AM | 67 (19.2%) | 67 (16.0%) |
| 6:30 AM to 6:59 AM | 2 (0.6%) | 15 (3.6%) |
| 7:00 AM to 7:29 AM | 87 (24.9%) | 114 (27.1%) |
| 7:30 AM to 7:59 AM | 149 (42.7%) | 52 (12.4%) |
| 8:00 AM to 8:29 AM | 13 (3.7%) | 33 (7.9%) |
| 8:30 AM to 8:59 AM | 0 (0.0%) | 0 (0.0%) |
| 9:00 AM to 9:59 AM | 8 (2.3%) | 125 (29.8%) |
| 10:00 AM to 10:59 AM | 0 (0.0%) | 0 (0.0%) |
| 11:00 AM to 11:59 AM | 0 (0.0%) | 0 (0.0%) |
| 12:00 PM to 3:59 PM | 0 (0.0%) | 0 (0.0%) |
| 4:00 PM to 11:59 PM | 1 (0.3%) | 0 (0.0%) |
| Total | 349 (100.0%) | 420 (100.0%) |
Housing Occupancy in Catron County
Occupancy by Ownership in Catron County
Of the total 1,609 dwellings in Catron County, owner-occupied units account for 1,405 (87.3%), while renter-occupied units make up 204 (12.7%).
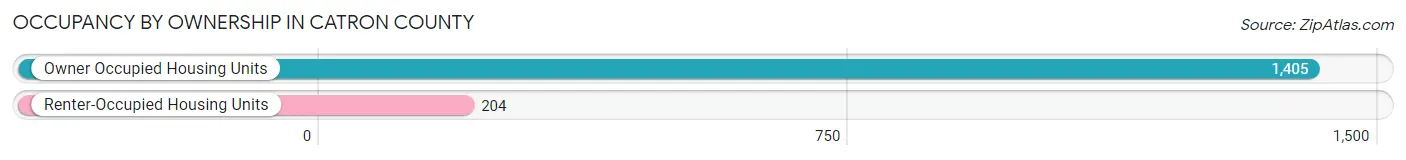
| Occupancy | # Housing Units | % Housing Units |
| Owner Occupied Housing Units | 1,405 | 87.3% |
| Renter-Occupied Housing Units | 204 | 12.7% |
| Total Occupied Housing Units | 1,609 | 100.0% |
Occupancy by Household Size in Catron County
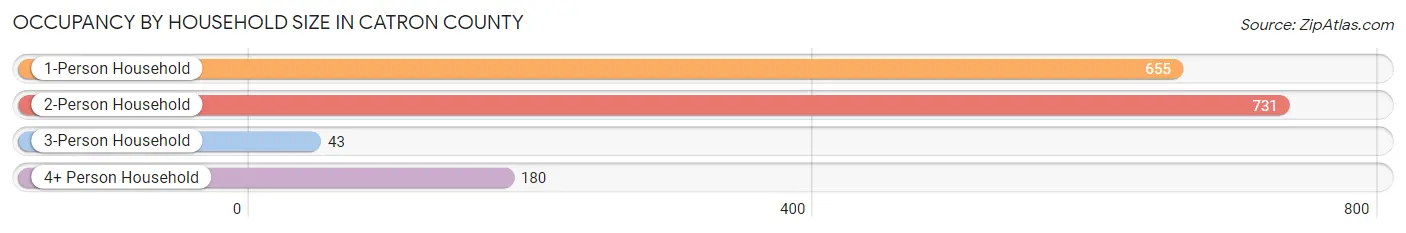
| Household Size | # Housing Units | % Housing Units |
| 1-Person Household | 655 | 40.7% |
| 2-Person Household | 731 | 45.4% |
| 3-Person Household | 43 | 2.7% |
| 4+ Person Household | 180 | 11.2% |
| Total Housing Units | 1,609 | 100.0% |
Occupancy by Ownership by Household Size in Catron County
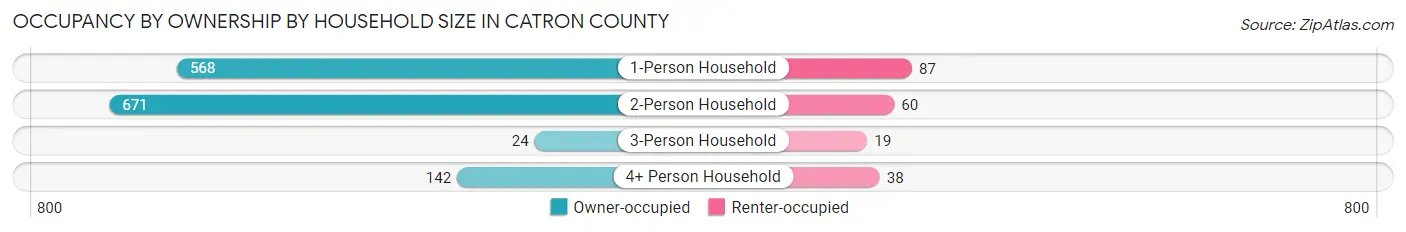
| Household Size | Owner-occupied | Renter-occupied |
| 1-Person Household | 568 (86.7%) | 87 (13.3%) |
| 2-Person Household | 671 (91.8%) | 60 (8.2%) |
| 3-Person Household | 24 (55.8%) | 19 (44.2%) |
| 4+ Person Household | 142 (78.9%) | 38 (21.1%) |
| Total Housing Units | 1,405 (87.3%) | 204 (12.7%) |
Occupancy by Educational Attainment in Catron County
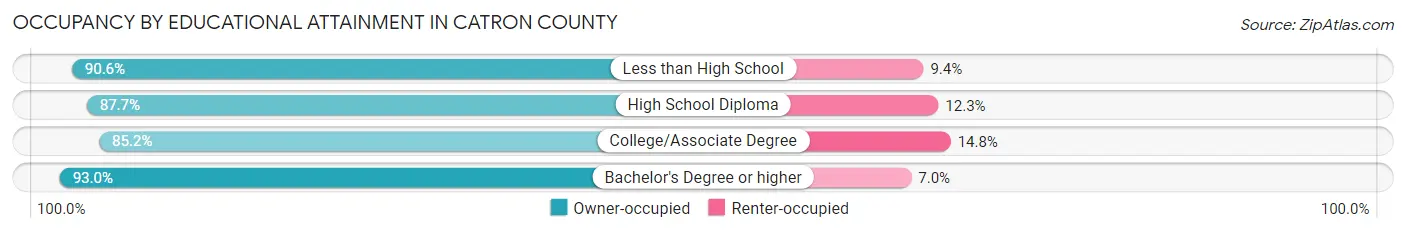
| Household Size | Owner-occupied | Renter-occupied |
| Less than High School | 58 (90.6%) | 6 (9.4%) |
| High School Diploma | 405 (87.7%) | 57 (12.3%) |
| College/Associate Degree | 715 (85.2%) | 124 (14.8%) |
| Bachelor's Degree or higher | 227 (93.0%) | 17 (7.0%) |
Occupancy by Age of Householder in Catron County
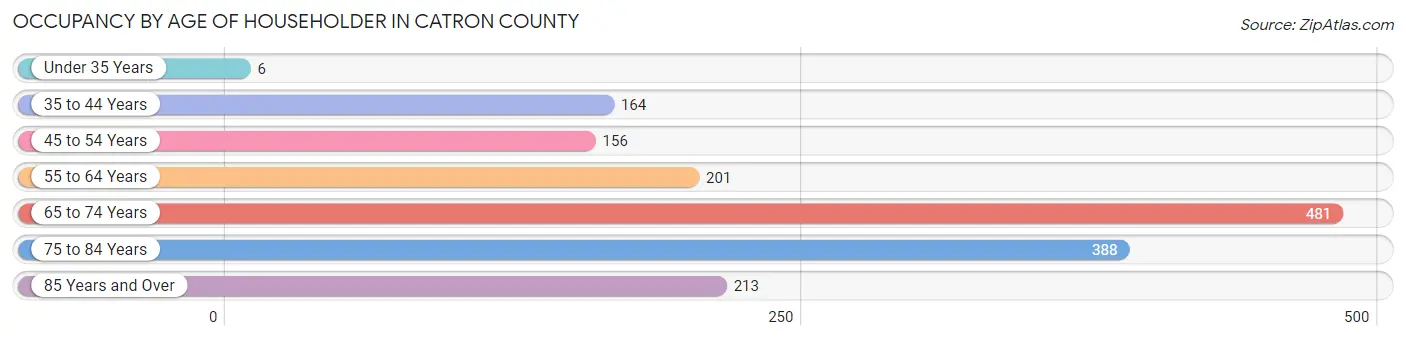
| Age Bracket | # Households | % Households |
| Under 35 Years | 6 | 0.4% |
| 35 to 44 Years | 164 | 10.2% |
| 45 to 54 Years | 156 | 9.7% |
| 55 to 64 Years | 201 | 12.5% |
| 65 to 74 Years | 481 | 29.9% |
| 75 to 84 Years | 388 | 24.1% |
| 85 Years and Over | 213 | 13.2% |
| Total | 1,609 | 100.0% |
Housing Finances in Catron County
Median Income by Occupancy in Catron County
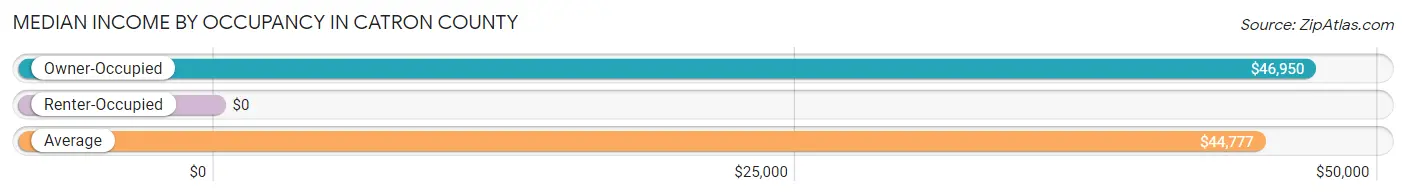
| Occupancy Type | # Households | Median Income |
| Owner-Occupied | 1,405 (87.3%) | $46,950 |
| Renter-Occupied | 204 (12.7%) | $0 |
| Average | 1,609 (100.0%) | $44,777 |
Occupancy by Householder Income Bracket in Catron County
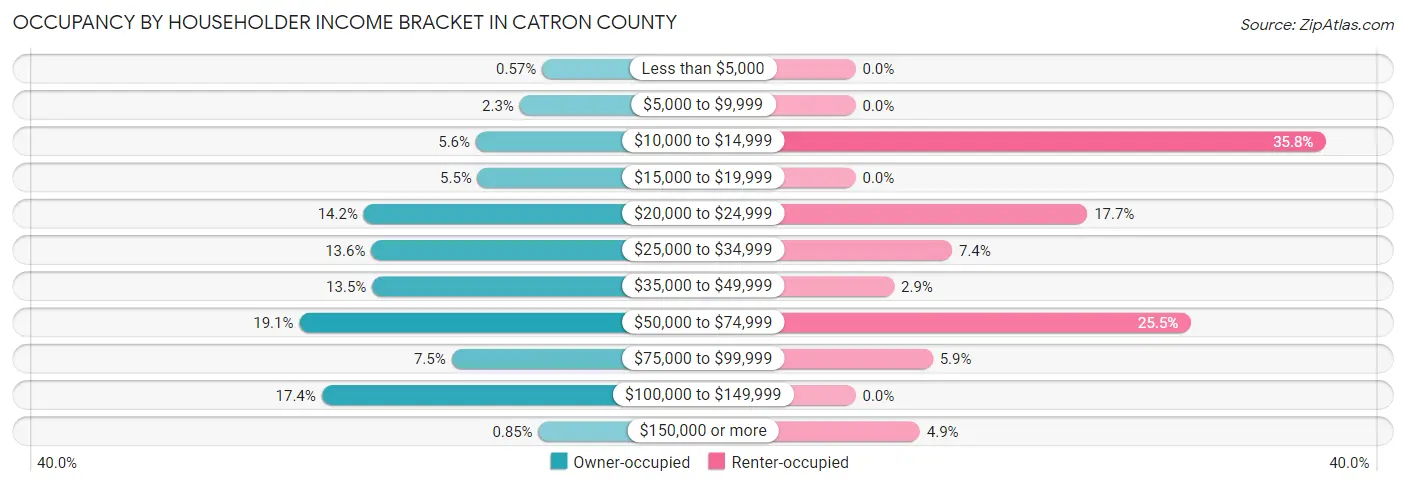
| Income Bracket | Owner-occupied | Renter-occupied |
| Less than $5,000 | 8 (0.6%) | 0 (0.0%) |
| $5,000 to $9,999 | 32 (2.3%) | 0 (0.0%) |
| $10,000 to $14,999 | 79 (5.6%) | 73 (35.8%) |
| $15,000 to $19,999 | 77 (5.5%) | 0 (0.0%) |
| $20,000 to $24,999 | 199 (14.2%) | 36 (17.6%) |
| $25,000 to $34,999 | 191 (13.6%) | 15 (7.3%) |
| $35,000 to $49,999 | 190 (13.5%) | 6 (2.9%) |
| $50,000 to $74,999 | 268 (19.1%) | 52 (25.5%) |
| $75,000 to $99,999 | 105 (7.5%) | 12 (5.9%) |
| $100,000 to $149,999 | 244 (17.4%) | 0 (0.0%) |
| $150,000 or more | 12 (0.9%) | 10 (4.9%) |
| Total | 1,405 (100.0%) | 204 (100.0%) |
Monthly Housing Cost Tiers in Catron County
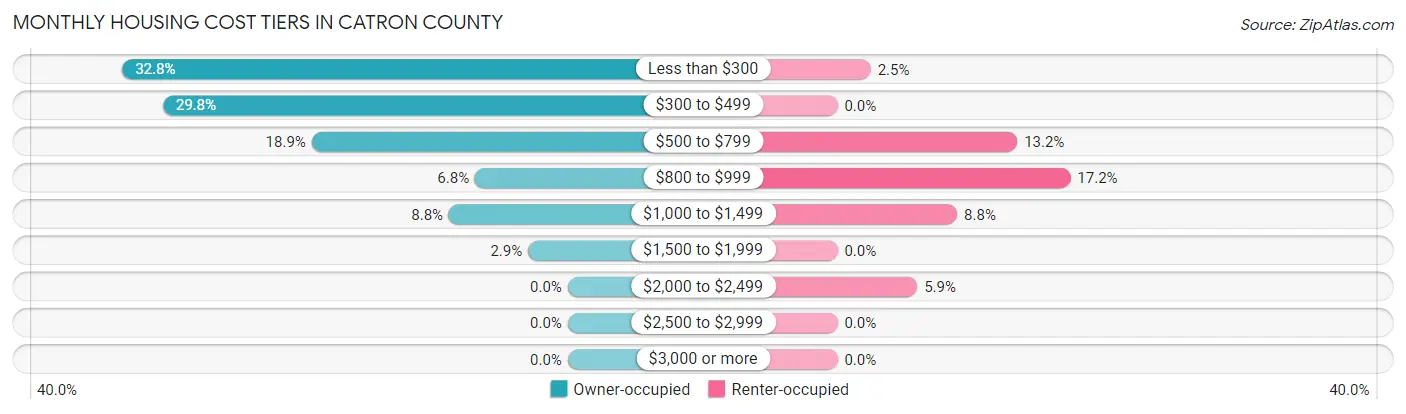
| Monthly Cost | Owner-occupied | Renter-occupied |
| Less than $300 | 461 (32.8%) | 5 (2.5%) |
| $300 to $499 | 419 (29.8%) | 0 (0.0%) |
| $500 to $799 | 265 (18.9%) | 27 (13.2%) |
| $800 to $999 | 96 (6.8%) | 35 (17.2%) |
| $1,000 to $1,499 | 123 (8.7%) | 18 (8.8%) |
| $1,500 to $1,999 | 41 (2.9%) | 0 (0.0%) |
| $2,000 to $2,499 | 0 (0.0%) | 12 (5.9%) |
| $2,500 to $2,999 | 0 (0.0%) | 0 (0.0%) |
| $3,000 or more | 0 (0.0%) | 0 (0.0%) |
| Total | 1,405 (100.0%) | 204 (100.0%) |
Physical Housing Characteristics in Catron County
Housing Structures in Catron County
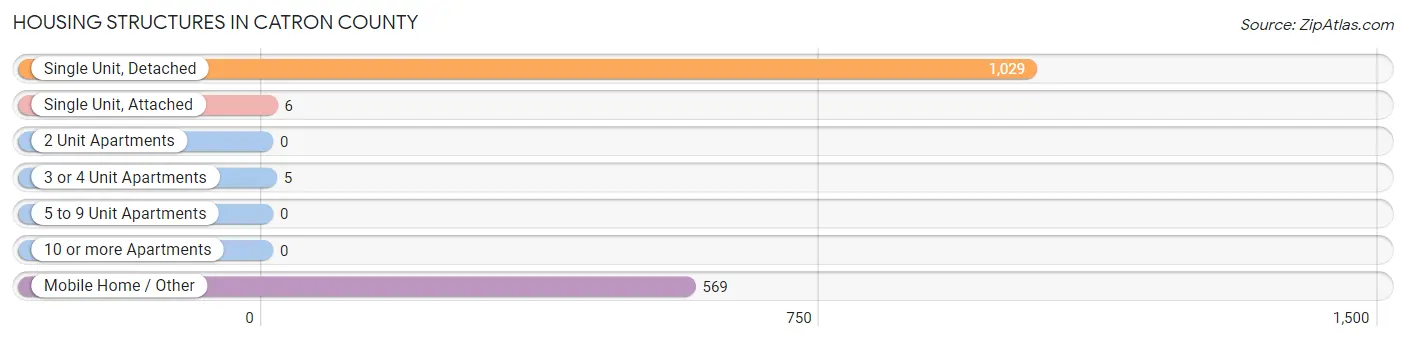
| Structure Type | # Housing Units | % Housing Units |
| Single Unit, Detached | 1,029 | 63.9% |
| Single Unit, Attached | 6 | 0.4% |
| 2 Unit Apartments | 0 | 0.0% |
| 3 or 4 Unit Apartments | 5 | 0.3% |
| 5 to 9 Unit Apartments | 0 | 0.0% |
| 10 or more Apartments | 0 | 0.0% |
| Mobile Home / Other | 569 | 35.4% |
| Total | 1,609 | 100.0% |
Housing Structures by Occupancy in Catron County
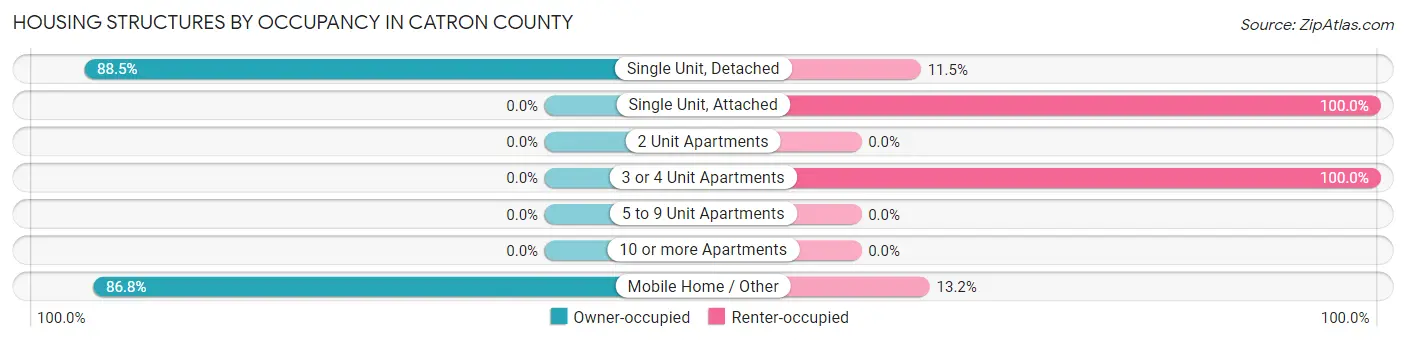
| Structure Type | Owner-occupied | Renter-occupied |
| Single Unit, Detached | 911 (88.5%) | 118 (11.5%) |
| Single Unit, Attached | 0 (0.0%) | 6 (100.0%) |
| 2 Unit Apartments | 0 (0.0%) | 0 (0.0%) |
| 3 or 4 Unit Apartments | 0 (0.0%) | 5 (100.0%) |
| 5 to 9 Unit Apartments | 0 (0.0%) | 0 (0.0%) |
| 10 or more Apartments | 0 (0.0%) | 0 (0.0%) |
| Mobile Home / Other | 494 (86.8%) | 75 (13.2%) |
| Total | 1,405 (87.3%) | 204 (12.7%) |
Housing Structures by Number of Rooms in Catron County
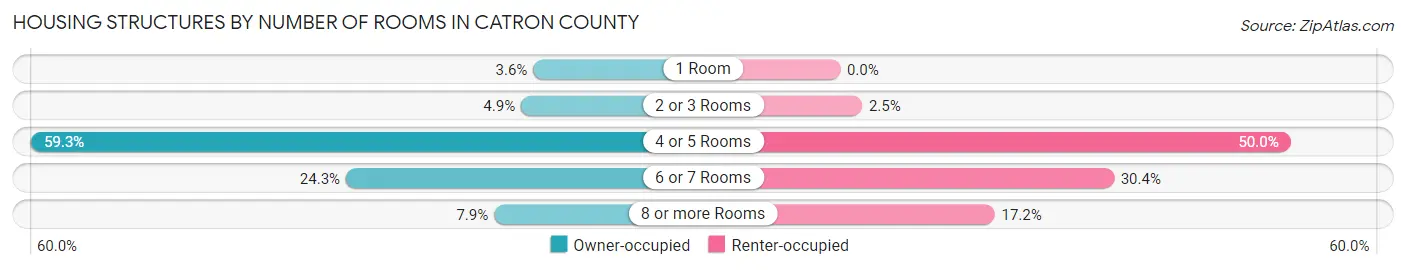
| Number of Rooms | Owner-occupied | Renter-occupied |
| 1 Room | 50 (3.6%) | 0 (0.0%) |
| 2 or 3 Rooms | 69 (4.9%) | 5 (2.5%) |
| 4 or 5 Rooms | 833 (59.3%) | 102 (50.0%) |
| 6 or 7 Rooms | 342 (24.3%) | 62 (30.4%) |
| 8 or more Rooms | 111 (7.9%) | 35 (17.2%) |
| Total | 1,405 (100.0%) | 204 (100.0%) |
Housing Structure by Heating Type in Catron County
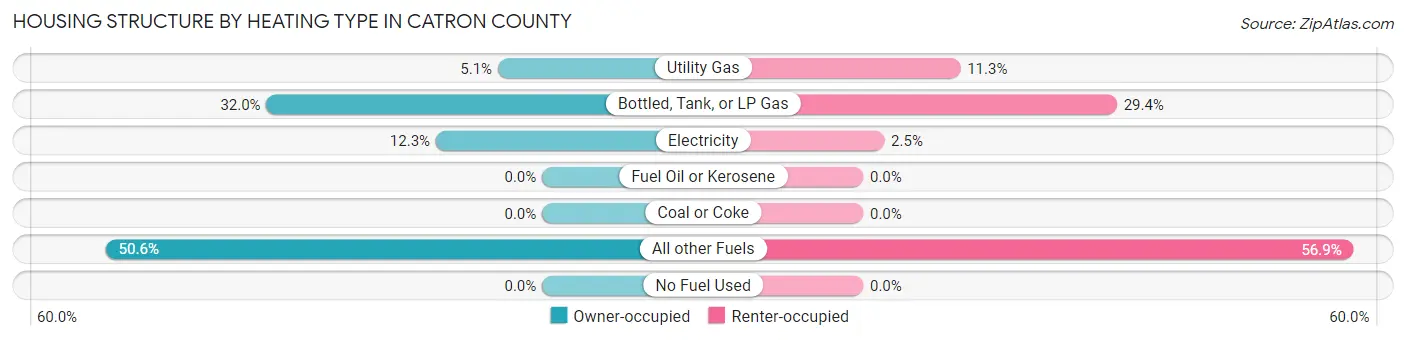
| Heating Type | Owner-occupied | Renter-occupied |
| Utility Gas | 72 (5.1%) | 23 (11.3%) |
| Bottled, Tank, or LP Gas | 449 (32.0%) | 60 (29.4%) |
| Electricity | 173 (12.3%) | 5 (2.5%) |
| Fuel Oil or Kerosene | 0 (0.0%) | 0 (0.0%) |
| Coal or Coke | 0 (0.0%) | 0 (0.0%) |
| All other Fuels | 711 (50.6%) | 116 (56.9%) |
| No Fuel Used | 0 (0.0%) | 0 (0.0%) |
| Total | 1,405 (100.0%) | 204 (100.0%) |
Household Vehicle Usage in Catron County
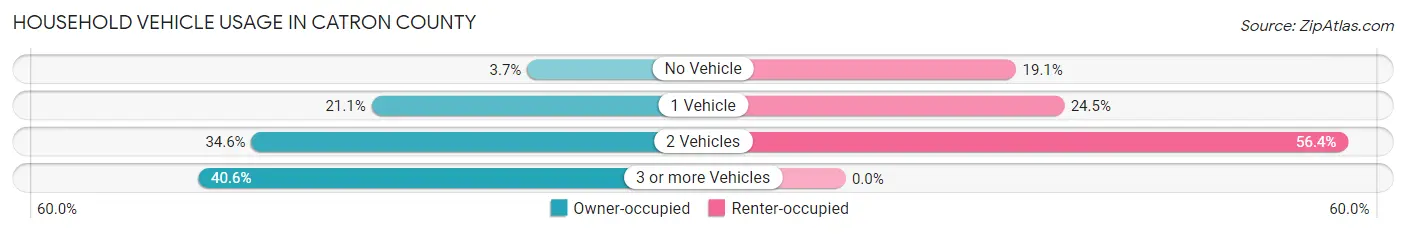
| Vehicles per Household | Owner-occupied | Renter-occupied |
| No Vehicle | 52 (3.7%) | 39 (19.1%) |
| 1 Vehicle | 297 (21.1%) | 50 (24.5%) |
| 2 Vehicles | 486 (34.6%) | 115 (56.4%) |
| 3 or more Vehicles | 570 (40.6%) | 0 (0.0%) |
| Total | 1,405 (100.0%) | 204 (100.0%) |
Real Estate & Mortgages in Catron County
Real Estate and Mortgage Overview in Catron County
| Characteristic | Without Mortgage | With Mortgage |
| Housing Units | 1,162 | 243 |
| Median Property Value | $184,400 | $152,500 |
| Median Household Income | $45,200 | $0 |
| Monthly Housing Costs | $362 | $0 |
| Real Estate Taxes | $772 | $0 |
Property Value by Mortgage Status in Catron County
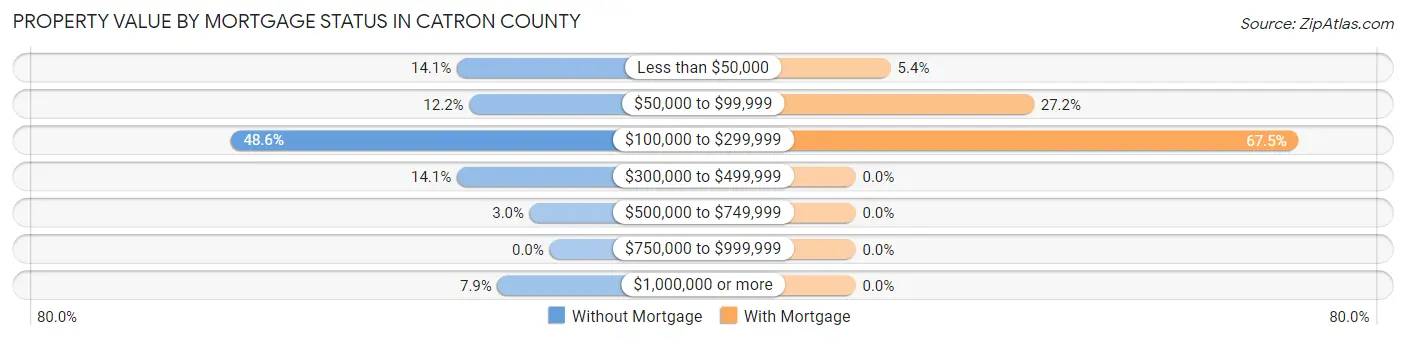
| Property Value | Without Mortgage | With Mortgage |
| Less than $50,000 | 164 (14.1%) | 13 (5.3%) |
| $50,000 to $99,999 | 142 (12.2%) | 66 (27.2%) |
| $100,000 to $299,999 | 565 (48.6%) | 164 (67.5%) |
| $300,000 to $499,999 | 164 (14.1%) | 0 (0.0%) |
| $500,000 to $749,999 | 35 (3.0%) | 0 (0.0%) |
| $750,000 to $999,999 | 0 (0.0%) | 0 (0.0%) |
| $1,000,000 or more | 92 (7.9%) | 0 (0.0%) |
| Total | 1,162 (100.0%) | 243 (100.0%) |
Household Income by Mortgage Status in Catron County
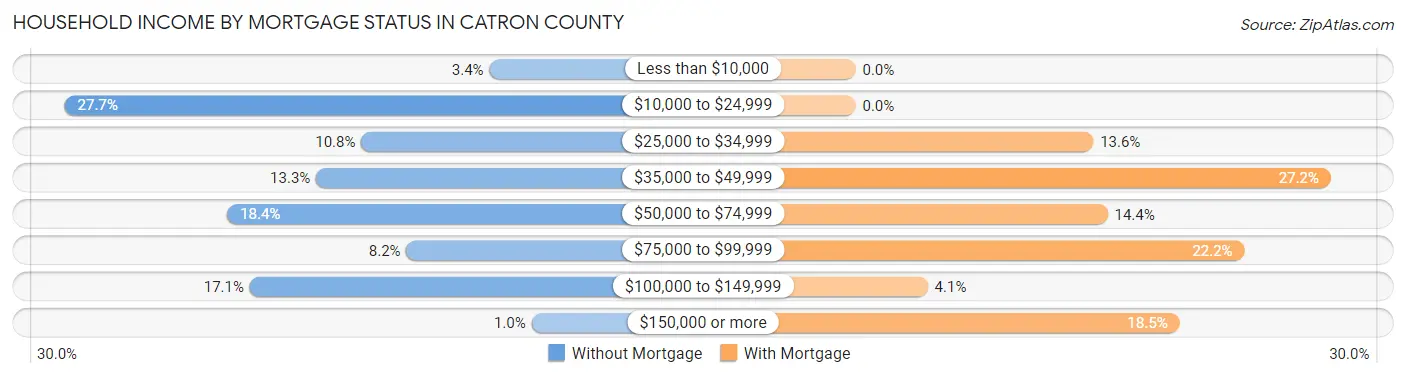
| Household Income | Without Mortgage | With Mortgage |
| Less than $10,000 | 40 (3.4%) | 0 (0.0%) |
| $10,000 to $24,999 | 322 (27.7%) | 0 (0.0%) |
| $25,000 to $34,999 | 125 (10.8%) | 33 (13.6%) |
| $35,000 to $49,999 | 155 (13.3%) | 66 (27.2%) |
| $50,000 to $74,999 | 214 (18.4%) | 35 (14.4%) |
| $75,000 to $99,999 | 95 (8.2%) | 54 (22.2%) |
| $100,000 to $149,999 | 199 (17.1%) | 10 (4.1%) |
| $150,000 or more | 12 (1.0%) | 45 (18.5%) |
| Total | 1,162 (100.0%) | 243 (100.0%) |
Property Value to Household Income Ratio in Catron County
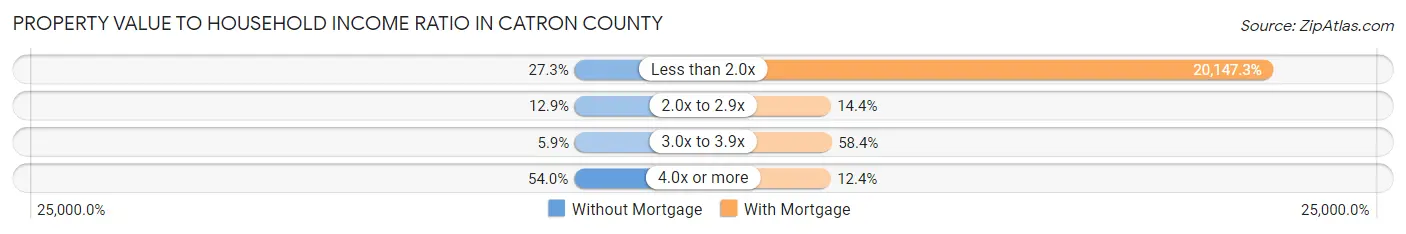
| Value-to-Income Ratio | Without Mortgage | With Mortgage |
| Less than 2.0x | 317 (27.3%) | 48,958 (20,147.3%) |
| 2.0x to 2.9x | 150 (12.9%) | 35 (14.4%) |
| 3.0x to 3.9x | 68 (5.9%) | 142 (58.4%) |
| 4.0x or more | 627 (54.0%) | 30 (12.3%) |
| Total | 1,162 (100.0%) | 243 (100.0%) |
Real Estate Taxes by Mortgage Status in Catron County
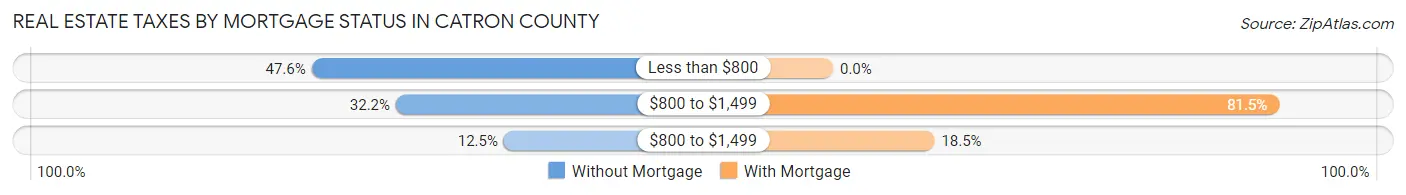
| Property Taxes | Without Mortgage | With Mortgage |
| Less than $800 | 553 (47.6%) | 0 (0.0%) |
| $800 to $1,499 | 374 (32.2%) | 198 (81.5%) |
| $800 to $1,499 | 145 (12.5%) | 45 (18.5%) |
| Total | 1,162 (100.0%) | 243 (100.0%) |
Health & Disability in Catron County
Health Insurance Coverage by Age in Catron County
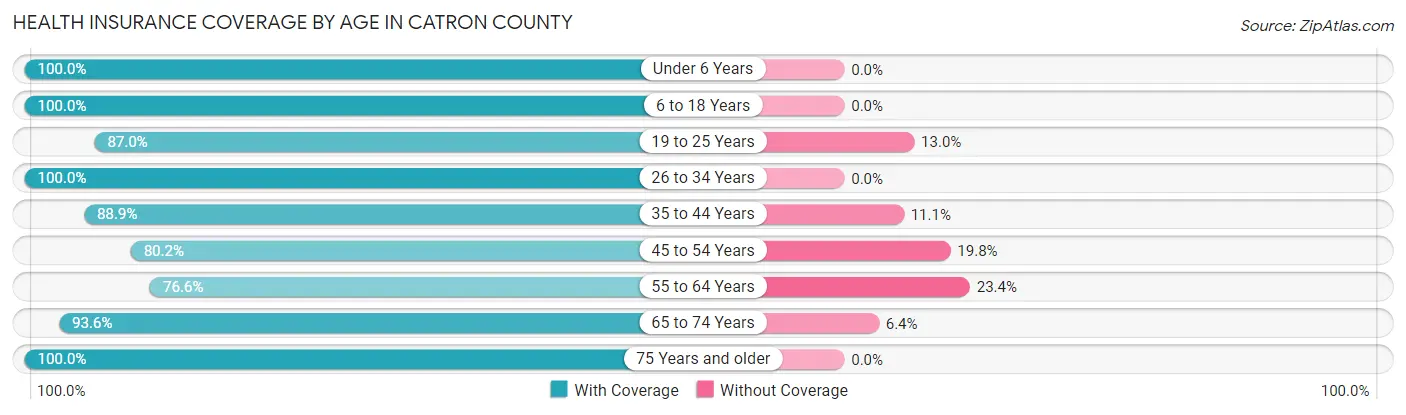
| Age Bracket | With Coverage | Without Coverage |
| Under 6 Years | 50 (100.0%) | 0 (0.0%) |
| 6 to 18 Years | 372 (100.0%) | 0 (0.0%) |
| 19 to 25 Years | 327 (87.0%) | 49 (13.0%) |
| 26 to 34 Years | 47 (100.0%) | 0 (0.0%) |
| 35 to 44 Years | 305 (88.9%) | 38 (11.1%) |
| 45 to 54 Years | 231 (80.2%) | 57 (19.8%) |
| 55 to 64 Years | 445 (76.6%) | 136 (23.4%) |
| 65 to 74 Years | 684 (93.6%) | 47 (6.4%) |
| 75 Years and older | 841 (100.0%) | 0 (0.0%) |
| Total | 3,302 (91.0%) | 327 (9.0%) |
Health Insurance Coverage by Citizenship Status in Catron County
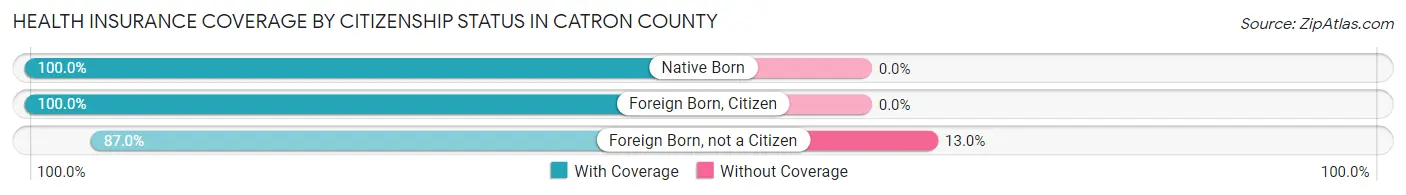
| Citizenship Status | With Coverage | Without Coverage |
| Native Born | 50 (100.0%) | 0 (0.0%) |
| Foreign Born, Citizen | 372 (100.0%) | 0 (0.0%) |
| Foreign Born, not a Citizen | 327 (87.0%) | 49 (13.0%) |
Health Insurance Coverage by Household Income in Catron County
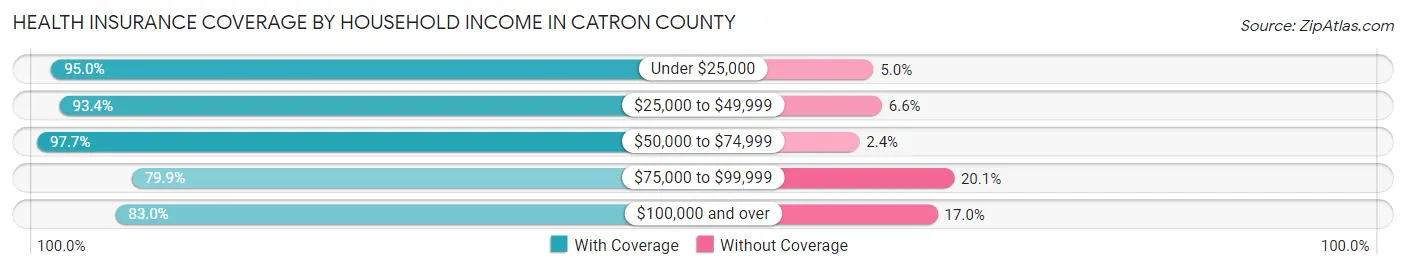
| Household Income | With Coverage | Without Coverage |
| Under $25,000 | 722 (95.0%) | 38 (5.0%) |
| $25,000 to $49,999 | 868 (93.4%) | 61 (6.6%) |
| $50,000 to $74,999 | 832 (97.7%) | 20 (2.4%) |
| $75,000 to $99,999 | 199 (79.9%) | 50 (20.1%) |
| $100,000 and over | 551 (83.0%) | 113 (17.0%) |
Public vs Private Health Insurance Coverage by Age in Catron County
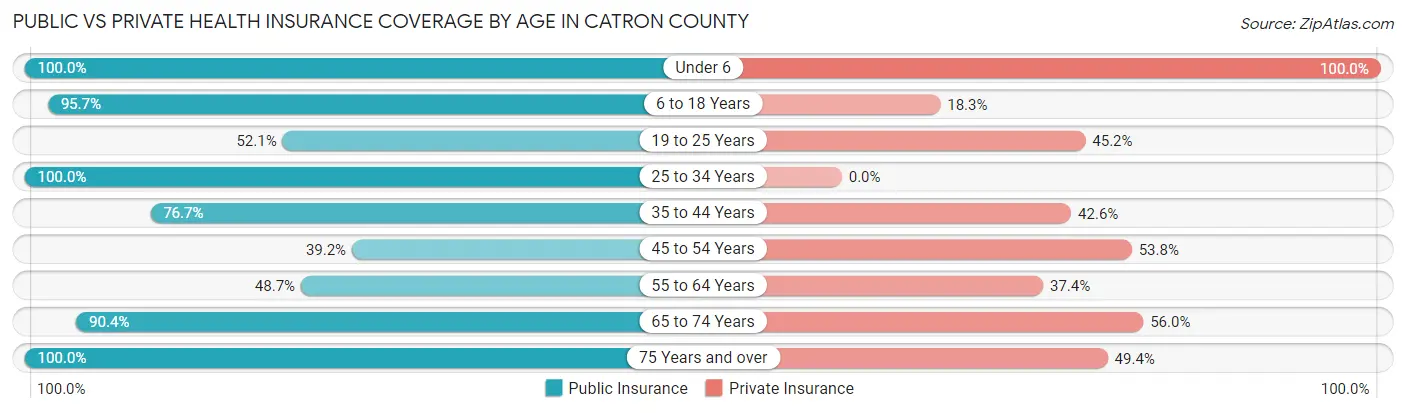
| Age Bracket | Public Insurance | Private Insurance |
| Under 6 | 50 (100.0%) | 50 (100.0%) |
| 6 to 18 Years | 356 (95.7%) | 68 (18.3%) |
| 19 to 25 Years | 196 (52.1%) | 170 (45.2%) |
| 25 to 34 Years | 47 (100.0%) | 0 (0.0%) |
| 35 to 44 Years | 263 (76.7%) | 146 (42.6%) |
| 45 to 54 Years | 113 (39.2%) | 155 (53.8%) |
| 55 to 64 Years | 283 (48.7%) | 217 (37.3%) |
| 65 to 74 Years | 661 (90.4%) | 409 (55.9%) |
| 75 Years and over | 841 (100.0%) | 415 (49.3%) |
| Total | 2,810 (77.4%) | 1,630 (44.9%) |
Disability Status by Sex by Age in Catron County
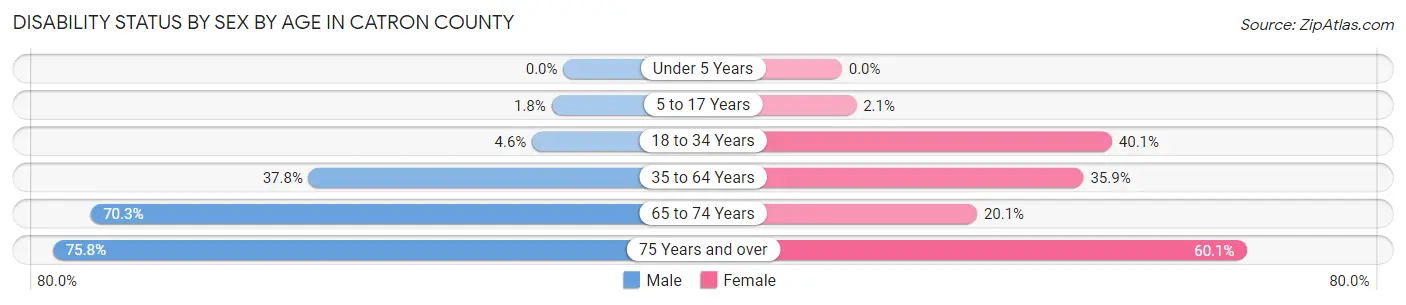
| Age Bracket | Male | Female |
| Under 5 Years | 0 (0.0%) | 0 (0.0%) |
| 5 to 17 Years | 4 (1.8%) | 4 (2.1%) |
| 18 to 34 Years | 10 (4.6%) | 83 (40.1%) |
| 35 to 64 Years | 197 (37.8%) | 248 (35.9%) |
| 65 to 74 Years | 307 (70.3%) | 59 (20.1%) |
| 75 Years and over | 370 (75.8%) | 212 (60.1%) |
Disability Class by Sex by Age in Catron County
Disability Class: Hearing Difficulty
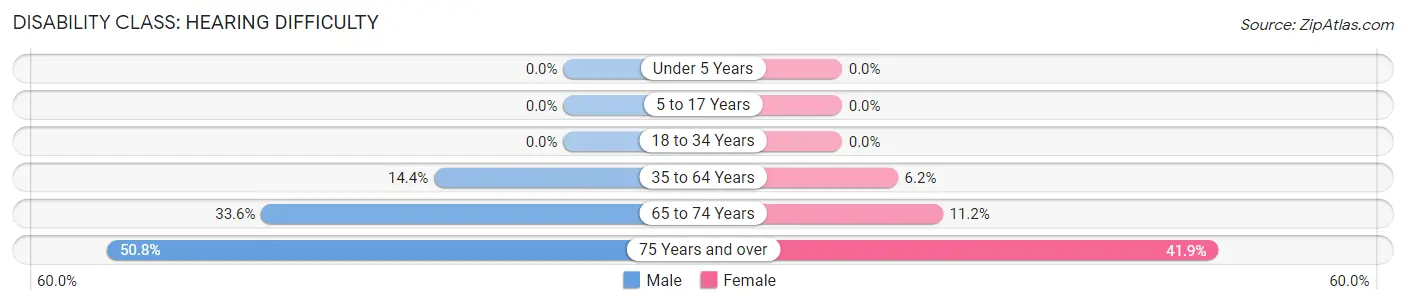
| Age Bracket | Male | Female |
| Under 5 Years | 0 (0.0%) | 0 (0.0%) |
| 5 to 17 Years | 0 (0.0%) | 0 (0.0%) |
| 18 to 34 Years | 0 (0.0%) | 0 (0.0%) |
| 35 to 64 Years | 75 (14.4%) | 43 (6.2%) |
| 65 to 74 Years | 147 (33.6%) | 33 (11.2%) |
| 75 Years and over | 248 (50.8%) | 148 (41.9%) |
Disability Class: Vision Difficulty
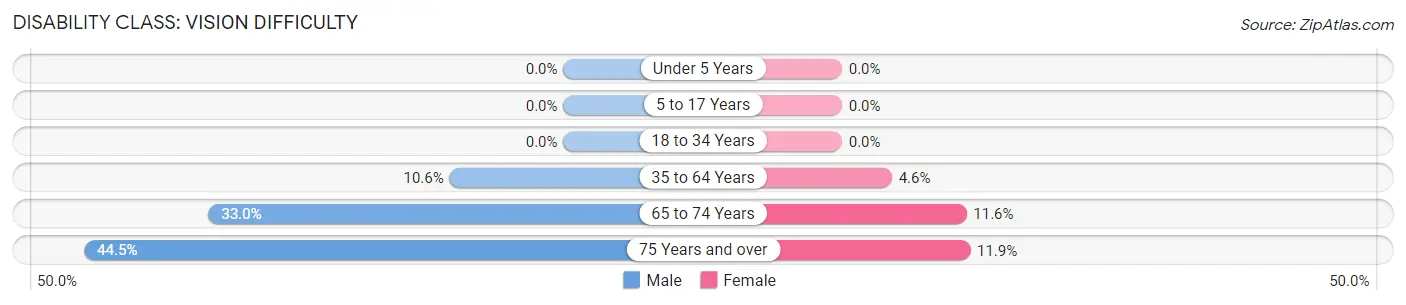
| Age Bracket | Male | Female |
| Under 5 Years | 0 (0.0%) | 0 (0.0%) |
| 5 to 17 Years | 0 (0.0%) | 0 (0.0%) |
| 18 to 34 Years | 0 (0.0%) | 0 (0.0%) |
| 35 to 64 Years | 55 (10.6%) | 32 (4.6%) |
| 65 to 74 Years | 144 (33.0%) | 34 (11.6%) |
| 75 Years and over | 217 (44.5%) | 42 (11.9%) |
Disability Class: Cognitive Difficulty
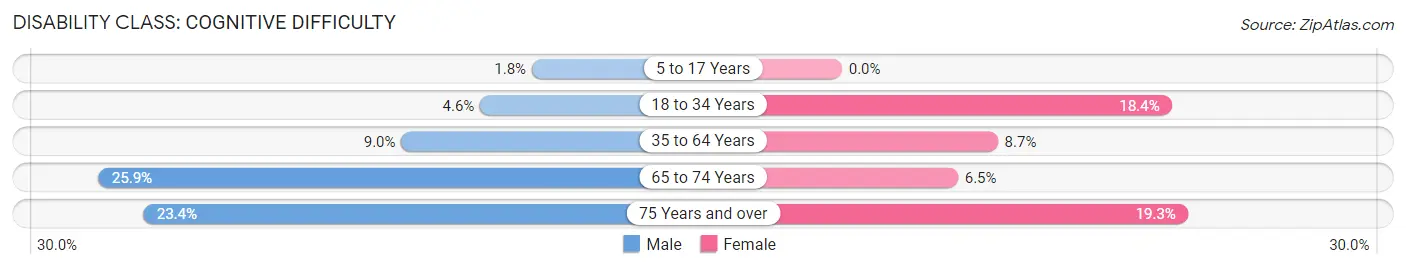
| Age Bracket | Male | Female |
| 5 to 17 Years | 4 (1.8%) | 0 (0.0%) |
| 18 to 34 Years | 10 (4.6%) | 38 (18.4%) |
| 35 to 64 Years | 47 (9.0%) | 60 (8.7%) |
| 65 to 74 Years | 113 (25.9%) | 19 (6.5%) |
| 75 Years and over | 114 (23.4%) | 68 (19.3%) |
Disability Class: Ambulatory Difficulty
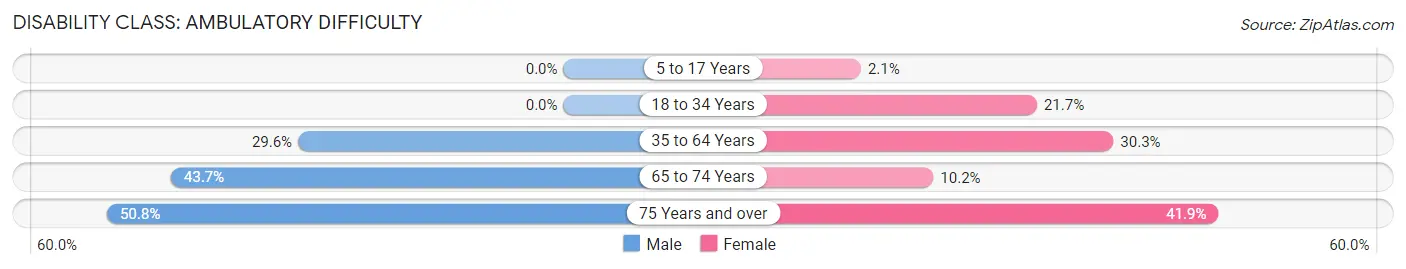
| Age Bracket | Male | Female |
| 5 to 17 Years | 0 (0.0%) | 4 (2.1%) |
| 18 to 34 Years | 0 (0.0%) | 45 (21.7%) |
| 35 to 64 Years | 154 (29.6%) | 209 (30.2%) |
| 65 to 74 Years | 191 (43.7%) | 30 (10.2%) |
| 75 Years and over | 248 (50.8%) | 148 (41.9%) |
Disability Class: Self-Care Difficulty
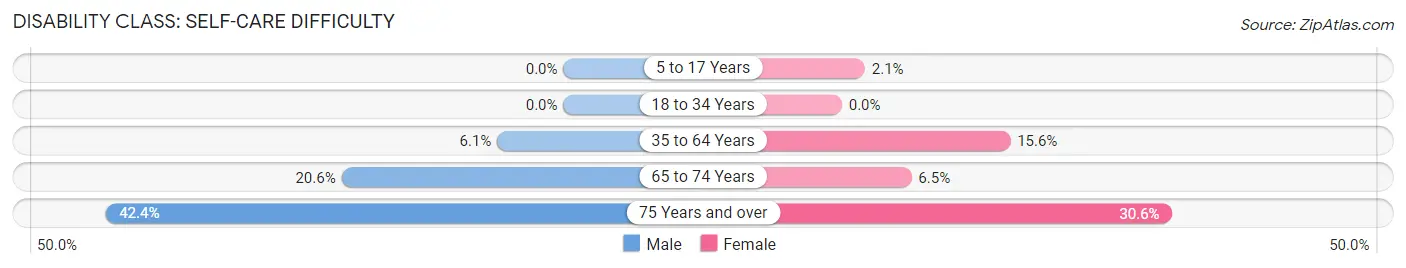
| Age Bracket | Male | Female |
| 5 to 17 Years | 0 (0.0%) | 4 (2.1%) |
| 18 to 34 Years | 0 (0.0%) | 0 (0.0%) |
| 35 to 64 Years | 32 (6.1%) | 108 (15.6%) |
| 65 to 74 Years | 90 (20.6%) | 19 (6.5%) |
| 75 Years and over | 207 (42.4%) | 108 (30.6%) |
Technology Access in Catron County
Computing Device Access in Catron County
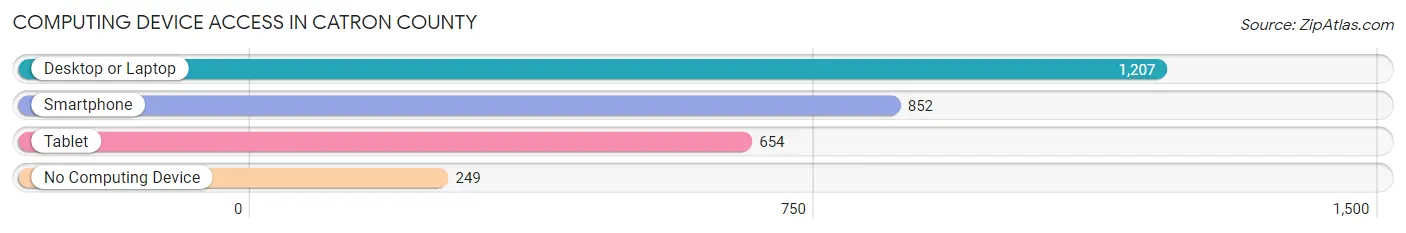
| Device Type | # Households | % Households |
| Desktop or Laptop | 1,207 | 75.0% |
| Smartphone | 852 | 52.9% |
| Tablet | 654 | 40.6% |
| No Computing Device | 249 | 15.5% |
| Total | 1,609 | 100.0% |
Internet Access in Catron County
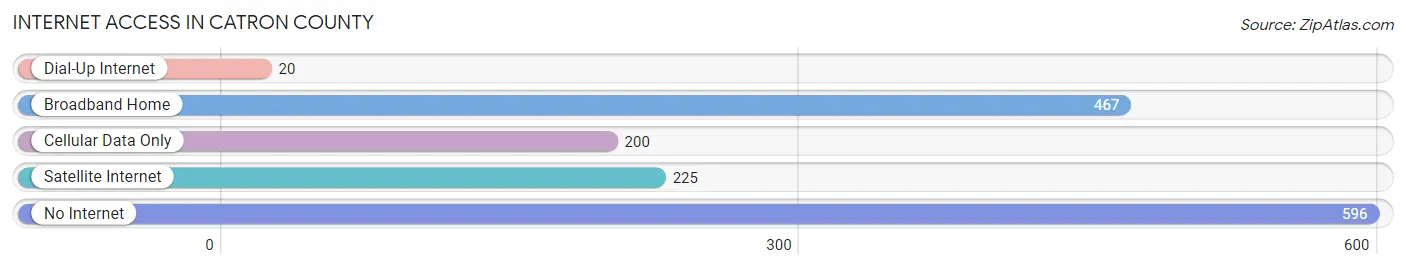
| Internet Type | # Households | % Households |
| Dial-Up Internet | 20 | 1.2% |
| Broadband Home | 467 | 29.0% |
| Cellular Data Only | 200 | 12.4% |
| Satellite Internet | 225 | 14.0% |
| No Internet | 596 | 37.0% |
| Total | 1,609 | 100.0% |
Catron County Summary
Catron County is located in the southwestern corner of New Mexico, and is the largest county in the state. It is bordered by Arizona to the west, Grant County to the north, Socorro County to the east, and Hidalgo County to the south. The county seat is Reserve, and the largest town is Quemado. The county was established in 1921 and named after Thomas B. Catron, a prominent lawyer and politician in the late 19th century.
Geography
Catron County covers an area of 6,928 square miles, making it the largest county in New Mexico. It is located in the southwestern corner of the state, and is bordered by Arizona to the west, Grant County to the north, Socorro County to the east, and Hidalgo County to the south. The county is mostly mountainous, with the Gila National Forest covering much of the area. The highest point in the county is the summit of Mogollon Baldy, which has an elevation of 10,783 feet. The county also contains the Gila Wilderness, the first designated wilderness area in the United States.
The county is divided into two distinct regions. The western half is dominated by the Gila National Forest, while the eastern half is mostly grassland and desert. The county is home to several rivers, including the Gila, San Francisco, and San Jose. The county also contains several lakes, including Lake Roberts, Lake Valley, and Lake Roberts.
Demographics
As of the 2010 census, Catron County had a population of 3,725. The population density was 0.5 people per square mile. The racial makeup of the county was 83.3% White, 0.3% African American, 1.2% Native American, 0.2% Asian, 0.1% Pacific Islander, 11.7% from other races, and 3.2% from two or more races. Hispanic or Latino of any race were 33.3% of the population.
The median income for a household in the county was $30,938, and the median income for a family was $35,938. The per capita income for the county was $15,938. About 17.3% of families and 22.2% of the population were below the poverty line, including 28.3% of those under age 18 and 11.2% of those age 65 or over.
Economy
Catron County is largely rural and agricultural. The county is home to several ranches and farms, and the main crops grown are hay, alfalfa, and wheat. The county is also home to several mining operations, including copper, gold, and uranium. The county is also home to several tourist attractions, including the Gila Cliff Dwellings National Monument and the Gila National Forest.
The county is served by two airports, the Quemado Municipal Airport and the Reserve Airport. The county is also served by several highways, including Interstate 10, U.S. Route 180, and New Mexico State Road 12.
Conclusion
Catron County is a large, rural county located in the southwestern corner of New Mexico. The county is home to several ranches and farms, as well as several mining operations. The county is also home to several tourist attractions, including the Gila Cliff Dwellings National Monument and the Gila National Forest. The county is served by two airports and several highways, and has a population of 3,725 as of the 2010 census.
Common Questions
What is Per Capita Income in Catron County?
Per Capita income in Catron County is $26,678.
What is the Median Family Income in Catron County?
Median Family Income in Catron County is $60,273.
What is the Median Household income in Catron County?
Median Household Income in Catron County is $44,777.
What is Income or Wage Gap in Catron County?
Income or Wage Gap in Catron County is 15.4%.
Women in Catron County earn 84.6 cents for every dollar earned by a man.
What is Family Income Deficit in Catron County?
Family Income Deficit in Catron County is $2,776.
Families that are below poverty line in Catron County earn $2,776 less on average than the poverty threshold level.
What is Inequality or Gini Index in Catron County?
Inequality or Gini Index in Catron County is 0.41.
What is the Total Population of Catron County?
Total Population of Catron County is 3,635.
What is the Total Male Population of Catron County?
Total Male Population of Catron County is 1,903.
What is the Total Female Population of Catron County?
Total Female Population of Catron County is 1,732.
What is the Ratio of Males per 100 Females in Catron County?
There are 109.87 Males per 100 Females in Catron County.
What is the Ratio of Females per 100 Males in Catron County?
There are 91.01 Females per 100 Males in Catron County.
What is the Median Population Age in Catron County?
Median Population Age in Catron County is 59.5 Years.
What is the Average Family Size in Catron County
Average Family Size in Catron County is 2.9 People.
What is the Average Household Size in Catron County
Average Household Size in Catron County is 2.1 People.
How Large is the Labor Force in Catron County?
There are 1,019 People in the Labor Forcein in Catron County.
What is the Percentage of People in the Labor Force in Catron County?
30.7% of People are in the Labor Force in Catron County.
What is the Unemployment Rate in Catron County?
Unemployment Rate in Catron County is 5.7%.