Yazoo County, MS Map & Demographics
Yazoo County Map
Yazoo County Overview
$19,836
PER CAPITA INCOME
$53,792
AVG FAMILY INCOME
$41,867
AVG HOUSEHOLD INCOME
6.7%
WAGE / INCOME GAP [ % ]
93.3¢/ $1
WAGE / INCOME GAP [ $ ]
$11,784
FAMILY INCOME DEFICIT
0.48
INEQUALITY / GINI INDEX
27,467
TOTAL POPULATION
16,207
MALE POPULATION
11,260
FEMALE POPULATION
143.93
MALES / 100 FEMALES
69.48
FEMALES / 100 MALES
36.8
MEDIAN AGE
3.2
AVG FAMILY SIZE
2.6
AVG HOUSEHOLD SIZE
10,098
LABOR FORCE [ PEOPLE ]
45.1%
PERCENT IN LABOR FORCE
10.4%
UNEMPLOYMENT RATE
Yazoo County Area Codes
Income in Yazoo County
Income Overview in Yazoo County
Per Capita Income in Yazoo County is $19,836, while median incomes of families and households are $53,792 and $41,867 respectively.
| Characteristic | Number | Measure |
| Per Capita Income | 27,467 | $19,836 |
| Median Family Income | 5,545 | $53,792 |
| Mean Family Income | 5,545 | $64,027 |
| Median Household Income | 8,807 | $41,867 |
| Mean Household Income | 8,807 | $58,124 |
| Income Deficit | 5,545 | $11,784 |
| Wage / Income Gap (%) | 27,467 | 6.71% |
| Wage / Income Gap ($) | 27,467 | 93.29¢ per $1 |
| Gini / Inequality Index | 27,467 | 0.48 |
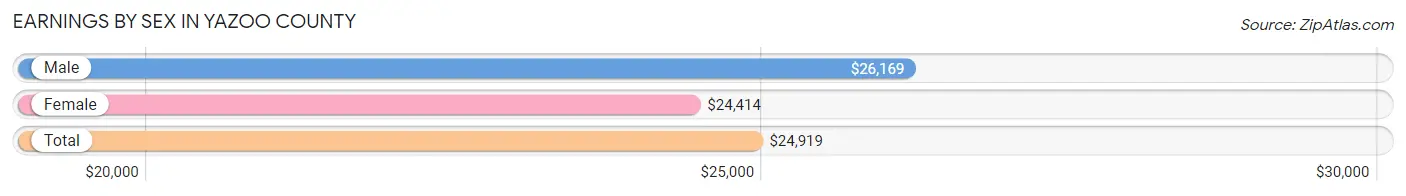
Earnings by Sex in Yazoo County
Average Earnings in Yazoo County are $24,919, $26,169 for men and $24,414 for women, a difference of 6.7%.
| Sex | Number | Average Earnings |
| Male | 6,685 (57.9%) | $26,169 |
| Female | 4,857 (42.1%) | $24,414 |
| Total | 11,542 (100.0%) | $24,919 |
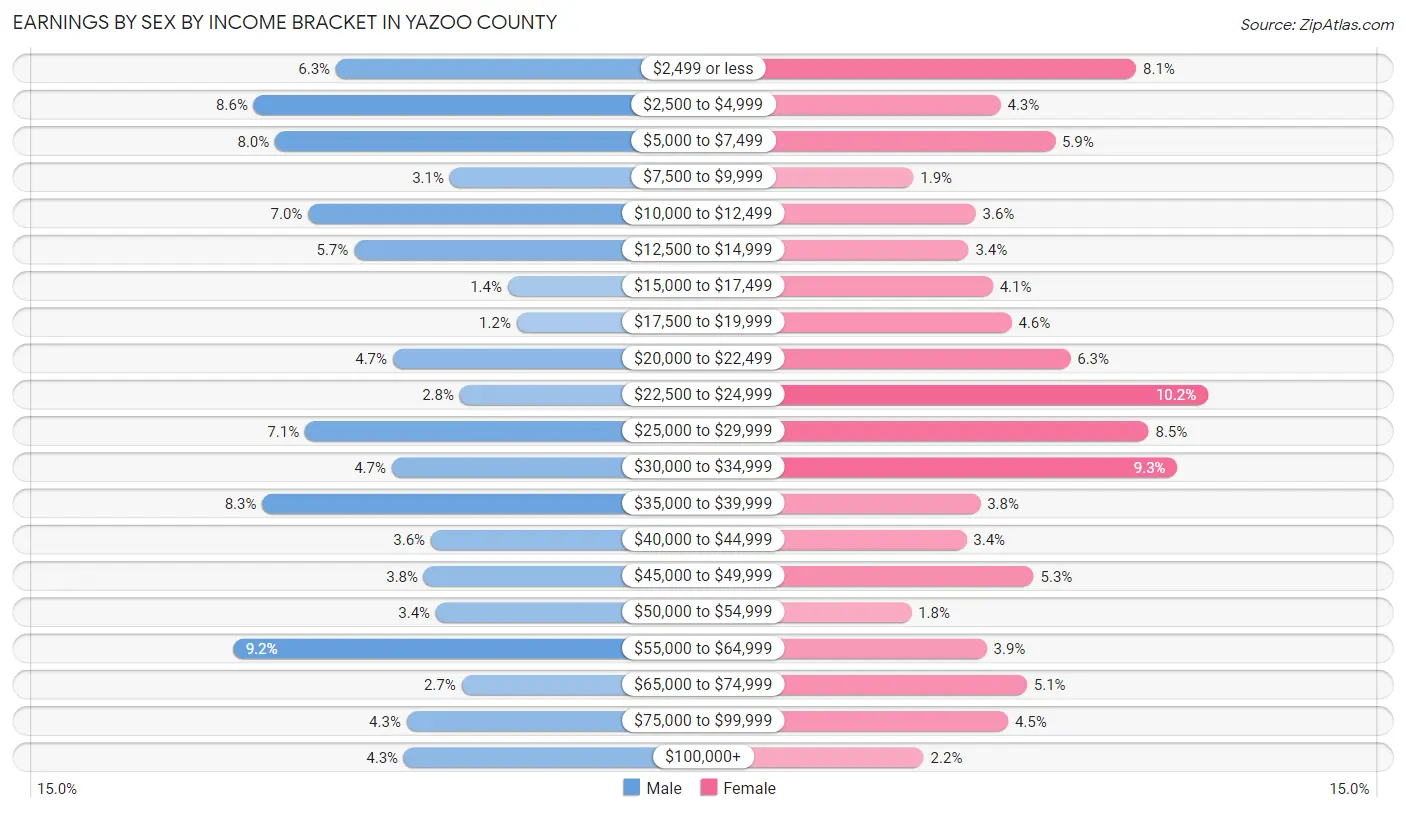
Earnings by Sex by Income Bracket in Yazoo County
The most common earnings brackets in Yazoo County are $55,000 to $64,999 for men (612 | 9.1%) and $22,500 to $24,999 for women (493 | 10.2%).
| Income | Male | Female |
| $2,499 or less | 418 (6.2%) | 395 (8.1%) |
| $2,500 to $4,999 | 572 (8.6%) | 210 (4.3%) |
| $5,000 to $7,499 | 532 (8.0%) | 284 (5.9%) |
| $7,500 to $9,999 | 204 (3.0%) | 91 (1.9%) |
| $10,000 to $12,499 | 470 (7.0%) | 176 (3.6%) |
| $12,500 to $14,999 | 384 (5.7%) | 166 (3.4%) |
| $15,000 to $17,499 | 95 (1.4%) | 199 (4.1%) |
| $17,500 to $19,999 | 78 (1.2%) | 225 (4.6%) |
| $20,000 to $22,499 | 311 (4.6%) | 305 (6.3%) |
| $22,500 to $24,999 | 185 (2.8%) | 493 (10.2%) |
| $25,000 to $29,999 | 476 (7.1%) | 412 (8.5%) |
| $30,000 to $34,999 | 313 (4.7%) | 451 (9.3%) |
| $35,000 to $39,999 | 556 (8.3%) | 182 (3.7%) |
| $40,000 to $44,999 | 239 (3.6%) | 163 (3.4%) |
| $45,000 to $49,999 | 253 (3.8%) | 255 (5.2%) |
| $50,000 to $54,999 | 230 (3.4%) | 88 (1.8%) |
| $55,000 to $64,999 | 612 (9.1%) | 191 (3.9%) |
| $65,000 to $74,999 | 182 (2.7%) | 246 (5.1%) |
| $75,000 to $99,999 | 285 (4.3%) | 220 (4.5%) |
| $100,000+ | 290 (4.3%) | 105 (2.2%) |
| Total | 6,685 (100.0%) | 4,857 (100.0%) |
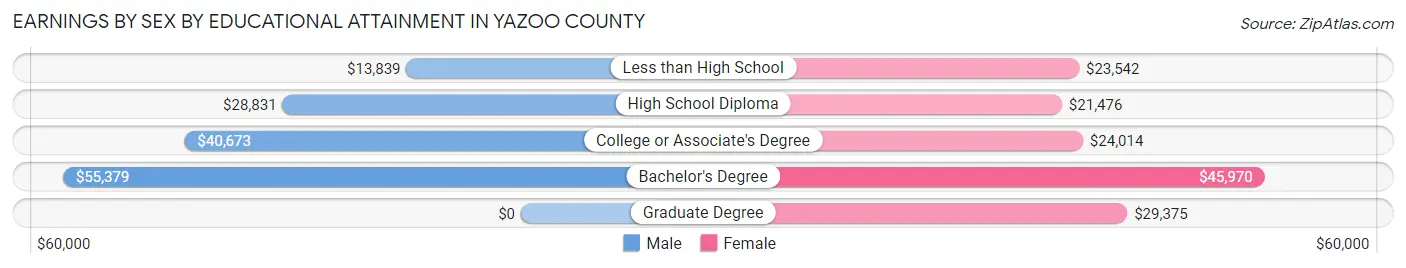
Earnings by Sex by Educational Attainment in Yazoo County
Average earnings in Yazoo County are $28,644 for men and $24,574 for women, a difference of 14.2%. Men with an educational attainment of bachelor's degree enjoy the highest average annual earnings of $55,379, while those with less than high school education earn the least with $13,839. Women with an educational attainment of bachelor's degree earn the most with the average annual earnings of $45,970, while those with high school diploma education have the smallest earnings of $21,476.
| Educational Attainment | Male Income | Female Income |
| Less than High School | $13,839 | $23,542 |
| High School Diploma | $28,831 | $21,476 |
| College or Associate's Degree | $40,673 | $24,014 |
| Bachelor's Degree | $55,379 | $45,970 |
| Graduate Degree | - | - |
| Total | $28,644 | $24,574 |
Family Income in Yazoo County
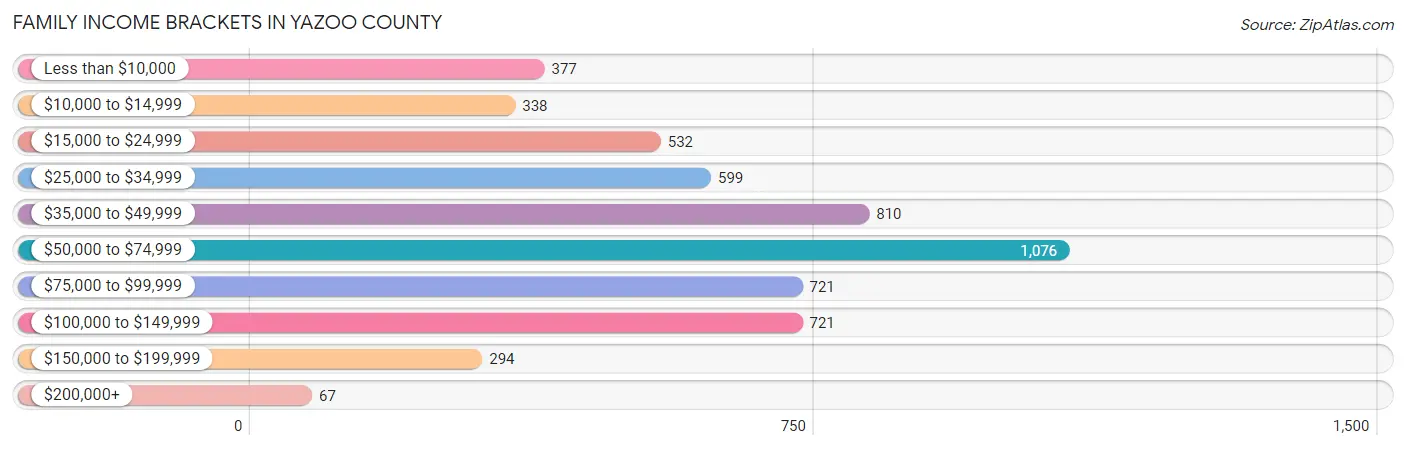
Family Income Brackets in Yazoo County
According to the Yazoo County family income data, there are 1,076 families falling into the $50,000 to $74,999 income range, which is the most common income bracket and makes up 19.4% of all families. Conversely, the $200,000+ income bracket is the least frequent group with only 67 families (1.2%) belonging to this category.
| Income Bracket | # Families | % Families |
| Less than $10,000 | 377 | 6.8% |
| $10,000 to $14,999 | 338 | 6.1% |
| $15,000 to $24,999 | 532 | 9.6% |
| $25,000 to $34,999 | 599 | 10.8% |
| $35,000 to $49,999 | 810 | 14.6% |
| $50,000 to $74,999 | 1,076 | 19.4% |
| $75,000 to $99,999 | 721 | 13.0% |
| $100,000 to $149,999 | 721 | 13.0% |
| $150,000 to $199,999 | 294 | 5.3% |
| $200,000+ | 67 | 1.2% |
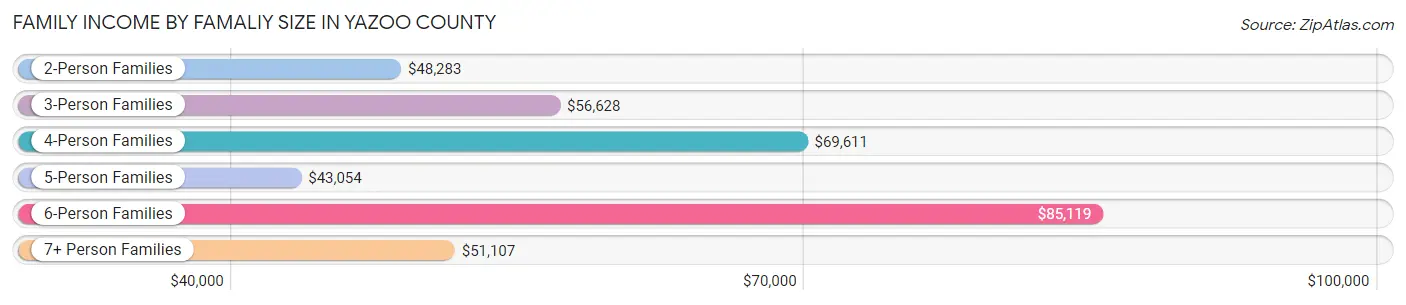
Family Income by Famaliy Size in Yazoo County
6-person families (196 | 3.5%) account for the highest median family income in Yazoo County with $85,119 per family, while 2-person families (2,478 | 44.7%) have the highest median income of $24,142 per family member.
| Income Bracket | # Families | Median Income |
| 2-Person Families | 2,478 (44.7%) | $48,283 |
| 3-Person Families | 1,402 (25.3%) | $56,628 |
| 4-Person Families | 810 (14.6%) | $69,611 |
| 5-Person Families | 600 (10.8%) | $43,054 |
| 6-Person Families | 196 (3.5%) | $85,119 |
| 7+ Person Families | 59 (1.1%) | $51,107 |
| Total | 5,545 (100.0%) | $53,792 |
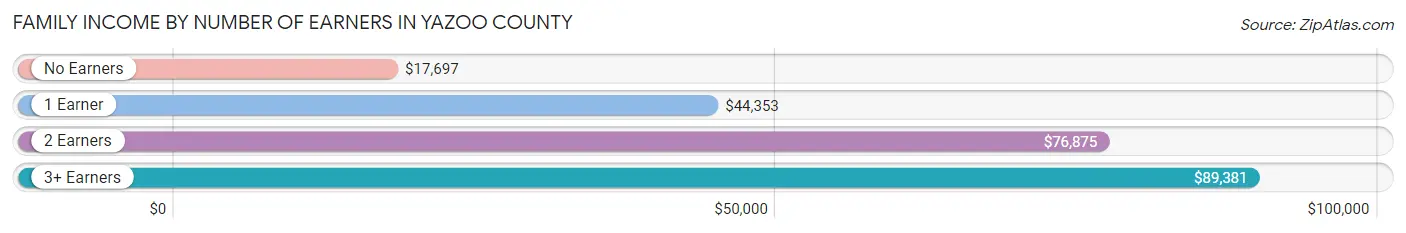
Family Income by Number of Earners in Yazoo County
The median family income in Yazoo County is $53,792, with families comprising 3+ earners (409) having the highest median family income of $89,381, while families with no earners (955) have the lowest median family income of $17,697, accounting for 7.4% and 17.2% of families, respectively.
| Number of Earners | # Families | Median Income |
| No Earners | 955 (17.2%) | $17,697 |
| 1 Earner | 2,193 (39.6%) | $44,353 |
| 2 Earners | 1,988 (35.8%) | $76,875 |
| 3+ Earners | 409 (7.4%) | $89,381 |
| Total | 5,545 (100.0%) | $53,792 |
Household Income in Yazoo County
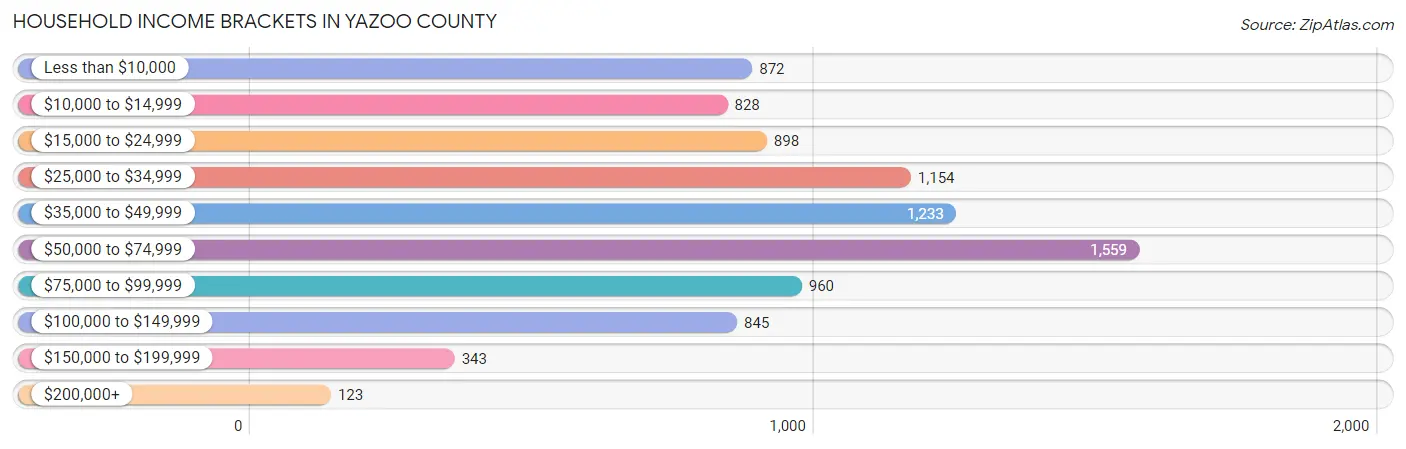
Household Income Brackets in Yazoo County
With 1,559 households falling in the category, the $50,000 to $74,999 income range is the most frequent in Yazoo County, accounting for 17.7% of all households. In contrast, only 123 households (1.4%) fall into the $200,000+ income bracket, making it the least populous group.
| Income Bracket | # Households | % Households |
| Less than $10,000 | 872 | 9.9% |
| $10,000 to $14,999 | 828 | 9.4% |
| $15,000 to $24,999 | 898 | 10.2% |
| $25,000 to $34,999 | 1,154 | 13.1% |
| $35,000 to $49,999 | 1,233 | 14.0% |
| $50,000 to $74,999 | 1,559 | 17.7% |
| $75,000 to $99,999 | 960 | 10.9% |
| $100,000 to $149,999 | 845 | 9.6% |
| $150,000 to $199,999 | 343 | 3.9% |
| $200,000+ | 123 | 1.4% |
Household Income by Householder Age in Yazoo County
The median household income in Yazoo County is $41,867, with the highest median household income of $48,784 found in the 45 to 64 years age bracket for the primary householder. A total of 3,188 households (36.2%) fall into this category. Meanwhile, the 15 to 24 years age bracket for the primary householder has the lowest median household income of $0, with 375 households (4.3%) in this group.
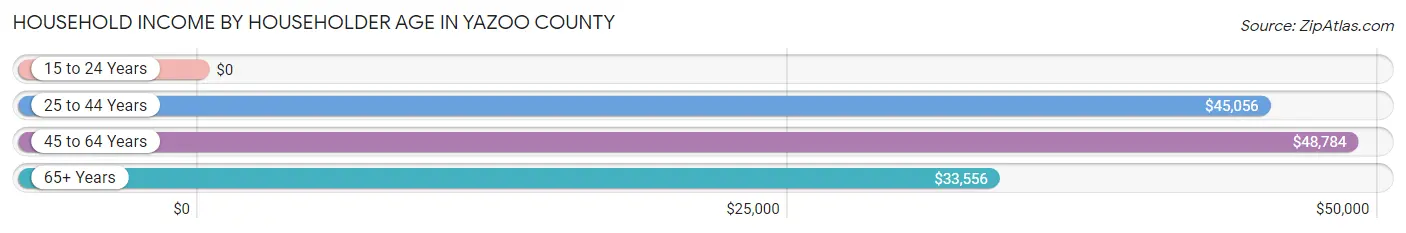
| Income Bracket | # Households | Median Income |
| 15 to 24 Years | 375 (4.3%) | $0 |
| 25 to 44 Years | 2,865 (32.5%) | $45,056 |
| 45 to 64 Years | 3,188 (36.2%) | $48,784 |
| 65+ Years | 2,379 (27.0%) | $33,556 |
| Total | 8,807 (100.0%) | $41,867 |
Poverty in Yazoo County
Income Below Poverty by Sex and Age in Yazoo County
With 25.5% poverty level for males and 32.9% for females among the residents of Yazoo County, under 5 year old males and 12 to 14 year old females are the most vulnerable to poverty, with 360 males (47.4%) and 391 females (73.5%) in their respective age groups living below the poverty level.
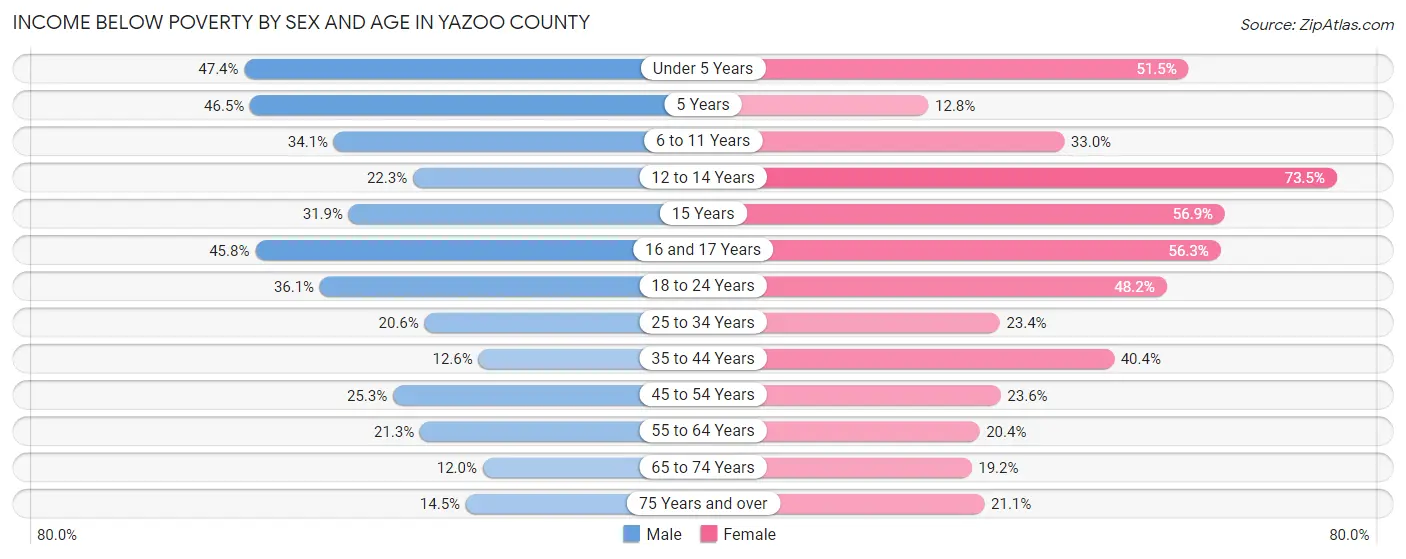
| Age Bracket | Male | Female |
| Under 5 Years | 360 (47.4%) | 364 (51.5%) |
| 5 Years | 60 (46.5%) | 15 (12.8%) |
| 6 to 11 Years | 383 (34.1%) | 308 (33.0%) |
| 12 to 14 Years | 94 (22.3%) | 391 (73.5%) |
| 15 Years | 36 (31.9%) | 91 (56.9%) |
| 16 and 17 Years | 199 (45.8%) | 171 (56.2%) |
| 18 to 24 Years | 399 (36.1%) | 471 (48.2%) |
| 25 to 34 Years | 481 (20.6%) | 328 (23.4%) |
| 35 to 44 Years | 142 (12.6%) | 529 (40.4%) |
| 45 to 54 Years | 327 (25.3%) | 293 (23.5%) |
| 55 to 64 Years | 256 (21.3%) | 301 (20.4%) |
| 65 to 74 Years | 111 (12.0%) | 209 (19.2%) |
| 75 Years and over | 66 (14.5%) | 184 (21.1%) |
| Total | 2,914 (25.5%) | 3,655 (32.9%) |
Income Above Poverty by Sex and Age in Yazoo County
According to the poverty statistics in Yazoo County, males aged 65 to 74 years and females aged 5 years are the age groups that are most secure financially, with 88.0% of males and 87.2% of females in these age groups living above the poverty line.
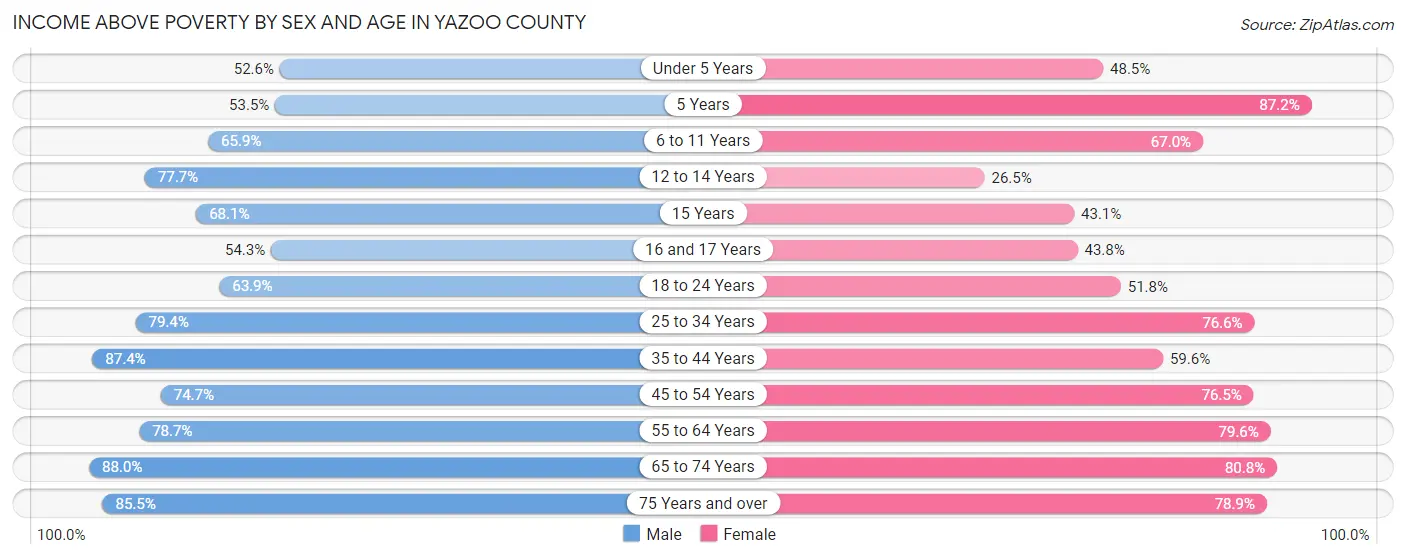
| Age Bracket | Male | Female |
| Under 5 Years | 400 (52.6%) | 343 (48.5%) |
| 5 Years | 69 (53.5%) | 102 (87.2%) |
| 6 to 11 Years | 741 (65.9%) | 626 (67.0%) |
| 12 to 14 Years | 327 (77.7%) | 141 (26.5%) |
| 15 Years | 77 (68.1%) | 69 (43.1%) |
| 16 and 17 Years | 236 (54.2%) | 133 (43.8%) |
| 18 to 24 Years | 705 (63.9%) | 506 (51.8%) |
| 25 to 34 Years | 1,854 (79.4%) | 1,073 (76.6%) |
| 35 to 44 Years | 986 (87.4%) | 781 (59.6%) |
| 45 to 54 Years | 966 (74.7%) | 951 (76.4%) |
| 55 to 64 Years | 947 (78.7%) | 1,174 (79.6%) |
| 65 to 74 Years | 817 (88.0%) | 878 (80.8%) |
| 75 Years and over | 390 (85.5%) | 687 (78.9%) |
| Total | 8,515 (74.5%) | 7,464 (67.1%) |
Income Below Poverty Among Married-Couple Families in Yazoo County
The poverty statistics for married-couple families in Yazoo County show that 10.4% or 291 of the total 2,786 families live below the poverty line. Families with 5 or more children have the highest poverty rate of 100.0%, comprising of 35 families. On the other hand, families with no children have the lowest poverty rate of 4.6%, which includes 66 families.
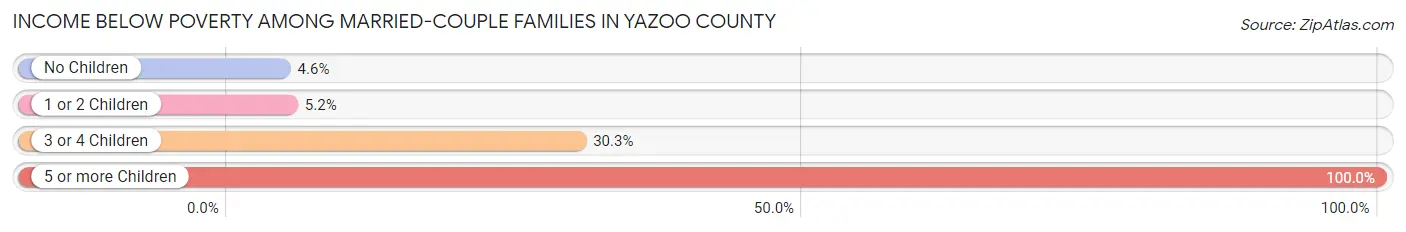
| Children | Above Poverty | Below Poverty |
| No Children | 1,375 (95.4%) | 66 (4.6%) |
| 1 or 2 Children | 782 (94.8%) | 43 (5.2%) |
| 3 or 4 Children | 338 (69.7%) | 147 (30.3%) |
| 5 or more Children | 0 (0.0%) | 35 (100.0%) |
| Total | 2,495 (89.5%) | 291 (10.4%) |
Income Below Poverty Among Single-Parent Households in Yazoo County
According to the poverty data in Yazoo County, 11.1% or 76 single-father households and 38.9% or 805 single-mother households are living below the poverty line. Among single-father households, those with 3 or 4 children have the highest poverty rate, with 16 households (51.6%) experiencing poverty. Likewise, among single-mother households, those with 5 or more children have the highest poverty rate, with 8 households (100.0%) falling below the poverty line.
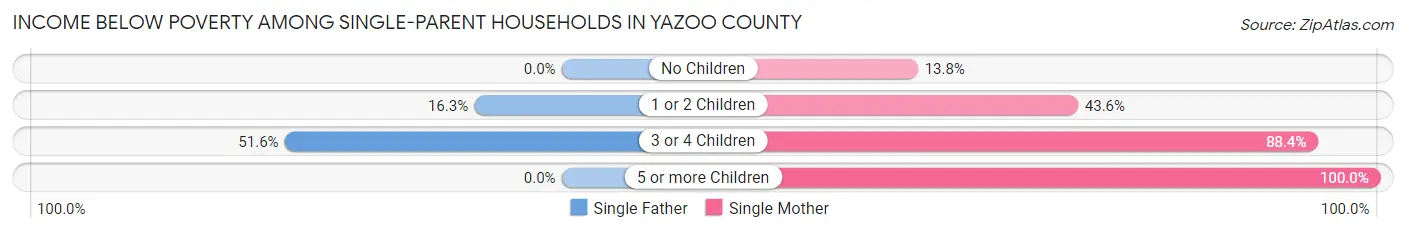
| Children | Single Father | Single Mother |
| No Children | 0 (0.0%) | 103 (13.8%) |
| 1 or 2 Children | 60 (16.3%) | 458 (43.6%) |
| 3 or 4 Children | 16 (51.6%) | 236 (88.4%) |
| 5 or more Children | 0 (0.0%) | 8 (100.0%) |
| Total | 76 (11.1%) | 805 (38.9%) |
Income Below Poverty Among Married-Couple vs Single-Parent Households in Yazoo County
The poverty data for Yazoo County shows that 291 of the married-couple family households (10.4%) and 881 of the single-parent households (31.9%) are living below the poverty level. Within the married-couple family households, those with 5 or more children have the highest poverty rate, with 35 households (100.0%) falling below the poverty line. Among the single-parent households, those with 5 or more children have the highest poverty rate, with 8 household (100.0%) living below poverty.
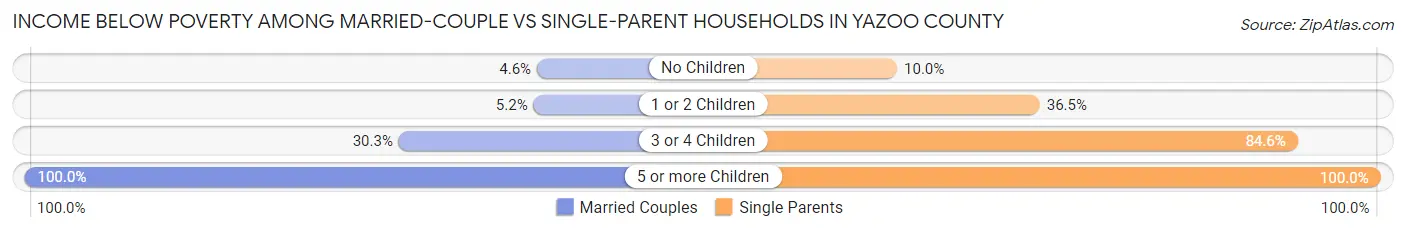
| Children | Married-Couple Families | Single-Parent Households |
| No Children | 66 (4.6%) | 103 (10.0%) |
| 1 or 2 Children | 43 (5.2%) | 518 (36.5%) |
| 3 or 4 Children | 147 (30.3%) | 252 (84.6%) |
| 5 or more Children | 35 (100.0%) | 8 (100.0%) |
| Total | 291 (10.4%) | 881 (31.9%) |
Race in Yazoo County
The most populous races in Yazoo County are Black / African American (16,686 | 60.8%), White / Caucasian (10,167 | 37.0%), and Hispanic or Latino (1,086 | 4.0%).
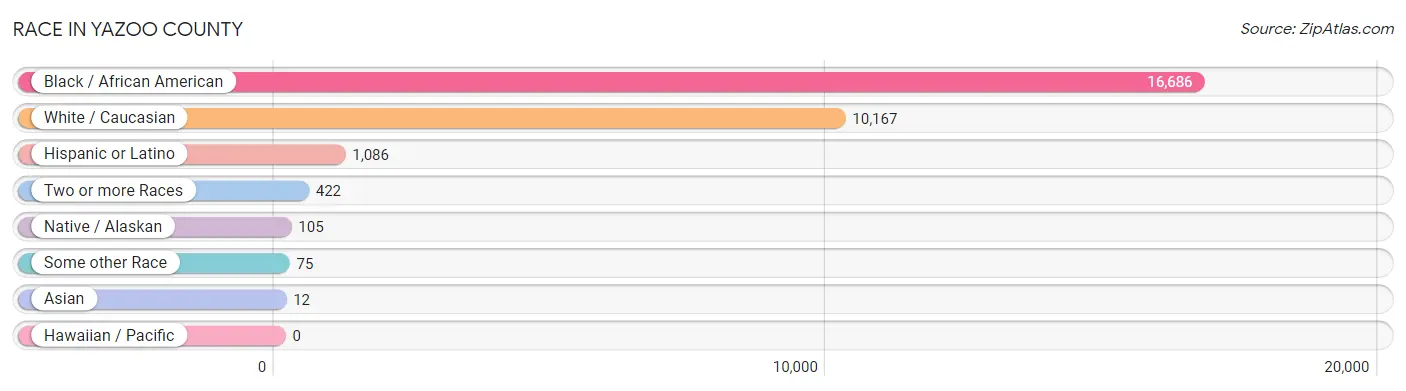
| Race | # Population | % Population |
| Asian | 12 | 0.0% |
| Black / African American | 16,686 | 60.8% |
| Hawaiian / Pacific | 0 | 0.0% |
| Hispanic or Latino | 1,086 | 4.0% |
| Native / Alaskan | 105 | 0.4% |
| White / Caucasian | 10,167 | 37.0% |
| Two or more Races | 422 | 1.5% |
| Some other Race | 75 | 0.3% |
| Total | 27,467 | 100.0% |
Ancestry in Yazoo County
The most populous ancestries reported in Yazoo County are American (1,617 | 5.9%), English (1,235 | 4.5%), Irish (831 | 3.0%), Subsaharan African (536 | 1.9%), and German (513 | 1.9%), together accounting for 17.2% of all Yazoo County residents.
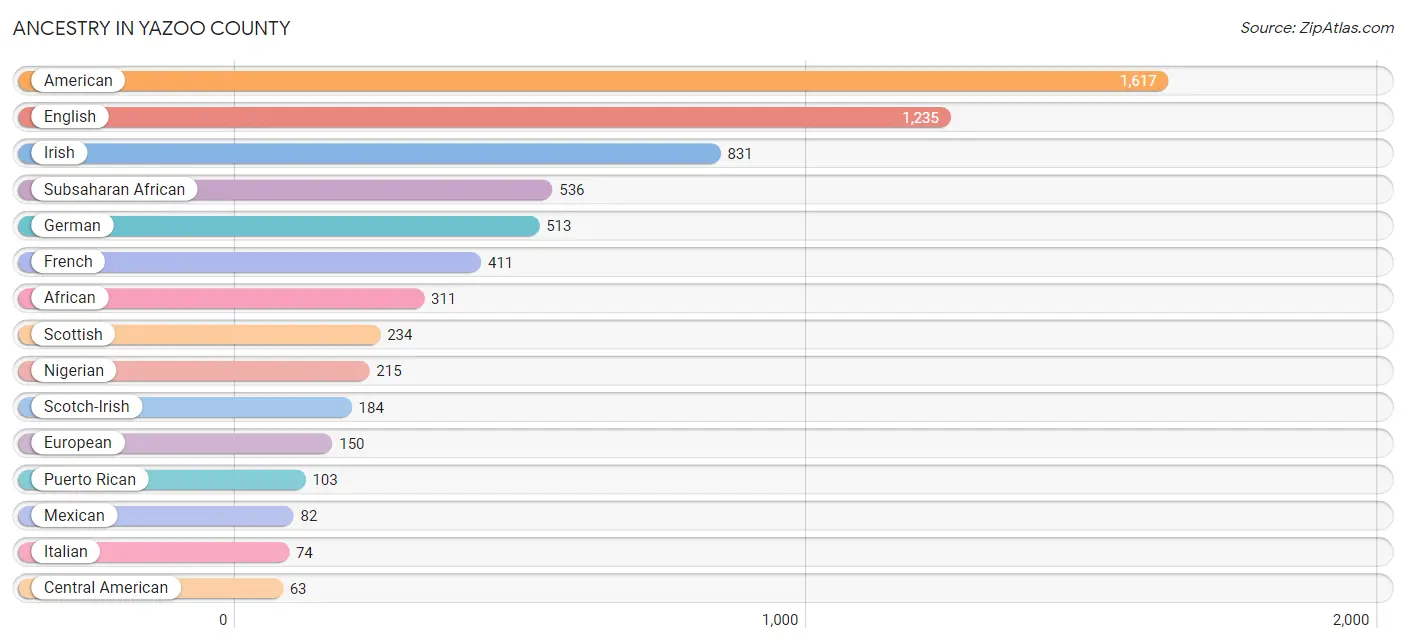
| Ancestry | # Population | % Population |
| African | 311 | 1.1% |
| American | 1,617 | 5.9% |
| Arapaho | 13 | 0.1% |
| British | 42 | 0.2% |
| Cajun | 25 | 0.1% |
| Canadian | 21 | 0.1% |
| Central American | 63 | 0.2% |
| Choctaw | 36 | 0.1% |
| Colombian | 25 | 0.1% |
| Dutch | 47 | 0.2% |
| Ecuadorian | 24 | 0.1% |
| English | 1,235 | 4.5% |
| European | 150 | 0.5% |
| French | 411 | 1.5% |
| French Canadian | 29 | 0.1% |
| German | 513 | 1.9% |
| Guatemalan | 63 | 0.2% |
| Haitian | 32 | 0.1% |
| Hungarian | 12 | 0.0% |
| Irish | 831 | 3.0% |
| Italian | 74 | 0.3% |
| Jamaican | 12 | 0.0% |
| Korean | 1 | 0.0% |
| Mexican | 82 | 0.3% |
| Nigerian | 215 | 0.8% |
| Northern European | 6 | 0.0% |
| Norwegian | 9 | 0.0% |
| Osage | 47 | 0.2% |
| Polish | 17 | 0.1% |
| Puerto Rican | 103 | 0.4% |
| Russian | 15 | 0.1% |
| Scotch-Irish | 184 | 0.7% |
| Scottish | 234 | 0.9% |
| South American | 49 | 0.2% |
| Spaniard | 25 | 0.1% |
| Subsaharan African | 536 | 1.9% |
| Swedish | 41 | 0.2% |
| Swiss | 5 | 0.0% |
| Welsh | 33 | 0.1% | View All 39 Rows |
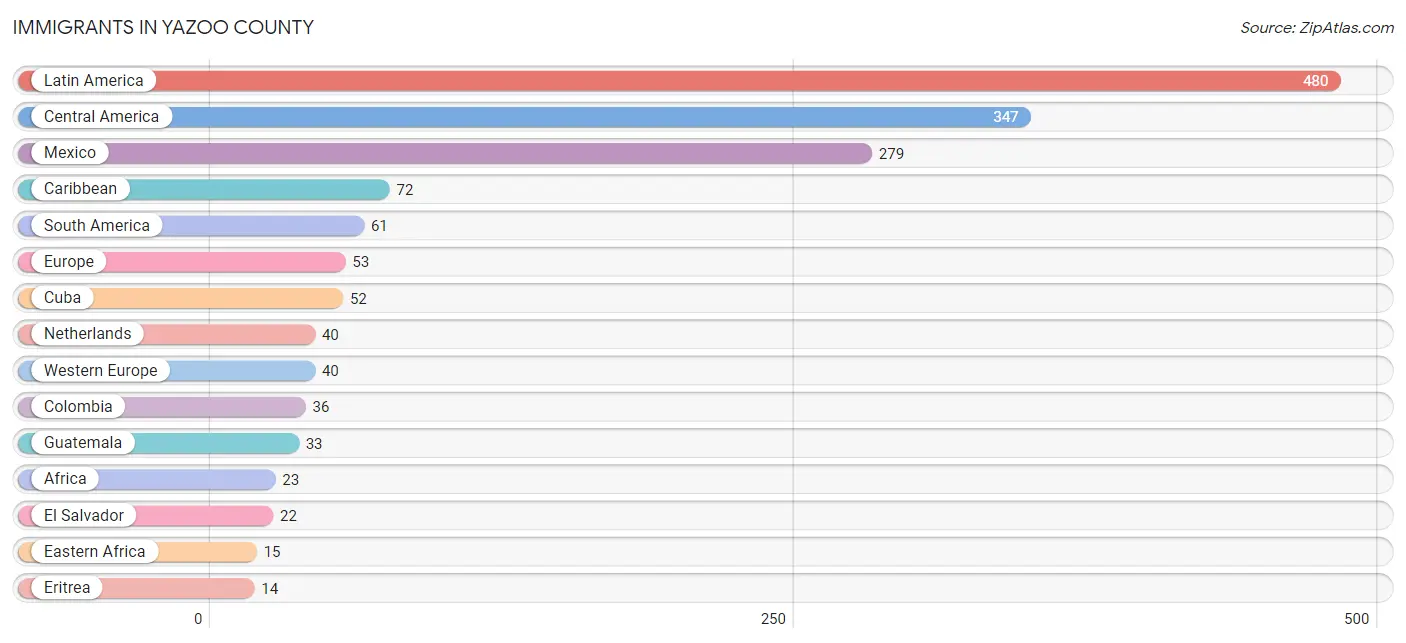
Immigrants in Yazoo County
The most numerous immigrant groups reported in Yazoo County came from Latin America (480 | 1.8%), Central America (347 | 1.3%), Mexico (279 | 1.0%), Caribbean (72 | 0.3%), and South America (61 | 0.2%), together accounting for 4.5% of all Yazoo County residents.
| Immigration Origin | # Population | % Population |
| Africa | 23 | 0.1% |
| Asia | 11 | 0.0% |
| Bahamas | 10 | 0.0% |
| Bolivia | 13 | 0.1% |
| Caribbean | 72 | 0.3% |
| Central America | 347 | 1.3% |
| Colombia | 36 | 0.1% |
| Cuba | 52 | 0.2% |
| Eastern Africa | 15 | 0.1% |
| Ecuador | 12 | 0.0% |
| El Salvador | 22 | 0.1% |
| Eritrea | 14 | 0.1% |
| Europe | 53 | 0.2% |
| Guatemala | 33 | 0.1% |
| India | 11 | 0.0% |
| Jamaica | 10 | 0.0% |
| Latin America | 480 | 1.8% |
| Mexico | 279 | 1.0% |
| Netherlands | 40 | 0.2% |
| Panama | 13 | 0.1% |
| South America | 61 | 0.2% |
| South Central Asia | 11 | 0.0% |
| Southern Europe | 13 | 0.1% |
| Spain | 13 | 0.1% |
| Western Africa | 8 | 0.0% |
| Western Europe | 40 | 0.2% | View All 26 Rows |
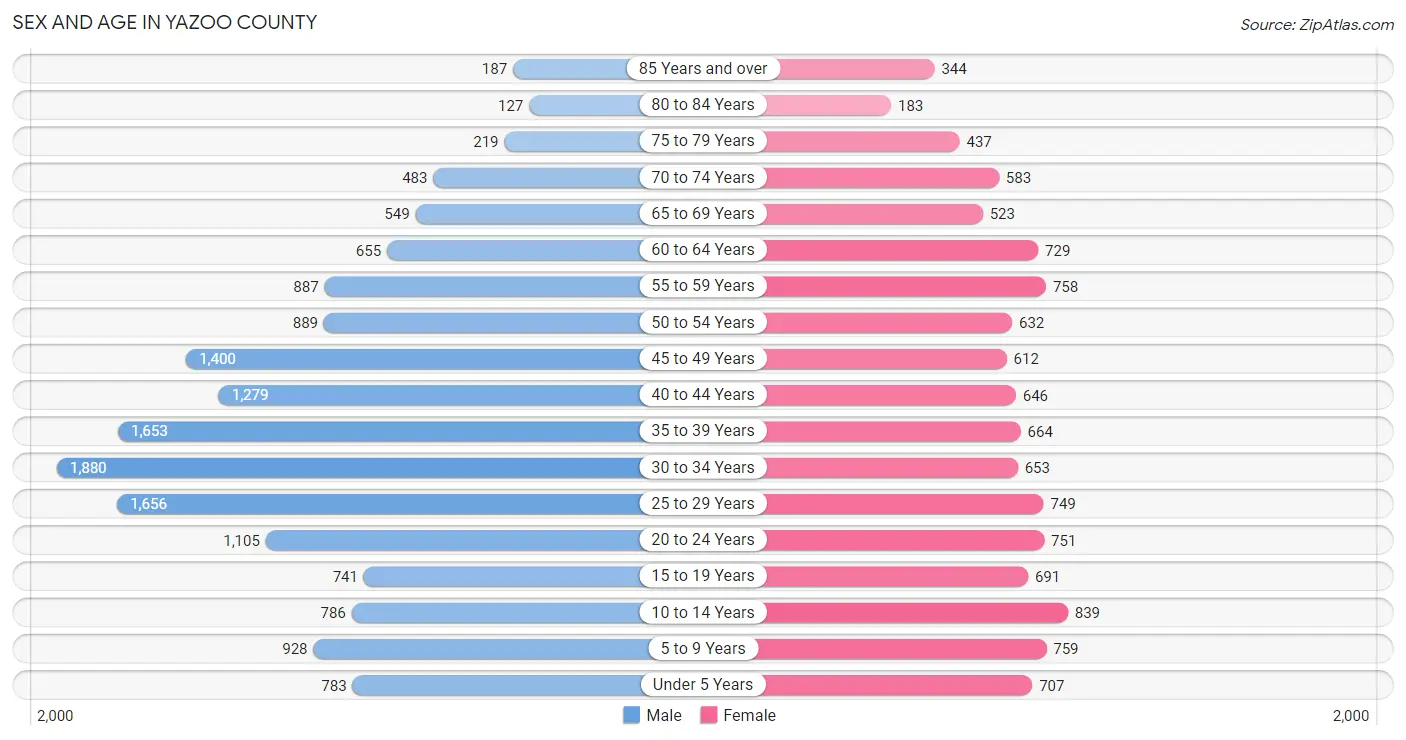
Sex and Age in Yazoo County
Sex and Age in Yazoo County
The most populous age groups in Yazoo County are 30 to 34 Years (1,880 | 11.6%) for men and 10 to 14 Years (839 | 7.4%) for women.
| Age Bracket | Male | Female |
| Under 5 Years | 783 (4.8%) | 707 (6.3%) |
| 5 to 9 Years | 928 (5.7%) | 759 (6.7%) |
| 10 to 14 Years | 786 (4.9%) | 839 (7.4%) |
| 15 to 19 Years | 741 (4.6%) | 691 (6.1%) |
| 20 to 24 Years | 1,105 (6.8%) | 751 (6.7%) |
| 25 to 29 Years | 1,656 (10.2%) | 749 (6.7%) |
| 30 to 34 Years | 1,880 (11.6%) | 653 (5.8%) |
| 35 to 39 Years | 1,653 (10.2%) | 664 (5.9%) |
| 40 to 44 Years | 1,279 (7.9%) | 646 (5.7%) |
| 45 to 49 Years | 1,400 (8.6%) | 612 (5.4%) |
| 50 to 54 Years | 889 (5.5%) | 632 (5.6%) |
| 55 to 59 Years | 887 (5.5%) | 758 (6.7%) |
| 60 to 64 Years | 655 (4.0%) | 729 (6.5%) |
| 65 to 69 Years | 549 (3.4%) | 523 (4.6%) |
| 70 to 74 Years | 483 (3.0%) | 583 (5.2%) |
| 75 to 79 Years | 219 (1.3%) | 437 (3.9%) |
| 80 to 84 Years | 127 (0.8%) | 183 (1.6%) |
| 85 Years and over | 187 (1.1%) | 344 (3.1%) |
| Total | 16,207 (100.0%) | 11,260 (100.0%) |
Families and Households in Yazoo County
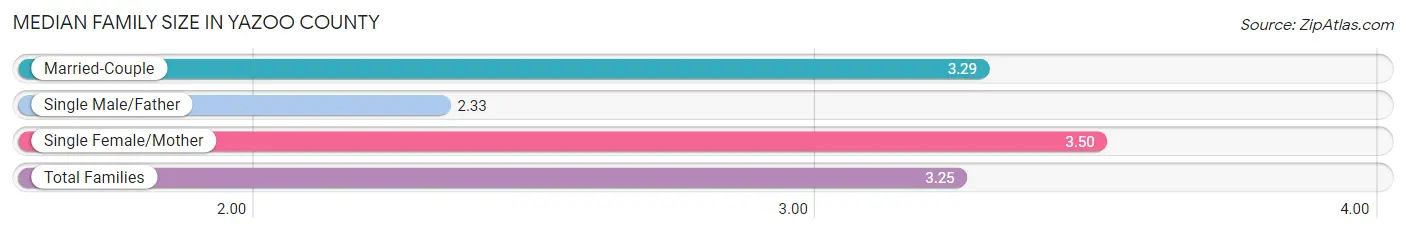
Median Family Size in Yazoo County
The median family size in Yazoo County is 3.25 persons per family, with single female/mother families (2,072 | 37.4%) accounting for the largest median family size of 3.5 persons per family. On the other hand, single male/father families (687 | 12.4%) represent the smallest median family size with 2.33 persons per family.
| Family Type | # Families | Family Size |
| Married-Couple | 2,786 (50.2%) | 3.29 |
| Single Male/Father | 687 (12.4%) | 2.33 |
| Single Female/Mother | 2,072 (37.4%) | 3.50 |
| Total Families | 5,545 (100.0%) | 3.25 |
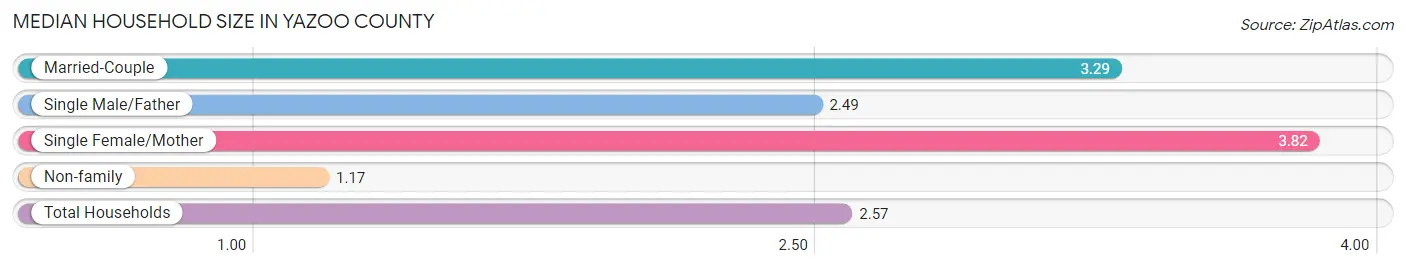
Median Household Size in Yazoo County
The median household size in Yazoo County is 2.57 persons per household, with single female/mother households (2,072 | 23.5%) accounting for the largest median household size of 3.82 persons per household. non-family households (3,262 | 37.0%) represent the smallest median household size with 1.17 persons per household.
| Household Type | # Households | Household Size |
| Married-Couple | 2,786 (31.6%) | 3.29 |
| Single Male/Father | 687 (7.8%) | 2.49 |
| Single Female/Mother | 2,072 (23.5%) | 3.82 |
| Non-family | 3,262 (37.0%) | 1.17 |
| Total Households | 8,807 (100.0%) | 2.57 |
Household Size by Marriage Status in Yazoo County
Out of a total of 8,807 households in Yazoo County, 5,545 (63.0%) are family households, while 3,262 (37.0%) are nonfamily households. The most numerous type of family households are 2-person households, comprising 2,166, and the most common type of nonfamily households are 1-person households, comprising 2,918.
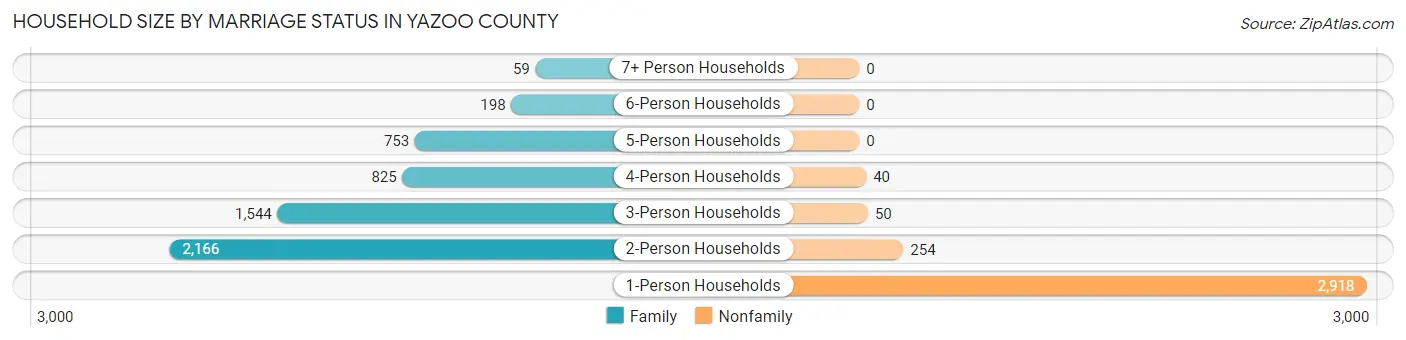
| Household Size | Family Households | Nonfamily Households |
| 1-Person Households | - | 2,918 (33.1%) |
| 2-Person Households | 2,166 (24.6%) | 254 (2.9%) |
| 3-Person Households | 1,544 (17.5%) | 50 (0.6%) |
| 4-Person Households | 825 (9.4%) | 40 (0.4%) |
| 5-Person Households | 753 (8.6%) | 0 (0.0%) |
| 6-Person Households | 198 (2.2%) | 0 (0.0%) |
| 7+ Person Households | 59 (0.7%) | 0 (0.0%) |
| Total | 5,545 (63.0%) | 3,262 (37.0%) |
Female Fertility in Yazoo County
Fertility by Age in Yazoo County
Average fertility rate in Yazoo County is 43.0 births per 1,000 women. Women in the age bracket of 20 to 34 years have the highest fertility rate with 80.0 births per 1,000 women. Women in the age bracket of 20 to 34 years acount for 80.7% of all women with births.
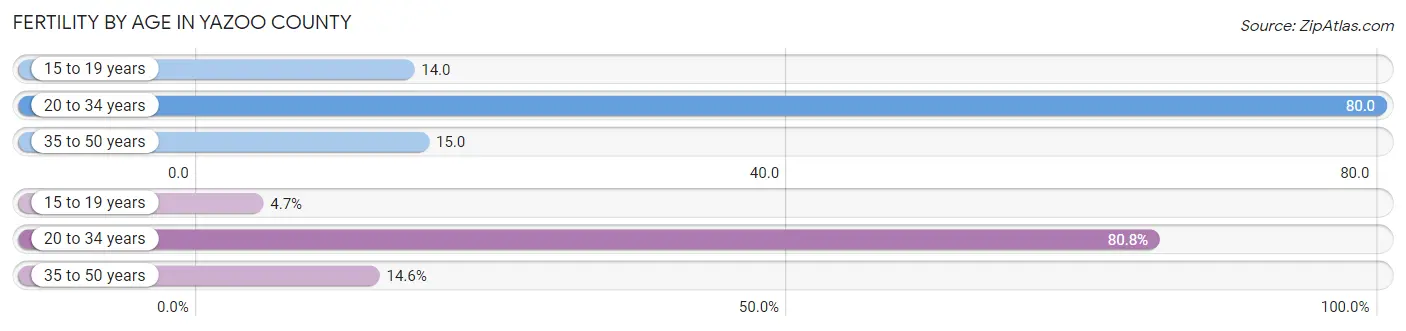
| Age Bracket | Women with Births | Births / 1,000 Women |
| 15 to 19 years | 10 (4.7%) | 14.0 |
| 20 to 34 years | 172 (80.7%) | 80.0 |
| 35 to 50 years | 31 (14.5%) | 15.0 |
| Total | 213 (100.0%) | 43.0 |
Fertility by Age by Marriage Status in Yazoo County
62.9% of women with births (213) in Yazoo County are married. The highest percentage of unmarried women with births falls into 35 to 50 years age bracket with 80.6% of them unmarried at the time of birth, while the lowest percentage of unmarried women with births belong to 15 to 19 years age bracket with 0.0% of them unmarried.
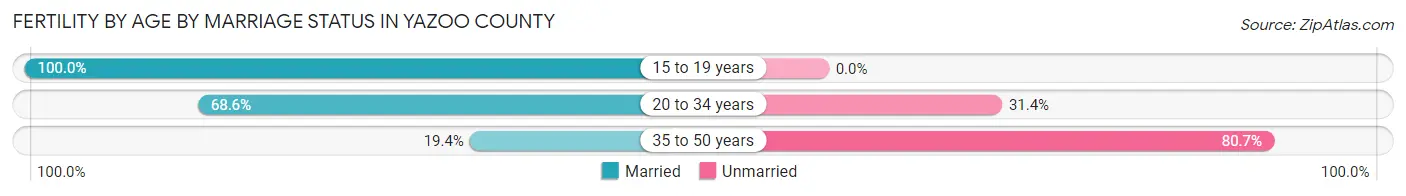
| Age Bracket | Married | Unmarried |
| 15 to 19 years | 10 (100.0%) | 0 (0.0%) |
| 20 to 34 years | 118 (68.6%) | 54 (31.4%) |
| 35 to 50 years | 6 (19.4%) | 25 (80.6%) |
| Total | 134 (62.9%) | 79 (37.1%) |
Fertility by Education in Yazoo County
Average fertility rate in Yazoo County is 43.0 births per 1,000 women. Women with the education attainment of high school diploma have the highest fertility rate of 52.0 births per 1,000 women, while women with the education attainment of graduate degree have the lowest fertility at 25.0 births per 1,000 women. Women with the education attainment of high school diploma represent 45.1% of all women with births.
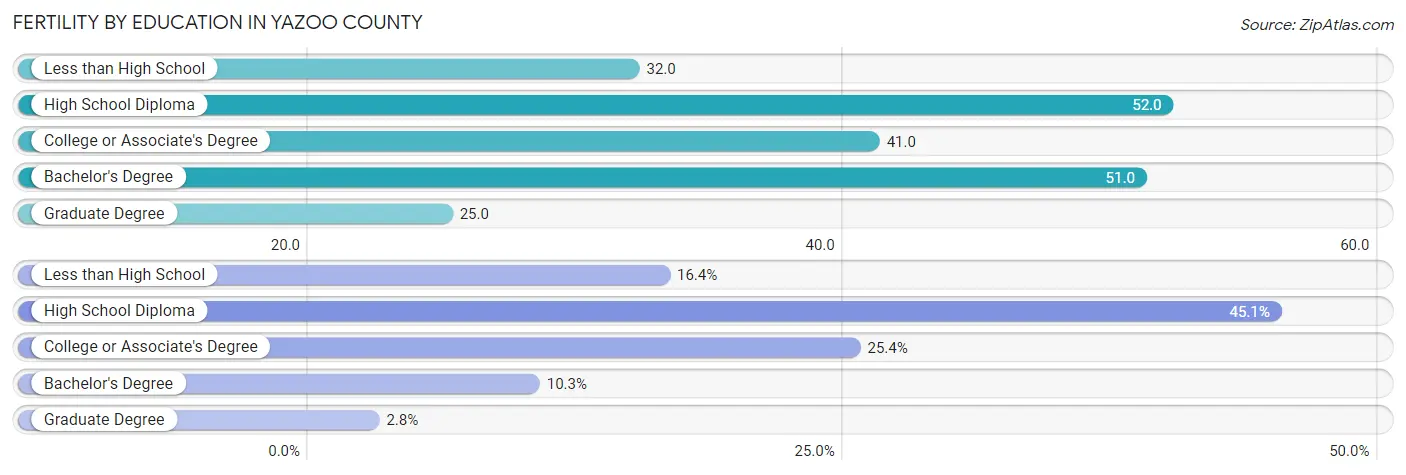
| Educational Attainment | Women with Births | Births / 1,000 Women |
| Less than High School | 35 (16.4%) | 32.0 |
| High School Diploma | 96 (45.1%) | 52.0 |
| College or Associate's Degree | 54 (25.4%) | 41.0 |
| Bachelor's Degree | 22 (10.3%) | 51.0 |
| Graduate Degree | 6 (2.8%) | 25.0 |
| Total | 213 (100.0%) | 43.0 |
Fertility by Education by Marriage Status in Yazoo County
37.1% of women with births in Yazoo County are unmarried. Women with the educational attainment of high school diploma are most likely to be married with 100.0% of them married at childbirth, while women with the educational attainment of college or associate's degree are least likely to be married with 100.0% of them unmarried at childbirth.
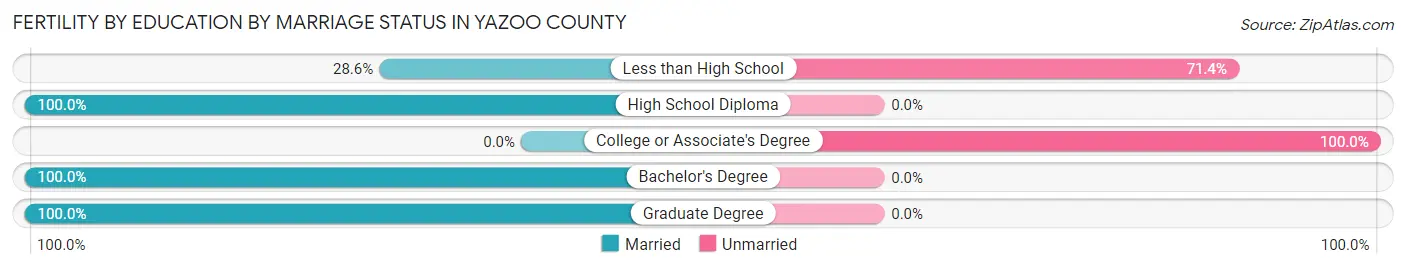
| Educational Attainment | Married | Unmarried |
| Less than High School | 10 (28.6%) | 25 (71.4%) |
| High School Diploma | 96 (100.0%) | 0 (0.0%) |
| College or Associate's Degree | 0 (0.0%) | 54 (100.0%) |
| Bachelor's Degree | 22 (100.0%) | 0 (0.0%) |
| Graduate Degree | 6 (100.0%) | 0 (0.0%) |
| Total | 134 (62.9%) | 79 (37.1%) |
Employment Characteristics in Yazoo County
Employment by Class of Employer in Yazoo County
Among the 8,844 employed individuals in Yazoo County, private company employees (5,603 | 63.3%), self-employed (not incorporated) (775 | 8.8%), and state government employees (733 | 8.3%) make up the most common classes of employment.
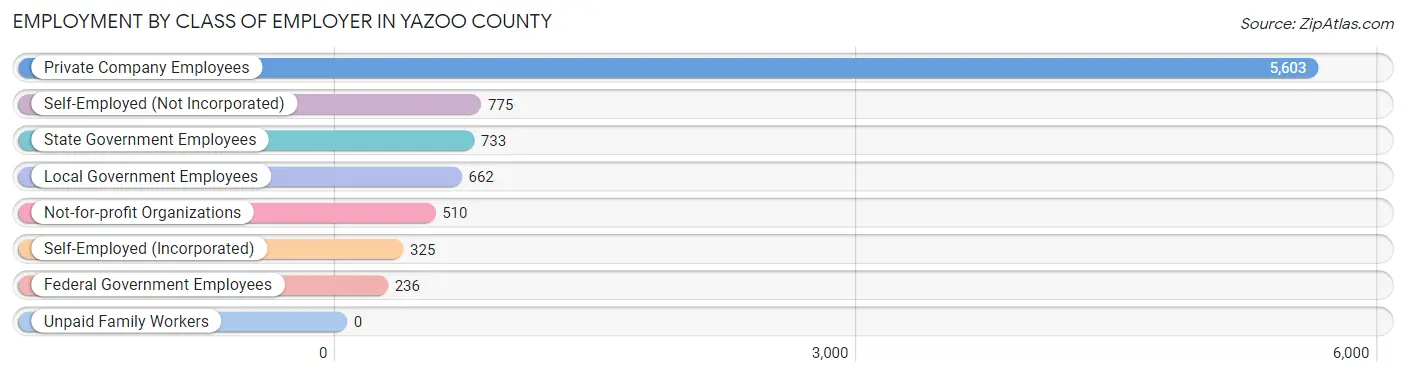
| Employer Class | # Employees | % Employees |
| Private Company Employees | 5,603 | 63.3% |
| Self-Employed (Incorporated) | 325 | 3.7% |
| Self-Employed (Not Incorporated) | 775 | 8.8% |
| Not-for-profit Organizations | 510 | 5.8% |
| Local Government Employees | 662 | 7.5% |
| State Government Employees | 733 | 8.3% |
| Federal Government Employees | 236 | 2.7% |
| Unpaid Family Workers | 0 | 0.0% |
| Total | 8,844 | 100.0% |
Employment Status by Age in Yazoo County
According to the labor force statistics for Yazoo County, out of the total population over 16 years of age (22,390), 45.1% or 10,098 individuals are in the labor force, with 10.4% or 1,050 of them unemployed. The age group with the highest labor force participation rate is 25 to 29 years, with 68.2% or 1,640 individuals in the labor force. Within the labor force, the 16 to 19 years age range has the highest percentage of unemployed individuals, with 27.2% or 100 of them being unemployed.
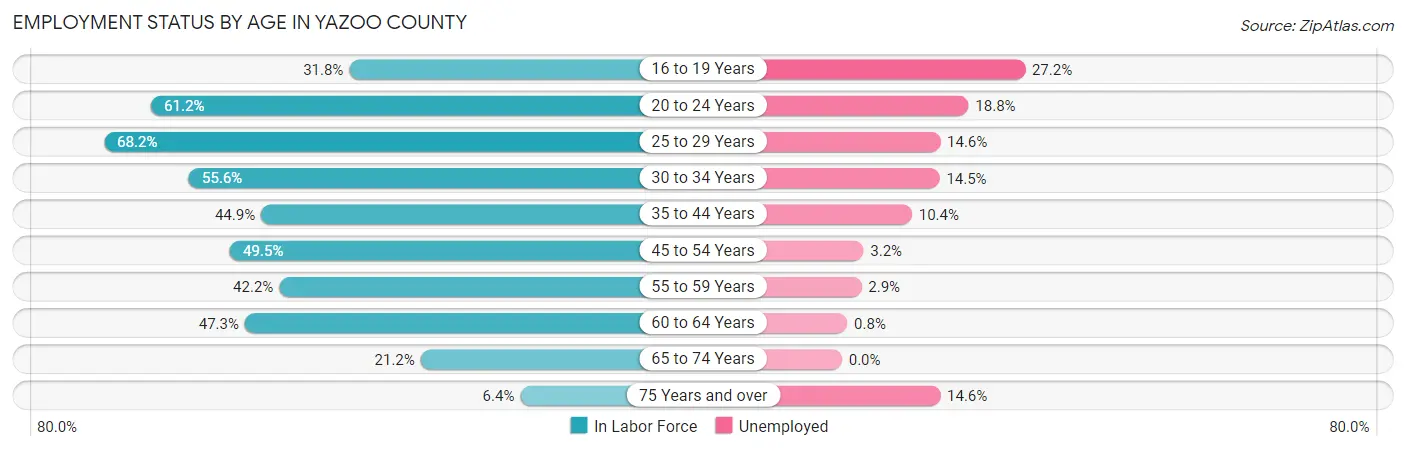
| Age Bracket | In Labor Force | Unemployed |
| 16 to 19 Years | 368 (31.8%) | 100 (27.2%) |
| 20 to 24 Years | 1,136 (61.2%) | 214 (18.8%) |
| 25 to 29 Years | 1,640 (68.2%) | 239 (14.6%) |
| 30 to 34 Years | 1,408 (55.6%) | 204 (14.5%) |
| 35 to 44 Years | 1,905 (44.9%) | 198 (10.4%) |
| 45 to 54 Years | 1,749 (49.5%) | 56 (3.2%) |
| 55 to 59 Years | 694 (42.2%) | 20 (2.9%) |
| 60 to 64 Years | 655 (47.3%) | 5 (0.8%) |
| 65 to 74 Years | 453 (21.2%) | 0 (0.0%) |
| 75 Years and over | 96 (6.4%) | 14 (14.6%) |
| Total | 10,098 (45.1%) | 1,050 (10.4%) |
Employment Status by Educational Attainment in Yazoo County
According to labor force statistics for Yazoo County, 51.1% of individuals (8,044) out of the total population between 25 and 64 years of age (15,742) are in the labor force, with 9.0% or 724 of them being unemployed. The group with the highest labor force participation rate are those with the educational attainment of bachelor's degree or higher, with 81.5% or 1,457 individuals in the labor force. Within the labor force, individuals with less than high school education have the highest percentage of unemployment, with 17.4% or 158 of them being unemployed.
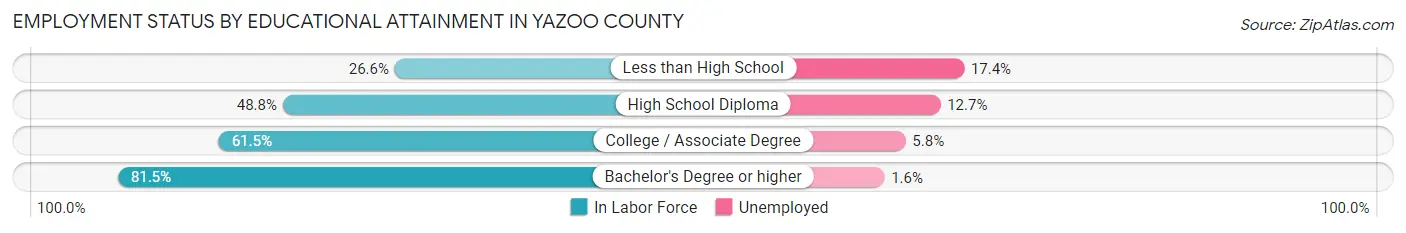
| Educational Attainment | In Labor Force | Unemployed |
| Less than High School | 906 (26.6%) | 593 (17.4%) |
| High School Diploma | 3,068 (48.8%) | 798 (12.7%) |
| College / Associate Degree | 2,620 (61.5%) | 247 (5.8%) |
| Bachelor's Degree or higher | 1,457 (81.5%) | 29 (1.6%) |
| Total | 8,044 (51.1%) | 1,417 (9.0%) |
Employment Occupations by Sex in Yazoo County
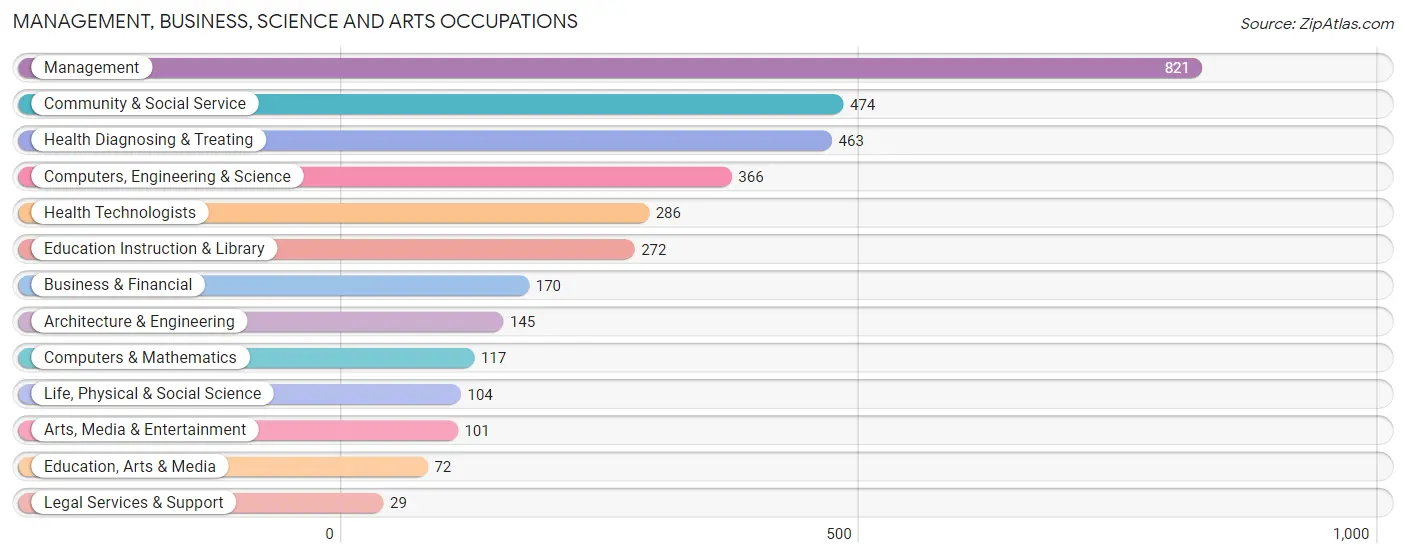
Management, Business, Science and Arts Occupations
The most common Management, Business, Science and Arts occupations in Yazoo County are Management (821 | 9.1%), Community & Social Service (474 | 5.2%), Health Diagnosing & Treating (463 | 5.1%), Computers, Engineering & Science (366 | 4.0%), and Health Technologists (286 | 3.2%).
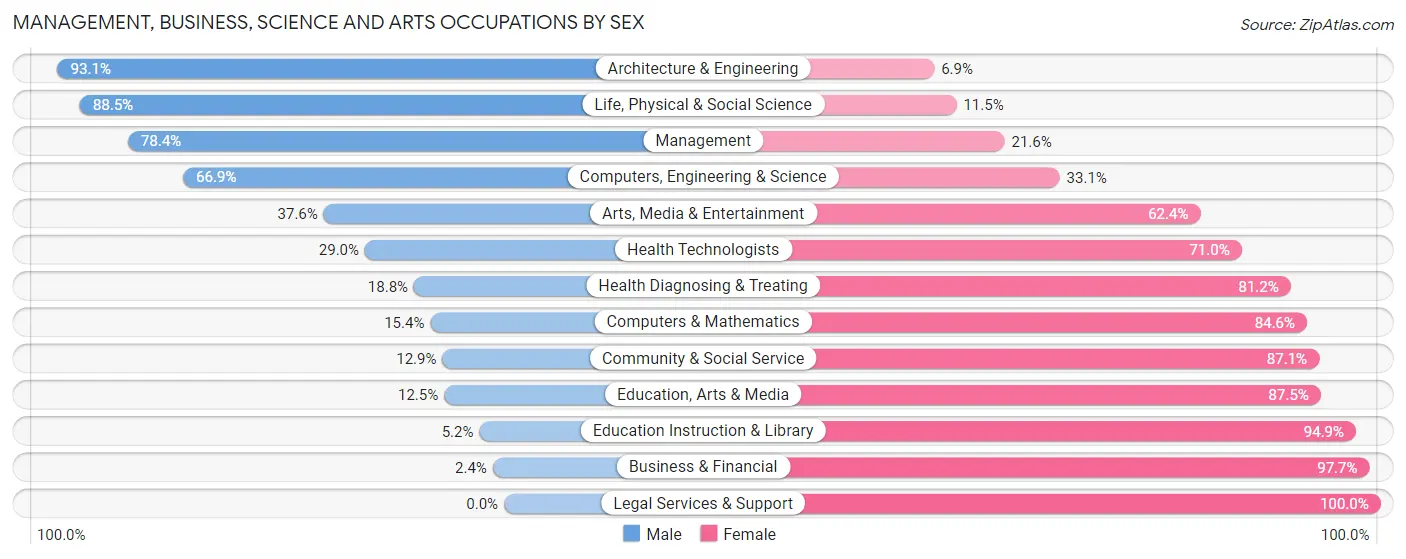
Management, Business, Science and Arts Occupations by Sex
Within the Management, Business, Science and Arts occupations in Yazoo County, the most male-oriented occupations are Architecture & Engineering (93.1%), Life, Physical & Social Science (88.5%), and Management (78.4%), while the most female-oriented occupations are Legal Services & Support (100.0%), Business & Financial (97.7%), and Education Instruction & Library (94.9%).
| Occupation | Male | Female |
| Management | 644 (78.4%) | 177 (21.6%) |
| Business & Financial | 4 (2.4%) | 166 (97.7%) |
| Computers, Engineering & Science | 245 (66.9%) | 121 (33.1%) |
| Computers & Mathematics | 18 (15.4%) | 99 (84.6%) |
| Architecture & Engineering | 135 (93.1%) | 10 (6.9%) |
| Life, Physical & Social Science | 92 (88.5%) | 12 (11.5%) |
| Community & Social Service | 61 (12.9%) | 413 (87.1%) |
| Education, Arts & Media | 9 (12.5%) | 63 (87.5%) |
| Legal Services & Support | 0 (0.0%) | 29 (100.0%) |
| Education Instruction & Library | 14 (5.1%) | 258 (94.9%) |
| Arts, Media & Entertainment | 38 (37.6%) | 63 (62.4%) |
| Health Diagnosing & Treating | 87 (18.8%) | 376 (81.2%) |
| Health Technologists | 83 (29.0%) | 203 (71.0%) |
| Total (Category) | 1,041 (45.4%) | 1,253 (54.6%) |
| Total (Overall) | 4,756 (52.5%) | 4,298 (47.5%) |
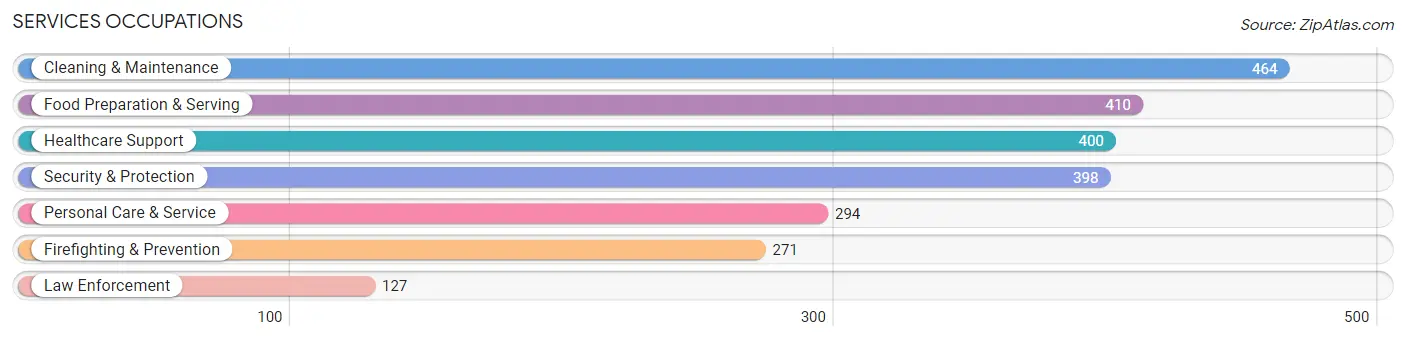
Services Occupations
The most common Services occupations in Yazoo County are Cleaning & Maintenance (464 | 5.1%), Food Preparation & Serving (410 | 4.5%), Healthcare Support (400 | 4.4%), Security & Protection (398 | 4.4%), and Personal Care & Service (294 | 3.3%).
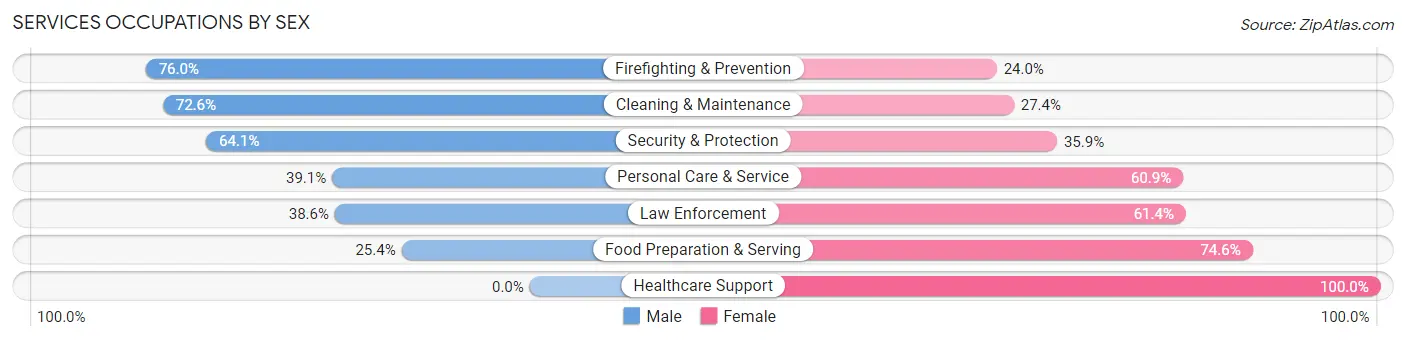
Services Occupations by Sex
Within the Services occupations in Yazoo County, the most male-oriented occupations are Firefighting & Prevention (76.0%), Cleaning & Maintenance (72.6%), and Security & Protection (64.1%), while the most female-oriented occupations are Healthcare Support (100.0%), Food Preparation & Serving (74.6%), and Law Enforcement (61.4%).
| Occupation | Male | Female |
| Healthcare Support | 0 (0.0%) | 400 (100.0%) |
| Security & Protection | 255 (64.1%) | 143 (35.9%) |
| Firefighting & Prevention | 206 (76.0%) | 65 (24.0%) |
| Law Enforcement | 49 (38.6%) | 78 (61.4%) |
| Food Preparation & Serving | 104 (25.4%) | 306 (74.6%) |
| Cleaning & Maintenance | 337 (72.6%) | 127 (27.4%) |
| Personal Care & Service | 115 (39.1%) | 179 (60.9%) |
| Total (Category) | 811 (41.2%) | 1,155 (58.8%) |
| Total (Overall) | 4,756 (52.5%) | 4,298 (47.5%) |
Sales and Office Occupations
The most common Sales and Office occupations in Yazoo County are Office & Administration (859 | 9.5%), and Sales & Related (741 | 8.2%).
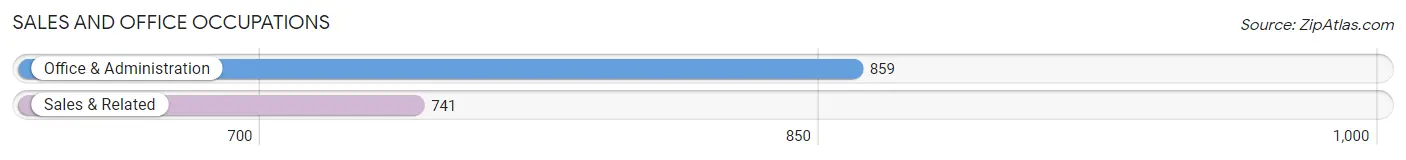
Sales and Office Occupations by Sex

| Occupation | Male | Female |
| Sales & Related | 289 (39.0%) | 452 (61.0%) |
| Office & Administration | 170 (19.8%) | 689 (80.2%) |
| Total (Category) | 459 (28.7%) | 1,141 (71.3%) |
| Total (Overall) | 4,756 (52.5%) | 4,298 (47.5%) |
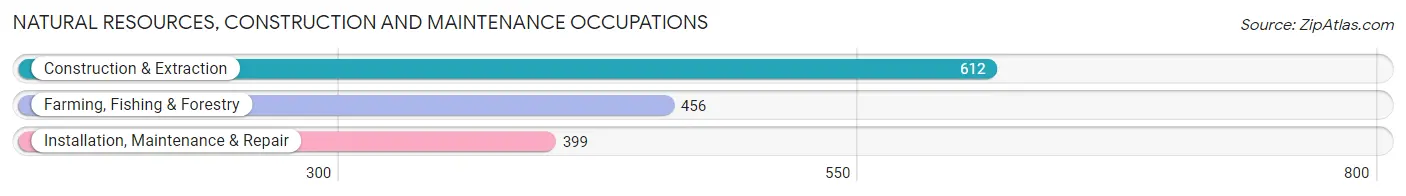
Natural Resources, Construction and Maintenance Occupations
The most common Natural Resources, Construction and Maintenance occupations in Yazoo County are Construction & Extraction (612 | 6.8%), Farming, Fishing & Forestry (456 | 5.0%), and Installation, Maintenance & Repair (399 | 4.4%).
Natural Resources, Construction and Maintenance Occupations by Sex
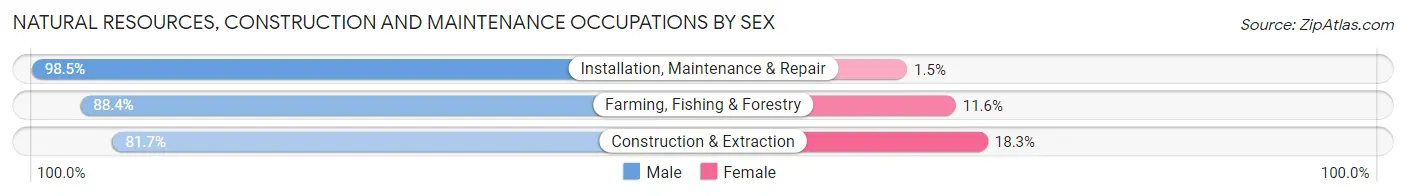
| Occupation | Male | Female |
| Farming, Fishing & Forestry | 403 (88.4%) | 53 (11.6%) |
| Construction & Extraction | 500 (81.7%) | 112 (18.3%) |
| Installation, Maintenance & Repair | 393 (98.5%) | 6 (1.5%) |
| Total (Category) | 1,296 (88.3%) | 171 (11.7%) |
| Total (Overall) | 4,756 (52.5%) | 4,298 (47.5%) |
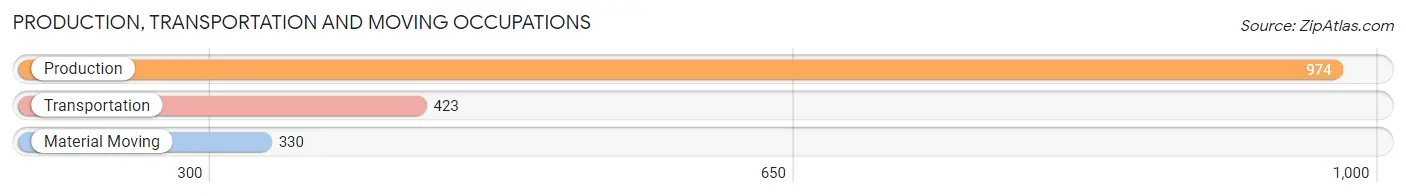
Production, Transportation and Moving Occupations
The most common Production, Transportation and Moving occupations in Yazoo County are Production (974 | 10.8%), Transportation (423 | 4.7%), and Material Moving (330 | 3.6%).
Production, Transportation and Moving Occupations by Sex
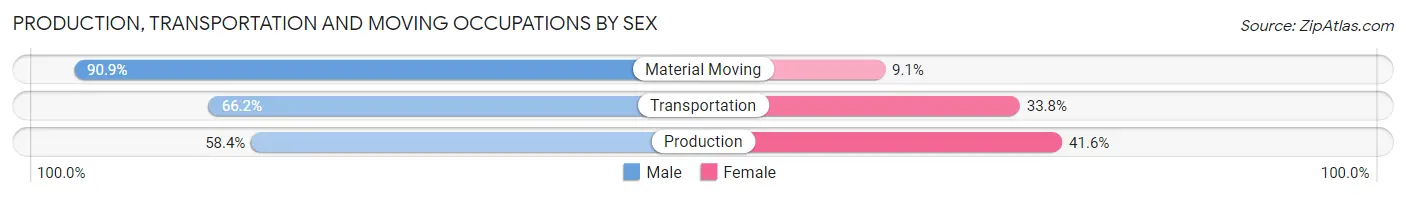
| Occupation | Male | Female |
| Production | 569 (58.4%) | 405 (41.6%) |
| Transportation | 280 (66.2%) | 143 (33.8%) |
| Material Moving | 300 (90.9%) | 30 (9.1%) |
| Total (Category) | 1,149 (66.5%) | 578 (33.5%) |
| Total (Overall) | 4,756 (52.5%) | 4,298 (47.5%) |
Employment Industries by Sex in Yazoo County
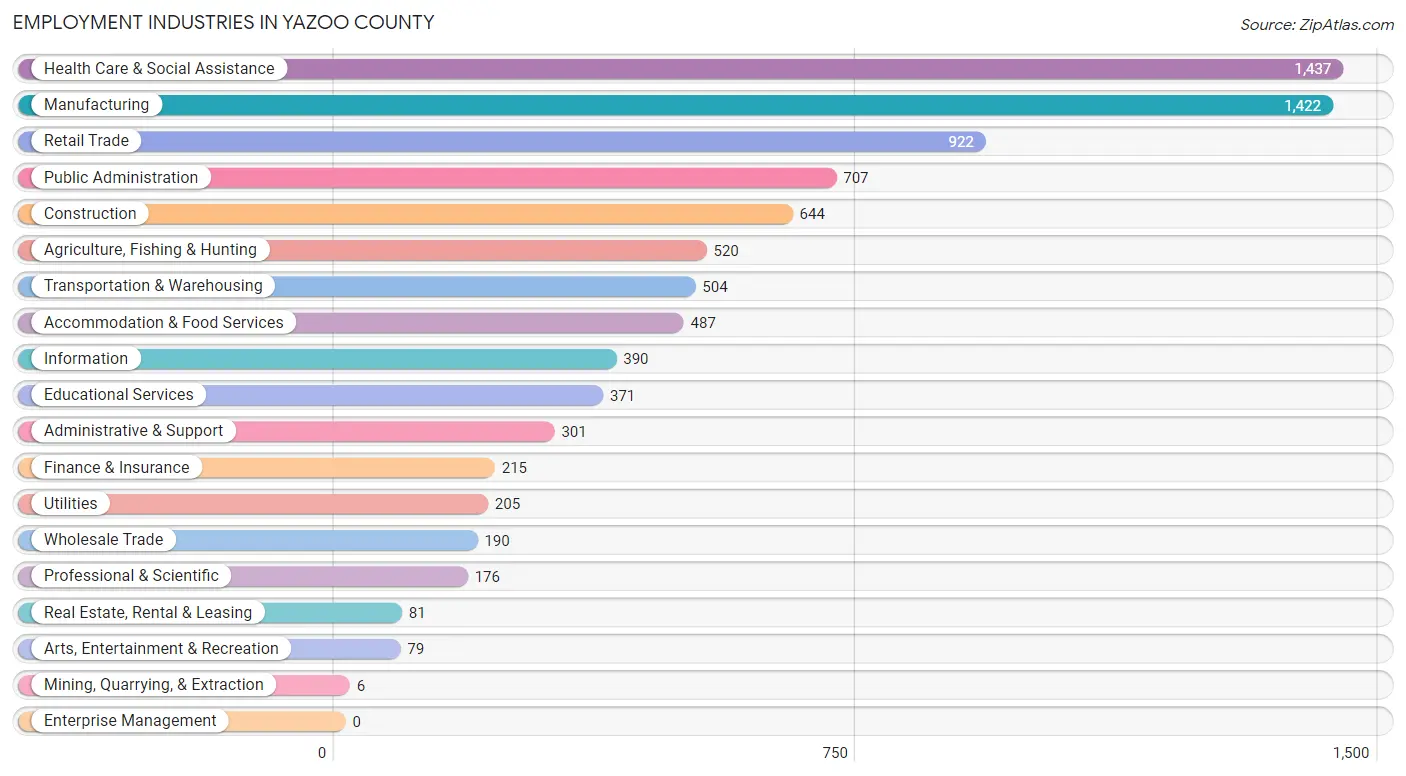
Employment Industries in Yazoo County
The major employment industries in Yazoo County include Health Care & Social Assistance (1,437 | 15.9%), Manufacturing (1,422 | 15.7%), Retail Trade (922 | 10.2%), Public Administration (707 | 7.8%), and Construction (644 | 7.1%).
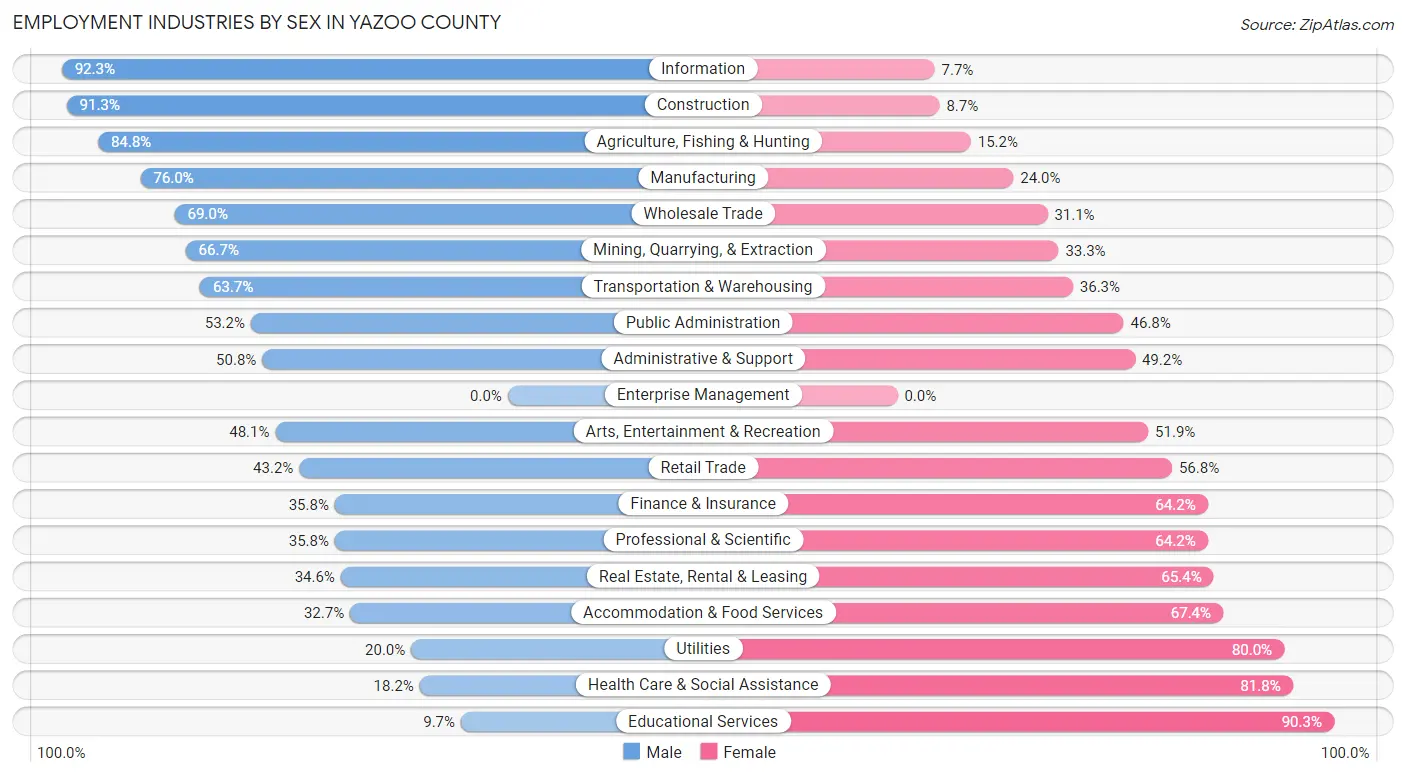
Employment Industries by Sex in Yazoo County
The Yazoo County industries that see more men than women are Information (92.3%), Construction (91.3%), and Agriculture, Fishing & Hunting (84.8%), whereas the industries that tend to have a higher number of women are Educational Services (90.3%), Health Care & Social Assistance (81.8%), and Utilities (80.0%).
| Industry | Male | Female |
| Agriculture, Fishing & Hunting | 441 (84.8%) | 79 (15.2%) |
| Mining, Quarrying, & Extraction | 4 (66.7%) | 2 (33.3%) |
| Construction | 588 (91.3%) | 56 (8.7%) |
| Manufacturing | 1,081 (76.0%) | 341 (24.0%) |
| Wholesale Trade | 131 (69.0%) | 59 (31.0%) |
| Retail Trade | 398 (43.2%) | 524 (56.8%) |
| Transportation & Warehousing | 321 (63.7%) | 183 (36.3%) |
| Utilities | 41 (20.0%) | 164 (80.0%) |
| Information | 360 (92.3%) | 30 (7.7%) |
| Finance & Insurance | 77 (35.8%) | 138 (64.2%) |
| Real Estate, Rental & Leasing | 28 (34.6%) | 53 (65.4%) |
| Professional & Scientific | 63 (35.8%) | 113 (64.2%) |
| Enterprise Management | 0 (0.0%) | 0 (0.0%) |
| Administrative & Support | 153 (50.8%) | 148 (49.2%) |
| Educational Services | 36 (9.7%) | 335 (90.3%) |
| Health Care & Social Assistance | 262 (18.2%) | 1,175 (81.8%) |
| Arts, Entertainment & Recreation | 38 (48.1%) | 41 (51.9%) |
| Accommodation & Food Services | 159 (32.7%) | 328 (67.3%) |
| Public Administration | 376 (53.2%) | 331 (46.8%) |
| Total | 4,756 (52.5%) | 4,298 (47.5%) |
Education in Yazoo County
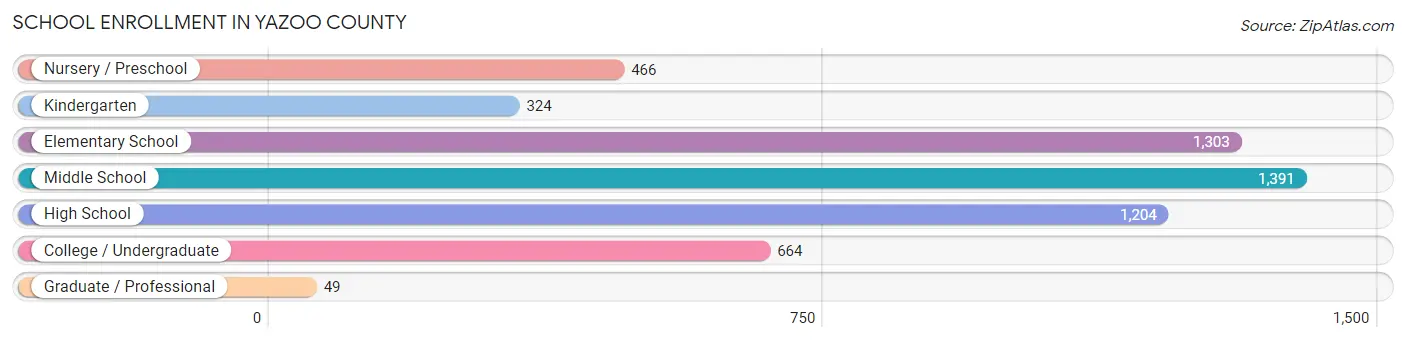
School Enrollment in Yazoo County
The most common levels of schooling among the 5,401 students in Yazoo County are middle school (1,391 | 25.8%), elementary school (1,303 | 24.1%), and high school (1,204 | 22.3%).
| School Level | # Students | % Students |
| Nursery / Preschool | 466 | 8.6% |
| Kindergarten | 324 | 6.0% |
| Elementary School | 1,303 | 24.1% |
| Middle School | 1,391 | 25.8% |
| High School | 1,204 | 22.3% |
| College / Undergraduate | 664 | 12.3% |
| Graduate / Professional | 49 | 0.9% |
| Total | 5,401 | 100.0% |
School Enrollment by Age by Funding Source in Yazoo County
Out of a total of 5,401 students who are enrolled in schools in Yazoo County, 913 (16.9%) attend a private institution, while the remaining 4,488 (83.1%) are enrolled in public schools. The age group of 35 years and over has the highest likelihood of being enrolled in private schools, with 95 (26.8% in the age bracket) enrolled. Conversely, the age group of 20 to 24 year olds has the lowest likelihood of being enrolled in a private school, with 147 (100.0% in the age bracket) attending a public institution.
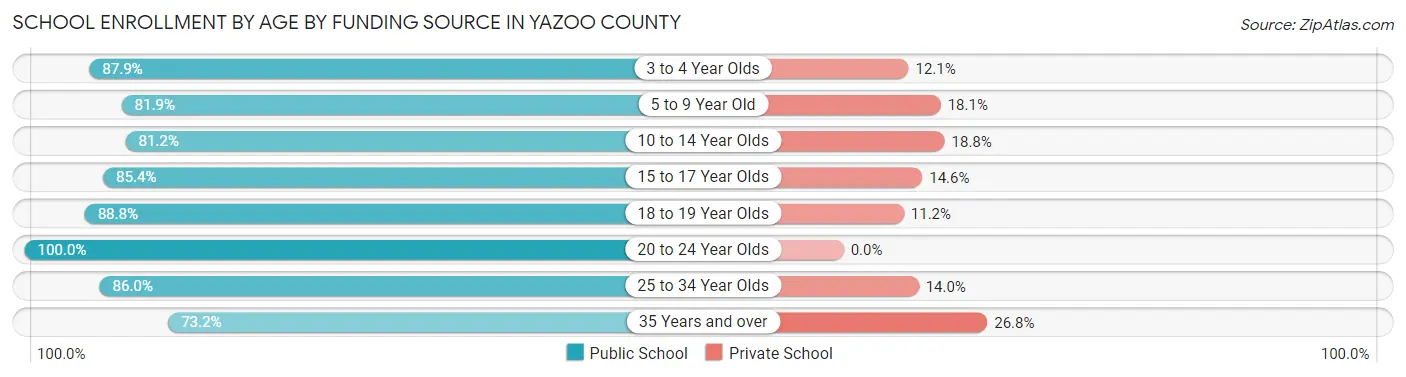
| Age Bracket | Public School | Private School |
| 3 to 4 Year Olds | 342 (87.9%) | 47 (12.1%) |
| 5 to 9 Year Old | 1,300 (81.9%) | 287 (18.1%) |
| 10 to 14 Year Olds | 1,300 (81.2%) | 301 (18.8%) |
| 15 to 17 Year Olds | 793 (85.4%) | 136 (14.6%) |
| 18 to 19 Year Olds | 190 (88.8%) | 24 (11.2%) |
| 20 to 24 Year Olds | 147 (100.0%) | 0 (0.0%) |
| 25 to 34 Year Olds | 154 (86.0%) | 25 (14.0%) |
| 35 Years and over | 260 (73.2%) | 95 (26.8%) |
| Total | 4,488 (83.1%) | 913 (16.9%) |
Educational Attainment by Field of Study in Yazoo County
Business (717 | 29.3%), education (410 | 16.8%), bio, nature & agricultural (280 | 11.4%), science & technology (216 | 8.8%), and arts & humanities (152 | 6.2%) are the most common fields of study among 2,447 individuals in Yazoo County who have obtained a bachelor's degree or higher.
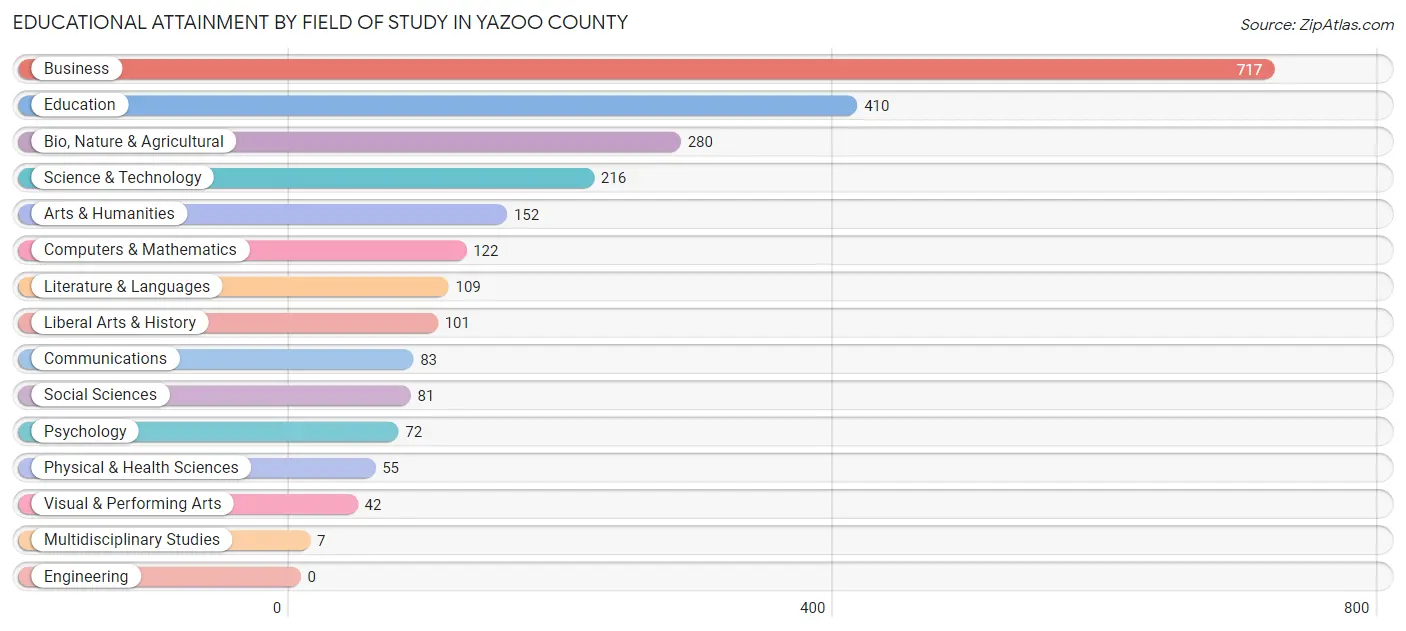
| Field of Study | # Graduates | % Graduates |
| Computers & Mathematics | 122 | 5.0% |
| Bio, Nature & Agricultural | 280 | 11.4% |
| Physical & Health Sciences | 55 | 2.2% |
| Psychology | 72 | 2.9% |
| Social Sciences | 81 | 3.3% |
| Engineering | 0 | 0.0% |
| Multidisciplinary Studies | 7 | 0.3% |
| Science & Technology | 216 | 8.8% |
| Business | 717 | 29.3% |
| Education | 410 | 16.8% |
| Literature & Languages | 109 | 4.4% |
| Liberal Arts & History | 101 | 4.1% |
| Visual & Performing Arts | 42 | 1.7% |
| Communications | 83 | 3.4% |
| Arts & Humanities | 152 | 6.2% |
| Total | 2,447 | 100.0% |
Transportation & Commute in Yazoo County
Vehicle Availability by Sex in Yazoo County
The most prevalent vehicle ownership categories in Yazoo County are males with 2 vehicles (1,663, accounting for 35.9%) and females with 2 vehicles (1,203, making up 39.5%).
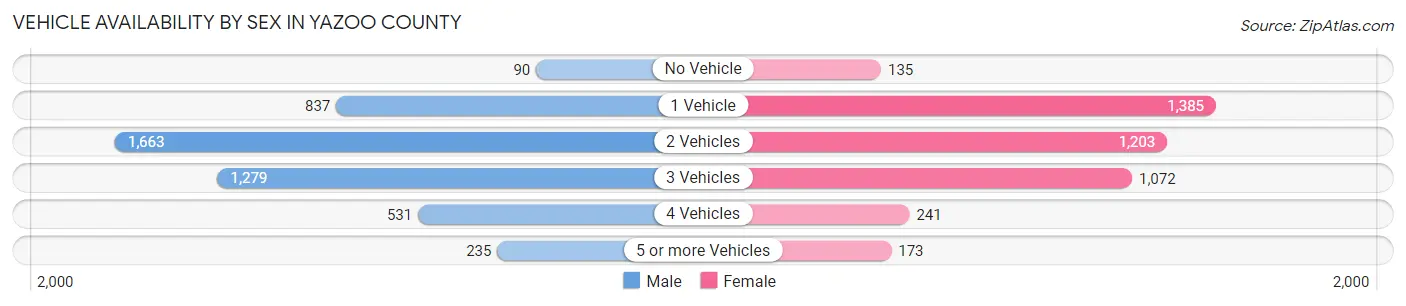
| Vehicles Available | Male | Female |
| No Vehicle | 90 (1.9%) | 135 (3.2%) |
| 1 Vehicle | 837 (18.1%) | 1,385 (32.9%) |
| 2 Vehicles | 1,663 (35.9%) | 1,203 (28.6%) |
| 3 Vehicles | 1,279 (27.6%) | 1,072 (25.5%) |
| 4 Vehicles | 531 (11.5%) | 241 (5.7%) |
| 5 or more Vehicles | 235 (5.1%) | 173 (4.1%) |
| Total | 4,635 (100.0%) | 4,209 (100.0%) |
Commute Time in Yazoo County
The most frequently occuring commute durations in Yazoo County are 45 to 59 minutes (1,495 commuters, 17.8%), 5 to 9 minutes (1,223 commuters, 14.6%), and 15 to 19 minutes (1,179 commuters, 14.1%).
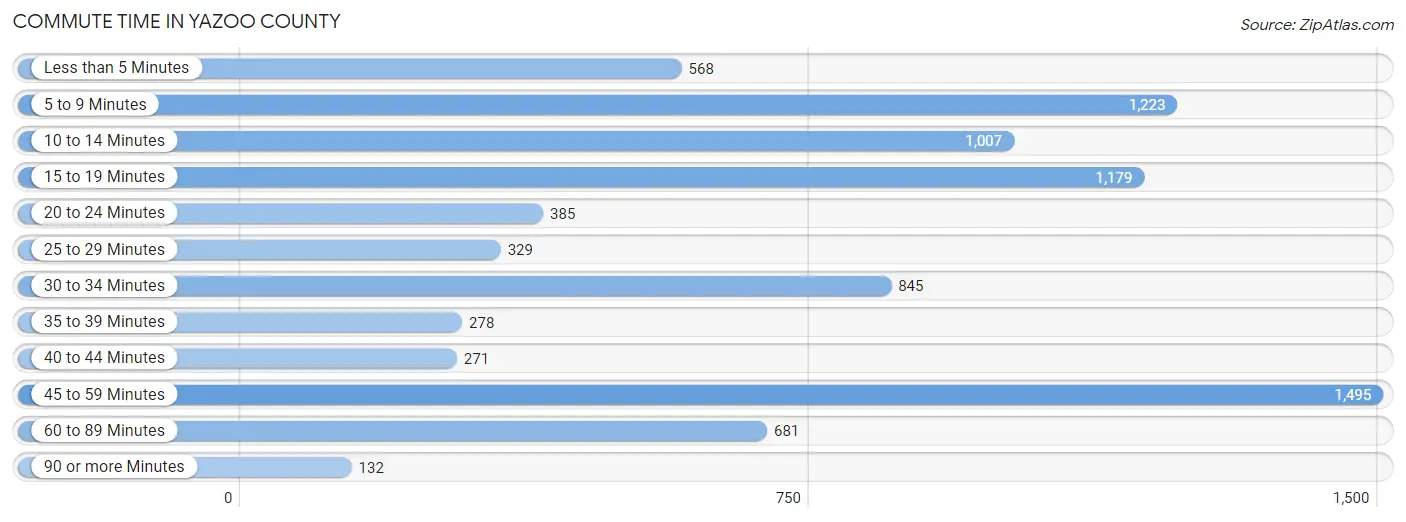
| Commute Time | # Commuters | % Commuters |
| Less than 5 Minutes | 568 | 6.8% |
| 5 to 9 Minutes | 1,223 | 14.6% |
| 10 to 14 Minutes | 1,007 | 12.0% |
| 15 to 19 Minutes | 1,179 | 14.1% |
| 20 to 24 Minutes | 385 | 4.6% |
| 25 to 29 Minutes | 329 | 3.9% |
| 30 to 34 Minutes | 845 | 10.1% |
| 35 to 39 Minutes | 278 | 3.3% |
| 40 to 44 Minutes | 271 | 3.2% |
| 45 to 59 Minutes | 1,495 | 17.8% |
| 60 to 89 Minutes | 681 | 8.1% |
| 90 or more Minutes | 132 | 1.6% |
Commute Time by Sex in Yazoo County
The most common commute times in Yazoo County are 45 to 59 minutes (726 commuters, 16.8%) for males and 45 to 59 minutes (769 commuters, 18.9%) for females.
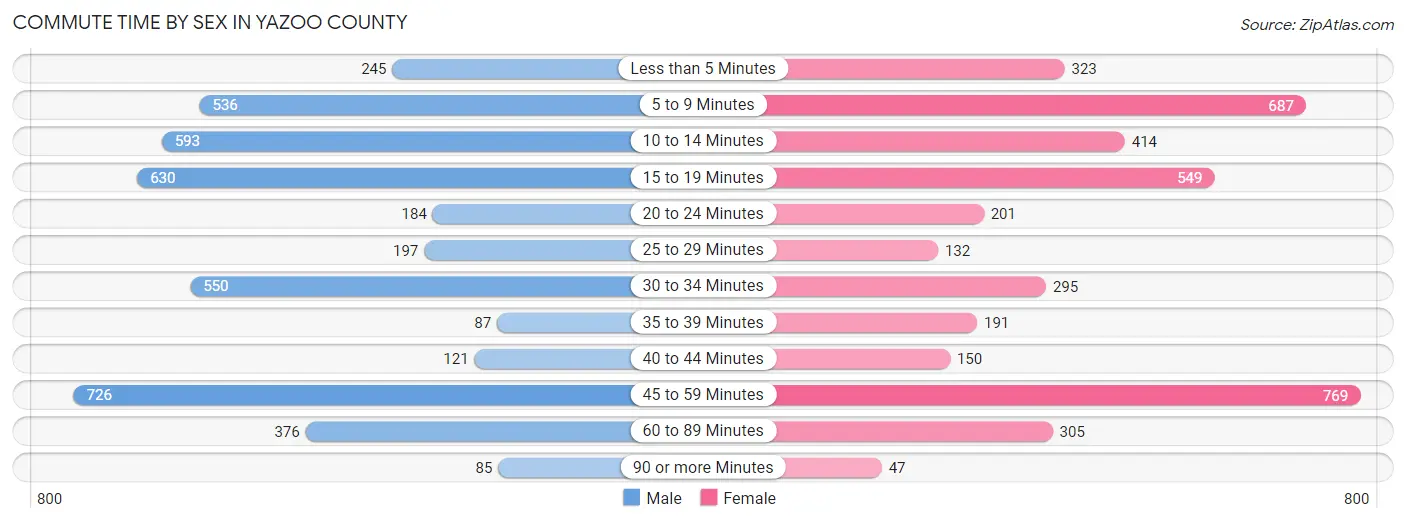
| Commute Time | Male | Female |
| Less than 5 Minutes | 245 (5.7%) | 323 (8.0%) |
| 5 to 9 Minutes | 536 (12.4%) | 687 (16.9%) |
| 10 to 14 Minutes | 593 (13.7%) | 414 (10.2%) |
| 15 to 19 Minutes | 630 (14.5%) | 549 (13.5%) |
| 20 to 24 Minutes | 184 (4.3%) | 201 (5.0%) |
| 25 to 29 Minutes | 197 (4.5%) | 132 (3.3%) |
| 30 to 34 Minutes | 550 (12.7%) | 295 (7.3%) |
| 35 to 39 Minutes | 87 (2.0%) | 191 (4.7%) |
| 40 to 44 Minutes | 121 (2.8%) | 150 (3.7%) |
| 45 to 59 Minutes | 726 (16.8%) | 769 (18.9%) |
| 60 to 89 Minutes | 376 (8.7%) | 305 (7.5%) |
| 90 or more Minutes | 85 (2.0%) | 47 (1.2%) |
Time of Departure to Work by Sex in Yazoo County
The most frequent times of departure to work in Yazoo County are 6:30 AM to 6:59 AM (1,057, 24.4%) for males and 6:30 AM to 6:59 AM (741, 18.2%) for females.
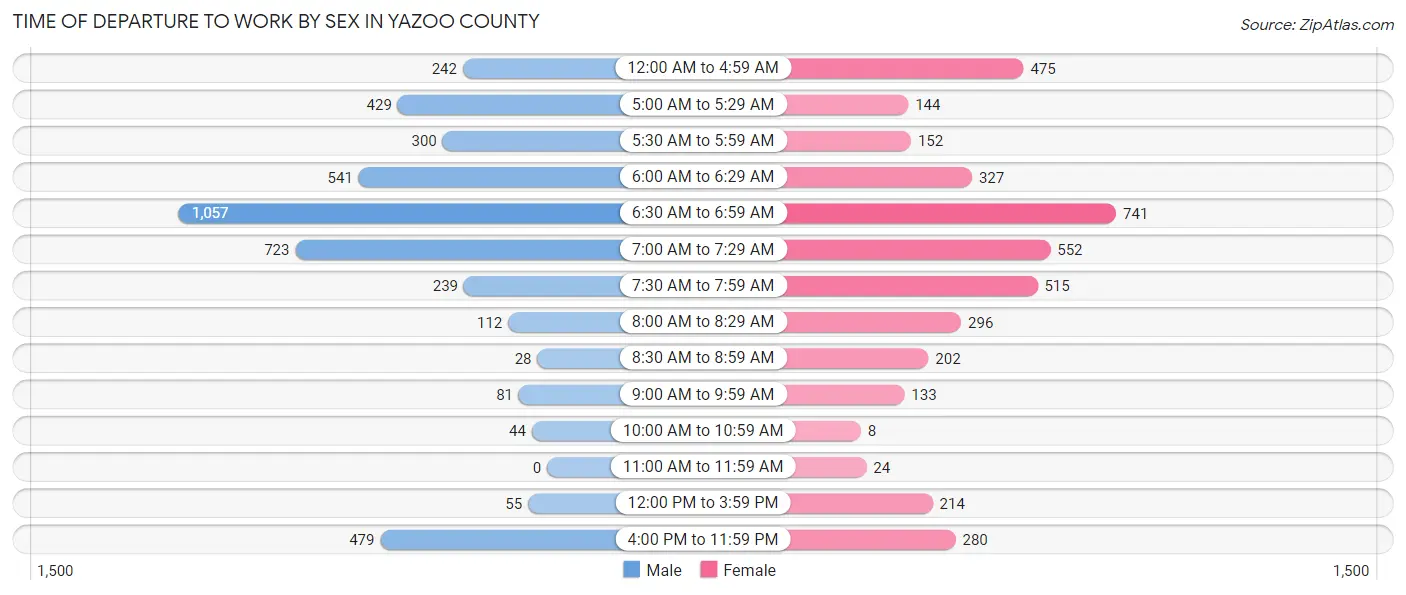
| Time of Departure | Male | Female |
| 12:00 AM to 4:59 AM | 242 (5.6%) | 475 (11.7%) |
| 5:00 AM to 5:29 AM | 429 (9.9%) | 144 (3.5%) |
| 5:30 AM to 5:59 AM | 300 (6.9%) | 152 (3.7%) |
| 6:00 AM to 6:29 AM | 541 (12.5%) | 327 (8.1%) |
| 6:30 AM to 6:59 AM | 1,057 (24.4%) | 741 (18.2%) |
| 7:00 AM to 7:29 AM | 723 (16.7%) | 552 (13.6%) |
| 7:30 AM to 7:59 AM | 239 (5.5%) | 515 (12.7%) |
| 8:00 AM to 8:29 AM | 112 (2.6%) | 296 (7.3%) |
| 8:30 AM to 8:59 AM | 28 (0.6%) | 202 (5.0%) |
| 9:00 AM to 9:59 AM | 81 (1.9%) | 133 (3.3%) |
| 10:00 AM to 10:59 AM | 44 (1.0%) | 8 (0.2%) |
| 11:00 AM to 11:59 AM | 0 (0.0%) | 24 (0.6%) |
| 12:00 PM to 3:59 PM | 55 (1.3%) | 214 (5.3%) |
| 4:00 PM to 11:59 PM | 479 (11.1%) | 280 (6.9%) |
| Total | 4,330 (100.0%) | 4,063 (100.0%) |
Housing Occupancy in Yazoo County
Occupancy by Ownership in Yazoo County
Of the total 8,807 dwellings in Yazoo County, owner-occupied units account for 5,057 (57.4%), while renter-occupied units make up 3,750 (42.6%).
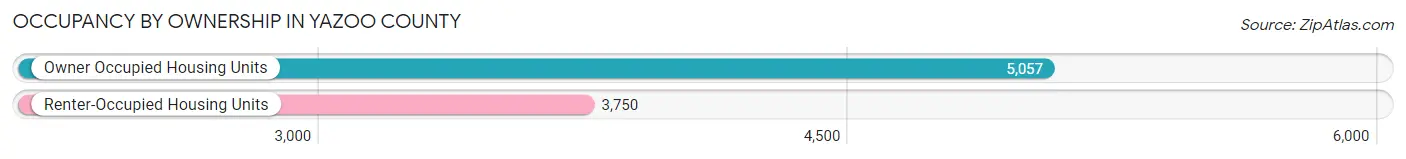
| Occupancy | # Housing Units | % Housing Units |
| Owner Occupied Housing Units | 5,057 | 57.4% |
| Renter-Occupied Housing Units | 3,750 | 42.6% |
| Total Occupied Housing Units | 8,807 | 100.0% |
Occupancy by Household Size in Yazoo County
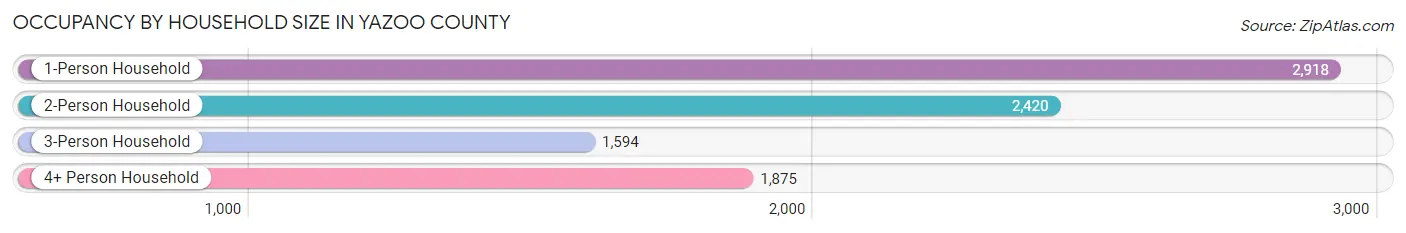
| Household Size | # Housing Units | % Housing Units |
| 1-Person Household | 2,918 | 33.1% |
| 2-Person Household | 2,420 | 27.5% |
| 3-Person Household | 1,594 | 18.1% |
| 4+ Person Household | 1,875 | 21.3% |
| Total Housing Units | 8,807 | 100.0% |
Occupancy by Ownership by Household Size in Yazoo County
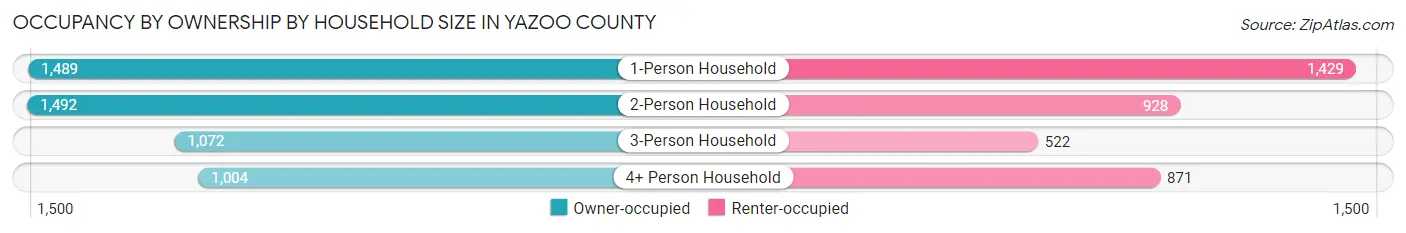
| Household Size | Owner-occupied | Renter-occupied |
| 1-Person Household | 1,489 (51.0%) | 1,429 (49.0%) |
| 2-Person Household | 1,492 (61.7%) | 928 (38.4%) |
| 3-Person Household | 1,072 (67.2%) | 522 (32.8%) |
| 4+ Person Household | 1,004 (53.5%) | 871 (46.5%) |
| Total Housing Units | 5,057 (57.4%) | 3,750 (42.6%) |
Occupancy by Educational Attainment in Yazoo County
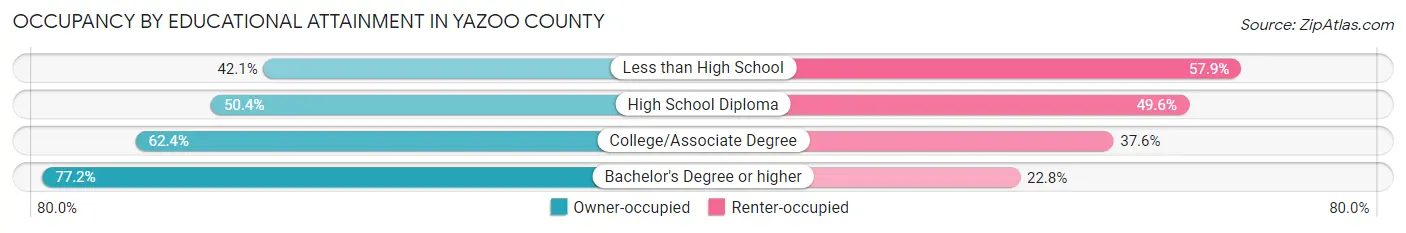
| Household Size | Owner-occupied | Renter-occupied |
| Less than High School | 616 (42.1%) | 847 (57.9%) |
| High School Diploma | 1,573 (50.4%) | 1,546 (49.6%) |
| College/Associate Degree | 1,657 (62.4%) | 999 (37.6%) |
| Bachelor's Degree or higher | 1,211 (77.2%) | 358 (22.8%) |
Occupancy by Age of Householder in Yazoo County
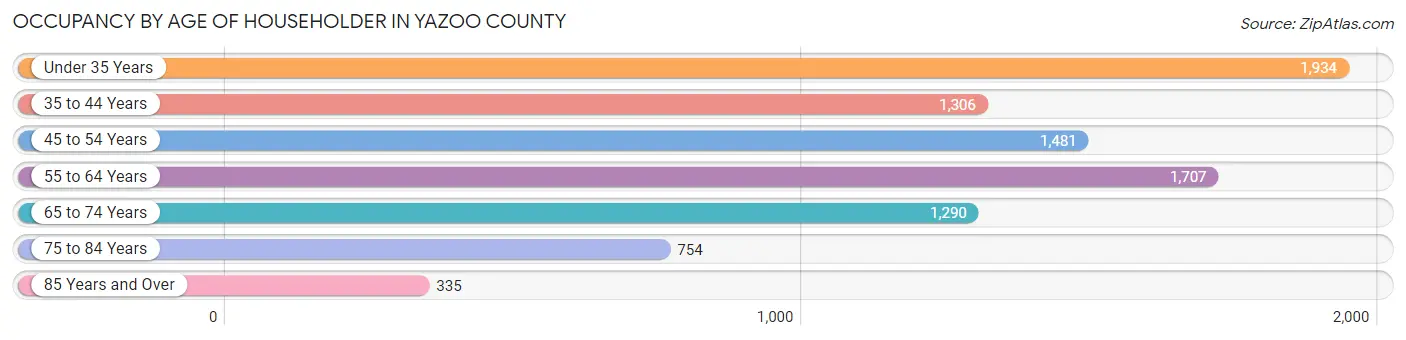
| Age Bracket | # Households | % Households |
| Under 35 Years | 1,934 | 22.0% |
| 35 to 44 Years | 1,306 | 14.8% |
| 45 to 54 Years | 1,481 | 16.8% |
| 55 to 64 Years | 1,707 | 19.4% |
| 65 to 74 Years | 1,290 | 14.6% |
| 75 to 84 Years | 754 | 8.6% |
| 85 Years and Over | 335 | 3.8% |
| Total | 8,807 | 100.0% |
Housing Finances in Yazoo County
Median Income by Occupancy in Yazoo County
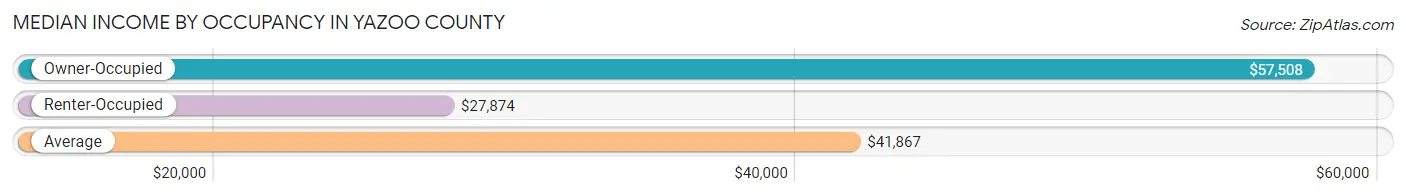
| Occupancy Type | # Households | Median Income |
| Owner-Occupied | 5,057 (57.4%) | $57,508 |
| Renter-Occupied | 3,750 (42.6%) | $27,874 |
| Average | 8,807 (100.0%) | $41,867 |
Occupancy by Householder Income Bracket in Yazoo County
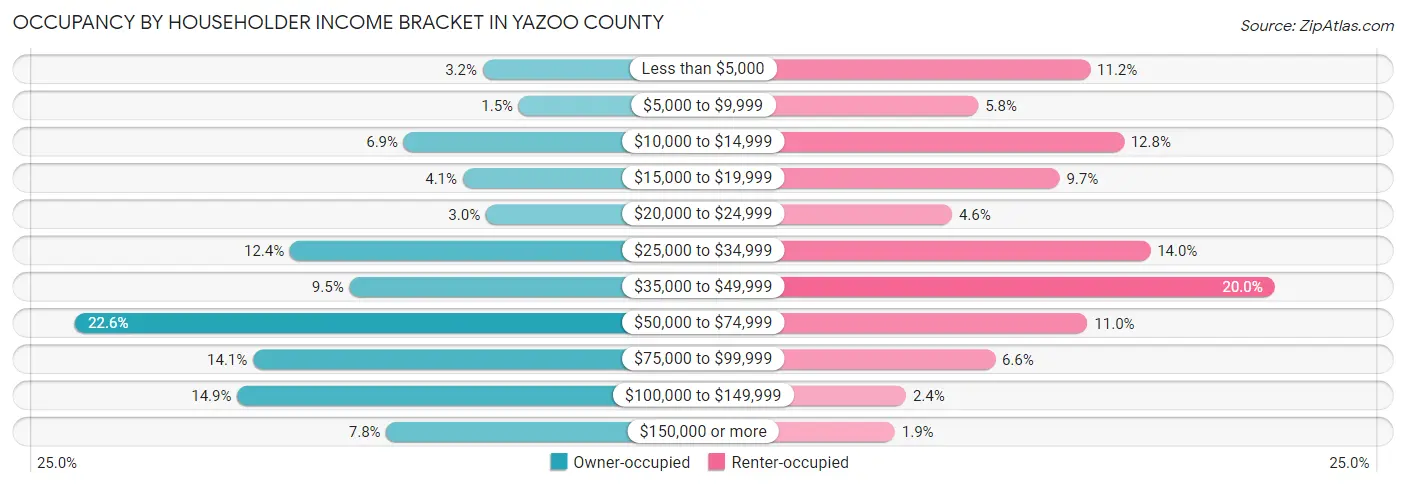
| Income Bracket | Owner-occupied | Renter-occupied |
| Less than $5,000 | 161 (3.2%) | 419 (11.2%) |
| $5,000 to $9,999 | 74 (1.5%) | 219 (5.8%) |
| $10,000 to $14,999 | 351 (6.9%) | 479 (12.8%) |
| $15,000 to $19,999 | 209 (4.1%) | 364 (9.7%) |
| $20,000 to $24,999 | 153 (3.0%) | 172 (4.6%) |
| $25,000 to $34,999 | 625 (12.4%) | 526 (14.0%) |
| $35,000 to $49,999 | 482 (9.5%) | 748 (20.0%) |
| $50,000 to $74,999 | 1,143 (22.6%) | 414 (11.0%) |
| $75,000 to $99,999 | 714 (14.1%) | 249 (6.6%) |
| $100,000 to $149,999 | 752 (14.9%) | 90 (2.4%) |
| $150,000 or more | 393 (7.8%) | 70 (1.9%) |
| Total | 5,057 (100.0%) | 3,750 (100.0%) |
Monthly Housing Cost Tiers in Yazoo County
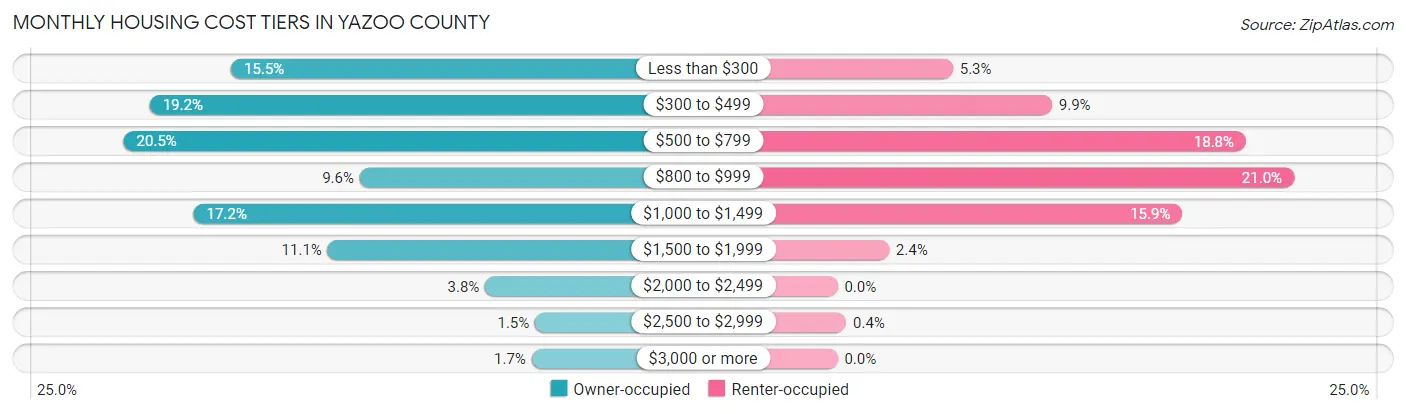
| Monthly Cost | Owner-occupied | Renter-occupied |
| Less than $300 | 784 (15.5%) | 199 (5.3%) |
| $300 to $499 | 973 (19.2%) | 370 (9.9%) |
| $500 to $799 | 1,034 (20.4%) | 705 (18.8%) |
| $800 to $999 | 484 (9.6%) | 788 (21.0%) |
| $1,000 to $1,499 | 871 (17.2%) | 595 (15.9%) |
| $1,500 to $1,999 | 559 (11.1%) | 89 (2.4%) |
| $2,000 to $2,499 | 192 (3.8%) | 0 (0.0%) |
| $2,500 to $2,999 | 76 (1.5%) | 15 (0.4%) |
| $3,000 or more | 84 (1.7%) | 0 (0.0%) |
| Total | 5,057 (100.0%) | 3,750 (100.0%) |
Physical Housing Characteristics in Yazoo County
Housing Structures in Yazoo County
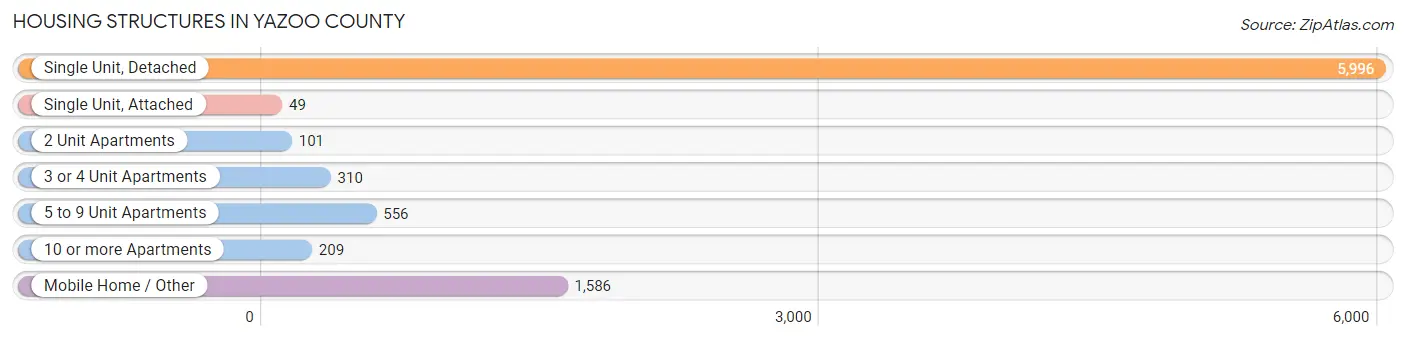
| Structure Type | # Housing Units | % Housing Units |
| Single Unit, Detached | 5,996 | 68.1% |
| Single Unit, Attached | 49 | 0.6% |
| 2 Unit Apartments | 101 | 1.1% |
| 3 or 4 Unit Apartments | 310 | 3.5% |
| 5 to 9 Unit Apartments | 556 | 6.3% |
| 10 or more Apartments | 209 | 2.4% |
| Mobile Home / Other | 1,586 | 18.0% |
| Total | 8,807 | 100.0% |
Housing Structures by Occupancy in Yazoo County
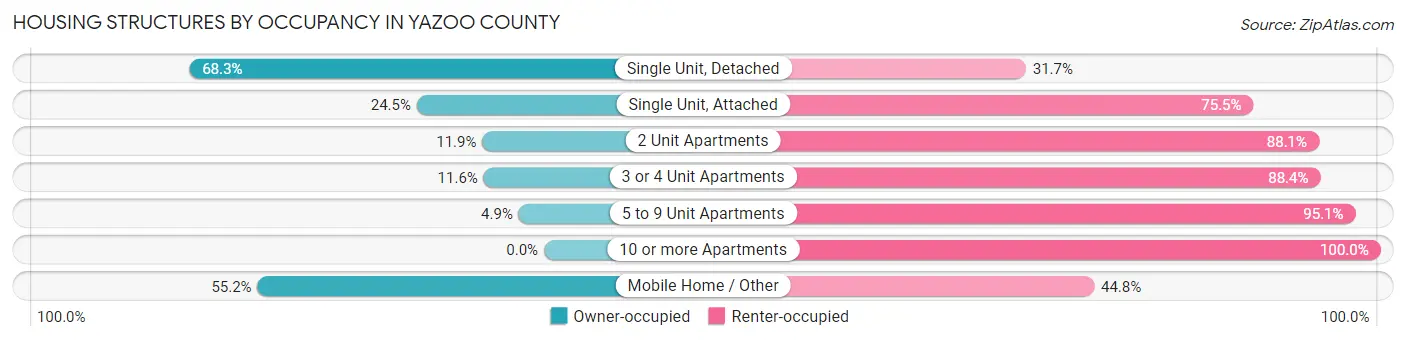
| Structure Type | Owner-occupied | Renter-occupied |
| Single Unit, Detached | 4,095 (68.3%) | 1,901 (31.7%) |
| Single Unit, Attached | 12 (24.5%) | 37 (75.5%) |
| 2 Unit Apartments | 12 (11.9%) | 89 (88.1%) |
| 3 or 4 Unit Apartments | 36 (11.6%) | 274 (88.4%) |
| 5 to 9 Unit Apartments | 27 (4.9%) | 529 (95.1%) |
| 10 or more Apartments | 0 (0.0%) | 209 (100.0%) |
| Mobile Home / Other | 875 (55.2%) | 711 (44.8%) |
| Total | 5,057 (57.4%) | 3,750 (42.6%) |
Housing Structures by Number of Rooms in Yazoo County
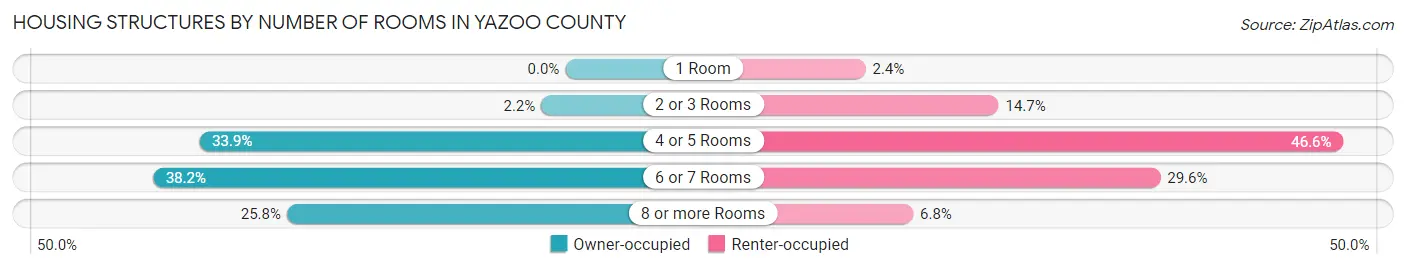
| Number of Rooms | Owner-occupied | Renter-occupied |
| 1 Room | 0 (0.0%) | 89 (2.4%) |
| 2 or 3 Rooms | 113 (2.2%) | 550 (14.7%) |
| 4 or 5 Rooms | 1,713 (33.9%) | 1,746 (46.6%) |
| 6 or 7 Rooms | 1,929 (38.2%) | 1,111 (29.6%) |
| 8 or more Rooms | 1,302 (25.8%) | 254 (6.8%) |
| Total | 5,057 (100.0%) | 3,750 (100.0%) |
Housing Structure by Heating Type in Yazoo County
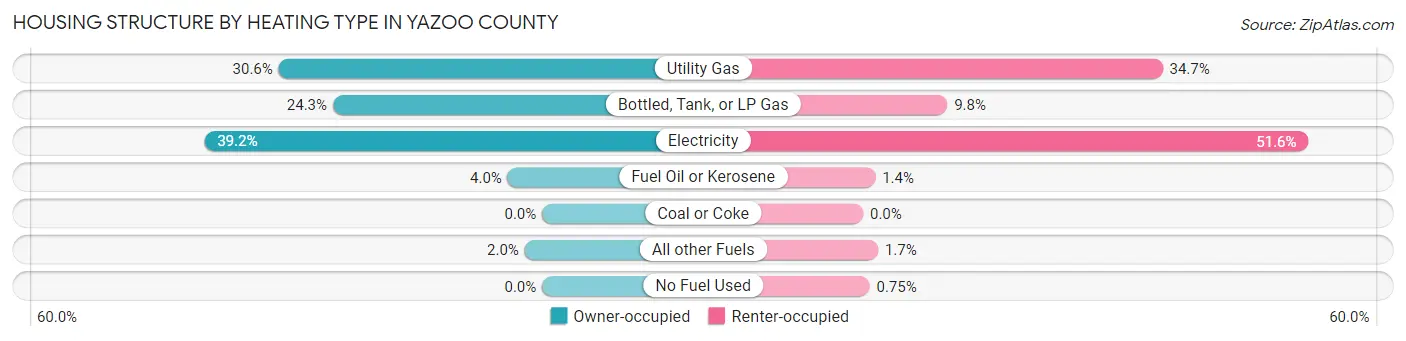
| Heating Type | Owner-occupied | Renter-occupied |
| Utility Gas | 1,545 (30.5%) | 1,302 (34.7%) |
| Bottled, Tank, or LP Gas | 1,227 (24.3%) | 366 (9.8%) |
| Electricity | 1,981 (39.2%) | 1,936 (51.6%) |
| Fuel Oil or Kerosene | 202 (4.0%) | 53 (1.4%) |
| Coal or Coke | 0 (0.0%) | 0 (0.0%) |
| All other Fuels | 102 (2.0%) | 65 (1.7%) |
| No Fuel Used | 0 (0.0%) | 28 (0.7%) |
| Total | 5,057 (100.0%) | 3,750 (100.0%) |
Household Vehicle Usage in Yazoo County
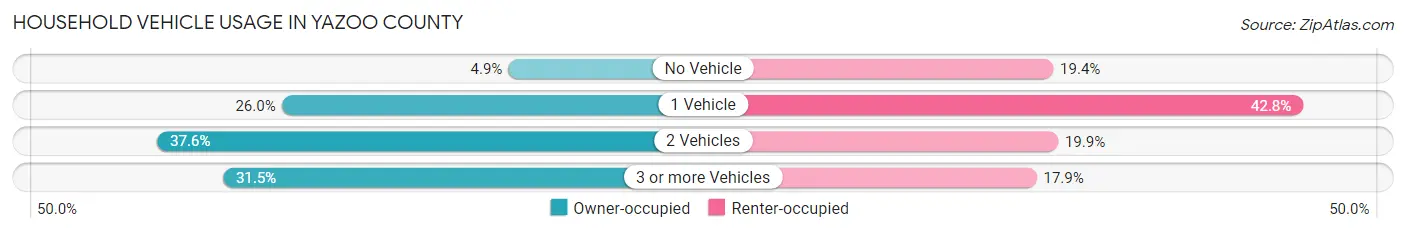
| Vehicles per Household | Owner-occupied | Renter-occupied |
| No Vehicle | 246 (4.9%) | 729 (19.4%) |
| 1 Vehicle | 1,316 (26.0%) | 1,604 (42.8%) |
| 2 Vehicles | 1,903 (37.6%) | 746 (19.9%) |
| 3 or more Vehicles | 1,592 (31.5%) | 671 (17.9%) |
| Total | 5,057 (100.0%) | 3,750 (100.0%) |
Real Estate & Mortgages in Yazoo County
Real Estate and Mortgage Overview in Yazoo County
| Characteristic | Without Mortgage | With Mortgage |
| Housing Units | 2,785 | 2,272 |
| Median Property Value | $94,700 | $169,200 |
| Median Household Income | $45,078 | $202 |
| Monthly Housing Costs | $425 | $84 |
| Real Estate Taxes | $653 | $191 |
Property Value by Mortgage Status in Yazoo County
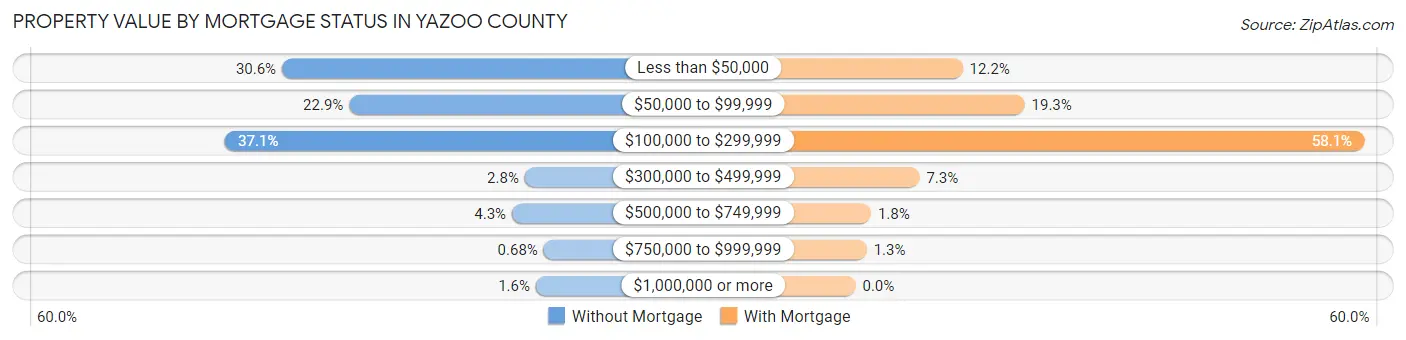
| Property Value | Without Mortgage | With Mortgage |
| Less than $50,000 | 852 (30.6%) | 278 (12.2%) |
| $50,000 to $99,999 | 638 (22.9%) | 439 (19.3%) |
| $100,000 to $299,999 | 1,033 (37.1%) | 1,320 (58.1%) |
| $300,000 to $499,999 | 79 (2.8%) | 166 (7.3%) |
| $500,000 to $749,999 | 120 (4.3%) | 40 (1.8%) |
| $750,000 to $999,999 | 19 (0.7%) | 29 (1.3%) |
| $1,000,000 or more | 44 (1.6%) | 0 (0.0%) |
| Total | 2,785 (100.0%) | 2,272 (100.0%) |
Household Income by Mortgage Status in Yazoo County
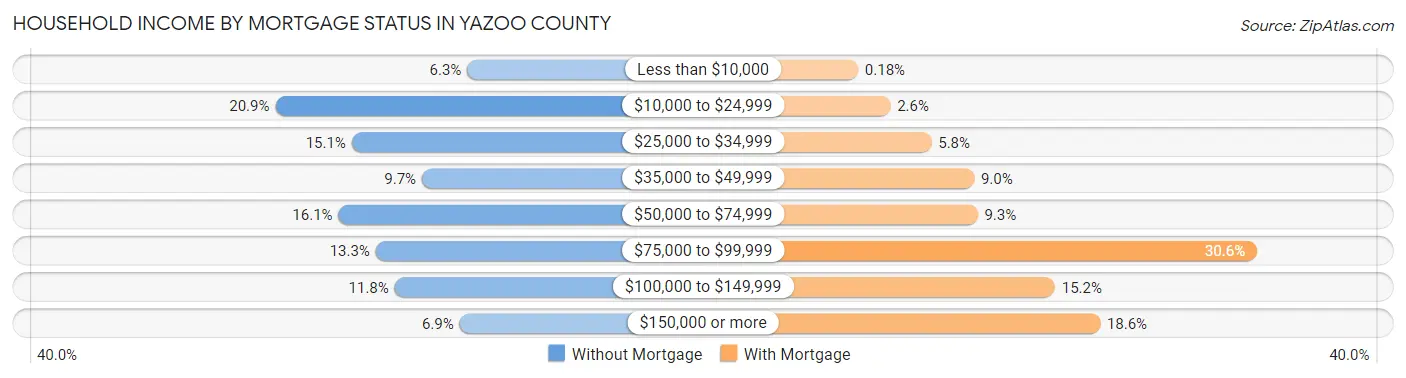
| Household Income | Without Mortgage | With Mortgage |
| Less than $10,000 | 175 (6.3%) | 4 (0.2%) |
| $10,000 to $24,999 | 582 (20.9%) | 60 (2.6%) |
| $25,000 to $34,999 | 420 (15.1%) | 131 (5.8%) |
| $35,000 to $49,999 | 271 (9.7%) | 205 (9.0%) |
| $50,000 to $74,999 | 448 (16.1%) | 211 (9.3%) |
| $75,000 to $99,999 | 369 (13.3%) | 695 (30.6%) |
| $100,000 to $149,999 | 329 (11.8%) | 345 (15.2%) |
| $150,000 or more | 191 (6.9%) | 423 (18.6%) |
| Total | 2,785 (100.0%) | 2,272 (100.0%) |
Property Value to Household Income Ratio in Yazoo County
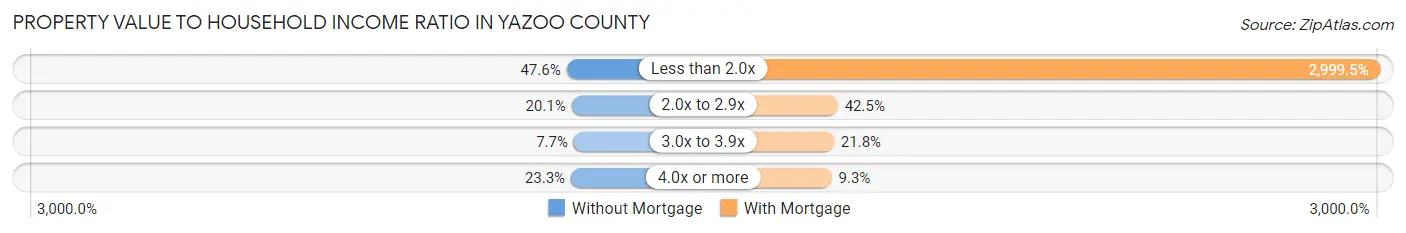
| Value-to-Income Ratio | Without Mortgage | With Mortgage |
| Less than 2.0x | 1,325 (47.6%) | 68,148 (2,999.5%) |
| 2.0x to 2.9x | 559 (20.1%) | 965 (42.5%) |
| 3.0x to 3.9x | 215 (7.7%) | 495 (21.8%) |
| 4.0x or more | 648 (23.3%) | 212 (9.3%) |
| Total | 2,785 (100.0%) | 2,272 (100.0%) |
Real Estate Taxes by Mortgage Status in Yazoo County
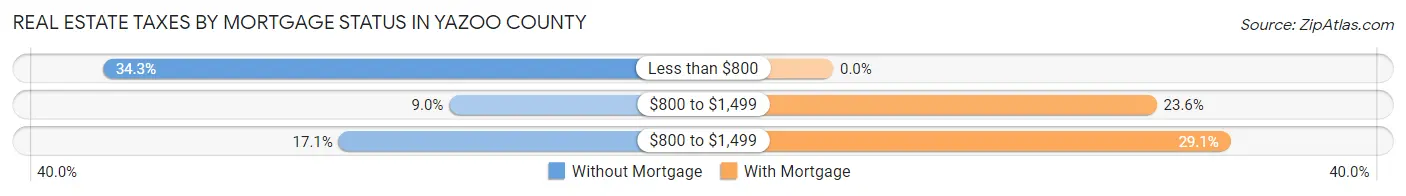
| Property Taxes | Without Mortgage | With Mortgage |
| Less than $800 | 955 (34.3%) | 0 (0.0%) |
| $800 to $1,499 | 250 (9.0%) | 537 (23.6%) |
| $800 to $1,499 | 475 (17.1%) | 660 (29.0%) |
| Total | 2,785 (100.0%) | 2,272 (100.0%) |
Health & Disability in Yazoo County
Health Insurance Coverage by Age in Yazoo County
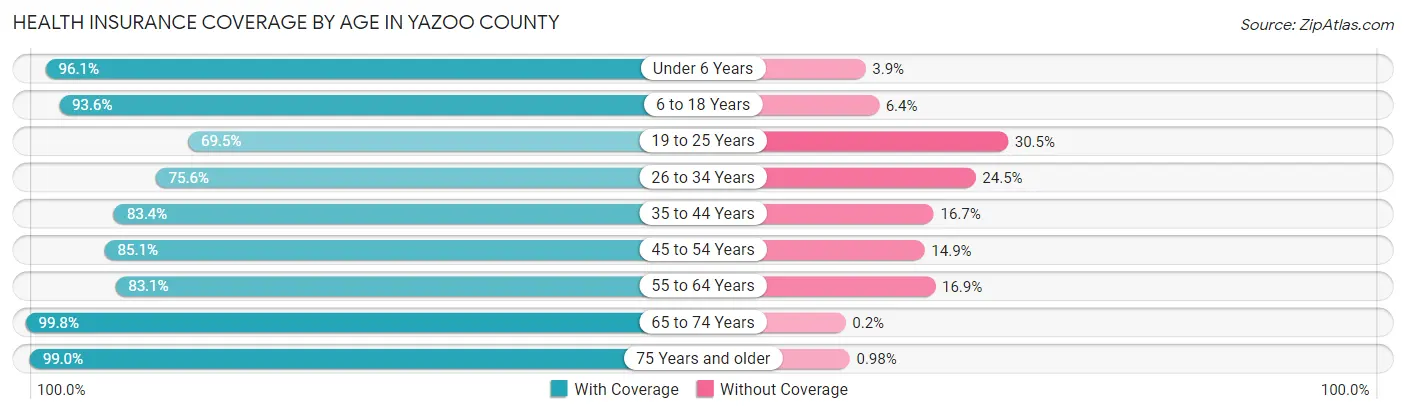
| Age Bracket | With Coverage | Without Coverage |
| Under 6 Years | 1,668 (96.1%) | 68 (3.9%) |
| 6 to 18 Years | 4,064 (93.6%) | 279 (6.4%) |
| 19 to 25 Years | 1,639 (69.5%) | 719 (30.5%) |
| 26 to 34 Years | 2,413 (75.5%) | 781 (24.4%) |
| 35 to 44 Years | 2,032 (83.4%) | 406 (16.7%) |
| 45 to 54 Years | 2,158 (85.1%) | 379 (14.9%) |
| 55 to 64 Years | 2,225 (83.1%) | 453 (16.9%) |
| 65 to 74 Years | 2,011 (99.8%) | 4 (0.2%) |
| 75 Years and older | 1,314 (99.0%) | 13 (1.0%) |
| Total | 19,524 (86.3%) | 3,102 (13.7%) |
Health Insurance Coverage by Citizenship Status in Yazoo County
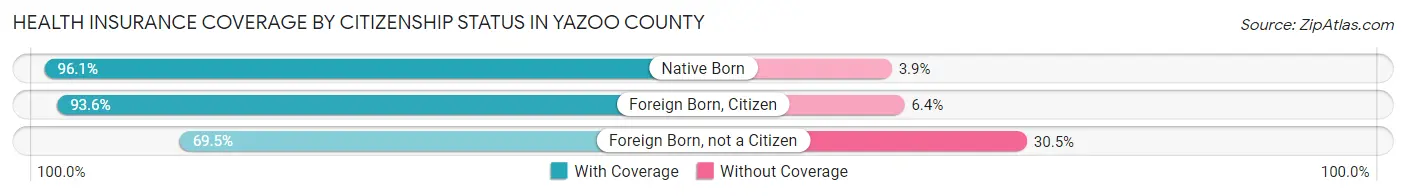
| Citizenship Status | With Coverage | Without Coverage |
| Native Born | 1,668 (96.1%) | 68 (3.9%) |
| Foreign Born, Citizen | 4,064 (93.6%) | 279 (6.4%) |
| Foreign Born, not a Citizen | 1,639 (69.5%) | 719 (30.5%) |
Health Insurance Coverage by Household Income in Yazoo County
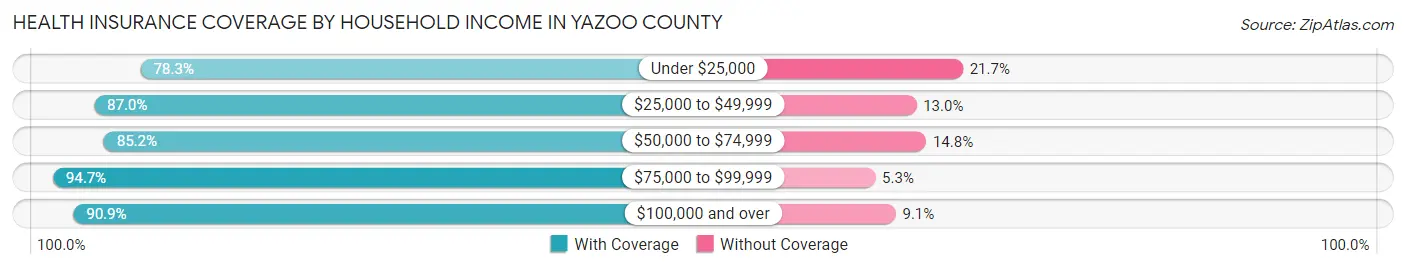
| Household Income | With Coverage | Without Coverage |
| Under $25,000 | 4,314 (78.3%) | 1,197 (21.7%) |
| $25,000 to $49,999 | 5,043 (87.0%) | 754 (13.0%) |
| $50,000 to $74,999 | 3,414 (85.2%) | 595 (14.8%) |
| $75,000 to $99,999 | 2,731 (94.7%) | 153 (5.3%) |
| $100,000 and over | 4,011 (90.9%) | 403 (9.1%) |
Public vs Private Health Insurance Coverage by Age in Yazoo County
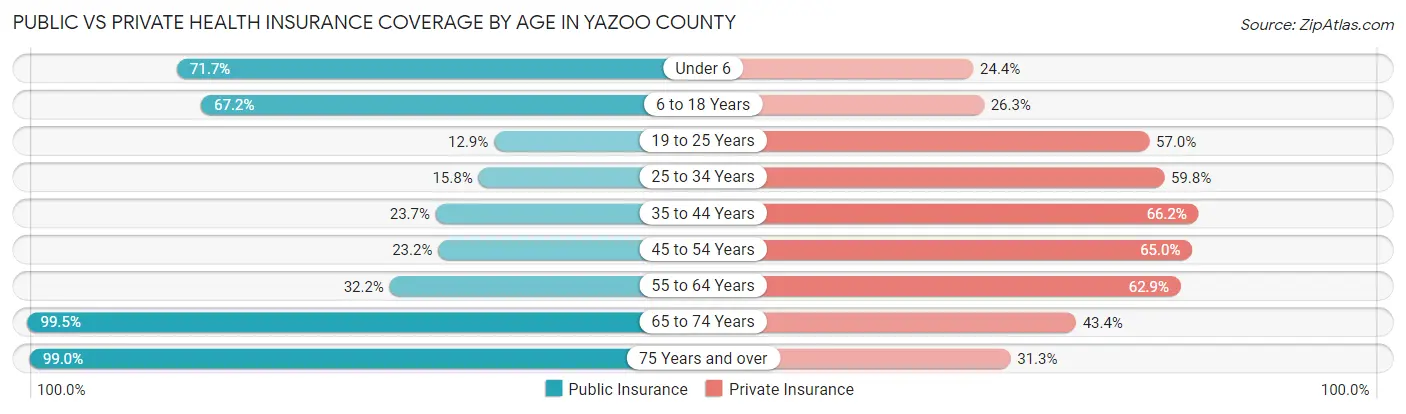
| Age Bracket | Public Insurance | Private Insurance |
| Under 6 | 1,245 (71.7%) | 423 (24.4%) |
| 6 to 18 Years | 2,920 (67.2%) | 1,144 (26.3%) |
| 19 to 25 Years | 303 (12.9%) | 1,345 (57.0%) |
| 25 to 34 Years | 503 (15.8%) | 1,910 (59.8%) |
| 35 to 44 Years | 577 (23.7%) | 1,615 (66.2%) |
| 45 to 54 Years | 589 (23.2%) | 1,650 (65.0%) |
| 55 to 64 Years | 863 (32.2%) | 1,685 (62.9%) |
| 65 to 74 Years | 2,004 (99.5%) | 875 (43.4%) |
| 75 Years and over | 1,314 (99.0%) | 415 (31.3%) |
| Total | 10,318 (45.6%) | 11,062 (48.9%) |
Disability Status by Sex by Age in Yazoo County
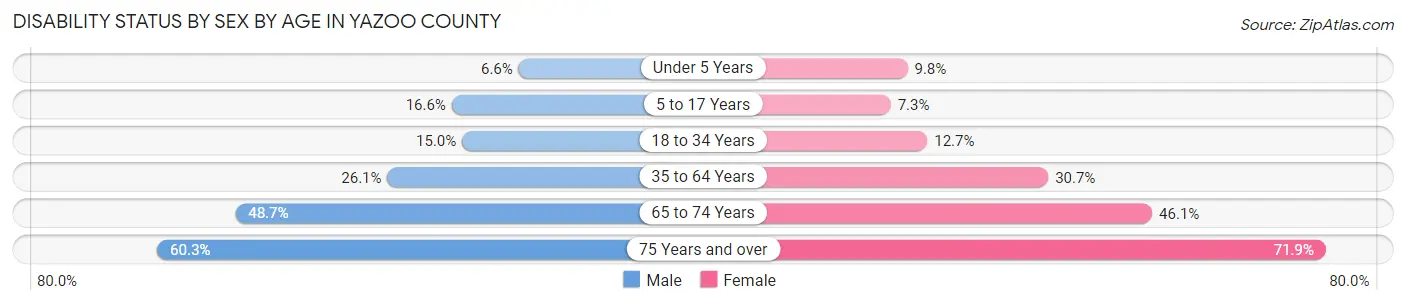
| Age Bracket | Male | Female |
| Under 5 Years | 52 (6.6%) | 69 (9.8%) |
| 5 to 17 Years | 375 (16.6%) | 150 (7.3%) |
| 18 to 34 Years | 517 (15.0%) | 302 (12.7%) |
| 35 to 64 Years | 947 (26.1%) | 1,235 (30.6%) |
| 65 to 74 Years | 452 (48.7%) | 501 (46.1%) |
| 75 Years and over | 275 (60.3%) | 626 (71.9%) |
Disability Class by Sex by Age in Yazoo County
Disability Class: Hearing Difficulty
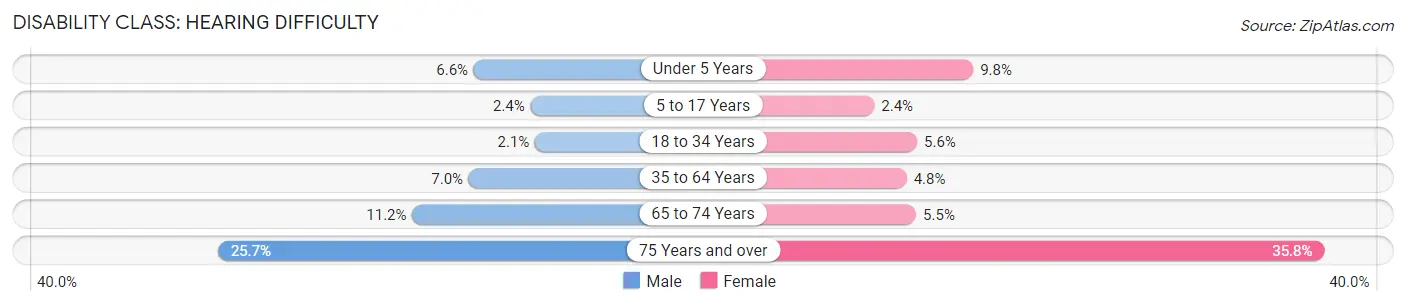
| Age Bracket | Male | Female |
| Under 5 Years | 52 (6.6%) | 69 (9.8%) |
| 5 to 17 Years | 55 (2.4%) | 50 (2.4%) |
| 18 to 34 Years | 72 (2.1%) | 133 (5.6%) |
| 35 to 64 Years | 254 (7.0%) | 194 (4.8%) |
| 65 to 74 Years | 104 (11.2%) | 60 (5.5%) |
| 75 Years and over | 117 (25.7%) | 312 (35.8%) |
Disability Class: Vision Difficulty
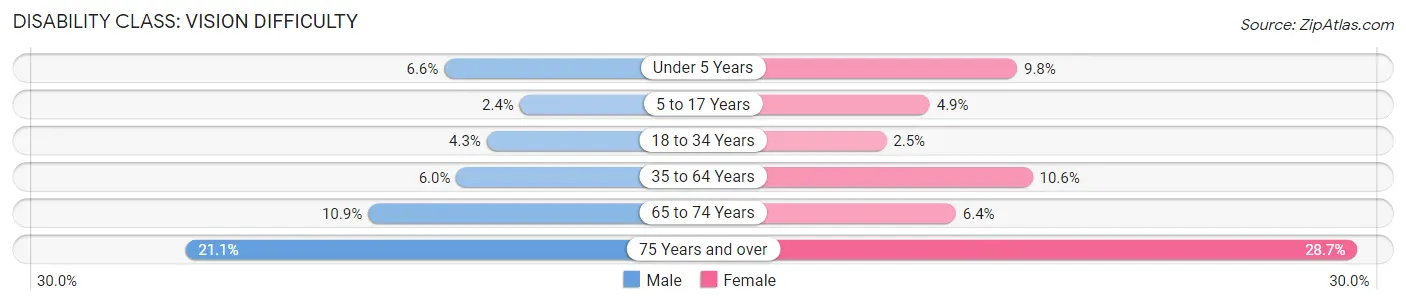
| Age Bracket | Male | Female |
| Under 5 Years | 52 (6.6%) | 69 (9.8%) |
| 5 to 17 Years | 55 (2.4%) | 101 (4.9%) |
| 18 to 34 Years | 147 (4.3%) | 59 (2.5%) |
| 35 to 64 Years | 216 (6.0%) | 428 (10.6%) |
| 65 to 74 Years | 101 (10.9%) | 69 (6.4%) |
| 75 Years and over | 96 (21.0%) | 250 (28.7%) |
Disability Class: Cognitive Difficulty
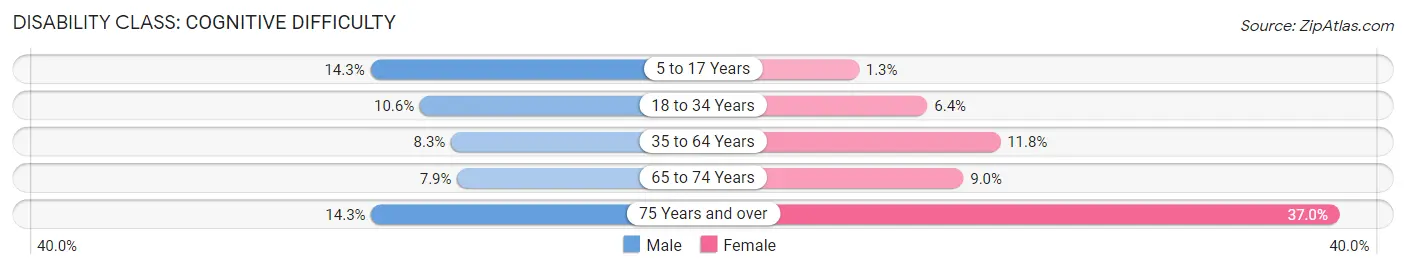
| Age Bracket | Male | Female |
| 5 to 17 Years | 324 (14.3%) | 26 (1.3%) |
| 18 to 34 Years | 366 (10.6%) | 151 (6.4%) |
| 35 to 64 Years | 302 (8.3%) | 474 (11.8%) |
| 65 to 74 Years | 73 (7.9%) | 98 (9.0%) |
| 75 Years and over | 65 (14.2%) | 322 (37.0%) |
Disability Class: Ambulatory Difficulty
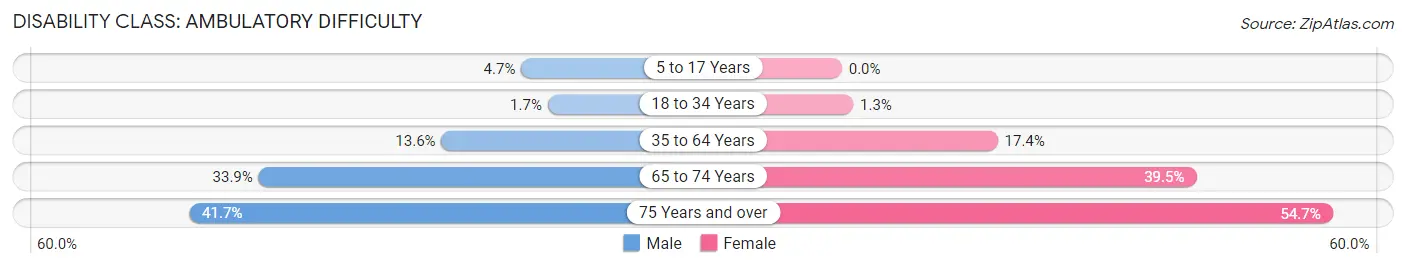
| Age Bracket | Male | Female |
| 5 to 17 Years | 106 (4.7%) | 0 (0.0%) |
| 18 to 34 Years | 60 (1.7%) | 30 (1.3%) |
| 35 to 64 Years | 492 (13.6%) | 699 (17.3%) |
| 65 to 74 Years | 315 (33.9%) | 429 (39.5%) |
| 75 Years and over | 190 (41.7%) | 476 (54.6%) |
Disability Class: Self-Care Difficulty
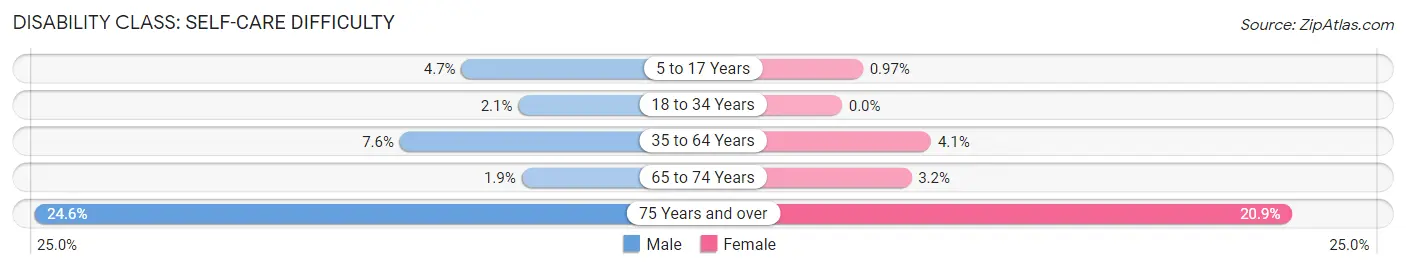
| Age Bracket | Male | Female |
| 5 to 17 Years | 107 (4.7%) | 20 (1.0%) |
| 18 to 34 Years | 72 (2.1%) | 0 (0.0%) |
| 35 to 64 Years | 275 (7.6%) | 167 (4.1%) |
| 65 to 74 Years | 18 (1.9%) | 35 (3.2%) |
| 75 Years and over | 112 (24.6%) | 182 (20.9%) |
Technology Access in Yazoo County
Computing Device Access in Yazoo County
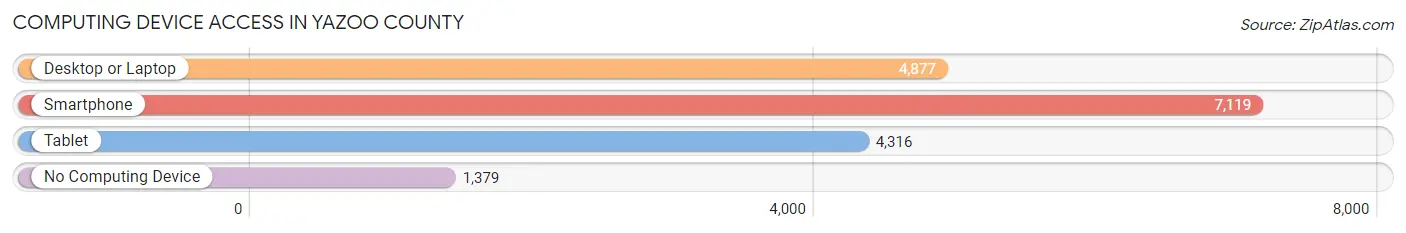
| Device Type | # Households | % Households |
| Desktop or Laptop | 4,877 | 55.4% |
| Smartphone | 7,119 | 80.8% |
| Tablet | 4,316 | 49.0% |
| No Computing Device | 1,379 | 15.7% |
| Total | 8,807 | 100.0% |
Internet Access in Yazoo County
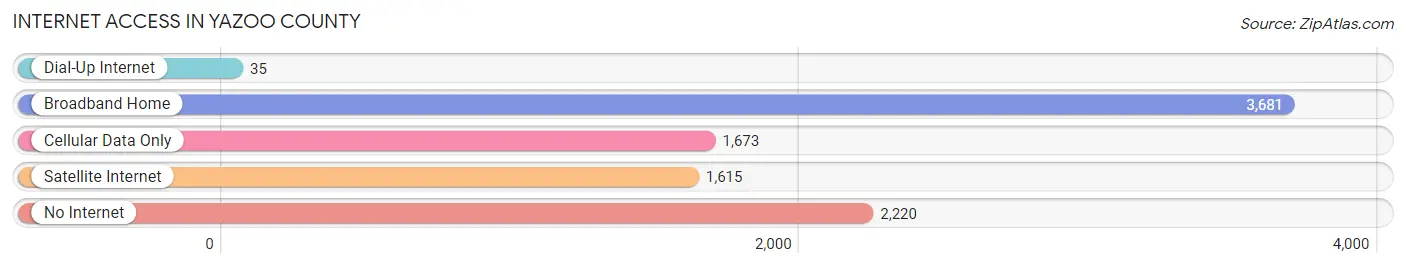
| Internet Type | # Households | % Households |
| Dial-Up Internet | 35 | 0.4% |
| Broadband Home | 3,681 | 41.8% |
| Cellular Data Only | 1,673 | 19.0% |
| Satellite Internet | 1,615 | 18.3% |
| No Internet | 2,220 | 25.2% |
| Total | 8,807 | 100.0% |
Yazoo County Summary
Yazoo County, Mississippi is located in the heart of the Mississippi Delta, and is part of the larger Yazoo-Mississippi Delta region. The county is bordered by Humphreys County to the north, Holmes County to the east, Sharkey County to the south, and Madison County to the west. The county seat is Yazoo City, and the county is home to a population of 28,065 people, according to the 2010 census.
Yazoo County was established in 1823, and was named after the Yazoo River, which runs through the county. The county was originally part of the Choctaw Nation, and was later ceded to the United States in the Treaty of Dancing Rabbit Creek in 1830. The county was home to a large population of African Americans, and was the site of several major civil rights events in the 1960s.
Geographically, Yazoo County is located in the Mississippi Delta, and is characterized by flat, fertile land. The county is home to several major rivers, including the Yazoo River, the Big Black River, and the Sunflower River. The county is also home to several lakes, including Lake George, Lake Ferguson, and Lake Yazoo.
The economy of Yazoo County is largely based on agriculture, with cotton, soybeans, and corn being the primary crops. The county is also home to several manufacturing and industrial businesses, including a paper mill, a chemical plant, and a steel mill. The county is also home to several oil and gas companies, as well as a number of timber companies.
Demographically, Yazoo County is predominantly African American, with a population that is approximately 70% African American. The county is also home to a significant Hispanic population, as well as a small population of Native Americans. The median household income in the county is $30,945, and the median home value is $77,400.
Yazoo County is a vibrant and diverse community, with a rich history and a bright future. The county is home to a number of attractions, including the Yazoo National Wildlife Refuge, the Delta Blues Museum, and the Yazoo County Historical Museum. The county is also home to a number of festivals and events, including the Yazoo County Fair, the Yazoo County Watermelon Festival, and the Yazoo County Mardi Gras.
Common Questions
What is Per Capita Income in Yazoo County?
Per Capita income in Yazoo County is $19,836.
What is the Median Family Income in Yazoo County?
Median Family Income in Yazoo County is $53,792.
What is the Median Household income in Yazoo County?
Median Household Income in Yazoo County is $41,867.
What is Income or Wage Gap in Yazoo County?
Income or Wage Gap in Yazoo County is 6.7%.
Women in Yazoo County earn 93.3 cents for every dollar earned by a man.
What is Family Income Deficit in Yazoo County?
Family Income Deficit in Yazoo County is $11,784.
Families that are below poverty line in Yazoo County earn $11,784 less on average than the poverty threshold level.
What is Inequality or Gini Index in Yazoo County?
Inequality or Gini Index in Yazoo County is 0.48.
What is the Total Population of Yazoo County?
Total Population of Yazoo County is 27,467.
What is the Total Male Population of Yazoo County?
Total Male Population of Yazoo County is 16,207.
What is the Total Female Population of Yazoo County?
Total Female Population of Yazoo County is 11,260.
What is the Ratio of Males per 100 Females in Yazoo County?
There are 143.93 Males per 100 Females in Yazoo County.
What is the Ratio of Females per 100 Males in Yazoo County?
There are 69.48 Females per 100 Males in Yazoo County.
What is the Median Population Age in Yazoo County?
Median Population Age in Yazoo County is 36.8 Years.
What is the Average Family Size in Yazoo County
Average Family Size in Yazoo County is 3.2 People.
What is the Average Household Size in Yazoo County
Average Household Size in Yazoo County is 2.6 People.
How Large is the Labor Force in Yazoo County?
There are 10,098 People in the Labor Forcein in Yazoo County.
What is the Percentage of People in the Labor Force in Yazoo County?
45.1% of People are in the Labor Force in Yazoo County.
What is the Unemployment Rate in Yazoo County?
Unemployment Rate in Yazoo County is 10.4%.