Yalobusha County, MS Map & Demographics
Yalobusha County Map
Yalobusha County Overview
$24,719
PER CAPITA INCOME
$58,429
AVG FAMILY INCOME
$47,006
AVG HOUSEHOLD INCOME
28.5%
WAGE / INCOME GAP [ % ]
71.5¢/ $1
WAGE / INCOME GAP [ $ ]
$10,035
FAMILY INCOME DEFICIT
0.43
INEQUALITY / GINI INDEX
12,499
TOTAL POPULATION
5,990
MALE POPULATION
6,509
FEMALE POPULATION
92.03
MALES / 100 FEMALES
108.66
FEMALES / 100 MALES
41.8
MEDIAN AGE
3.1
AVG FAMILY SIZE
2.4
AVG HOUSEHOLD SIZE
5,309
LABOR FORCE [ PEOPLE ]
52.2%
PERCENT IN LABOR FORCE
5.0%
UNEMPLOYMENT RATE
Yalobusha County Area Codes
Income in Yalobusha County
Income Overview in Yalobusha County
Per Capita Income in Yalobusha County is $24,719, while median incomes of families and households are $58,429 and $47,006 respectively.
| Characteristic | Number | Measure |
| Per Capita Income | 12,499 | $24,719 |
| Median Family Income | 3,108 | $58,429 |
| Mean Family Income | 3,108 | $67,072 |
| Median Household Income | 5,106 | $47,006 |
| Mean Household Income | 5,106 | $58,196 |
| Income Deficit | 3,108 | $10,035 |
| Wage / Income Gap (%) | 12,499 | 28.48% |
| Wage / Income Gap ($) | 12,499 | 71.52¢ per $1 |
| Gini / Inequality Index | 12,499 | 0.43 |
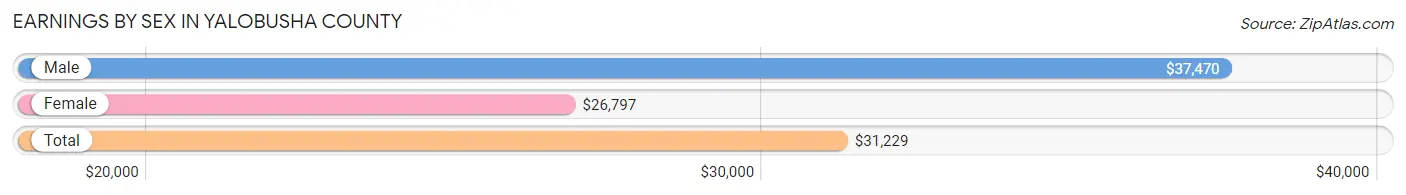
Earnings by Sex in Yalobusha County
Average Earnings in Yalobusha County are $31,229, $37,470 for men and $26,797 for women, a difference of 28.5%.
| Sex | Number | Average Earnings |
| Male | 2,897 (52.3%) | $37,470 |
| Female | 2,640 (47.7%) | $26,797 |
| Total | 5,537 (100.0%) | $31,229 |
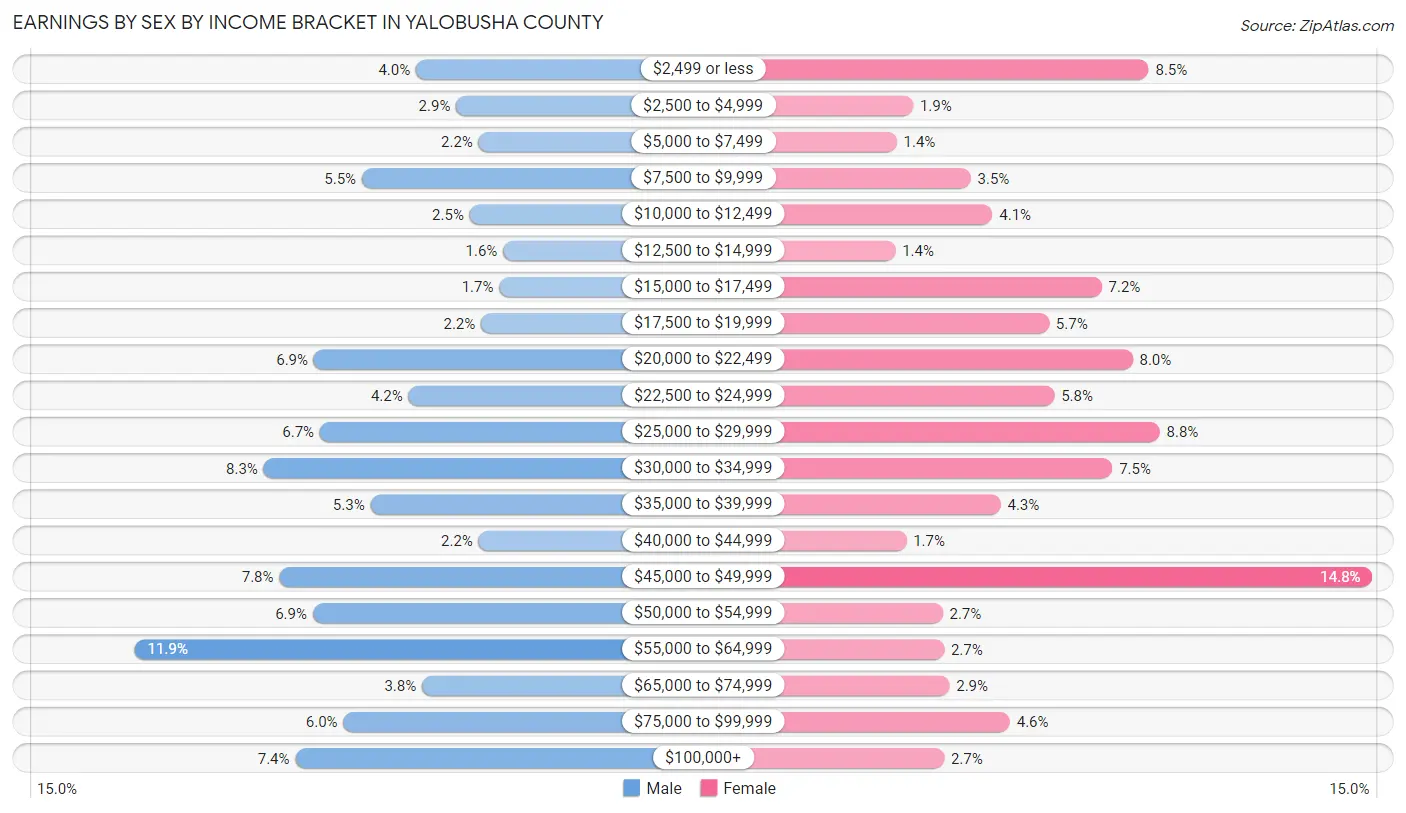
Earnings by Sex by Income Bracket in Yalobusha County
The most common earnings brackets in Yalobusha County are $55,000 to $64,999 for men (345 | 11.9%) and $45,000 to $49,999 for women (390 | 14.8%).
| Income | Male | Female |
| $2,499 or less | 116 (4.0%) | 224 (8.5%) |
| $2,500 to $4,999 | 83 (2.9%) | 49 (1.9%) |
| $5,000 to $7,499 | 65 (2.2%) | 37 (1.4%) |
| $7,500 to $9,999 | 160 (5.5%) | 92 (3.5%) |
| $10,000 to $12,499 | 72 (2.5%) | 108 (4.1%) |
| $12,500 to $14,999 | 45 (1.5%) | 36 (1.4%) |
| $15,000 to $17,499 | 48 (1.7%) | 189 (7.2%) |
| $17,500 to $19,999 | 63 (2.2%) | 150 (5.7%) |
| $20,000 to $22,499 | 199 (6.9%) | 212 (8.0%) |
| $22,500 to $24,999 | 122 (4.2%) | 154 (5.8%) |
| $25,000 to $29,999 | 194 (6.7%) | 232 (8.8%) |
| $30,000 to $34,999 | 240 (8.3%) | 197 (7.5%) |
| $35,000 to $39,999 | 153 (5.3%) | 114 (4.3%) |
| $40,000 to $44,999 | 65 (2.2%) | 44 (1.7%) |
| $45,000 to $49,999 | 227 (7.8%) | 390 (14.8%) |
| $50,000 to $54,999 | 200 (6.9%) | 71 (2.7%) |
| $55,000 to $64,999 | 345 (11.9%) | 72 (2.7%) |
| $65,000 to $74,999 | 111 (3.8%) | 76 (2.9%) |
| $75,000 to $99,999 | 175 (6.0%) | 121 (4.6%) |
| $100,000+ | 214 (7.4%) | 72 (2.7%) |
| Total | 2,897 (100.0%) | 2,640 (100.0%) |
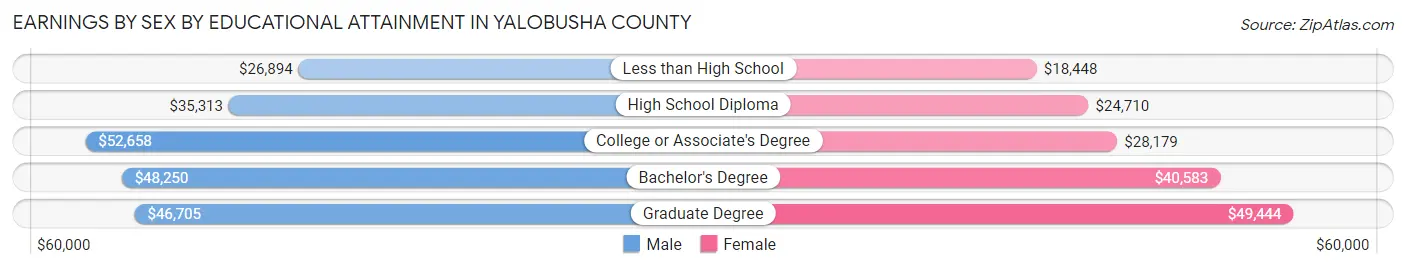
Earnings by Sex by Educational Attainment in Yalobusha County
Average earnings in Yalobusha County are $41,936 for men and $29,329 for women, a difference of 30.1%. Men with an educational attainment of college or associate's degree enjoy the highest average annual earnings of $52,658, while those with less than high school education earn the least with $26,894. Women with an educational attainment of graduate degree earn the most with the average annual earnings of $49,444, while those with less than high school education have the smallest earnings of $18,448.
| Educational Attainment | Male Income | Female Income |
| Less than High School | $26,894 | $18,448 |
| High School Diploma | $35,313 | $24,710 |
| College or Associate's Degree | $52,658 | $28,179 |
| Bachelor's Degree | $48,250 | $40,583 |
| Graduate Degree | $46,705 | $49,444 |
| Total | $41,936 | $29,329 |
Family Income in Yalobusha County
Family Income Brackets in Yalobusha County
According to the Yalobusha County family income data, there are 724 families falling into the $50,000 to $74,999 income range, which is the most common income bracket and makes up 23.3% of all families. Conversely, the $200,000+ income bracket is the least frequent group with only 16 families (0.5%) belonging to this category.
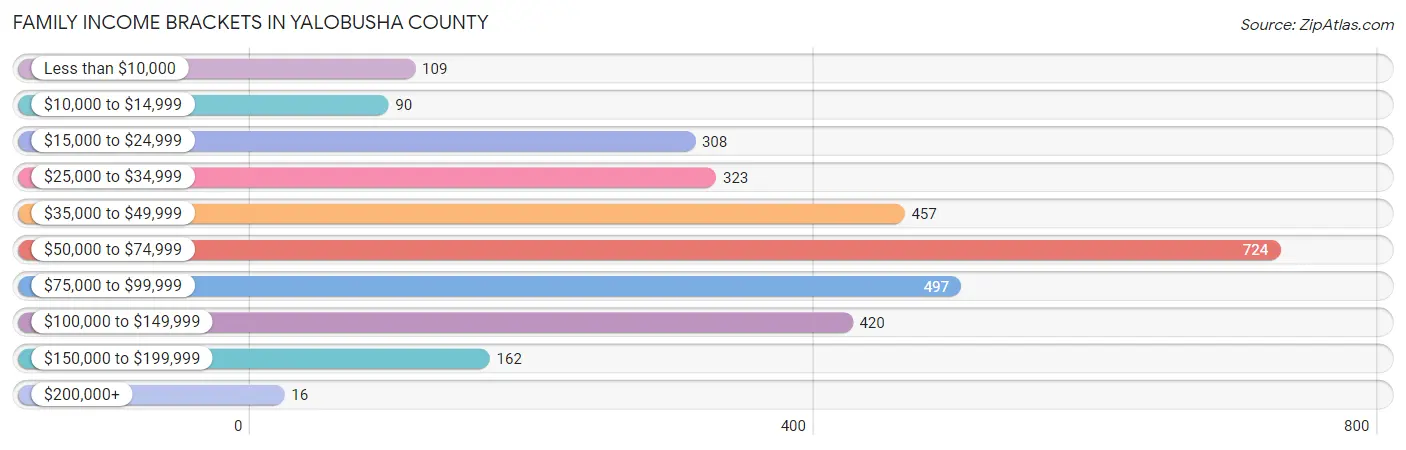
| Income Bracket | # Families | % Families |
| Less than $10,000 | 109 | 3.5% |
| $10,000 to $14,999 | 90 | 2.9% |
| $15,000 to $24,999 | 308 | 9.9% |
| $25,000 to $34,999 | 323 | 10.4% |
| $35,000 to $49,999 | 457 | 14.7% |
| $50,000 to $74,999 | 724 | 23.3% |
| $75,000 to $99,999 | 497 | 16.0% |
| $100,000 to $149,999 | 420 | 13.5% |
| $150,000 to $199,999 | 162 | 5.2% |
| $200,000+ | 16 | 0.5% |
Family Income by Famaliy Size in Yalobusha County
3-person families (530 | 17.1%) account for the highest median family income in Yalobusha County with $68,462 per family, while 2-person families (1,797 | 57.8%) have the highest median income of $28,852 per family member.
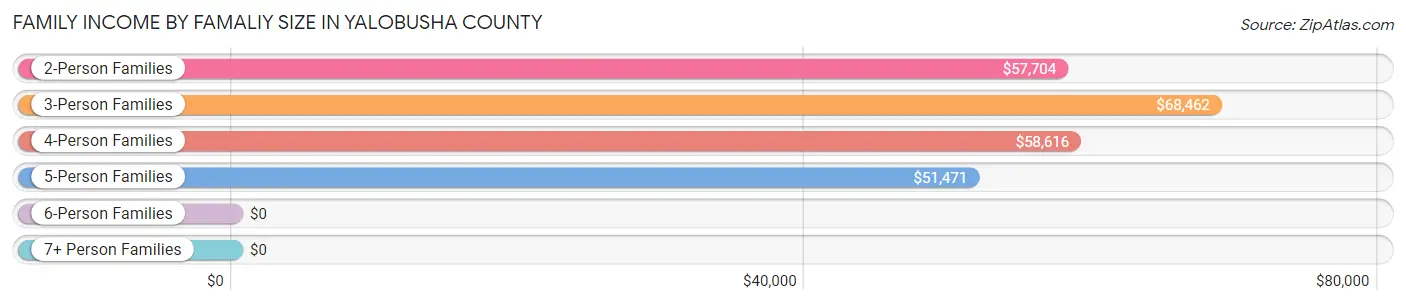
| Income Bracket | # Families | Median Income |
| 2-Person Families | 1,797 (57.8%) | $57,704 |
| 3-Person Families | 530 (17.1%) | $68,462 |
| 4-Person Families | 489 (15.7%) | $58,616 |
| 5-Person Families | 278 (8.9%) | $51,471 |
| 6-Person Families | 11 (0.4%) | $0 |
| 7+ Person Families | 3 (0.1%) | $0 |
| Total | 3,108 (100.0%) | $58,429 |
Family Income by Number of Earners in Yalobusha County
The median family income in Yalobusha County is $58,429, with families comprising 2 earners (1,082) having the highest median family income of $90,946, while families with no earners (717) have the lowest median family income of $42,813, accounting for 34.8% and 23.1% of families, respectively.
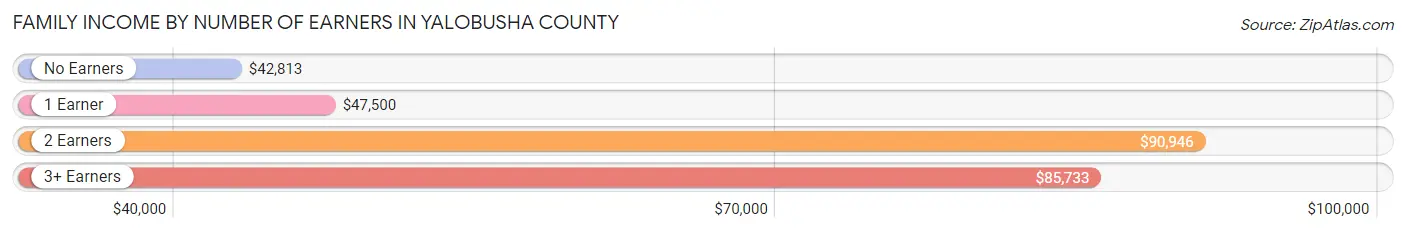
| Number of Earners | # Families | Median Income |
| No Earners | 717 (23.1%) | $42,813 |
| 1 Earner | 1,144 (36.8%) | $47,500 |
| 2 Earners | 1,082 (34.8%) | $90,946 |
| 3+ Earners | 165 (5.3%) | $85,733 |
| Total | 3,108 (100.0%) | $58,429 |
Household Income in Yalobusha County
Household Income Brackets in Yalobusha County
With 1,001 households falling in the category, the $50,000 to $74,999 income range is the most frequent in Yalobusha County, accounting for 19.6% of all households. In contrast, only 46 households (0.9%) fall into the $200,000+ income bracket, making it the least populous group.
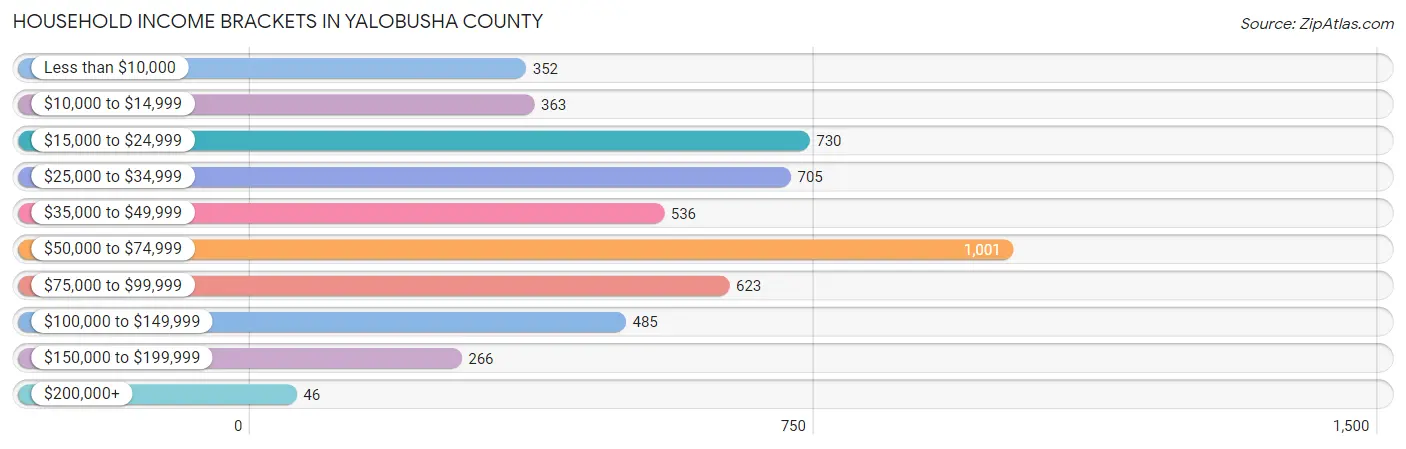
| Income Bracket | # Households | % Households |
| Less than $10,000 | 352 | 6.9% |
| $10,000 to $14,999 | 363 | 7.1% |
| $15,000 to $24,999 | 730 | 14.3% |
| $25,000 to $34,999 | 705 | 13.8% |
| $35,000 to $49,999 | 536 | 10.5% |
| $50,000 to $74,999 | 1,001 | 19.6% |
| $75,000 to $99,999 | 623 | 12.2% |
| $100,000 to $149,999 | 485 | 9.5% |
| $150,000 to $199,999 | 266 | 5.2% |
| $200,000+ | 46 | 0.9% |
Household Income by Householder Age in Yalobusha County
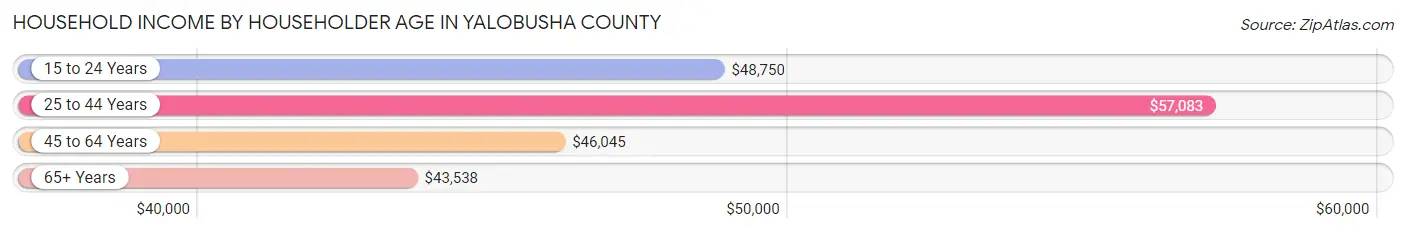
The median household income in Yalobusha County is $47,006, with the highest median household income of $57,083 found in the 25 to 44 years age bracket for the primary householder. A total of 1,407 households (27.6%) fall into this category. Meanwhile, the 65+ years age bracket for the primary householder has the lowest median household income of $43,538, with 1,745 households (34.2%) in this group.
| Income Bracket | # Households | Median Income |
| 15 to 24 Years | 126 (2.5%) | $48,750 |
| 25 to 44 Years | 1,407 (27.6%) | $57,083 |
| 45 to 64 Years | 1,828 (35.8%) | $46,045 |
| 65+ Years | 1,745 (34.2%) | $43,538 |
| Total | 5,106 (100.0%) | $47,006 |
Poverty in Yalobusha County
Income Below Poverty by Sex and Age in Yalobusha County
With 20.4% poverty level for males and 20.7% for females among the residents of Yalobusha County, under 5 year old males and 6 to 11 year old females are the most vulnerable to poverty, with 170 males (71.1%) and 164 females (39.1%) in their respective age groups living below the poverty level.
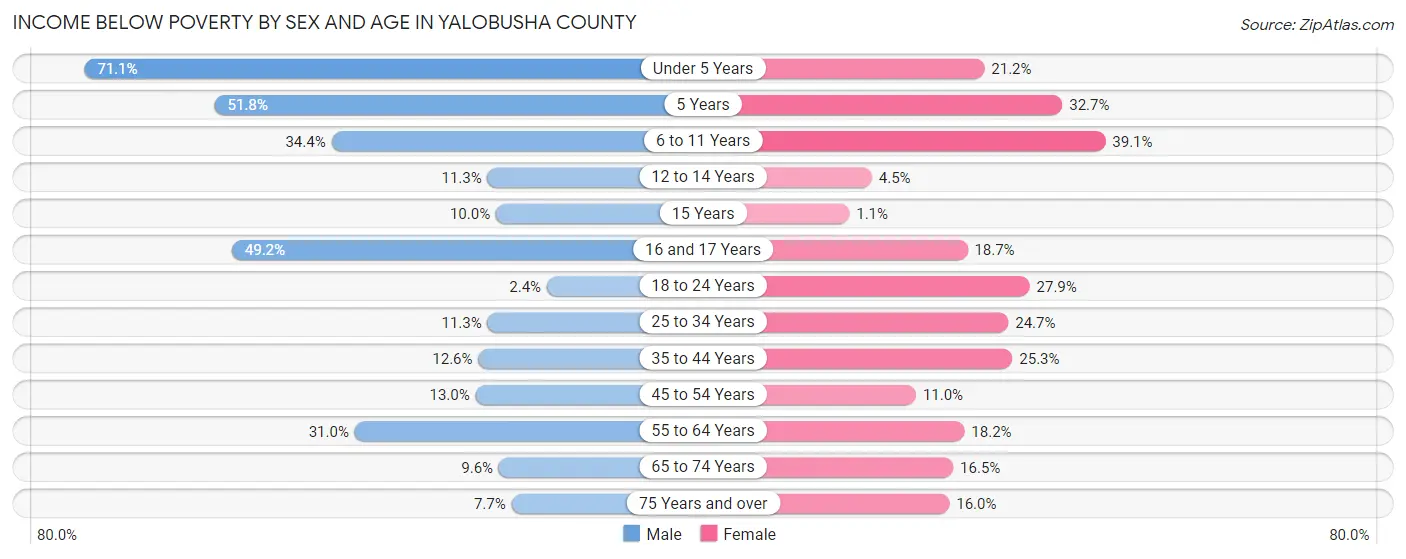
| Age Bracket | Male | Female |
| Under 5 Years | 170 (71.1%) | 98 (21.2%) |
| 5 Years | 29 (51.8%) | 37 (32.7%) |
| 6 to 11 Years | 220 (34.4%) | 164 (39.1%) |
| 12 to 14 Years | 9 (11.3%) | 7 (4.5%) |
| 15 Years | 2 (10.0%) | 1 (1.1%) |
| 16 and 17 Years | 127 (49.2%) | 25 (18.7%) |
| 18 to 24 Years | 10 (2.4%) | 106 (27.9%) |
| 25 to 34 Years | 88 (11.3%) | 198 (24.7%) |
| 35 to 44 Years | 89 (12.6%) | 210 (25.3%) |
| 45 to 54 Years | 94 (13.0%) | 74 (11.0%) |
| 55 to 64 Years | 263 (31.0%) | 171 (18.2%) |
| 65 to 74 Years | 69 (9.6%) | 134 (16.5%) |
| 75 Years and over | 32 (7.7%) | 83 (16.0%) |
| Total | 1,202 (20.4%) | 1,308 (20.7%) |
Income Above Poverty by Sex and Age in Yalobusha County
According to the poverty statistics in Yalobusha County, males aged 18 to 24 years and females aged 15 years are the age groups that are most secure financially, with 97.6% of males and 98.9% of females in these age groups living above the poverty line.
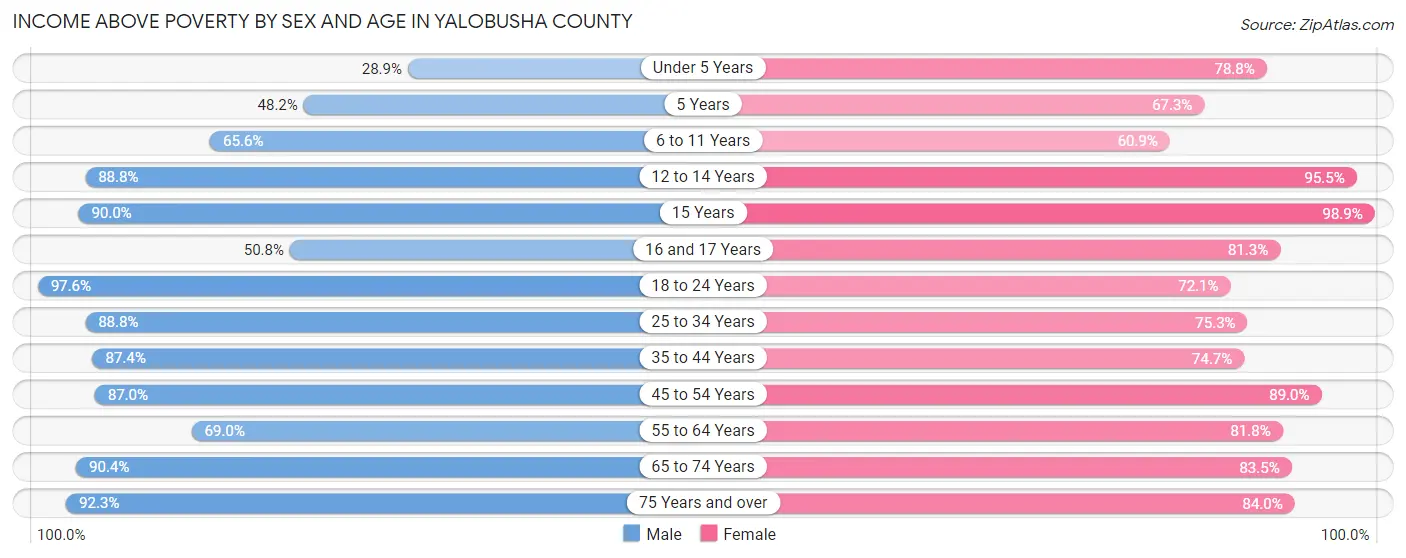
| Age Bracket | Male | Female |
| Under 5 Years | 69 (28.9%) | 365 (78.8%) |
| 5 Years | 27 (48.2%) | 76 (67.3%) |
| 6 to 11 Years | 419 (65.6%) | 255 (60.9%) |
| 12 to 14 Years | 71 (88.7%) | 150 (95.5%) |
| 15 Years | 18 (90.0%) | 89 (98.9%) |
| 16 and 17 Years | 131 (50.8%) | 109 (81.3%) |
| 18 to 24 Years | 400 (97.6%) | 274 (72.1%) |
| 25 to 34 Years | 694 (88.7%) | 603 (75.3%) |
| 35 to 44 Years | 616 (87.4%) | 619 (74.7%) |
| 45 to 54 Years | 627 (87.0%) | 598 (89.0%) |
| 55 to 64 Years | 586 (69.0%) | 768 (81.8%) |
| 65 to 74 Years | 652 (90.4%) | 676 (83.5%) |
| 75 Years and over | 384 (92.3%) | 437 (84.0%) |
| Total | 4,694 (79.6%) | 5,019 (79.3%) |
Income Below Poverty Among Married-Couple Families in Yalobusha County
The poverty statistics for married-couple families in Yalobusha County show that 4.2% or 91 of the total 2,167 families live below the poverty line. Families with 1 or 2 children have the highest poverty rate of 5.5%, comprising of 26 families. On the other hand, families with 3 or 4 children have the lowest poverty rate of 0.0%, which includes 0 families.
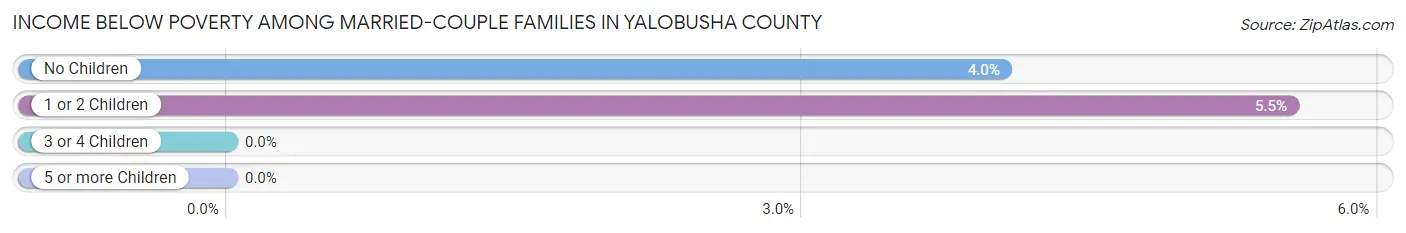
| Children | Above Poverty | Below Poverty |
| No Children | 1,543 (96.0%) | 65 (4.0%) |
| 1 or 2 Children | 443 (94.5%) | 26 (5.5%) |
| 3 or 4 Children | 90 (100.0%) | 0 (0.0%) |
| 5 or more Children | 0 (0.0%) | 0 (0.0%) |
| Total | 2,076 (95.8%) | 91 (4.2%) |
Income Below Poverty Among Single-Parent Households in Yalobusha County
According to the poverty data in Yalobusha County, 26.1% or 37 single-father households and 35.3% or 282 single-mother households are living below the poverty line. Among single-father households, those with 1 or 2 children have the highest poverty rate, with 30 households (60.0%) experiencing poverty. Likewise, among single-mother households, those with 5 or more children have the highest poverty rate, with 3 households (100.0%) falling below the poverty line.
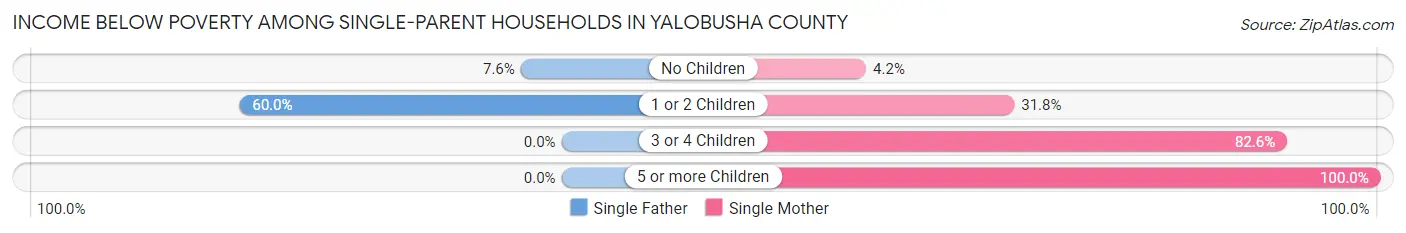
| Children | Single Father | Single Mother |
| No Children | 7 (7.6%) | 8 (4.2%) |
| 1 or 2 Children | 30 (60.0%) | 143 (31.8%) |
| 3 or 4 Children | 0 (0.0%) | 128 (82.6%) |
| 5 or more Children | 0 (0.0%) | 3 (100.0%) |
| Total | 37 (26.1%) | 282 (35.3%) |
Income Below Poverty Among Married-Couple vs Single-Parent Households in Yalobusha County
The poverty data for Yalobusha County shows that 91 of the married-couple family households (4.2%) and 319 of the single-parent households (33.9%) are living below the poverty level. Within the married-couple family households, those with 1 or 2 children have the highest poverty rate, with 26 households (5.5%) falling below the poverty line. Among the single-parent households, those with 5 or more children have the highest poverty rate, with 3 household (100.0%) living below poverty.
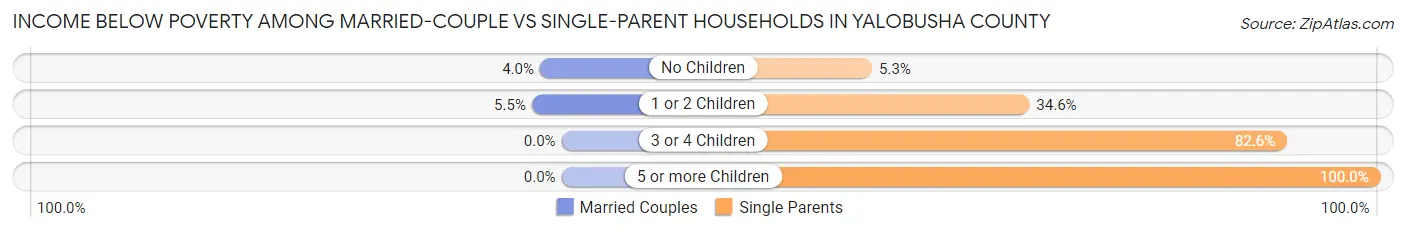
| Children | Married-Couple Families | Single-Parent Households |
| No Children | 65 (4.0%) | 15 (5.3%) |
| 1 or 2 Children | 26 (5.5%) | 173 (34.6%) |
| 3 or 4 Children | 0 (0.0%) | 128 (82.6%) |
| 5 or more Children | 0 (0.0%) | 3 (100.0%) |
| Total | 91 (4.2%) | 319 (33.9%) |
Race in Yalobusha County
The most populous races in Yalobusha County are White / Caucasian (7,517 | 60.1%), Black / African American (4,799 | 38.4%), and Hispanic or Latino (330 | 2.6%).
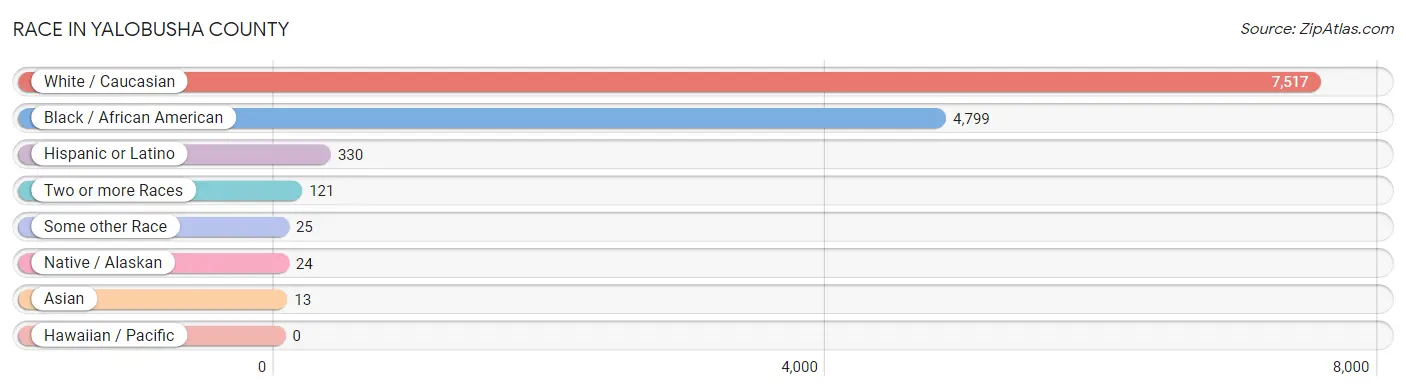
| Race | # Population | % Population |
| Asian | 13 | 0.1% |
| Black / African American | 4,799 | 38.4% |
| Hawaiian / Pacific | 0 | 0.0% |
| Hispanic or Latino | 330 | 2.6% |
| Native / Alaskan | 24 | 0.2% |
| White / Caucasian | 7,517 | 60.1% |
| Two or more Races | 121 | 1.0% |
| Some other Race | 25 | 0.2% |
| Total | 12,499 | 100.0% |
Ancestry in Yalobusha County
The most populous ancestries reported in Yalobusha County are Irish (1,087 | 8.7%), German (905 | 7.2%), American (899 | 7.2%), English (476 | 3.8%), and Mexican (255 | 2.0%), together accounting for 29.0% of all Yalobusha County residents.
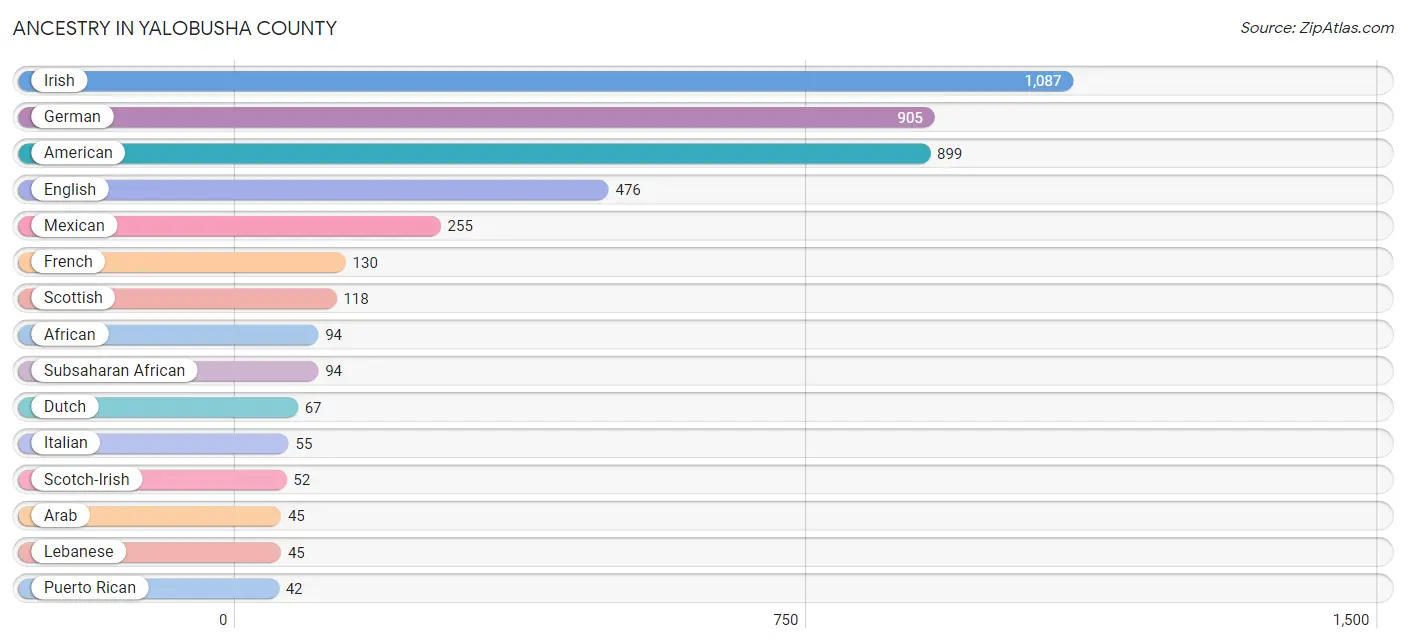
| Ancestry | # Population | % Population |
| African | 94 | 0.7% |
| American | 899 | 7.2% |
| Apache | 3 | 0.0% |
| Arab | 45 | 0.4% |
| British | 15 | 0.1% |
| Cherokee | 19 | 0.2% |
| Choctaw | 4 | 0.0% |
| Dutch | 67 | 0.5% |
| Eastern European | 7 | 0.1% |
| English | 476 | 3.8% |
| European | 24 | 0.2% |
| French | 130 | 1.0% |
| French Canadian | 13 | 0.1% |
| German | 905 | 7.2% |
| Irish | 1,087 | 8.7% |
| Italian | 55 | 0.4% |
| Lebanese | 45 | 0.4% |
| Mexican | 255 | 2.0% |
| Northern European | 15 | 0.1% |
| Norwegian | 6 | 0.1% |
| Potawatomi | 3 | 0.0% |
| Puerto Rican | 42 | 0.3% |
| Scotch-Irish | 52 | 0.4% |
| Scottish | 118 | 0.9% |
| Spanish | 32 | 0.3% |
| Sri Lankan | 13 | 0.1% |
| Subsaharan African | 94 | 0.7% |
| Swedish | 6 | 0.1% |
| Welsh | 15 | 0.1% | View All 29 Rows |
Immigrants in Yalobusha County
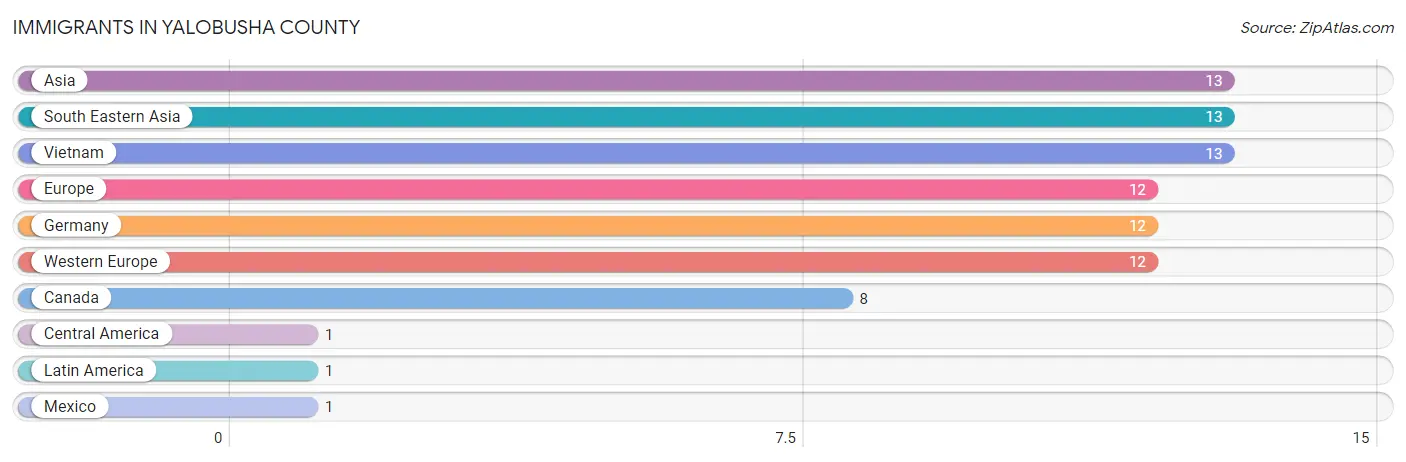
The most numerous immigrant groups reported in Yalobusha County came from Asia (13 | 0.1%), South Eastern Asia (13 | 0.1%), Vietnam (13 | 0.1%), Europe (12 | 0.1%), and Germany (12 | 0.1%), together accounting for 0.5% of all Yalobusha County residents.
| Immigration Origin | # Population | % Population |
| Asia | 13 | 0.1% |
| Canada | 8 | 0.1% |
| Central America | 1 | 0.0% |
| Europe | 12 | 0.1% |
| Germany | 12 | 0.1% |
| Latin America | 1 | 0.0% |
| Mexico | 1 | 0.0% |
| South Eastern Asia | 13 | 0.1% |
| Vietnam | 13 | 0.1% |
| Western Europe | 12 | 0.1% | View All 10 Rows |
Sex and Age in Yalobusha County
Sex and Age in Yalobusha County
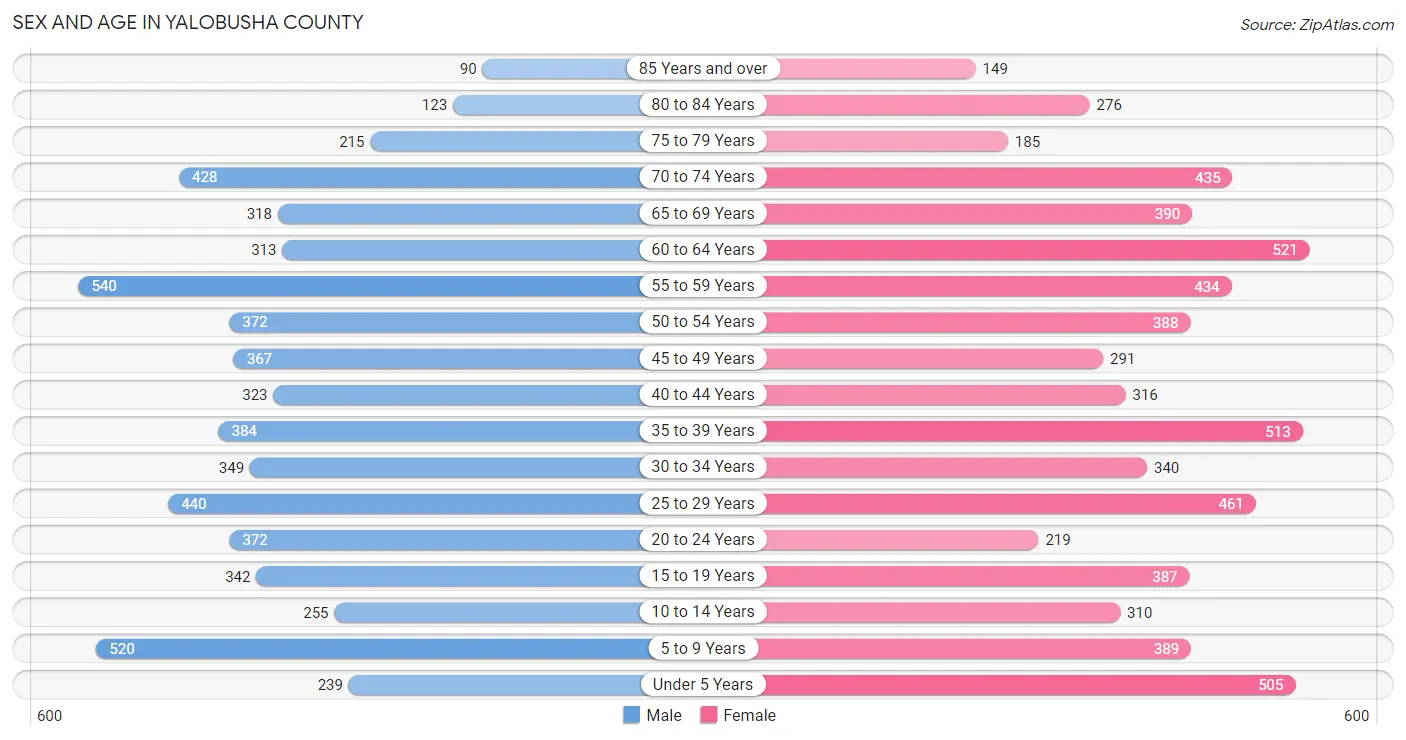
The most populous age groups in Yalobusha County are 55 to 59 Years (540 | 9.0%) for men and 60 to 64 Years (521 | 8.0%) for women.
| Age Bracket | Male | Female |
| Under 5 Years | 239 (4.0%) | 505 (7.8%) |
| 5 to 9 Years | 520 (8.7%) | 389 (6.0%) |
| 10 to 14 Years | 255 (4.3%) | 310 (4.8%) |
| 15 to 19 Years | 342 (5.7%) | 387 (5.9%) |
| 20 to 24 Years | 372 (6.2%) | 219 (3.4%) |
| 25 to 29 Years | 440 (7.3%) | 461 (7.1%) |
| 30 to 34 Years | 349 (5.8%) | 340 (5.2%) |
| 35 to 39 Years | 384 (6.4%) | 513 (7.9%) |
| 40 to 44 Years | 323 (5.4%) | 316 (4.9%) |
| 45 to 49 Years | 367 (6.1%) | 291 (4.5%) |
| 50 to 54 Years | 372 (6.2%) | 388 (6.0%) |
| 55 to 59 Years | 540 (9.0%) | 434 (6.7%) |
| 60 to 64 Years | 313 (5.2%) | 521 (8.0%) |
| 65 to 69 Years | 318 (5.3%) | 390 (6.0%) |
| 70 to 74 Years | 428 (7.1%) | 435 (6.7%) |
| 75 to 79 Years | 215 (3.6%) | 185 (2.8%) |
| 80 to 84 Years | 123 (2.1%) | 276 (4.2%) |
| 85 Years and over | 90 (1.5%) | 149 (2.3%) |
| Total | 5,990 (100.0%) | 6,509 (100.0%) |
Families and Households in Yalobusha County
Median Family Size in Yalobusha County
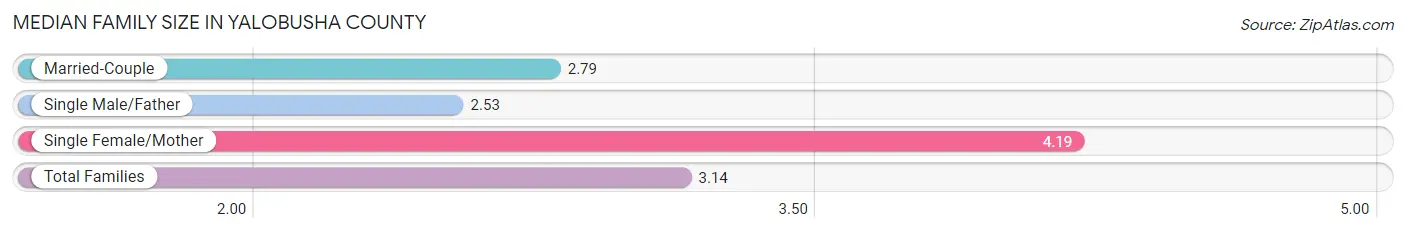
The median family size in Yalobusha County is 3.14 persons per family, with single female/mother families (799 | 25.7%) accounting for the largest median family size of 4.19 persons per family. On the other hand, single male/father families (142 | 4.6%) represent the smallest median family size with 2.53 persons per family.
| Family Type | # Families | Family Size |
| Married-Couple | 2,167 (69.7%) | 2.79 |
| Single Male/Father | 142 (4.6%) | 2.53 |
| Single Female/Mother | 799 (25.7%) | 4.19 |
| Total Families | 3,108 (100.0%) | 3.14 |
Median Household Size in Yalobusha County
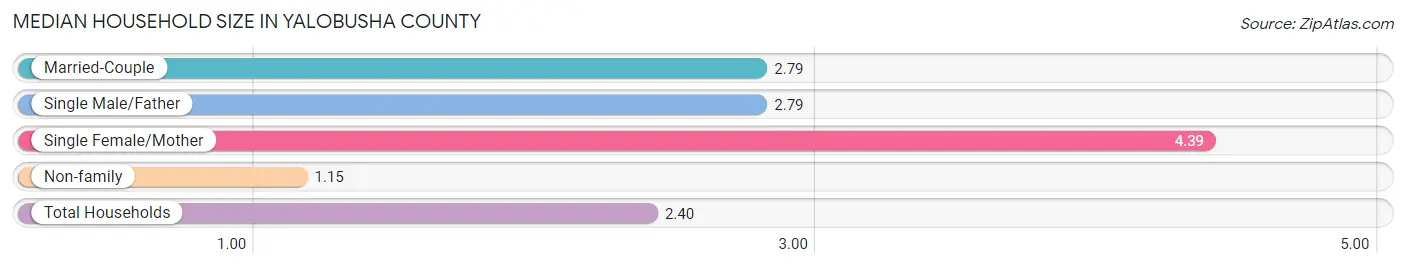
The median household size in Yalobusha County is 2.40 persons per household, with single female/mother households (799 | 15.7%) accounting for the largest median household size of 4.39 persons per household. non-family households (1,998 | 39.1%) represent the smallest median household size with 1.15 persons per household.
| Household Type | # Households | Household Size |
| Married-Couple | 2,167 (42.4%) | 2.79 |
| Single Male/Father | 142 (2.8%) | 2.79 |
| Single Female/Mother | 799 (15.7%) | 4.39 |
| Non-family | 1,998 (39.1%) | 1.15 |
| Total Households | 5,106 (100.0%) | 2.40 |
Household Size by Marriage Status in Yalobusha County
Out of a total of 5,106 households in Yalobusha County, 3,108 (60.9%) are family households, while 1,998 (39.1%) are nonfamily households. The most numerous type of family households are 2-person households, comprising 1,780, and the most common type of nonfamily households are 1-person households, comprising 1,769.
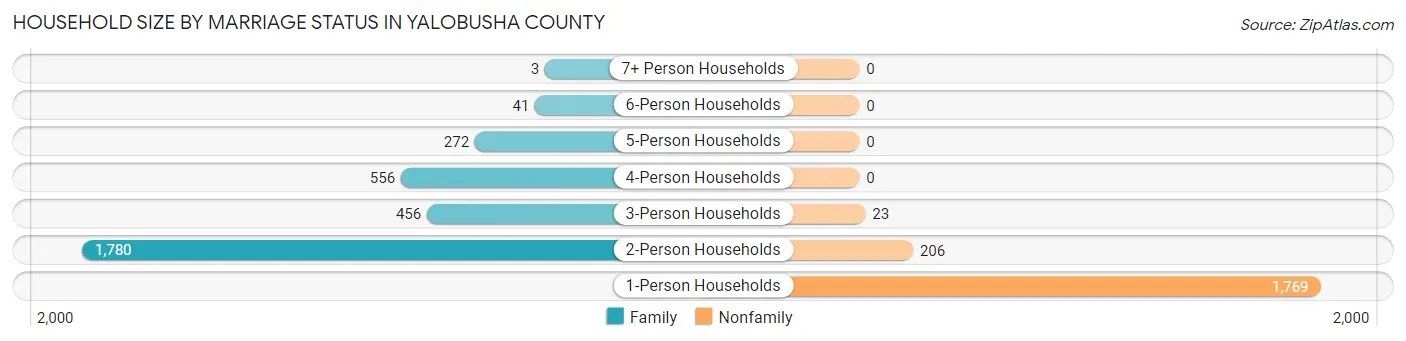
| Household Size | Family Households | Nonfamily Households |
| 1-Person Households | - | 1,769 (34.6%) |
| 2-Person Households | 1,780 (34.9%) | 206 (4.0%) |
| 3-Person Households | 456 (8.9%) | 23 (0.4%) |
| 4-Person Households | 556 (10.9%) | 0 (0.0%) |
| 5-Person Households | 272 (5.3%) | 0 (0.0%) |
| 6-Person Households | 41 (0.8%) | 0 (0.0%) |
| 7+ Person Households | 3 (0.1%) | 0 (0.0%) |
| Total | 3,108 (60.9%) | 1,998 (39.1%) |
Female Fertility in Yalobusha County
Fertility by Age in Yalobusha County
Average fertility rate in Yalobusha County is 37.0 births per 1,000 women. Women in the age bracket of 20 to 34 years have the highest fertility rate with 91.0 births per 1,000 women. Women in the age bracket of 20 to 34 years acount for 96.9% of all women with births.
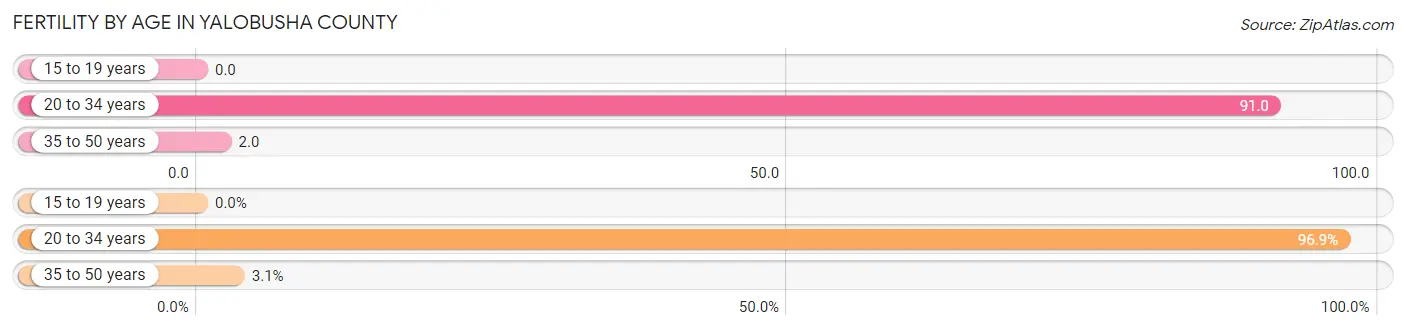
| Age Bracket | Women with Births | Births / 1,000 Women |
| 15 to 19 years | 0 (0.0%) | 0.0 |
| 20 to 34 years | 93 (96.9%) | 91.0 |
| 35 to 50 years | 3 (3.1%) | 2.0 |
| Total | 96 (100.0%) | 37.0 |
Fertility by Age by Marriage Status in Yalobusha County
96.9% of women with births (96) in Yalobusha County are married. The highest percentage of unmarried women with births falls into 35 to 50 years age bracket with 100.0% of them unmarried at the time of birth, while the lowest percentage of unmarried women with births belong to 20 to 34 years age bracket with 0.0% of them unmarried.
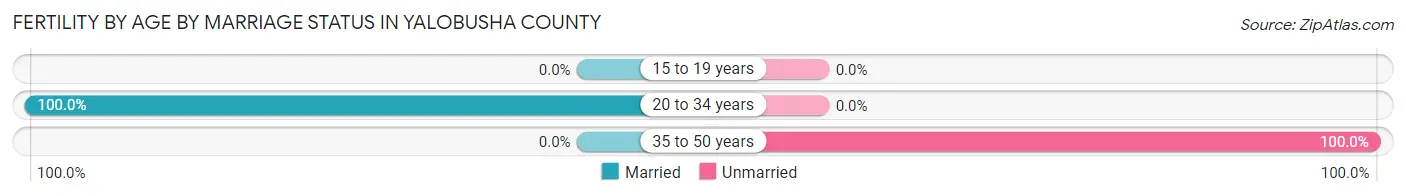
| Age Bracket | Married | Unmarried |
| 15 to 19 years | 0 (0.0%) | 0 (0.0%) |
| 20 to 34 years | 93 (100.0%) | 0 (0.0%) |
| 35 to 50 years | 0 (0.0%) | 3 (100.0%) |
| Total | 93 (96.9%) | 3 (3.1%) |
Fertility by Education in Yalobusha County
Average fertility rate in Yalobusha County is 37.0 births per 1,000 women. Women with the education attainment of high school diploma have the highest fertility rate of 57.0 births per 1,000 women, while women with the education attainment of less than high school have the lowest fertility at 6.0 births per 1,000 women. Women with the education attainment of high school diploma represent 56.2% of all women with births.
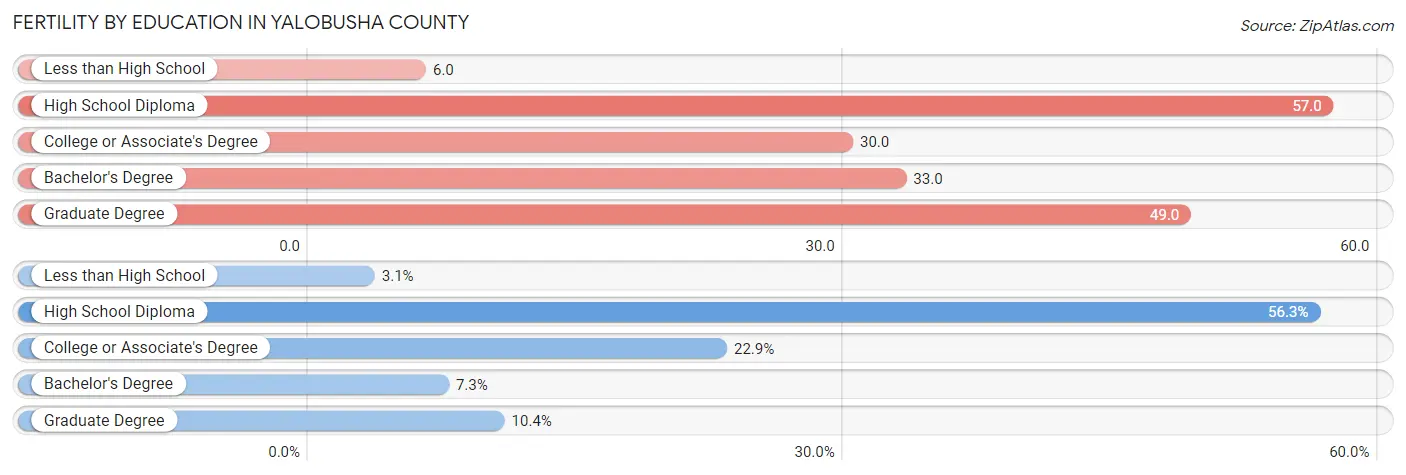
| Educational Attainment | Women with Births | Births / 1,000 Women |
| Less than High School | 3 (3.1%) | 6.0 |
| High School Diploma | 54 (56.2%) | 57.0 |
| College or Associate's Degree | 22 (22.9%) | 30.0 |
| Bachelor's Degree | 7 (7.3%) | 33.0 |
| Graduate Degree | 10 (10.4%) | 49.0 |
| Total | 96 (100.0%) | 37.0 |
Fertility by Education by Marriage Status in Yalobusha County
3.1% of women with births in Yalobusha County are unmarried. Women with the educational attainment of high school diploma are most likely to be married with 100.0% of them married at childbirth, while women with the educational attainment of less than high school are least likely to be married with 100.0% of them unmarried at childbirth.
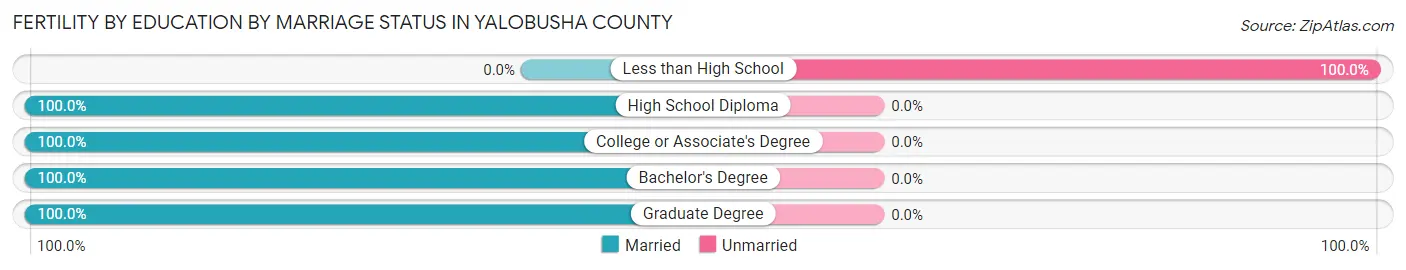
| Educational Attainment | Married | Unmarried |
| Less than High School | 0 (0.0%) | 3 (100.0%) |
| High School Diploma | 54 (100.0%) | 0 (0.0%) |
| College or Associate's Degree | 22 (100.0%) | 0 (0.0%) |
| Bachelor's Degree | 7 (100.0%) | 0 (0.0%) |
| Graduate Degree | 10 (100.0%) | 0 (0.0%) |
| Total | 93 (96.9%) | 3 (3.1%) |
Employment Characteristics in Yalobusha County
Employment by Class of Employer in Yalobusha County
Among the 4,991 employed individuals in Yalobusha County, private company employees (3,330 | 66.7%), state government employees (538 | 10.8%), and self-employed (not incorporated) (434 | 8.7%) make up the most common classes of employment.
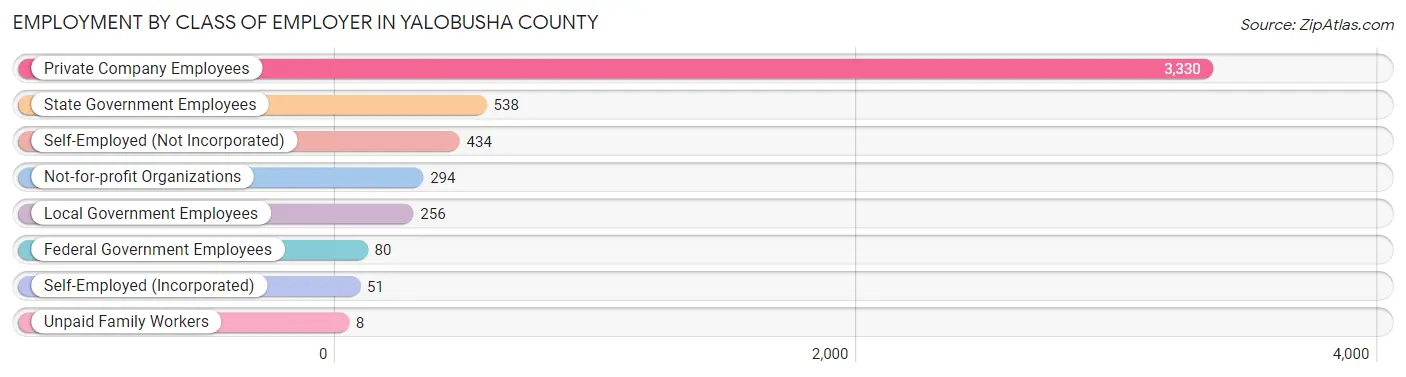
| Employer Class | # Employees | % Employees |
| Private Company Employees | 3,330 | 66.7% |
| Self-Employed (Incorporated) | 51 | 1.0% |
| Self-Employed (Not Incorporated) | 434 | 8.7% |
| Not-for-profit Organizations | 294 | 5.9% |
| Local Government Employees | 256 | 5.1% |
| State Government Employees | 538 | 10.8% |
| Federal Government Employees | 80 | 1.6% |
| Unpaid Family Workers | 8 | 0.2% |
| Total | 4,991 | 100.0% |
Employment Status by Age in Yalobusha County
According to the labor force statistics for Yalobusha County, out of the total population over 16 years of age (10,171), 52.2% or 5,309 individuals are in the labor force, with 5.0% or 265 of them unemployed. The age group with the highest labor force participation rate is 25 to 29 years, with 77.4% or 697 individuals in the labor force. Within the labor force, the 20 to 24 years age range has the highest percentage of unemployed individuals, with 12.3% or 53 of them being unemployed.
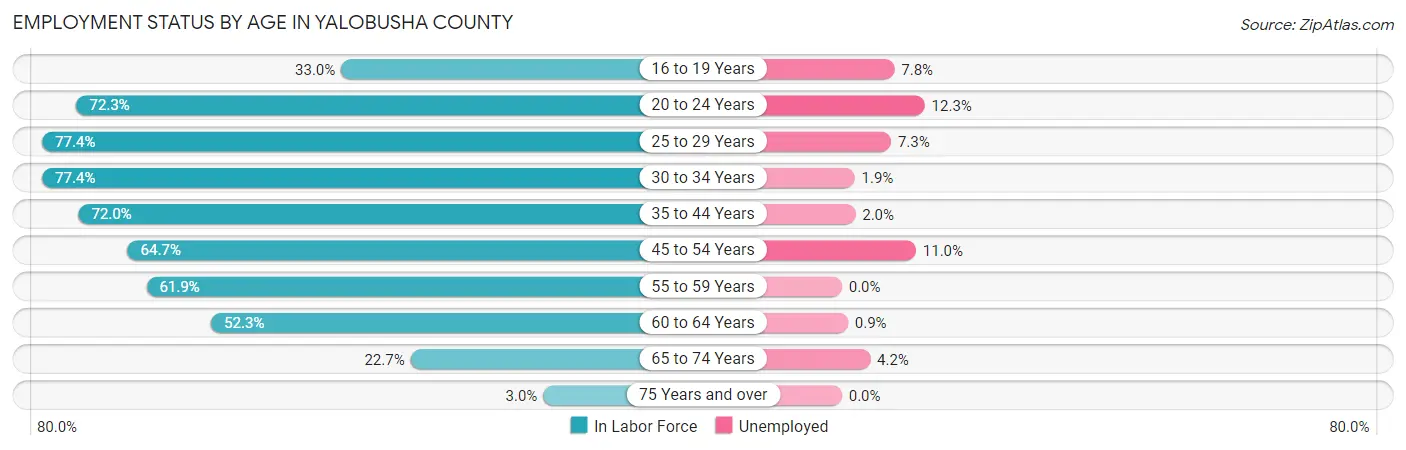
| Age Bracket | In Labor Force | Unemployed |
| 16 to 19 Years | 204 (33.0%) | 16 (7.8%) |
| 20 to 24 Years | 427 (72.3%) | 53 (12.3%) |
| 25 to 29 Years | 697 (77.4%) | 51 (7.3%) |
| 30 to 34 Years | 533 (77.4%) | 10 (1.9%) |
| 35 to 44 Years | 1,106 (72.0%) | 22 (2.0%) |
| 45 to 54 Years | 917 (64.7%) | 101 (11.0%) |
| 55 to 59 Years | 603 (61.9%) | 0 (0.0%) |
| 60 to 64 Years | 436 (52.3%) | 4 (0.9%) |
| 65 to 74 Years | 357 (22.7%) | 15 (4.2%) |
| 75 Years and over | 31 (3.0%) | 0 (0.0%) |
| Total | 5,309 (52.2%) | 265 (5.0%) |
Employment Status by Educational Attainment in Yalobusha County
According to labor force statistics for Yalobusha County, 67.6% of individuals (4,294) out of the total population between 25 and 64 years of age (6,352) are in the labor force, with 4.4% or 189 of them being unemployed. The group with the highest labor force participation rate are those with the educational attainment of bachelor's degree or higher, with 89.3% or 693 individuals in the labor force. Within the labor force, individuals with less than high school education have the highest percentage of unemployment, with 9.4% or 23 of them being unemployed.
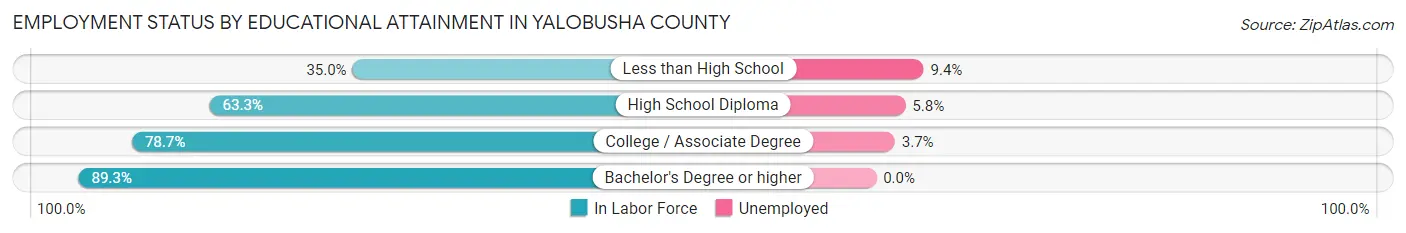
| Educational Attainment | In Labor Force | Unemployed |
| Less than High School | 244 (35.0%) | 66 (9.4%) |
| High School Diploma | 1,990 (63.3%) | 182 (5.8%) |
| College / Associate Degree | 1,365 (78.7%) | 64 (3.7%) |
| Bachelor's Degree or higher | 693 (89.3%) | 0 (0.0%) |
| Total | 4,294 (67.6%) | 279 (4.4%) |
Employment Occupations by Sex in Yalobusha County
Management, Business, Science and Arts Occupations
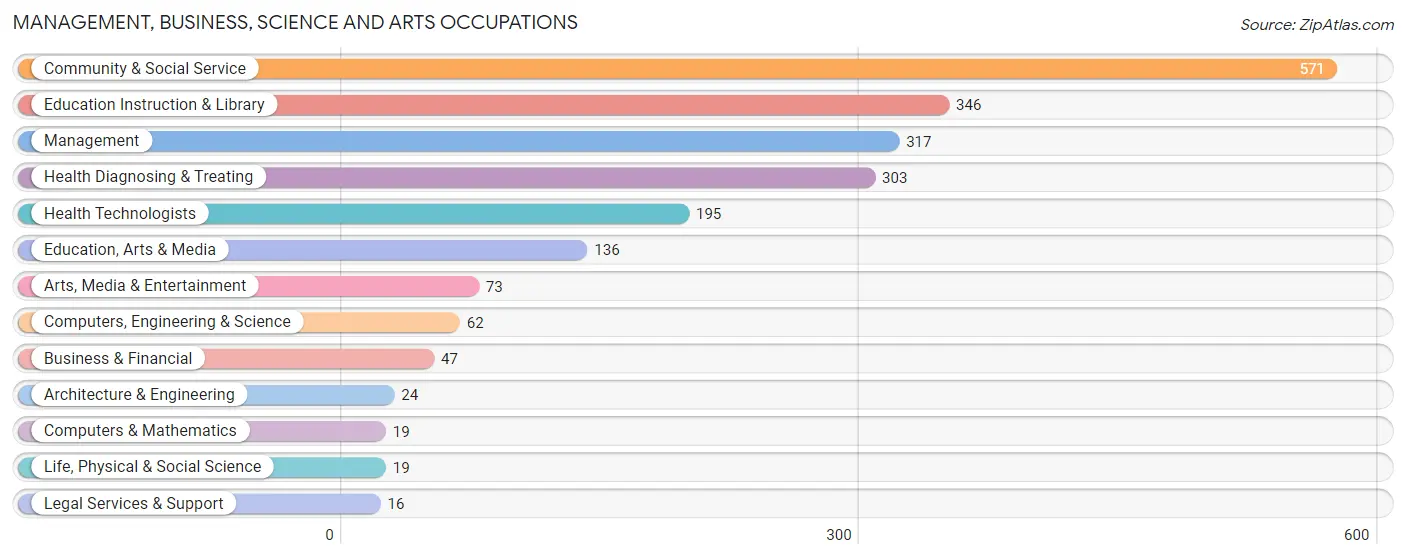
The most common Management, Business, Science and Arts occupations in Yalobusha County are Community & Social Service (571 | 11.4%), Education Instruction & Library (346 | 6.9%), Management (317 | 6.4%), Health Diagnosing & Treating (303 | 6.1%), and Health Technologists (195 | 3.9%).
Management, Business, Science and Arts Occupations by Sex
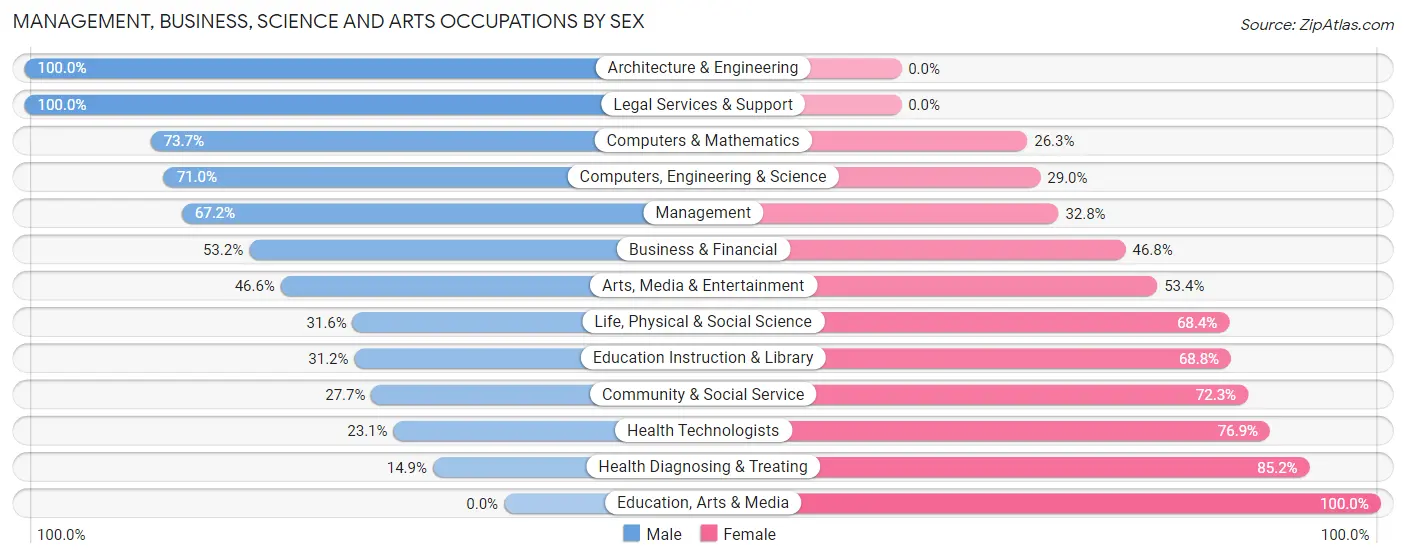
Within the Management, Business, Science and Arts occupations in Yalobusha County, the most male-oriented occupations are Architecture & Engineering (100.0%), Legal Services & Support (100.0%), and Computers & Mathematics (73.7%), while the most female-oriented occupations are Education, Arts & Media (100.0%), Health Diagnosing & Treating (85.2%), and Health Technologists (76.9%).
| Occupation | Male | Female |
| Management | 213 (67.2%) | 104 (32.8%) |
| Business & Financial | 25 (53.2%) | 22 (46.8%) |
| Computers, Engineering & Science | 44 (71.0%) | 18 (29.0%) |
| Computers & Mathematics | 14 (73.7%) | 5 (26.3%) |
| Architecture & Engineering | 24 (100.0%) | 0 (0.0%) |
| Life, Physical & Social Science | 6 (31.6%) | 13 (68.4%) |
| Community & Social Service | 158 (27.7%) | 413 (72.3%) |
| Education, Arts & Media | 0 (0.0%) | 136 (100.0%) |
| Legal Services & Support | 16 (100.0%) | 0 (0.0%) |
| Education Instruction & Library | 108 (31.2%) | 238 (68.8%) |
| Arts, Media & Entertainment | 34 (46.6%) | 39 (53.4%) |
| Health Diagnosing & Treating | 45 (14.8%) | 258 (85.2%) |
| Health Technologists | 45 (23.1%) | 150 (76.9%) |
| Total (Category) | 485 (37.3%) | 815 (62.7%) |
| Total (Overall) | 2,659 (53.3%) | 2,333 (46.7%) |
Services Occupations
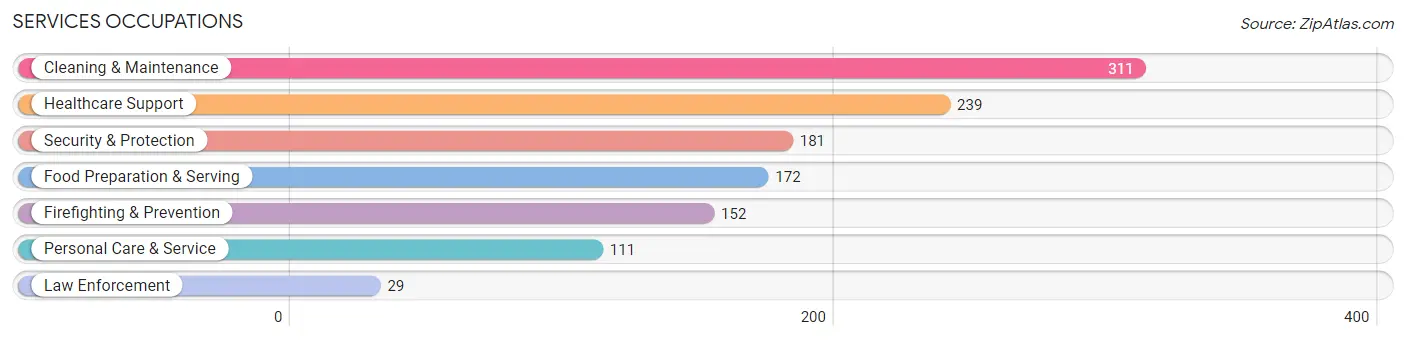
The most common Services occupations in Yalobusha County are Cleaning & Maintenance (311 | 6.2%), Healthcare Support (239 | 4.8%), Security & Protection (181 | 3.6%), Food Preparation & Serving (172 | 3.5%), and Firefighting & Prevention (152 | 3.0%).
Services Occupations by Sex
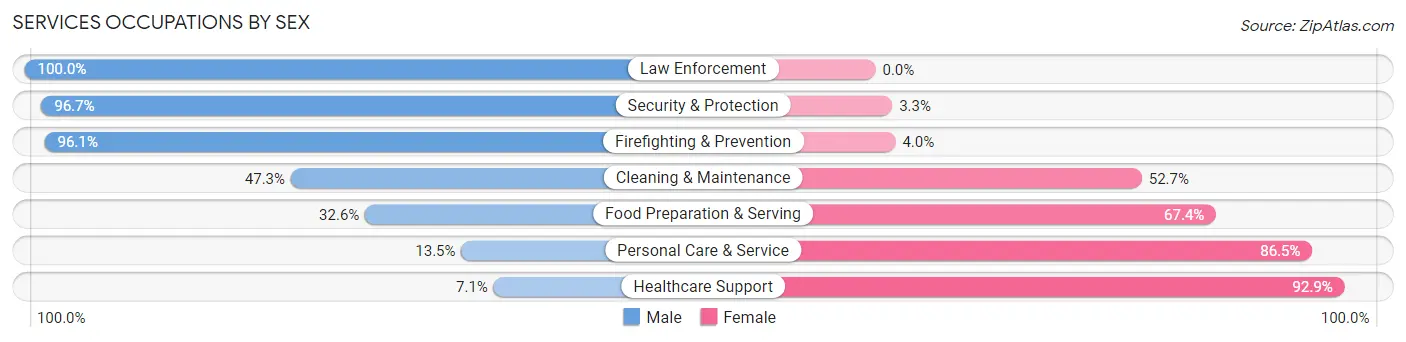
Within the Services occupations in Yalobusha County, the most male-oriented occupations are Law Enforcement (100.0%), Security & Protection (96.7%), and Firefighting & Prevention (96.1%), while the most female-oriented occupations are Healthcare Support (92.9%), Personal Care & Service (86.5%), and Food Preparation & Serving (67.4%).
| Occupation | Male | Female |
| Healthcare Support | 17 (7.1%) | 222 (92.9%) |
| Security & Protection | 175 (96.7%) | 6 (3.3%) |
| Firefighting & Prevention | 146 (96.1%) | 6 (4.0%) |
| Law Enforcement | 29 (100.0%) | 0 (0.0%) |
| Food Preparation & Serving | 56 (32.6%) | 116 (67.4%) |
| Cleaning & Maintenance | 147 (47.3%) | 164 (52.7%) |
| Personal Care & Service | 15 (13.5%) | 96 (86.5%) |
| Total (Category) | 410 (40.4%) | 604 (59.6%) |
| Total (Overall) | 2,659 (53.3%) | 2,333 (46.7%) |
Sales and Office Occupations
The most common Sales and Office occupations in Yalobusha County are Office & Administration (616 | 12.3%), and Sales & Related (245 | 4.9%).
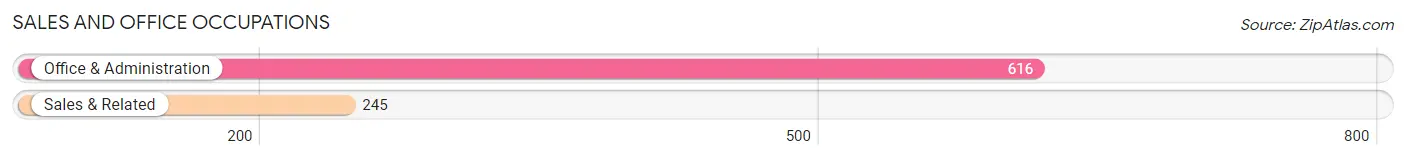
Sales and Office Occupations by Sex
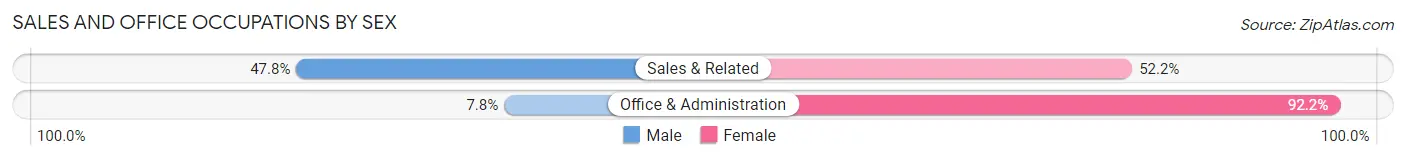
| Occupation | Male | Female |
| Sales & Related | 117 (47.8%) | 128 (52.2%) |
| Office & Administration | 48 (7.8%) | 568 (92.2%) |
| Total (Category) | 165 (19.2%) | 696 (80.8%) |
| Total (Overall) | 2,659 (53.3%) | 2,333 (46.7%) |
Natural Resources, Construction and Maintenance Occupations
The most common Natural Resources, Construction and Maintenance occupations in Yalobusha County are Construction & Extraction (448 | 9.0%), Installation, Maintenance & Repair (195 | 3.9%), and Farming, Fishing & Forestry (1 | 0.0%).
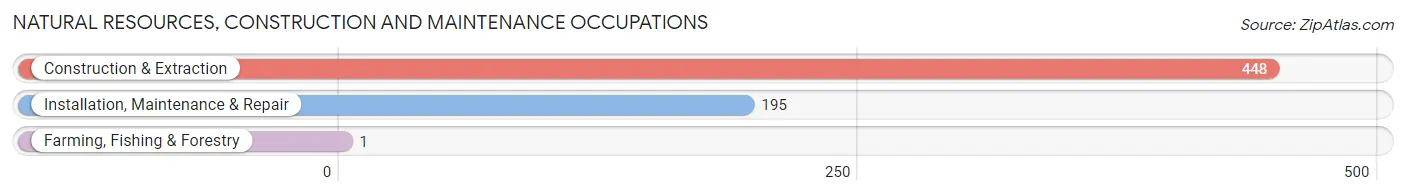
Natural Resources, Construction and Maintenance Occupations by Sex
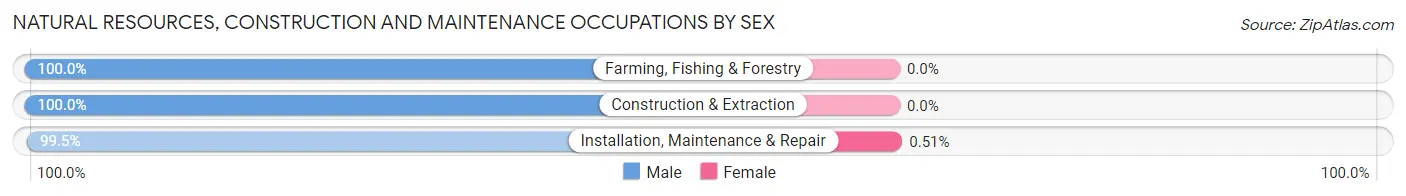
| Occupation | Male | Female |
| Farming, Fishing & Forestry | 1 (100.0%) | 0 (0.0%) |
| Construction & Extraction | 448 (100.0%) | 0 (0.0%) |
| Installation, Maintenance & Repair | 194 (99.5%) | 1 (0.5%) |
| Total (Category) | 643 (99.8%) | 1 (0.2%) |
| Total (Overall) | 2,659 (53.3%) | 2,333 (46.7%) |
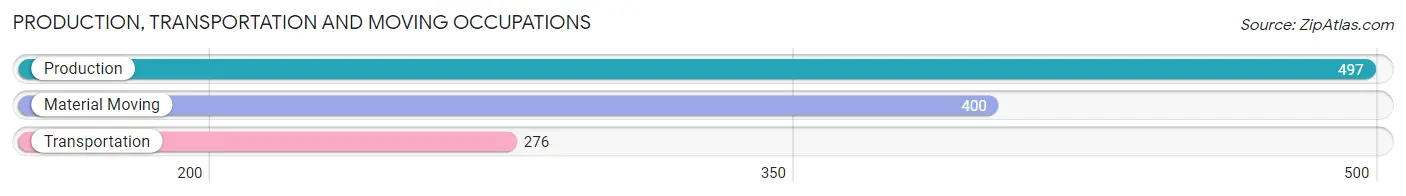
Production, Transportation and Moving Occupations
The most common Production, Transportation and Moving occupations in Yalobusha County are Production (497 | 10.0%), Material Moving (400 | 8.0%), and Transportation (276 | 5.5%).
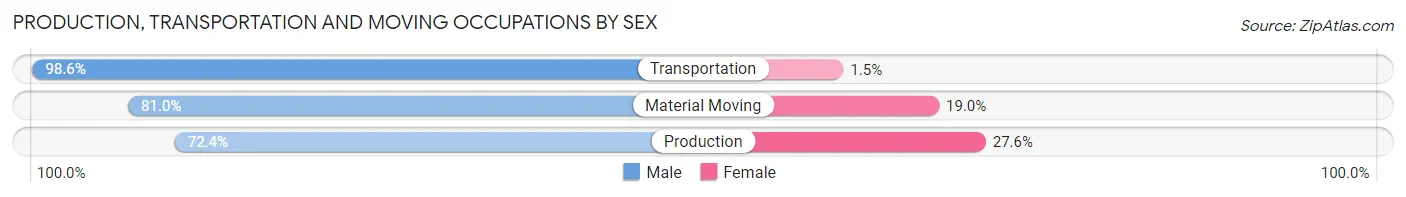
Production, Transportation and Moving Occupations by Sex
| Occupation | Male | Female |
| Production | 360 (72.4%) | 137 (27.6%) |
| Transportation | 272 (98.6%) | 4 (1.5%) |
| Material Moving | 324 (81.0%) | 76 (19.0%) |
| Total (Category) | 956 (81.5%) | 217 (18.5%) |
| Total (Overall) | 2,659 (53.3%) | 2,333 (46.7%) |
Employment Industries by Sex in Yalobusha County
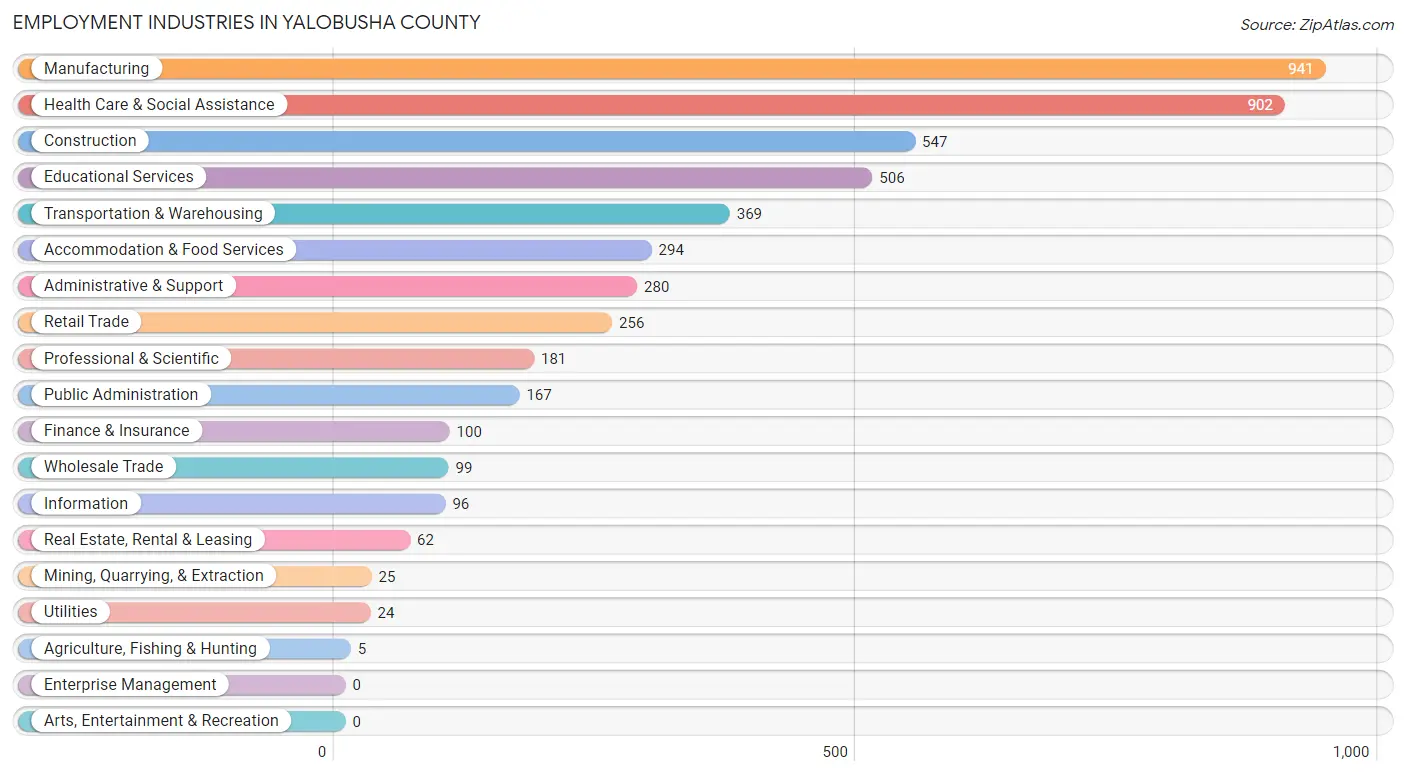
Employment Industries in Yalobusha County
The major employment industries in Yalobusha County include Manufacturing (941 | 18.9%), Health Care & Social Assistance (902 | 18.1%), Construction (547 | 11.0%), Educational Services (506 | 10.1%), and Transportation & Warehousing (369 | 7.4%).
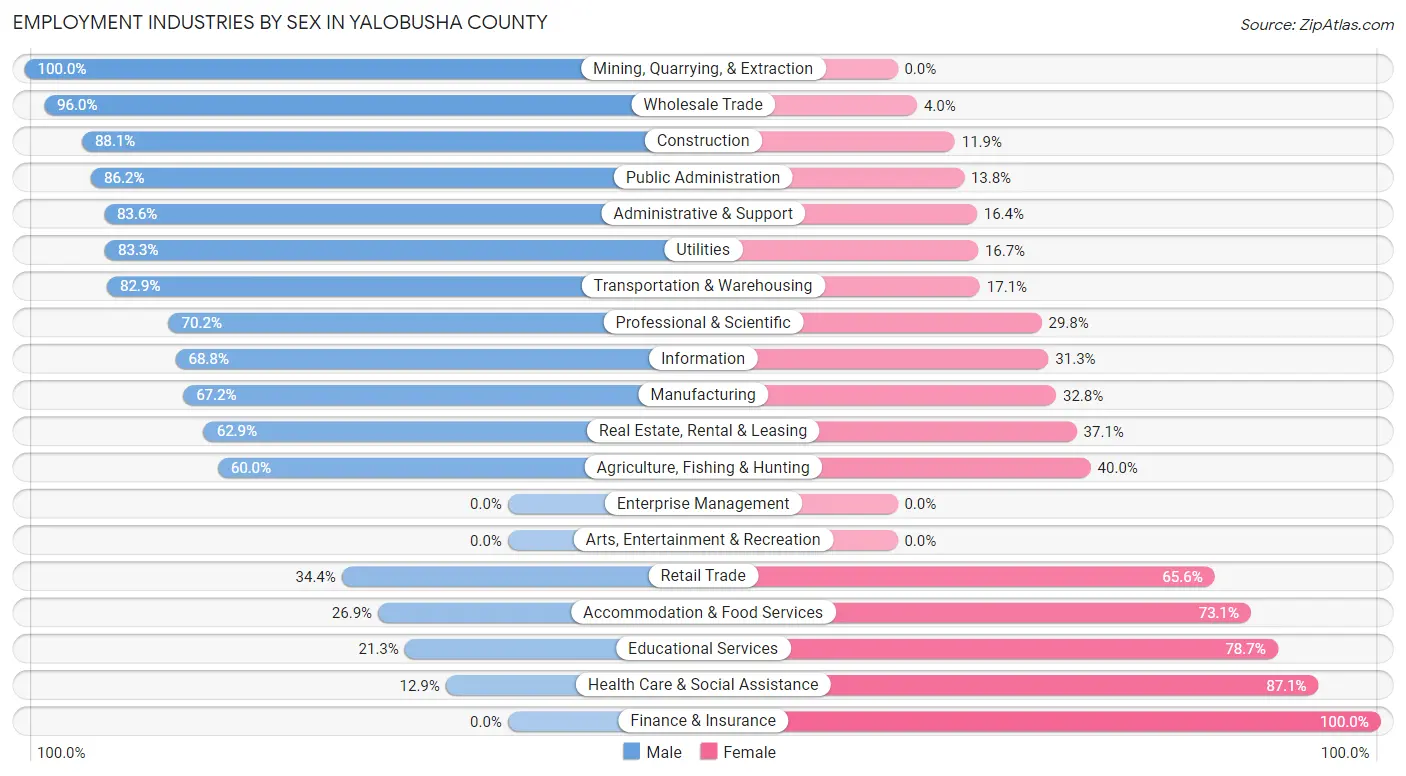
Employment Industries by Sex in Yalobusha County
The Yalobusha County industries that see more men than women are Mining, Quarrying, & Extraction (100.0%), Wholesale Trade (96.0%), and Construction (88.1%), whereas the industries that tend to have a higher number of women are Finance & Insurance (100.0%), Health Care & Social Assistance (87.1%), and Educational Services (78.7%).
| Industry | Male | Female |
| Agriculture, Fishing & Hunting | 3 (60.0%) | 2 (40.0%) |
| Mining, Quarrying, & Extraction | 25 (100.0%) | 0 (0.0%) |
| Construction | 482 (88.1%) | 65 (11.9%) |
| Manufacturing | 632 (67.2%) | 309 (32.8%) |
| Wholesale Trade | 95 (96.0%) | 4 (4.0%) |
| Retail Trade | 88 (34.4%) | 168 (65.6%) |
| Transportation & Warehousing | 306 (82.9%) | 63 (17.1%) |
| Utilities | 20 (83.3%) | 4 (16.7%) |
| Information | 66 (68.8%) | 30 (31.2%) |
| Finance & Insurance | 0 (0.0%) | 100 (100.0%) |
| Real Estate, Rental & Leasing | 39 (62.9%) | 23 (37.1%) |
| Professional & Scientific | 127 (70.2%) | 54 (29.8%) |
| Enterprise Management | 0 (0.0%) | 0 (0.0%) |
| Administrative & Support | 234 (83.6%) | 46 (16.4%) |
| Educational Services | 108 (21.3%) | 398 (78.7%) |
| Health Care & Social Assistance | 116 (12.9%) | 786 (87.1%) |
| Arts, Entertainment & Recreation | 0 (0.0%) | 0 (0.0%) |
| Accommodation & Food Services | 79 (26.9%) | 215 (73.1%) |
| Public Administration | 144 (86.2%) | 23 (13.8%) |
| Total | 2,659 (53.3%) | 2,333 (46.7%) |
Education in Yalobusha County
School Enrollment in Yalobusha County
The most common levels of schooling among the 2,286 students in Yalobusha County are elementary school (760 | 33.3%), high school (495 | 21.6%), and middle school (373 | 16.3%).
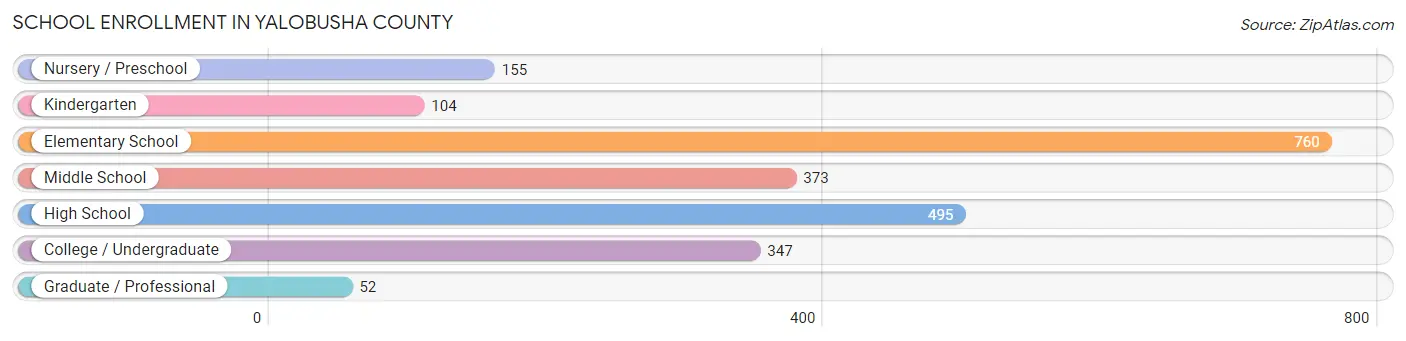
| School Level | # Students | % Students |
| Nursery / Preschool | 155 | 6.8% |
| Kindergarten | 104 | 4.5% |
| Elementary School | 760 | 33.3% |
| Middle School | 373 | 16.3% |
| High School | 495 | 21.6% |
| College / Undergraduate | 347 | 15.2% |
| Graduate / Professional | 52 | 2.3% |
| Total | 2,286 | 100.0% |
School Enrollment by Age by Funding Source in Yalobusha County
Out of a total of 2,286 students who are enrolled in schools in Yalobusha County, 87 (3.8%) attend a private institution, while the remaining 2,199 (96.2%) are enrolled in public schools. The age group of 10 to 14 year olds has the highest likelihood of being enrolled in private schools, with 48 (9.4% in the age bracket) enrolled. Conversely, the age group of 3 to 4 year olds has the lowest likelihood of being enrolled in a private school, with 80 (100.0% in the age bracket) attending a public institution.
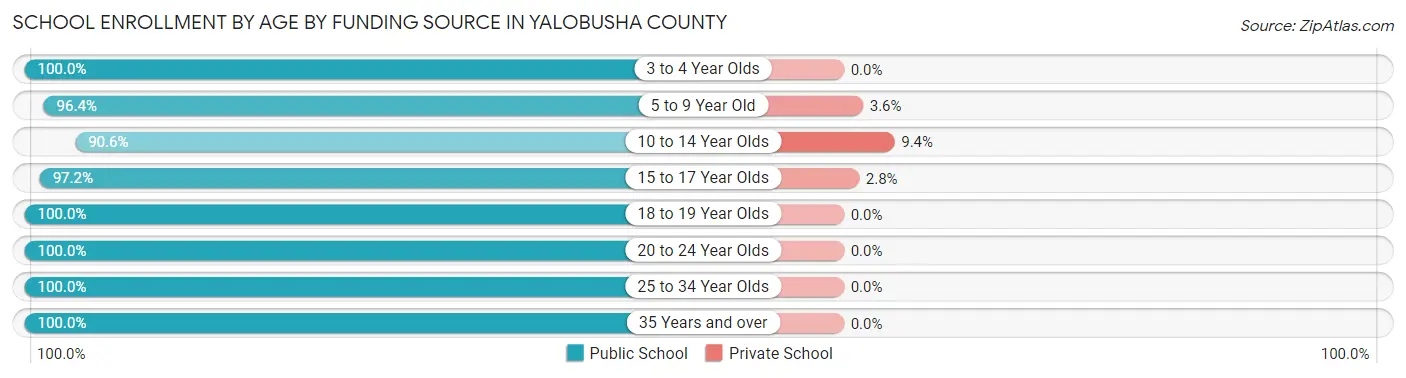
| Age Bracket | Public School | Private School |
| 3 to 4 Year Olds | 80 (100.0%) | 0 (0.0%) |
| 5 to 9 Year Old | 731 (96.4%) | 27 (3.6%) |
| 10 to 14 Year Olds | 461 (90.6%) | 48 (9.4%) |
| 15 to 17 Year Olds | 446 (97.2%) | 13 (2.8%) |
| 18 to 19 Year Olds | 135 (100.0%) | 0 (0.0%) |
| 20 to 24 Year Olds | 145 (100.0%) | 0 (0.0%) |
| 25 to 34 Year Olds | 114 (100.0%) | 0 (0.0%) |
| 35 Years and over | 86 (100.0%) | 0 (0.0%) |
| Total | 2,199 (96.2%) | 87 (3.8%) |
Educational Attainment by Field of Study in Yalobusha County
Education (322 | 28.6%), science & technology (169 | 15.0%), business (133 | 11.8%), arts & humanities (93 | 8.3%), and bio, nature & agricultural (80 | 7.1%) are the most common fields of study among 1,127 individuals in Yalobusha County who have obtained a bachelor's degree or higher.
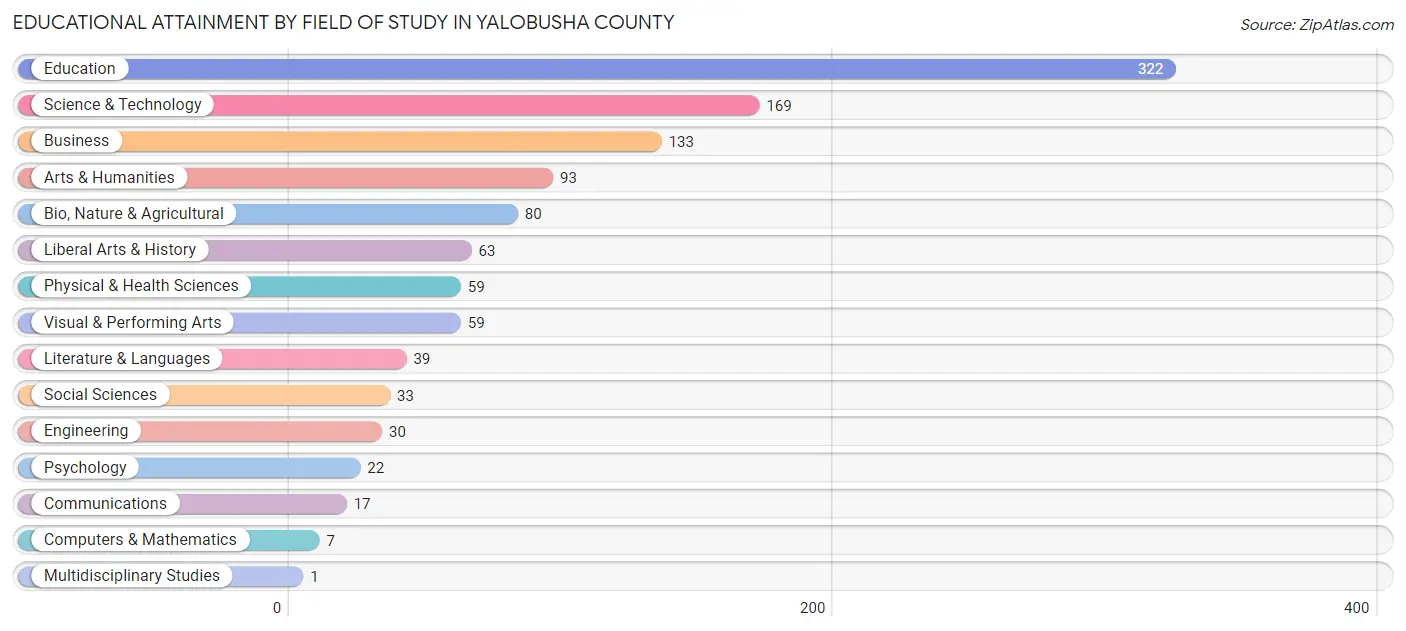
| Field of Study | # Graduates | % Graduates |
| Computers & Mathematics | 7 | 0.6% |
| Bio, Nature & Agricultural | 80 | 7.1% |
| Physical & Health Sciences | 59 | 5.2% |
| Psychology | 22 | 1.9% |
| Social Sciences | 33 | 2.9% |
| Engineering | 30 | 2.7% |
| Multidisciplinary Studies | 1 | 0.1% |
| Science & Technology | 169 | 15.0% |
| Business | 133 | 11.8% |
| Education | 322 | 28.6% |
| Literature & Languages | 39 | 3.5% |
| Liberal Arts & History | 63 | 5.6% |
| Visual & Performing Arts | 59 | 5.2% |
| Communications | 17 | 1.5% |
| Arts & Humanities | 93 | 8.3% |
| Total | 1,127 | 100.0% |
Transportation & Commute in Yalobusha County
Vehicle Availability by Sex in Yalobusha County
The most prevalent vehicle ownership categories in Yalobusha County are males with 2 vehicles (1,148, accounting for 43.6%) and females with 2 vehicles (915, making up 48.7%).
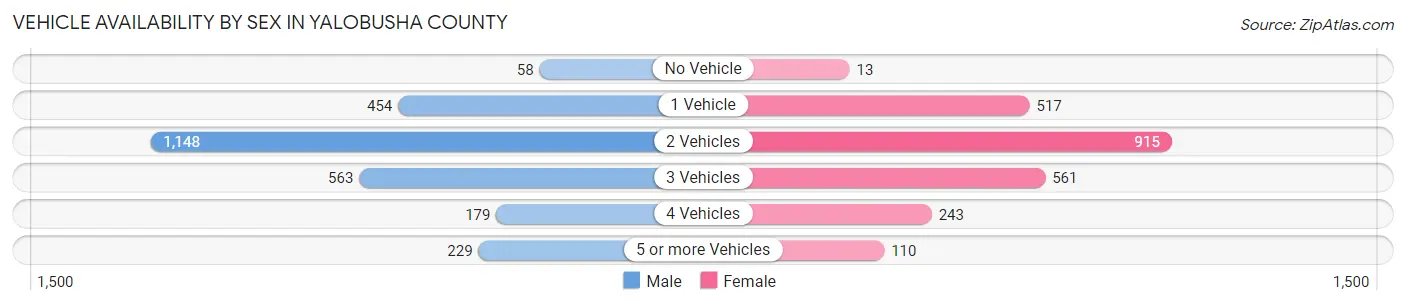
| Vehicles Available | Male | Female |
| No Vehicle | 58 (2.2%) | 13 (0.5%) |
| 1 Vehicle | 454 (17.3%) | 517 (21.9%) |
| 2 Vehicles | 1,148 (43.6%) | 915 (38.8%) |
| 3 Vehicles | 563 (21.4%) | 561 (23.8%) |
| 4 Vehicles | 179 (6.8%) | 243 (10.3%) |
| 5 or more Vehicles | 229 (8.7%) | 110 (4.7%) |
| Total | 2,631 (100.0%) | 2,359 (100.0%) |
Commute Time in Yalobusha County
The most frequently occuring commute durations in Yalobusha County are 30 to 34 minutes (1,163 commuters, 23.8%), 5 to 9 minutes (729 commuters, 14.9%), and 10 to 14 minutes (682 commuters, 13.9%).
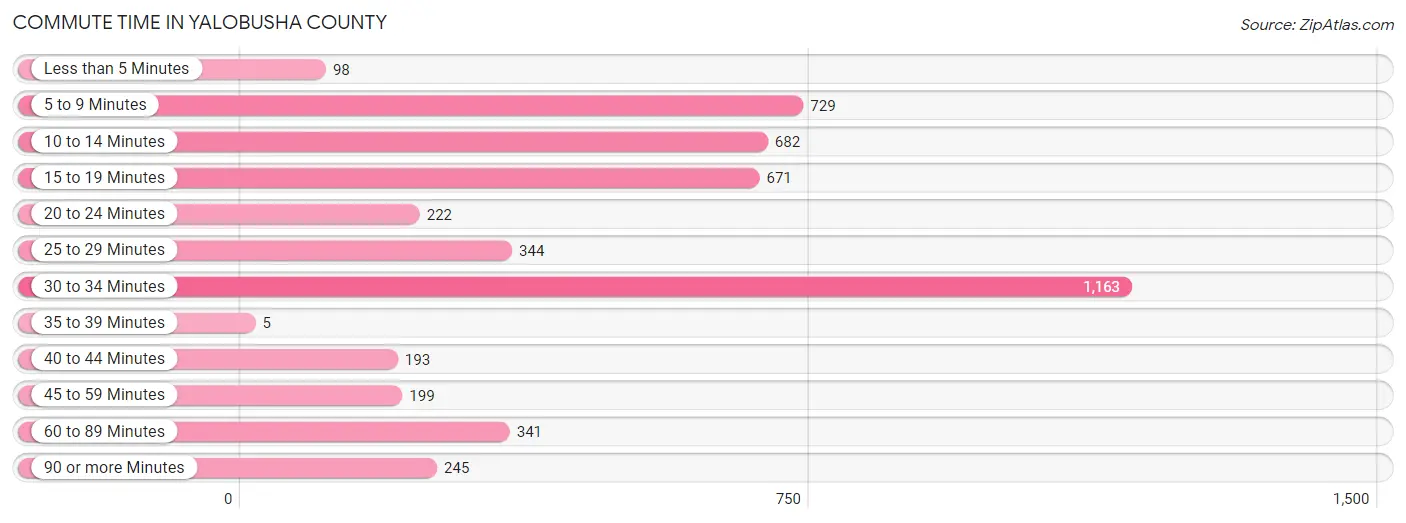
| Commute Time | # Commuters | % Commuters |
| Less than 5 Minutes | 98 | 2.0% |
| 5 to 9 Minutes | 729 | 14.9% |
| 10 to 14 Minutes | 682 | 13.9% |
| 15 to 19 Minutes | 671 | 13.7% |
| 20 to 24 Minutes | 222 | 4.5% |
| 25 to 29 Minutes | 344 | 7.0% |
| 30 to 34 Minutes | 1,163 | 23.8% |
| 35 to 39 Minutes | 5 | 0.1% |
| 40 to 44 Minutes | 193 | 4.0% |
| 45 to 59 Minutes | 199 | 4.1% |
| 60 to 89 Minutes | 341 | 7.0% |
| 90 or more Minutes | 245 | 5.0% |
Commute Time by Sex in Yalobusha County
The most common commute times in Yalobusha County are 30 to 34 minutes (565 commuters, 21.6%) for males and 30 to 34 minutes (598 commuters, 26.3%) for females.
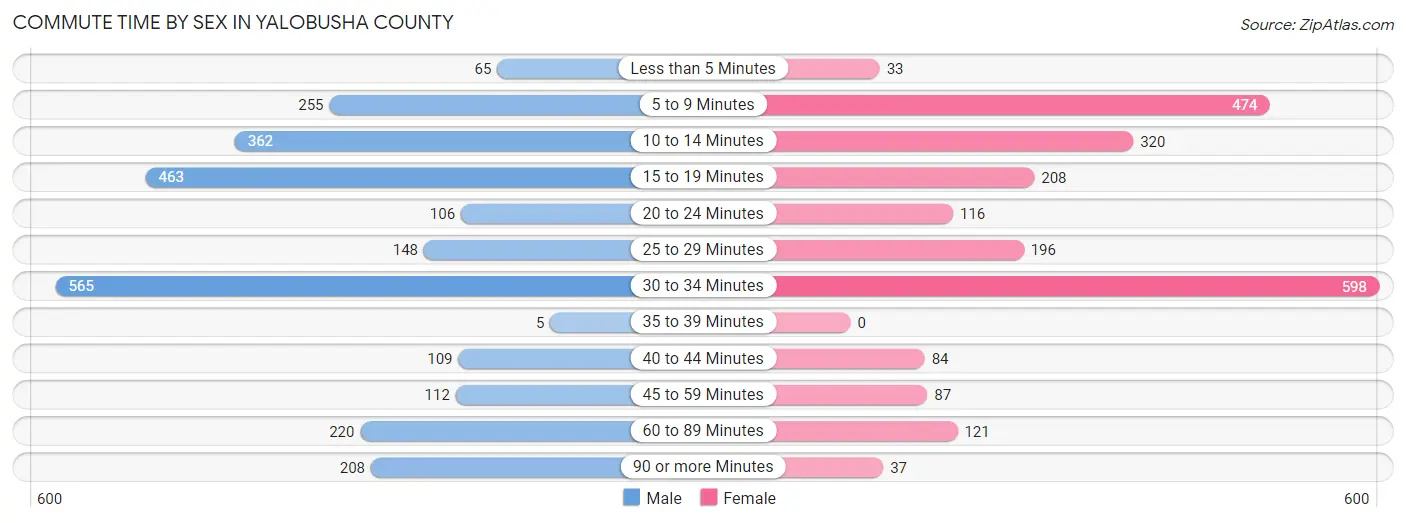
| Commute Time | Male | Female |
| Less than 5 Minutes | 65 (2.5%) | 33 (1.5%) |
| 5 to 9 Minutes | 255 (9.7%) | 474 (20.8%) |
| 10 to 14 Minutes | 362 (13.8%) | 320 (14.1%) |
| 15 to 19 Minutes | 463 (17.7%) | 208 (9.1%) |
| 20 to 24 Minutes | 106 (4.1%) | 116 (5.1%) |
| 25 to 29 Minutes | 148 (5.7%) | 196 (8.6%) |
| 30 to 34 Minutes | 565 (21.6%) | 598 (26.3%) |
| 35 to 39 Minutes | 5 (0.2%) | 0 (0.0%) |
| 40 to 44 Minutes | 109 (4.2%) | 84 (3.7%) |
| 45 to 59 Minutes | 112 (4.3%) | 87 (3.8%) |
| 60 to 89 Minutes | 220 (8.4%) | 121 (5.3%) |
| 90 or more Minutes | 208 (7.9%) | 37 (1.6%) |
Time of Departure to Work by Sex in Yalobusha County
The most frequent times of departure to work in Yalobusha County are 6:00 AM to 6:29 AM (771, 29.4%) for males and 7:00 AM to 7:29 AM (481, 21.1%) for females.
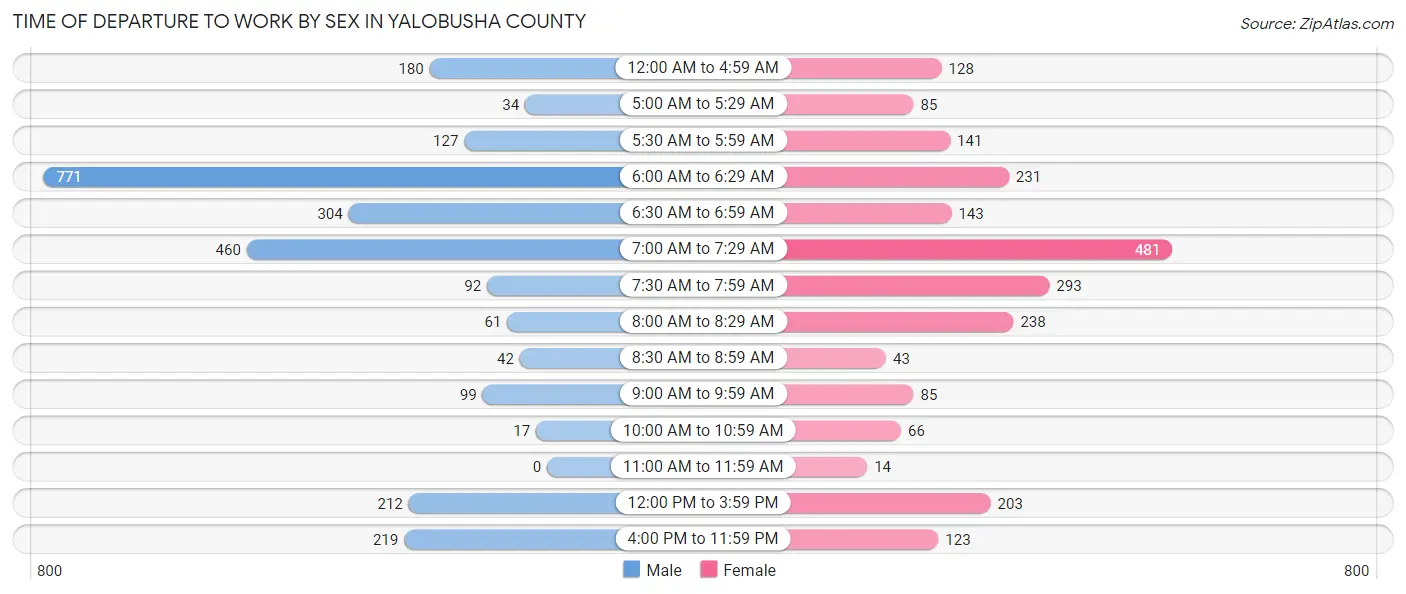
| Time of Departure | Male | Female |
| 12:00 AM to 4:59 AM | 180 (6.9%) | 128 (5.6%) |
| 5:00 AM to 5:29 AM | 34 (1.3%) | 85 (3.7%) |
| 5:30 AM to 5:59 AM | 127 (4.9%) | 141 (6.2%) |
| 6:00 AM to 6:29 AM | 771 (29.4%) | 231 (10.2%) |
| 6:30 AM to 6:59 AM | 304 (11.6%) | 143 (6.3%) |
| 7:00 AM to 7:29 AM | 460 (17.6%) | 481 (21.1%) |
| 7:30 AM to 7:59 AM | 92 (3.5%) | 293 (12.9%) |
| 8:00 AM to 8:29 AM | 61 (2.3%) | 238 (10.5%) |
| 8:30 AM to 8:59 AM | 42 (1.6%) | 43 (1.9%) |
| 9:00 AM to 9:59 AM | 99 (3.8%) | 85 (3.7%) |
| 10:00 AM to 10:59 AM | 17 (0.6%) | 66 (2.9%) |
| 11:00 AM to 11:59 AM | 0 (0.0%) | 14 (0.6%) |
| 12:00 PM to 3:59 PM | 212 (8.1%) | 203 (8.9%) |
| 4:00 PM to 11:59 PM | 219 (8.4%) | 123 (5.4%) |
| Total | 2,618 (100.0%) | 2,274 (100.0%) |
Housing Occupancy in Yalobusha County
Occupancy by Ownership in Yalobusha County
Of the total 5,106 dwellings in Yalobusha County, owner-occupied units account for 3,557 (69.7%), while renter-occupied units make up 1,549 (30.3%).
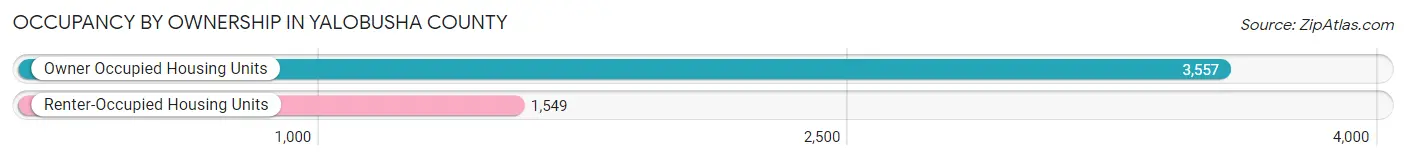
| Occupancy | # Housing Units | % Housing Units |
| Owner Occupied Housing Units | 3,557 | 69.7% |
| Renter-Occupied Housing Units | 1,549 | 30.3% |
| Total Occupied Housing Units | 5,106 | 100.0% |
Occupancy by Household Size in Yalobusha County
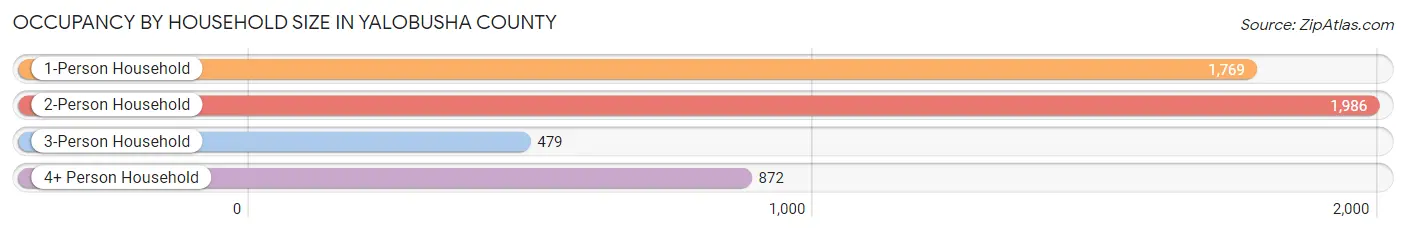
| Household Size | # Housing Units | % Housing Units |
| 1-Person Household | 1,769 | 34.6% |
| 2-Person Household | 1,986 | 38.9% |
| 3-Person Household | 479 | 9.4% |
| 4+ Person Household | 872 | 17.1% |
| Total Housing Units | 5,106 | 100.0% |
Occupancy by Ownership by Household Size in Yalobusha County
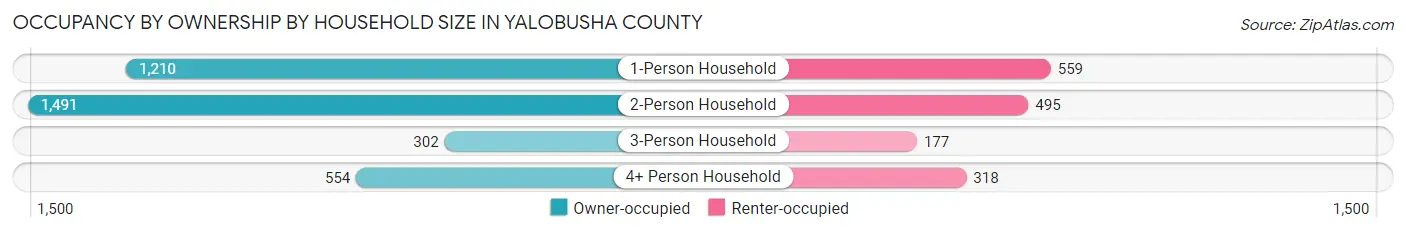
| Household Size | Owner-occupied | Renter-occupied |
| 1-Person Household | 1,210 (68.4%) | 559 (31.6%) |
| 2-Person Household | 1,491 (75.1%) | 495 (24.9%) |
| 3-Person Household | 302 (63.0%) | 177 (36.9%) |
| 4+ Person Household | 554 (63.5%) | 318 (36.5%) |
| Total Housing Units | 3,557 (69.7%) | 1,549 (30.3%) |
Occupancy by Educational Attainment in Yalobusha County
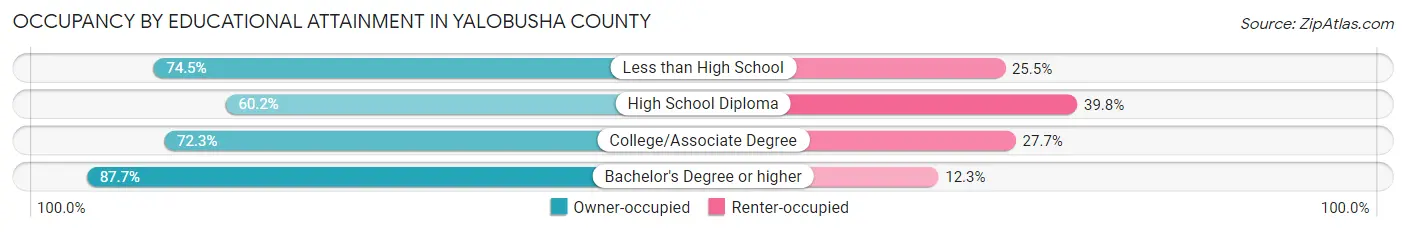
| Household Size | Owner-occupied | Renter-occupied |
| Less than High School | 650 (74.5%) | 223 (25.5%) |
| High School Diploma | 1,290 (60.2%) | 854 (39.8%) |
| College/Associate Degree | 1,012 (72.3%) | 387 (27.7%) |
| Bachelor's Degree or higher | 605 (87.7%) | 85 (12.3%) |
Occupancy by Age of Householder in Yalobusha County
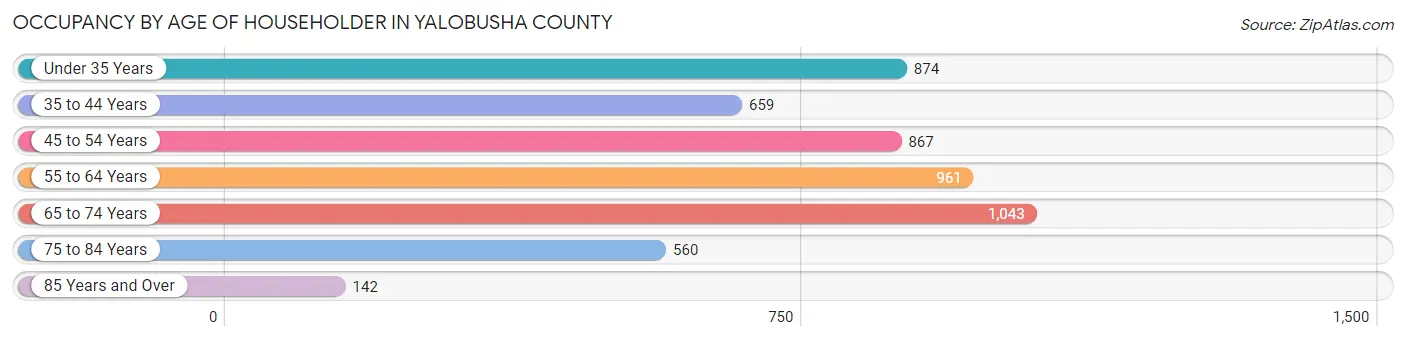
| Age Bracket | # Households | % Households |
| Under 35 Years | 874 | 17.1% |
| 35 to 44 Years | 659 | 12.9% |
| 45 to 54 Years | 867 | 17.0% |
| 55 to 64 Years | 961 | 18.8% |
| 65 to 74 Years | 1,043 | 20.4% |
| 75 to 84 Years | 560 | 11.0% |
| 85 Years and Over | 142 | 2.8% |
| Total | 5,106 | 100.0% |
Housing Finances in Yalobusha County
Median Income by Occupancy in Yalobusha County
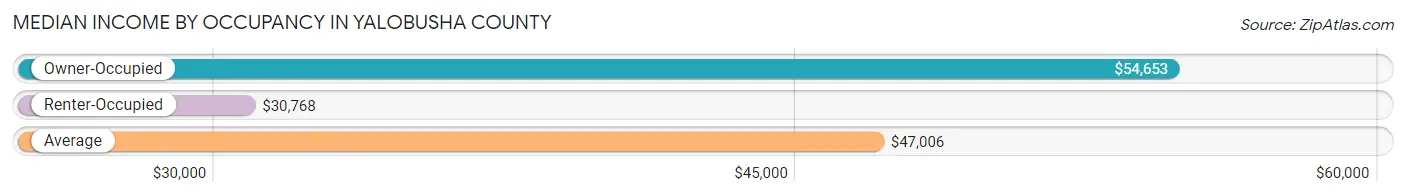
| Occupancy Type | # Households | Median Income |
| Owner-Occupied | 3,557 (69.7%) | $54,653 |
| Renter-Occupied | 1,549 (30.3%) | $30,768 |
| Average | 5,106 (100.0%) | $47,006 |
Occupancy by Householder Income Bracket in Yalobusha County
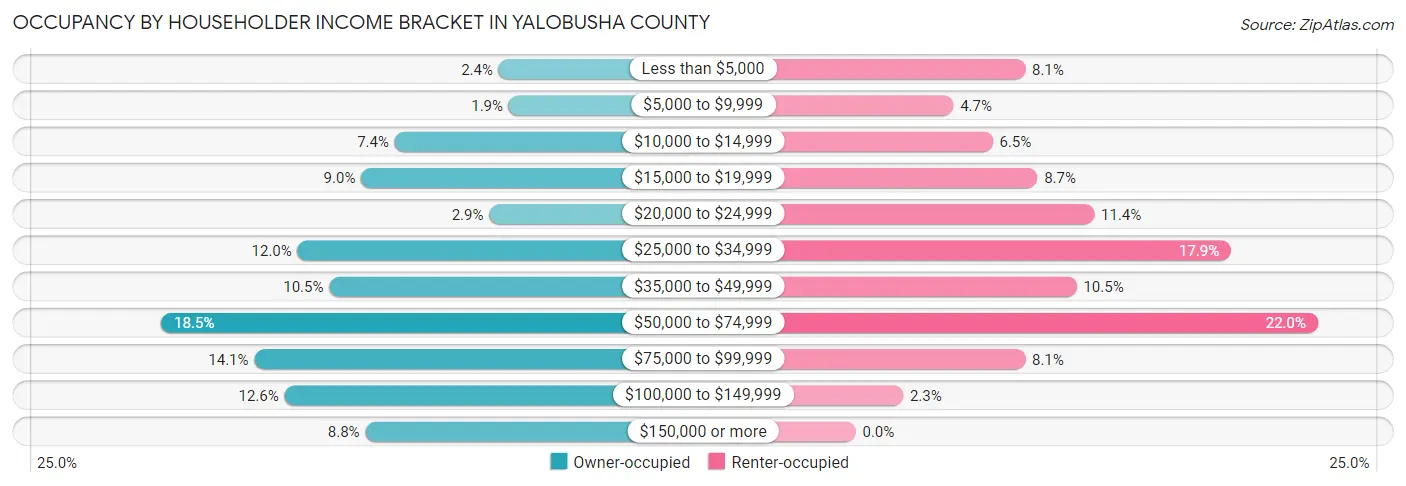
| Income Bracket | Owner-occupied | Renter-occupied |
| Less than $5,000 | 86 (2.4%) | 125 (8.1%) |
| $5,000 to $9,999 | 69 (1.9%) | 72 (4.6%) |
| $10,000 to $14,999 | 262 (7.4%) | 101 (6.5%) |
| $15,000 to $19,999 | 319 (9.0%) | 134 (8.6%) |
| $20,000 to $24,999 | 102 (2.9%) | 176 (11.4%) |
| $25,000 to $34,999 | 427 (12.0%) | 277 (17.9%) |
| $35,000 to $49,999 | 373 (10.5%) | 163 (10.5%) |
| $50,000 to $74,999 | 658 (18.5%) | 341 (22.0%) |
| $75,000 to $99,999 | 500 (14.1%) | 125 (8.1%) |
| $100,000 to $149,999 | 449 (12.6%) | 35 (2.3%) |
| $150,000 or more | 312 (8.8%) | 0 (0.0%) |
| Total | 3,557 (100.0%) | 1,549 (100.0%) |
Monthly Housing Cost Tiers in Yalobusha County
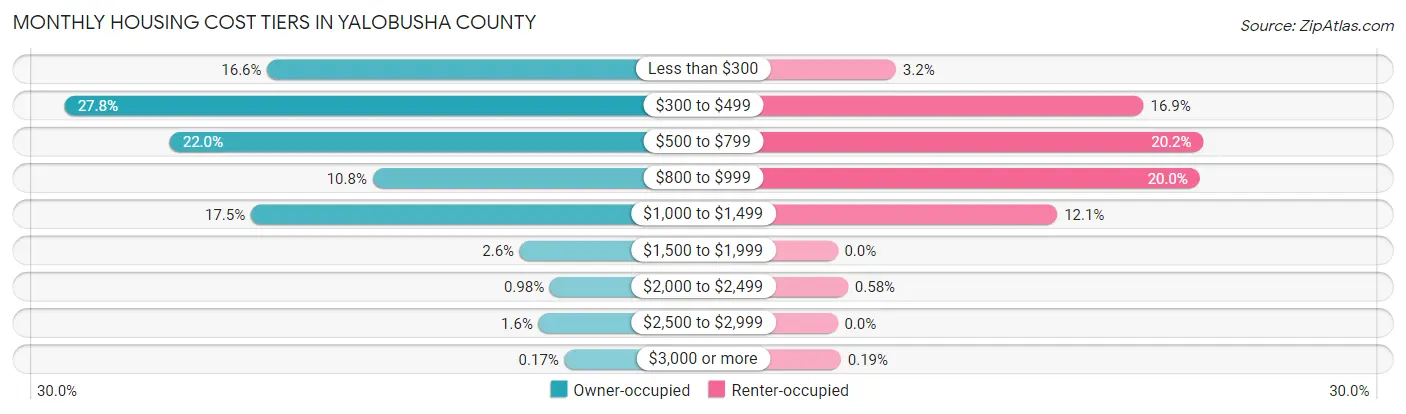
| Monthly Cost | Owner-occupied | Renter-occupied |
| Less than $300 | 590 (16.6%) | 50 (3.2%) |
| $300 to $499 | 988 (27.8%) | 262 (16.9%) |
| $500 to $799 | 782 (22.0%) | 313 (20.2%) |
| $800 to $999 | 383 (10.8%) | 310 (20.0%) |
| $1,000 to $1,499 | 622 (17.5%) | 188 (12.1%) |
| $1,500 to $1,999 | 94 (2.6%) | 0 (0.0%) |
| $2,000 to $2,499 | 35 (1.0%) | 9 (0.6%) |
| $2,500 to $2,999 | 57 (1.6%) | 0 (0.0%) |
| $3,000 or more | 6 (0.2%) | 3 (0.2%) |
| Total | 3,557 (100.0%) | 1,549 (100.0%) |
Physical Housing Characteristics in Yalobusha County
Housing Structures in Yalobusha County
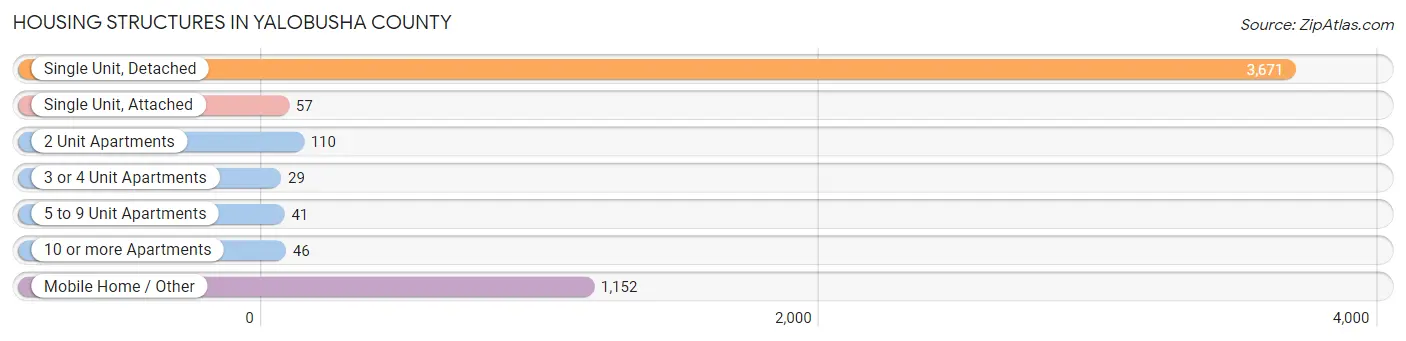
| Structure Type | # Housing Units | % Housing Units |
| Single Unit, Detached | 3,671 | 71.9% |
| Single Unit, Attached | 57 | 1.1% |
| 2 Unit Apartments | 110 | 2.1% |
| 3 or 4 Unit Apartments | 29 | 0.6% |
| 5 to 9 Unit Apartments | 41 | 0.8% |
| 10 or more Apartments | 46 | 0.9% |
| Mobile Home / Other | 1,152 | 22.6% |
| Total | 5,106 | 100.0% |
Housing Structures by Occupancy in Yalobusha County
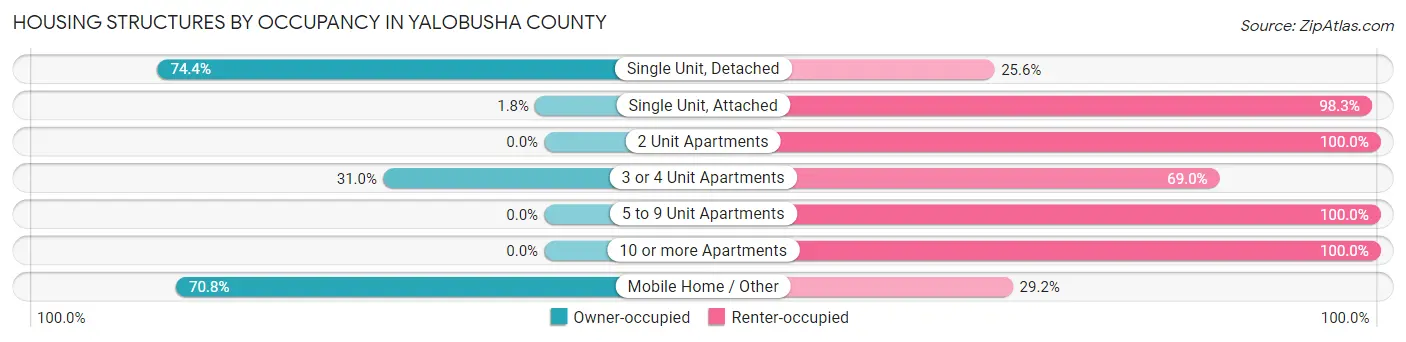
| Structure Type | Owner-occupied | Renter-occupied |
| Single Unit, Detached | 2,731 (74.4%) | 940 (25.6%) |
| Single Unit, Attached | 1 (1.8%) | 56 (98.3%) |
| 2 Unit Apartments | 0 (0.0%) | 110 (100.0%) |
| 3 or 4 Unit Apartments | 9 (31.0%) | 20 (69.0%) |
| 5 to 9 Unit Apartments | 0 (0.0%) | 41 (100.0%) |
| 10 or more Apartments | 0 (0.0%) | 46 (100.0%) |
| Mobile Home / Other | 816 (70.8%) | 336 (29.2%) |
| Total | 3,557 (69.7%) | 1,549 (30.3%) |
Housing Structures by Number of Rooms in Yalobusha County
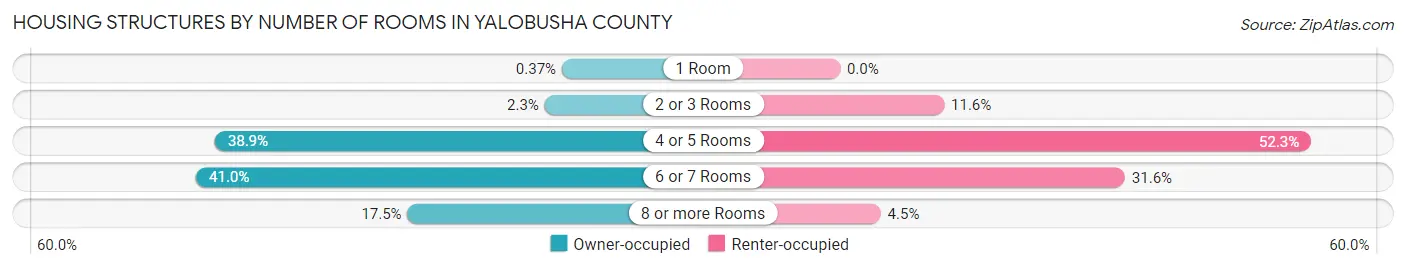
| Number of Rooms | Owner-occupied | Renter-occupied |
| 1 Room | 13 (0.4%) | 0 (0.0%) |
| 2 or 3 Rooms | 81 (2.3%) | 179 (11.6%) |
| 4 or 5 Rooms | 1,383 (38.9%) | 810 (52.3%) |
| 6 or 7 Rooms | 1,457 (41.0%) | 490 (31.6%) |
| 8 or more Rooms | 623 (17.5%) | 70 (4.5%) |
| Total | 3,557 (100.0%) | 1,549 (100.0%) |
Housing Structure by Heating Type in Yalobusha County
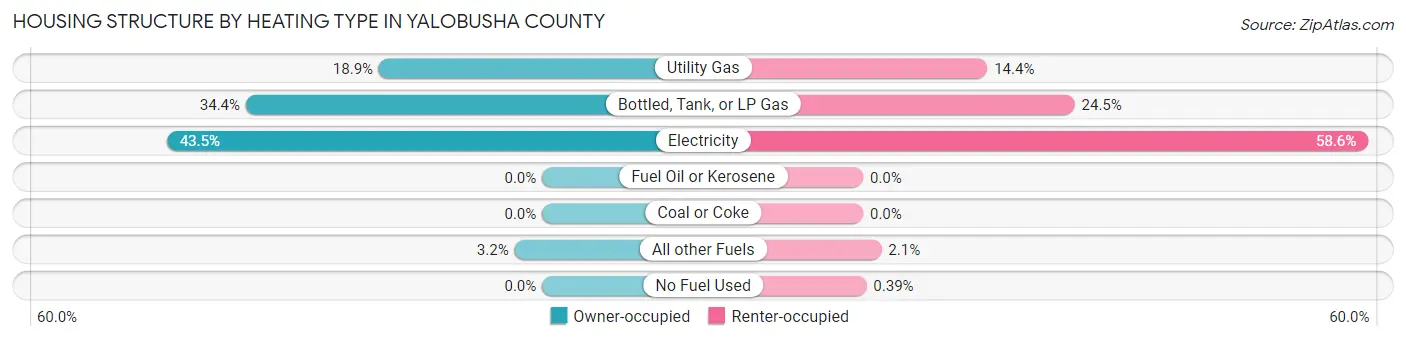
| Heating Type | Owner-occupied | Renter-occupied |
| Utility Gas | 673 (18.9%) | 223 (14.4%) |
| Bottled, Tank, or LP Gas | 1,222 (34.4%) | 380 (24.5%) |
| Electricity | 1,548 (43.5%) | 907 (58.6%) |
| Fuel Oil or Kerosene | 0 (0.0%) | 0 (0.0%) |
| Coal or Coke | 0 (0.0%) | 0 (0.0%) |
| All other Fuels | 114 (3.2%) | 33 (2.1%) |
| No Fuel Used | 0 (0.0%) | 6 (0.4%) |
| Total | 3,557 (100.0%) | 1,549 (100.0%) |
Household Vehicle Usage in Yalobusha County
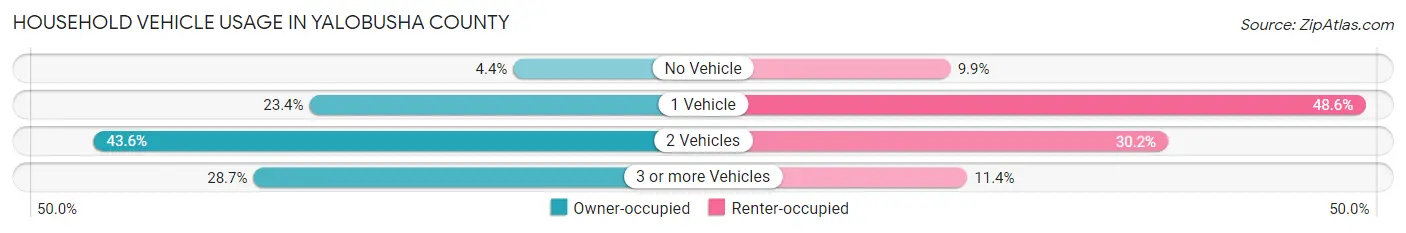
| Vehicles per Household | Owner-occupied | Renter-occupied |
| No Vehicle | 156 (4.4%) | 153 (9.9%) |
| 1 Vehicle | 833 (23.4%) | 752 (48.5%) |
| 2 Vehicles | 1,549 (43.5%) | 467 (30.1%) |
| 3 or more Vehicles | 1,019 (28.6%) | 177 (11.4%) |
| Total | 3,557 (100.0%) | 1,549 (100.0%) |
Real Estate & Mortgages in Yalobusha County
Real Estate and Mortgage Overview in Yalobusha County
| Characteristic | Without Mortgage | With Mortgage |
| Housing Units | 1,973 | 1,584 |
| Median Property Value | $88,300 | $111,800 |
| Median Household Income | $47,114 | $141 |
| Monthly Housing Costs | $387 | $0 |
| Real Estate Taxes | $693 | $285 |
Property Value by Mortgage Status in Yalobusha County
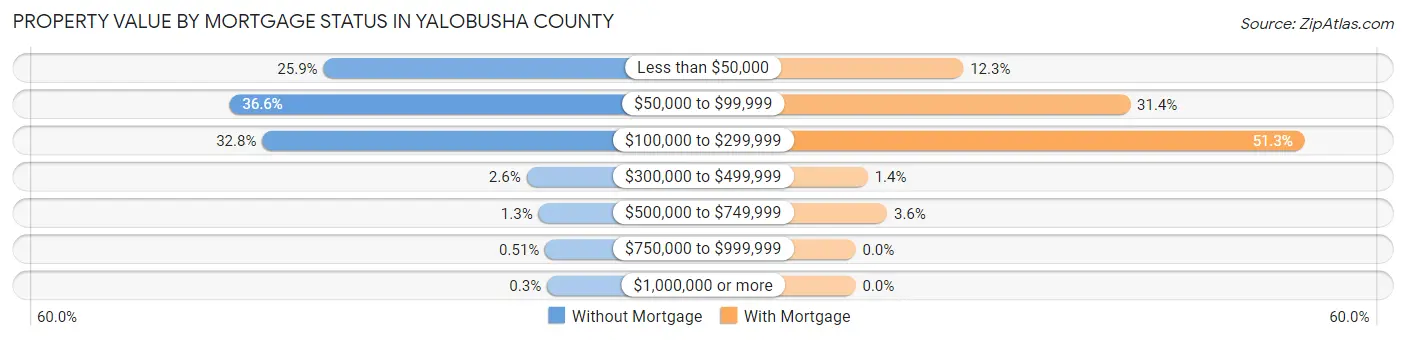
| Property Value | Without Mortgage | With Mortgage |
| Less than $50,000 | 510 (25.9%) | 195 (12.3%) |
| $50,000 to $99,999 | 722 (36.6%) | 497 (31.4%) |
| $100,000 to $299,999 | 648 (32.8%) | 813 (51.3%) |
| $300,000 to $499,999 | 52 (2.6%) | 22 (1.4%) |
| $500,000 to $749,999 | 25 (1.3%) | 57 (3.6%) |
| $750,000 to $999,999 | 10 (0.5%) | 0 (0.0%) |
| $1,000,000 or more | 6 (0.3%) | 0 (0.0%) |
| Total | 1,973 (100.0%) | 1,584 (100.0%) |
Household Income by Mortgage Status in Yalobusha County
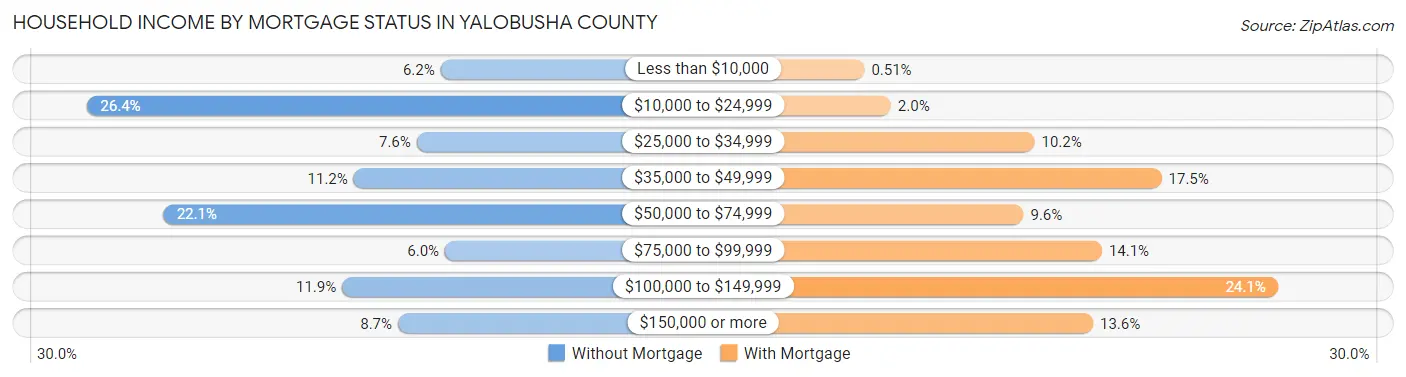
| Household Income | Without Mortgage | With Mortgage |
| Less than $10,000 | 123 (6.2%) | 8 (0.5%) |
| $10,000 to $24,999 | 521 (26.4%) | 32 (2.0%) |
| $25,000 to $34,999 | 150 (7.6%) | 162 (10.2%) |
| $35,000 to $49,999 | 221 (11.2%) | 277 (17.5%) |
| $50,000 to $74,999 | 435 (22.1%) | 152 (9.6%) |
| $75,000 to $99,999 | 118 (6.0%) | 223 (14.1%) |
| $100,000 to $149,999 | 234 (11.9%) | 382 (24.1%) |
| $150,000 or more | 171 (8.7%) | 215 (13.6%) |
| Total | 1,973 (100.0%) | 1,584 (100.0%) |
Property Value to Household Income Ratio in Yalobusha County
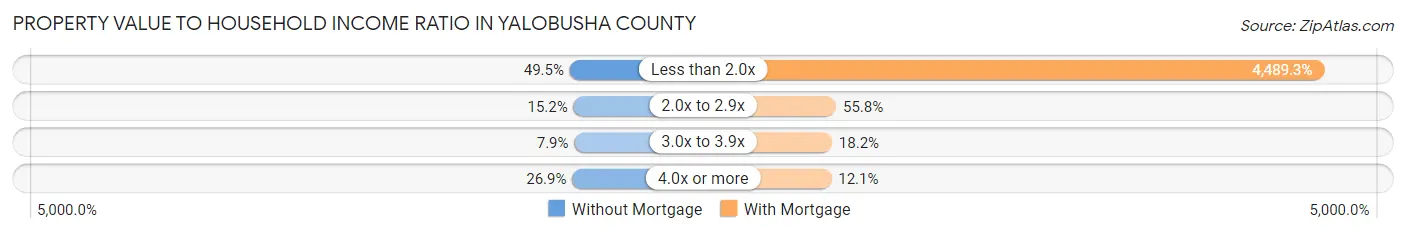
| Value-to-Income Ratio | Without Mortgage | With Mortgage |
| Less than 2.0x | 976 (49.5%) | 71,111 (4,489.3%) |
| 2.0x to 2.9x | 299 (15.1%) | 884 (55.8%) |
| 3.0x to 3.9x | 156 (7.9%) | 289 (18.2%) |
| 4.0x or more | 530 (26.9%) | 192 (12.1%) |
| Total | 1,973 (100.0%) | 1,584 (100.0%) |
Real Estate Taxes by Mortgage Status in Yalobusha County
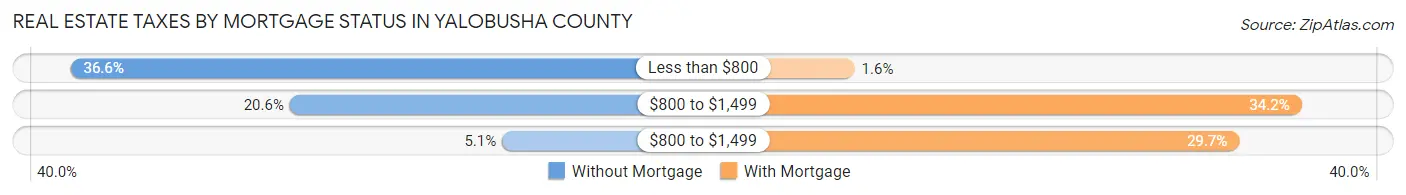
| Property Taxes | Without Mortgage | With Mortgage |
| Less than $800 | 723 (36.6%) | 25 (1.6%) |
| $800 to $1,499 | 407 (20.6%) | 542 (34.2%) |
| $800 to $1,499 | 101 (5.1%) | 470 (29.7%) |
| Total | 1,973 (100.0%) | 1,584 (100.0%) |
Health & Disability in Yalobusha County
Health Insurance Coverage by Age in Yalobusha County
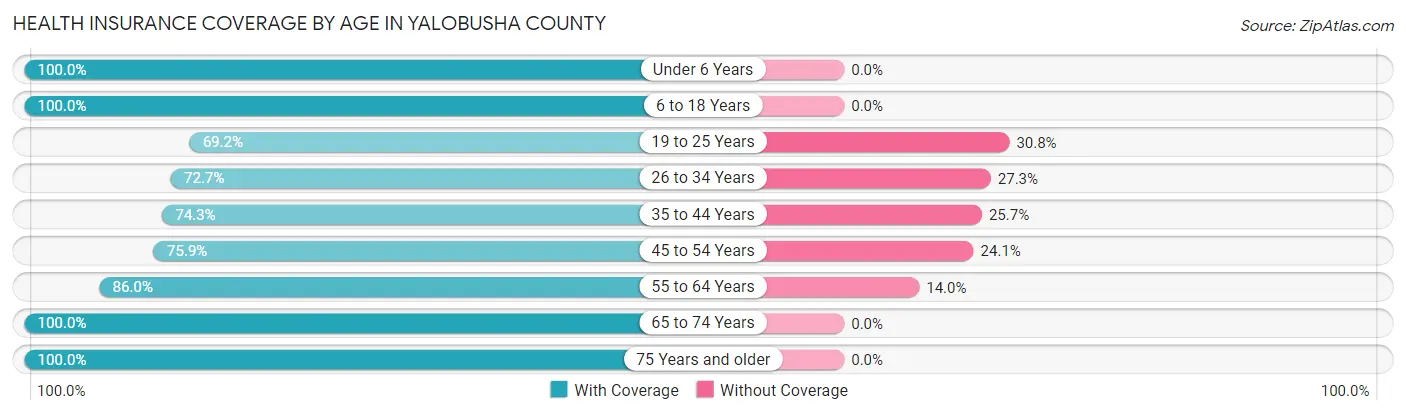
| Age Bracket | With Coverage | Without Coverage |
| Under 6 Years | 912 (100.0%) | 0 (0.0%) |
| 6 to 18 Years | 1,894 (100.0%) | 0 (0.0%) |
| 19 to 25 Years | 573 (69.2%) | 255 (30.8%) |
| 26 to 34 Years | 1,013 (72.7%) | 381 (27.3%) |
| 35 to 44 Years | 1,140 (74.3%) | 394 (25.7%) |
| 45 to 54 Years | 1,057 (75.9%) | 336 (24.1%) |
| 55 to 64 Years | 1,538 (86.0%) | 250 (14.0%) |
| 65 to 74 Years | 1,531 (100.0%) | 0 (0.0%) |
| 75 Years and older | 936 (100.0%) | 0 (0.0%) |
| Total | 10,594 (86.8%) | 1,616 (13.2%) |
Health Insurance Coverage by Citizenship Status in Yalobusha County
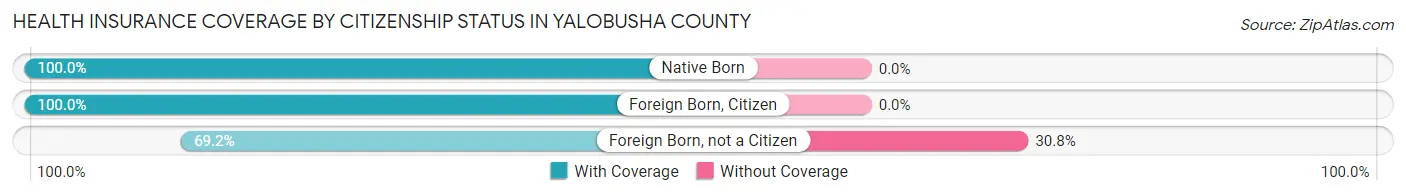
| Citizenship Status | With Coverage | Without Coverage |
| Native Born | 912 (100.0%) | 0 (0.0%) |
| Foreign Born, Citizen | 1,894 (100.0%) | 0 (0.0%) |
| Foreign Born, not a Citizen | 573 (69.2%) | 255 (30.8%) |
Health Insurance Coverage by Household Income in Yalobusha County
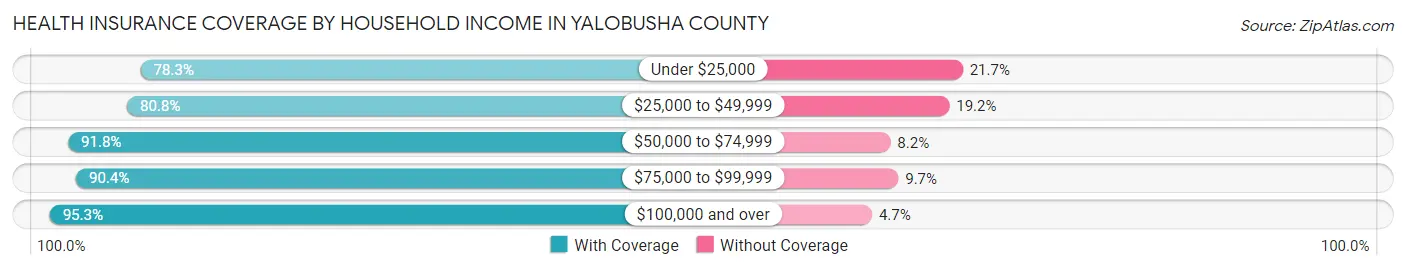
| Household Income | With Coverage | Without Coverage |
| Under $25,000 | 2,025 (78.3%) | 562 (21.7%) |
| $25,000 to $49,999 | 2,353 (80.8%) | 559 (19.2%) |
| $50,000 to $74,999 | 2,574 (91.8%) | 229 (8.2%) |
| $75,000 to $99,999 | 1,442 (90.3%) | 154 (9.7%) |
| $100,000 and over | 2,198 (95.3%) | 109 (4.7%) |
Public vs Private Health Insurance Coverage by Age in Yalobusha County
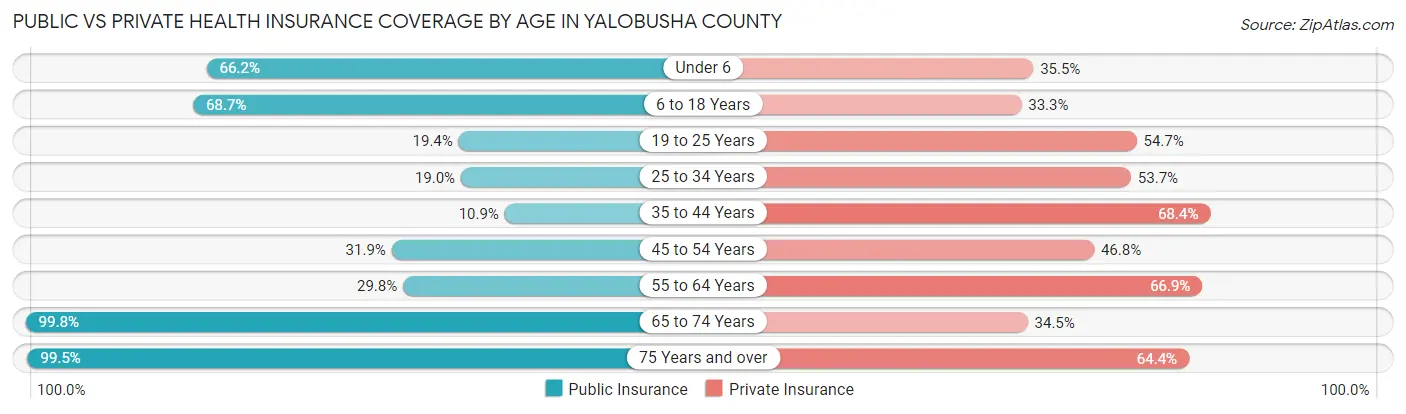
| Age Bracket | Public Insurance | Private Insurance |
| Under 6 | 604 (66.2%) | 324 (35.5%) |
| 6 to 18 Years | 1,302 (68.7%) | 631 (33.3%) |
| 19 to 25 Years | 161 (19.4%) | 453 (54.7%) |
| 25 to 34 Years | 265 (19.0%) | 748 (53.7%) |
| 35 to 44 Years | 167 (10.9%) | 1,049 (68.4%) |
| 45 to 54 Years | 444 (31.9%) | 652 (46.8%) |
| 55 to 64 Years | 532 (29.7%) | 1,196 (66.9%) |
| 65 to 74 Years | 1,528 (99.8%) | 528 (34.5%) |
| 75 Years and over | 931 (99.5%) | 603 (64.4%) |
| Total | 5,934 (48.6%) | 6,184 (50.6%) |
Disability Status by Sex by Age in Yalobusha County
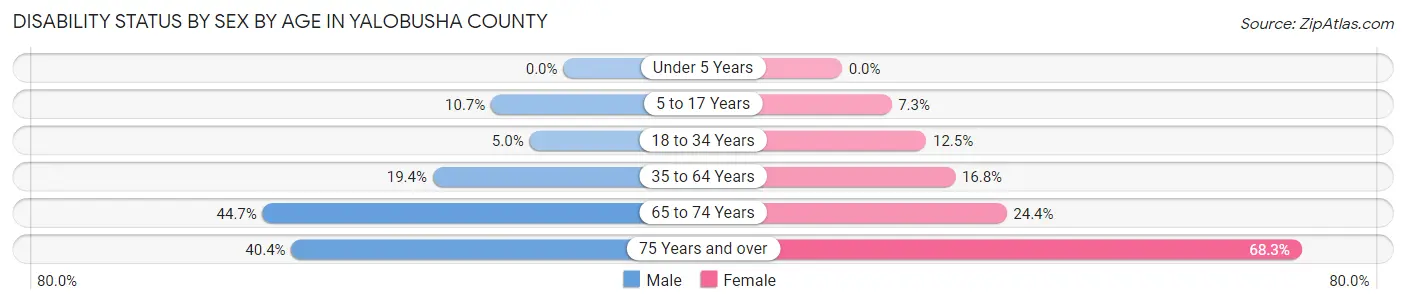
| Age Bracket | Male | Female |
| Under 5 Years | 0 (0.0%) | 0 (0.0%) |
| 5 to 17 Years | 113 (10.7%) | 67 (7.3%) |
| 18 to 34 Years | 60 (5.0%) | 141 (12.5%) |
| 35 to 64 Years | 441 (19.4%) | 410 (16.8%) |
| 65 to 74 Years | 322 (44.7%) | 198 (24.4%) |
| 75 Years and over | 168 (40.4%) | 355 (68.3%) |
Disability Class by Sex by Age in Yalobusha County
Disability Class: Hearing Difficulty
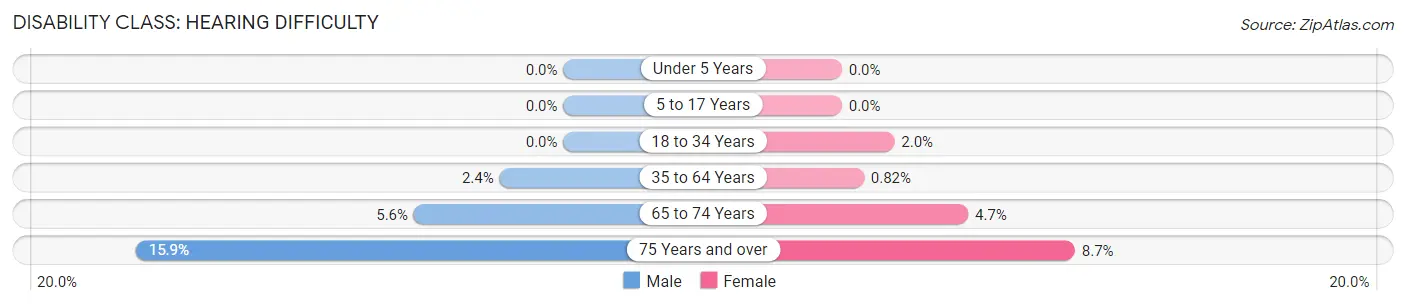
| Age Bracket | Male | Female |
| Under 5 Years | 0 (0.0%) | 0 (0.0%) |
| 5 to 17 Years | 0 (0.0%) | 0 (0.0%) |
| 18 to 34 Years | 0 (0.0%) | 22 (1.9%) |
| 35 to 64 Years | 54 (2.4%) | 20 (0.8%) |
| 65 to 74 Years | 40 (5.6%) | 38 (4.7%) |
| 75 Years and over | 66 (15.9%) | 45 (8.6%) |
Disability Class: Vision Difficulty
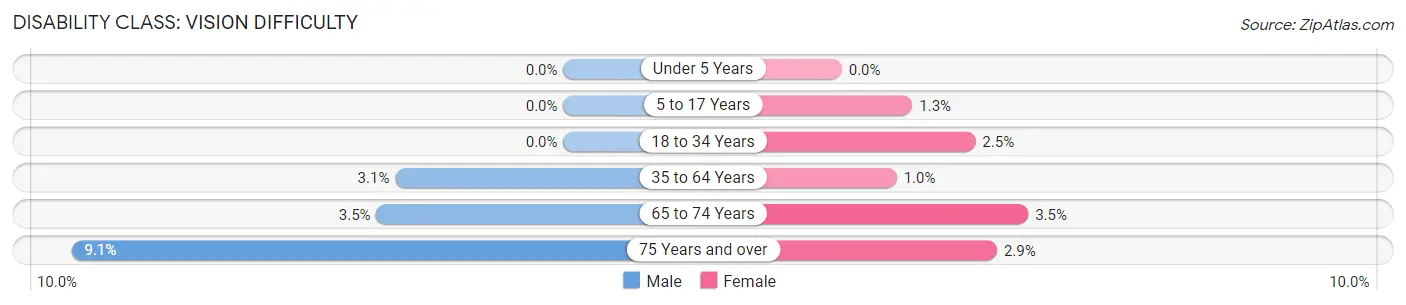
| Age Bracket | Male | Female |
| Under 5 Years | 0 (0.0%) | 0 (0.0%) |
| 5 to 17 Years | 0 (0.0%) | 12 (1.3%) |
| 18 to 34 Years | 0 (0.0%) | 28 (2.5%) |
| 35 to 64 Years | 71 (3.1%) | 25 (1.0%) |
| 65 to 74 Years | 25 (3.5%) | 28 (3.5%) |
| 75 Years and over | 38 (9.1%) | 15 (2.9%) |
Disability Class: Cognitive Difficulty
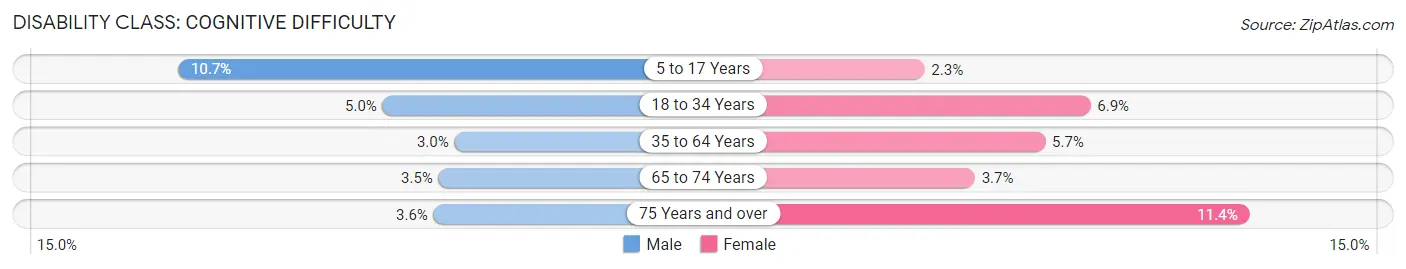
| Age Bracket | Male | Female |
| 5 to 17 Years | 113 (10.7%) | 21 (2.3%) |
| 18 to 34 Years | 60 (5.0%) | 78 (6.9%) |
| 35 to 64 Years | 69 (3.0%) | 138 (5.7%) |
| 65 to 74 Years | 25 (3.5%) | 30 (3.7%) |
| 75 Years and over | 15 (3.6%) | 59 (11.4%) |
Disability Class: Ambulatory Difficulty
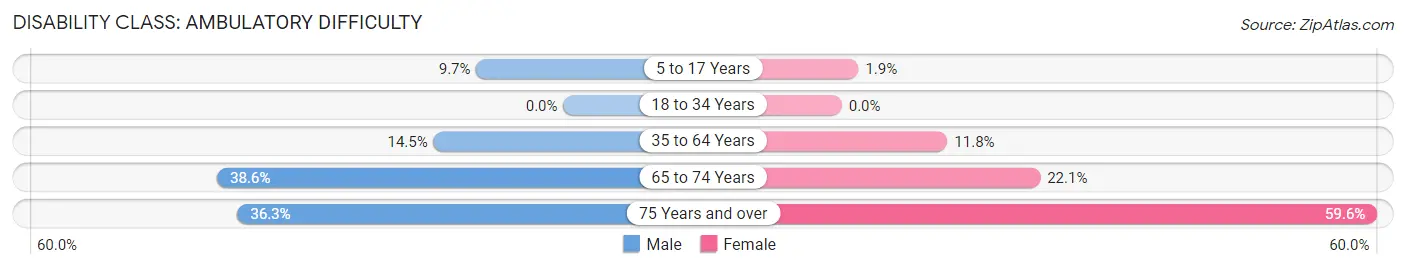
| Age Bracket | Male | Female |
| 5 to 17 Years | 102 (9.7%) | 17 (1.9%) |
| 18 to 34 Years | 0 (0.0%) | 0 (0.0%) |
| 35 to 64 Years | 329 (14.5%) | 287 (11.8%) |
| 65 to 74 Years | 278 (38.6%) | 179 (22.1%) |
| 75 Years and over | 151 (36.3%) | 310 (59.6%) |
Disability Class: Self-Care Difficulty
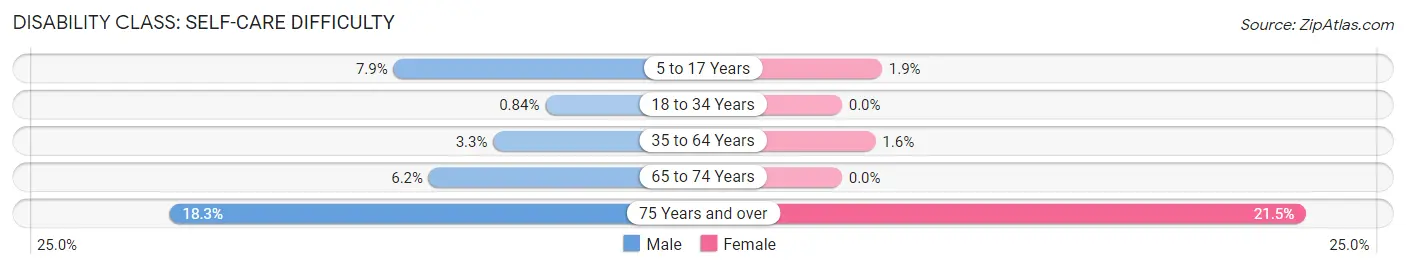
| Age Bracket | Male | Female |
| 5 to 17 Years | 83 (7.9%) | 17 (1.9%) |
| 18 to 34 Years | 10 (0.8%) | 0 (0.0%) |
| 35 to 64 Years | 74 (3.3%) | 38 (1.6%) |
| 65 to 74 Years | 45 (6.2%) | 0 (0.0%) |
| 75 Years and over | 76 (18.3%) | 112 (21.5%) |
Technology Access in Yalobusha County
Computing Device Access in Yalobusha County
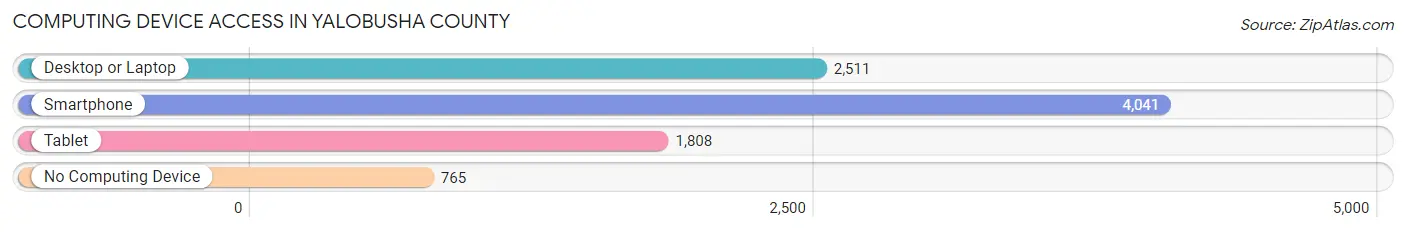
| Device Type | # Households | % Households |
| Desktop or Laptop | 2,511 | 49.2% |
| Smartphone | 4,041 | 79.1% |
| Tablet | 1,808 | 35.4% |
| No Computing Device | 765 | 15.0% |
| Total | 5,106 | 100.0% |
Internet Access in Yalobusha County
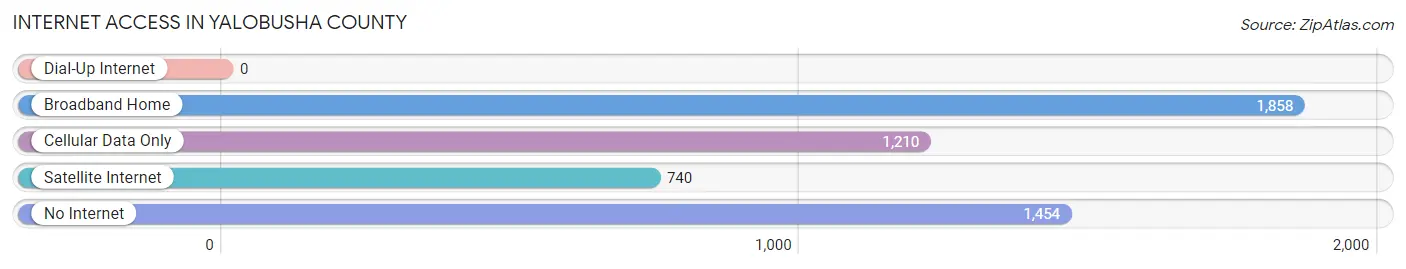
| Internet Type | # Households | % Households |
| Dial-Up Internet | 0 | 0.0% |
| Broadband Home | 1,858 | 36.4% |
| Cellular Data Only | 1,210 | 23.7% |
| Satellite Internet | 740 | 14.5% |
| No Internet | 1,454 | 28.5% |
| Total | 5,106 | 100.0% |
Yalobusha County Summary
Yalobusha County is located in the north-central part of Mississippi, in the heart of the Mississippi Delta. It is bordered by Grenada County to the north, Calhoun County to the east, Tallahatchie County to the south, and Lafayette County to the west. The county seat is Water Valley, and the county has a total area of 545 square miles.
History
Yalobusha County was established in 1833, and was named after the Yalobusha River, which runs through the county. The county was originally part of the Chickasaw Cession of 1832, and was part of the Choctaw Nation until 1832. The county was originally part of the Chickasaw Cession of 1832, and was part of the Choctaw Nation until 1832.
The first settlers in the area were Native Americans, who were mostly Choctaw and Chickasaw. The first white settlers arrived in the early 1800s, and the county was officially established in 1833.
The county was home to several plantations, and the economy was largely based on cotton production. The county was also home to several churches, schools, and businesses.
During the Civil War, Yalobusha County was a major site of conflict. The Battle of Coffeeville was fought in the county in December of 1862, and the Battle of Water Valley was fought in the county in July of 1863.
Geography
Yalobusha County is located in the north-central part of Mississippi, in the heart of the Mississippi Delta. It is bordered by Grenada County to the north, Calhoun County to the east, Tallahatchie County to the south, and Lafayette County to the west. The county seat is Water Valley, and the county has a total area of 545 square miles.
The terrain of the county is mostly flat, with some rolling hills in the northern part of the county. The Yalobusha River runs through the county, and there are several small lakes and ponds scattered throughout the county. The county is mostly covered in forests, with some open fields and pastures.
Economy
The economy of Yalobusha County is largely based on agriculture. The county is home to several large farms, and the main crops grown in the county are cotton, soybeans, corn, and wheat. The county is also home to several manufacturing companies, including furniture and automotive parts manufacturers.
The county is also home to several small businesses, including restaurants, retail stores, and service providers. The county is home to several tourist attractions, including the Yalobusha County Museum and the Yalobusha County Historical Society.
Demographics
As of the 2010 census, Yalobusha County had a population of 19,268. The racial makeup of the county was 79.3% White, 18.3% African American, 0.3% Native American, 0.2% Asian, 0.1% Pacific Islander, 0.7% from other races, and 1.3% from two or more races. Hispanic or Latino of any race were 1.7% of the population.
The median income for a household in the county was $30,945, and the median income for a family was $37,945. The per capita income for the county was $16,845. About 19.3% of the population was below the poverty line.
Common Questions
What is Per Capita Income in Yalobusha County?
Per Capita income in Yalobusha County is $24,719.
What is the Median Family Income in Yalobusha County?
Median Family Income in Yalobusha County is $58,429.
What is the Median Household income in Yalobusha County?
Median Household Income in Yalobusha County is $47,006.
What is Income or Wage Gap in Yalobusha County?
Income or Wage Gap in Yalobusha County is 28.5%.
Women in Yalobusha County earn 71.5 cents for every dollar earned by a man.
What is Family Income Deficit in Yalobusha County?
Family Income Deficit in Yalobusha County is $10,035.
Families that are below poverty line in Yalobusha County earn $10,035 less on average than the poverty threshold level.
What is Inequality or Gini Index in Yalobusha County?
Inequality or Gini Index in Yalobusha County is 0.43.
What is the Total Population of Yalobusha County?
Total Population of Yalobusha County is 12,499.
What is the Total Male Population of Yalobusha County?
Total Male Population of Yalobusha County is 5,990.
What is the Total Female Population of Yalobusha County?
Total Female Population of Yalobusha County is 6,509.
What is the Ratio of Males per 100 Females in Yalobusha County?
There are 92.03 Males per 100 Females in Yalobusha County.
What is the Ratio of Females per 100 Males in Yalobusha County?
There are 108.66 Females per 100 Males in Yalobusha County.
What is the Median Population Age in Yalobusha County?
Median Population Age in Yalobusha County is 41.8 Years.
What is the Average Family Size in Yalobusha County
Average Family Size in Yalobusha County is 3.1 People.
What is the Average Household Size in Yalobusha County
Average Household Size in Yalobusha County is 2.4 People.
How Large is the Labor Force in Yalobusha County?
There are 5,309 People in the Labor Forcein in Yalobusha County.
What is the Percentage of People in the Labor Force in Yalobusha County?
52.2% of People are in the Labor Force in Yalobusha County.
What is the Unemployment Rate in Yalobusha County?
Unemployment Rate in Yalobusha County is 5.0%.