Tippah County, MS Map & Demographics
Tippah County Map
Tippah County Overview
$27,762
PER CAPITA INCOME
$56,358
AVG FAMILY INCOME
$47,968
AVG HOUSEHOLD INCOME
40.8%
WAGE / INCOME GAP [ % ]
59.2¢/ $1
WAGE / INCOME GAP [ $ ]
$8,843
FAMILY INCOME DEFICIT
0.46
INEQUALITY / GINI INDEX
21,769
TOTAL POPULATION
10,594
MALE POPULATION
11,175
FEMALE POPULATION
94.80
MALES / 100 FEMALES
105.48
FEMALES / 100 MALES
39.6
MEDIAN AGE
3.1
AVG FAMILY SIZE
2.6
AVG HOUSEHOLD SIZE
9,827
LABOR FORCE [ PEOPLE ]
57.3%
PERCENT IN LABOR FORCE
6.0%
UNEMPLOYMENT RATE
Tippah County Area Codes
Income in Tippah County
Income Overview in Tippah County
Per Capita Income in Tippah County is $27,762, while median incomes of families and households are $56,358 and $47,968 respectively.
| Characteristic | Number | Measure |
| Per Capita Income | 21,769 | $27,762 |
| Median Family Income | 5,735 | $56,358 |
| Mean Family Income | 5,735 | $75,281 |
| Median Household Income | 8,091 | $47,968 |
| Mean Household Income | 8,091 | $65,718 |
| Income Deficit | 5,735 | $8,843 |
| Wage / Income Gap (%) | 21,769 | 40.79% |
| Wage / Income Gap ($) | 21,769 | 59.21¢ per $1 |
| Gini / Inequality Index | 21,769 | 0.46 |
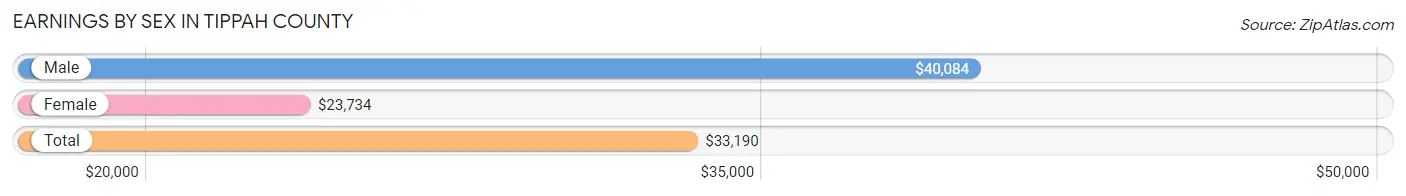
Earnings by Sex in Tippah County
Average Earnings in Tippah County are $33,190, $40,084 for men and $23,734 for women, a difference of 40.8%.
| Sex | Number | Average Earnings |
| Male | 5,379 (52.2%) | $40,084 |
| Female | 4,932 (47.8%) | $23,734 |
| Total | 10,311 (100.0%) | $33,190 |
Earnings by Sex by Income Bracket in Tippah County
The most common earnings brackets in Tippah County are $55,000 to $64,999 for men (618 | 11.5%) and $30,000 to $34,999 for women (487 | 9.9%).

| Income | Male | Female |
| $2,499 or less | 348 (6.5%) | 422 (8.6%) |
| $2,500 to $4,999 | 156 (2.9%) | 219 (4.4%) |
| $5,000 to $7,499 | 230 (4.3%) | 260 (5.3%) |
| $7,500 to $9,999 | 33 (0.6%) | 265 (5.4%) |
| $10,000 to $12,499 | 50 (0.9%) | 104 (2.1%) |
| $12,500 to $14,999 | 178 (3.3%) | 284 (5.8%) |
| $15,000 to $17,499 | 139 (2.6%) | 227 (4.6%) |
| $17,500 to $19,999 | 97 (1.8%) | 282 (5.7%) |
| $20,000 to $22,499 | 131 (2.4%) | 207 (4.2%) |
| $22,500 to $24,999 | 143 (2.7%) | 397 (8.1%) |
| $25,000 to $29,999 | 243 (4.5%) | 242 (4.9%) |
| $30,000 to $34,999 | 461 (8.6%) | 487 (9.9%) |
| $35,000 to $39,999 | 472 (8.8%) | 234 (4.7%) |
| $40,000 to $44,999 | 292 (5.4%) | 108 (2.2%) |
| $45,000 to $49,999 | 499 (9.3%) | 209 (4.2%) |
| $50,000 to $54,999 | 344 (6.4%) | 205 (4.2%) |
| $55,000 to $64,999 | 618 (11.5%) | 207 (4.2%) |
| $65,000 to $74,999 | 242 (4.5%) | 291 (5.9%) |
| $75,000 to $99,999 | 391 (7.3%) | 156 (3.2%) |
| $100,000+ | 312 (5.8%) | 126 (2.5%) |
| Total | 5,379 (100.0%) | 4,932 (100.0%) |
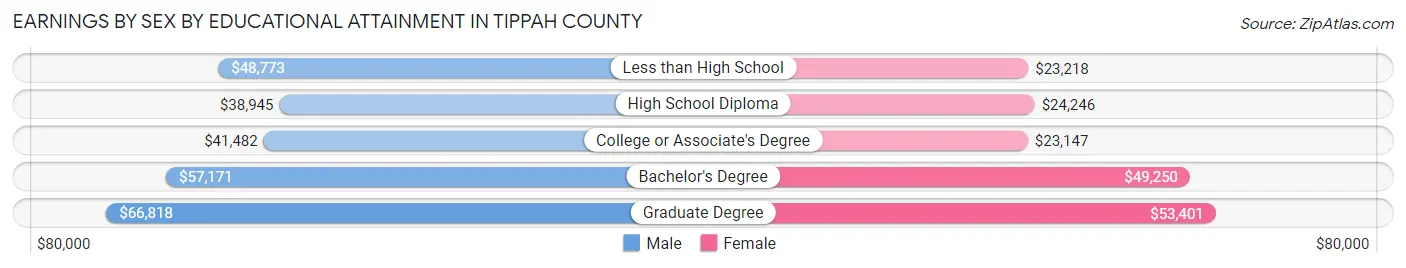
Earnings by Sex by Educational Attainment in Tippah County
Average earnings in Tippah County are $46,250 for men and $26,381 for women, a difference of 43.0%. Men with an educational attainment of graduate degree enjoy the highest average annual earnings of $66,818, while those with high school diploma education earn the least with $38,945. Women with an educational attainment of graduate degree earn the most with the average annual earnings of $53,401, while those with college or associate's degree education have the smallest earnings of $23,147.
| Educational Attainment | Male Income | Female Income |
| Less than High School | $48,773 | $23,218 |
| High School Diploma | $38,945 | $24,246 |
| College or Associate's Degree | $41,482 | $23,147 |
| Bachelor's Degree | $57,171 | $49,250 |
| Graduate Degree | $66,818 | $53,401 |
| Total | $46,250 | $26,381 |
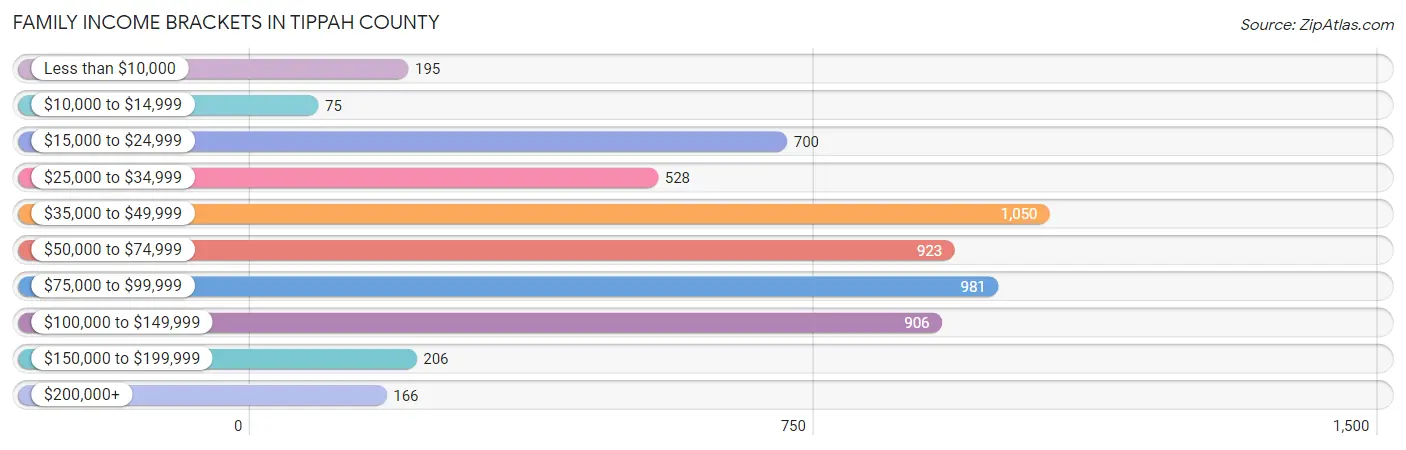
Family Income in Tippah County
Family Income Brackets in Tippah County
According to the Tippah County family income data, there are 1,050 families falling into the $35,000 to $49,999 income range, which is the most common income bracket and makes up 18.3% of all families. Conversely, the $10,000 to $14,999 income bracket is the least frequent group with only 75 families (1.3%) belonging to this category.
| Income Bracket | # Families | % Families |
| Less than $10,000 | 195 | 3.4% |
| $10,000 to $14,999 | 75 | 1.3% |
| $15,000 to $24,999 | 700 | 12.2% |
| $25,000 to $34,999 | 528 | 9.2% |
| $35,000 to $49,999 | 1,050 | 18.3% |
| $50,000 to $74,999 | 923 | 16.1% |
| $75,000 to $99,999 | 981 | 17.1% |
| $100,000 to $149,999 | 906 | 15.8% |
| $150,000 to $199,999 | 206 | 3.6% |
| $200,000+ | 166 | 2.9% |
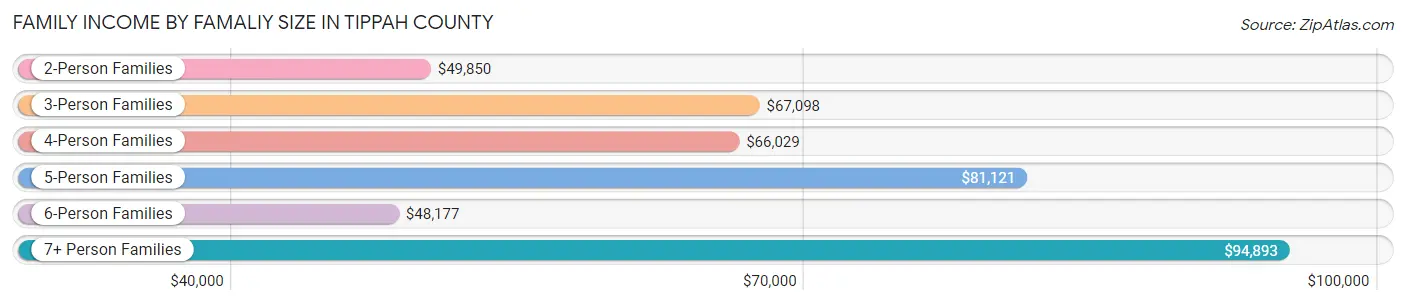
Family Income by Famaliy Size in Tippah County
7+ person families (111 | 1.9%) account for the highest median family income in Tippah County with $94,893 per family, while 2-person families (2,966 | 51.7%) have the highest median income of $24,925 per family member.
| Income Bracket | # Families | Median Income |
| 2-Person Families | 2,966 (51.7%) | $49,850 |
| 3-Person Families | 1,003 (17.5%) | $67,098 |
| 4-Person Families | 1,262 (22.0%) | $66,029 |
| 5-Person Families | 242 (4.2%) | $81,121 |
| 6-Person Families | 151 (2.6%) | $48,177 |
| 7+ Person Families | 111 (1.9%) | $94,893 |
| Total | 5,735 (100.0%) | $56,358 |
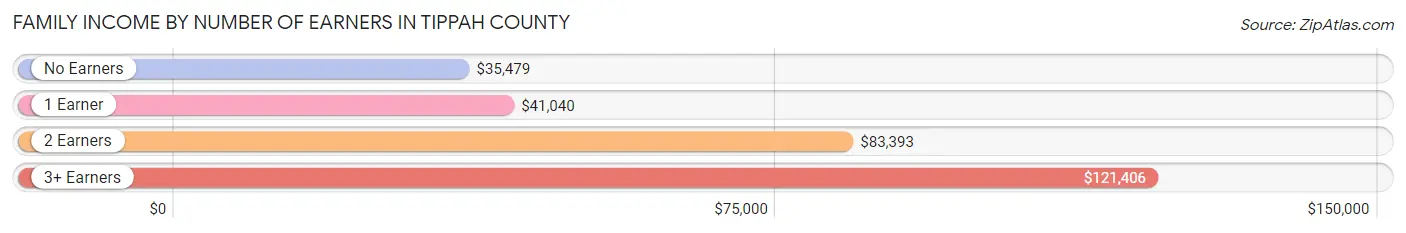
Family Income by Number of Earners in Tippah County
The median family income in Tippah County is $56,358, with families comprising 3+ earners (497) having the highest median family income of $121,406, while families with no earners (988) have the lowest median family income of $35,479, accounting for 8.7% and 17.2% of families, respectively.
| Number of Earners | # Families | Median Income |
| No Earners | 988 (17.2%) | $35,479 |
| 1 Earner | 2,047 (35.7%) | $41,040 |
| 2 Earners | 2,203 (38.4%) | $83,393 |
| 3+ Earners | 497 (8.7%) | $121,406 |
| Total | 5,735 (100.0%) | $56,358 |
Household Income in Tippah County
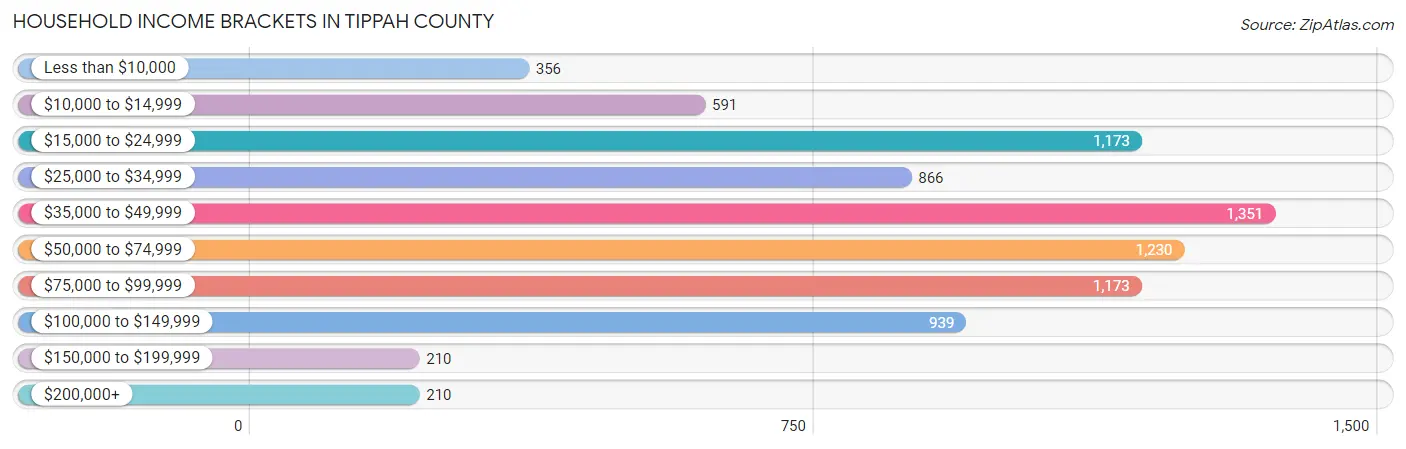
Household Income Brackets in Tippah County
With 1,351 households falling in the category, the $35,000 to $49,999 income range is the most frequent in Tippah County, accounting for 16.7% of all households. In contrast, only 210 households (2.6%) fall into the $150,000 to $199,999 income bracket, making it the least populous group.
| Income Bracket | # Households | % Households |
| Less than $10,000 | 356 | 4.4% |
| $10,000 to $14,999 | 591 | 7.3% |
| $15,000 to $24,999 | 1,173 | 14.5% |
| $25,000 to $34,999 | 866 | 10.7% |
| $35,000 to $49,999 | 1,351 | 16.7% |
| $50,000 to $74,999 | 1,230 | 15.2% |
| $75,000 to $99,999 | 1,173 | 14.5% |
| $100,000 to $149,999 | 939 | 11.6% |
| $150,000 to $199,999 | 210 | 2.6% |
| $200,000+ | 210 | 2.6% |
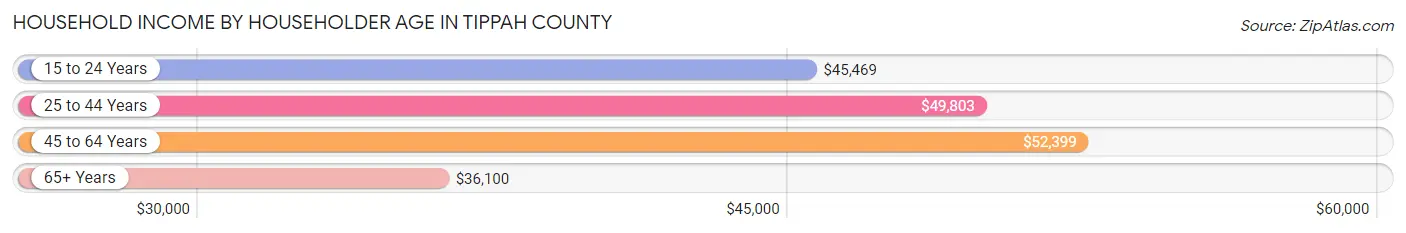
Household Income by Householder Age in Tippah County
The median household income in Tippah County is $47,968, with the highest median household income of $52,399 found in the 45 to 64 years age bracket for the primary householder. A total of 3,346 households (41.3%) fall into this category. Meanwhile, the 65+ years age bracket for the primary householder has the lowest median household income of $36,100, with 2,296 households (28.4%) in this group.
| Income Bracket | # Households | Median Income |
| 15 to 24 Years | 149 (1.8%) | $45,469 |
| 25 to 44 Years | 2,300 (28.4%) | $49,803 |
| 45 to 64 Years | 3,346 (41.3%) | $52,399 |
| 65+ Years | 2,296 (28.4%) | $36,100 |
| Total | 8,091 (100.0%) | $47,968 |
Poverty in Tippah County
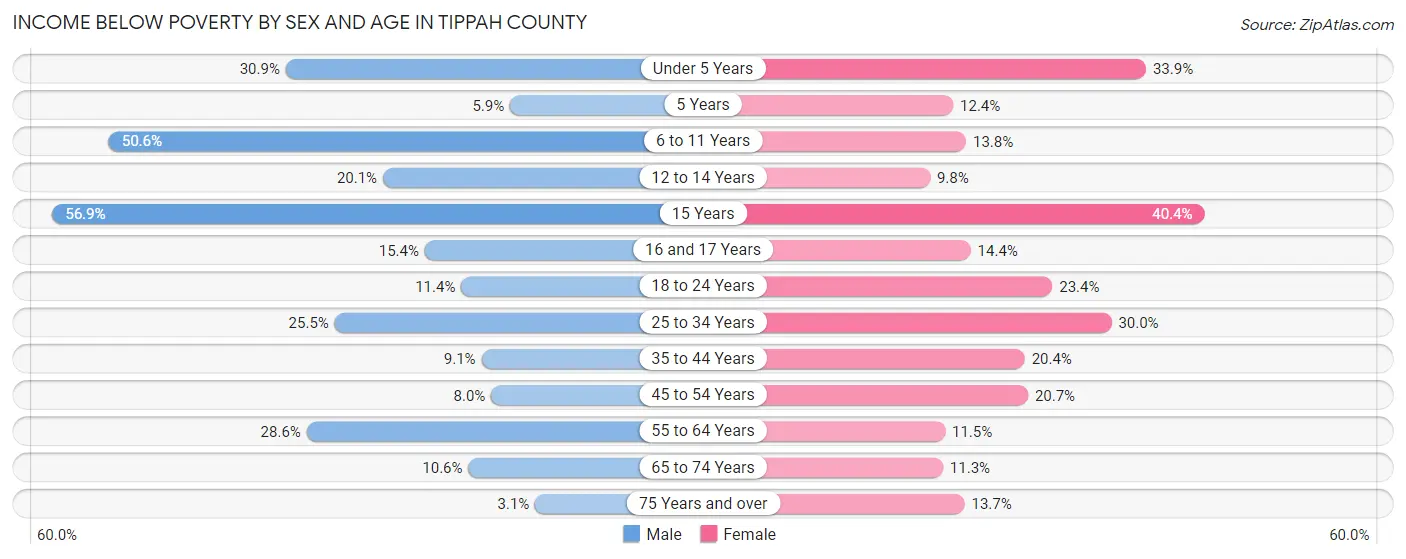
Income Below Poverty by Sex and Age in Tippah County
With 18.7% poverty level for males and 19.1% for females among the residents of Tippah County, 15 year old males and 15 year old females are the most vulnerable to poverty, with 70 males (56.9%) and 105 females (40.4%) in their respective age groups living below the poverty level.
| Age Bracket | Male | Female |
| Under 5 Years | 154 (30.9%) | 208 (33.9%) |
| 5 Years | 18 (5.9%) | 15 (12.4%) |
| 6 to 11 Years | 367 (50.6%) | 106 (13.8%) |
| 12 to 14 Years | 128 (20.1%) | 54 (9.8%) |
| 15 Years | 70 (56.9%) | 105 (40.4%) |
| 16 and 17 Years | 52 (15.4%) | 32 (14.3%) |
| 18 to 24 Years | 122 (11.4%) | 218 (23.4%) |
| 25 to 34 Years | 284 (25.5%) | 346 (30.0%) |
| 35 to 44 Years | 99 (9.1%) | 318 (20.4%) |
| 45 to 54 Years | 128 (8.0%) | 272 (20.7%) |
| 55 to 64 Years | 392 (28.6%) | 156 (11.5%) |
| 65 to 74 Years | 106 (10.6%) | 139 (11.3%) |
| 75 Years and over | 16 (3.1%) | 108 (13.7%) |
| Total | 1,936 (18.7%) | 2,077 (19.1%) |
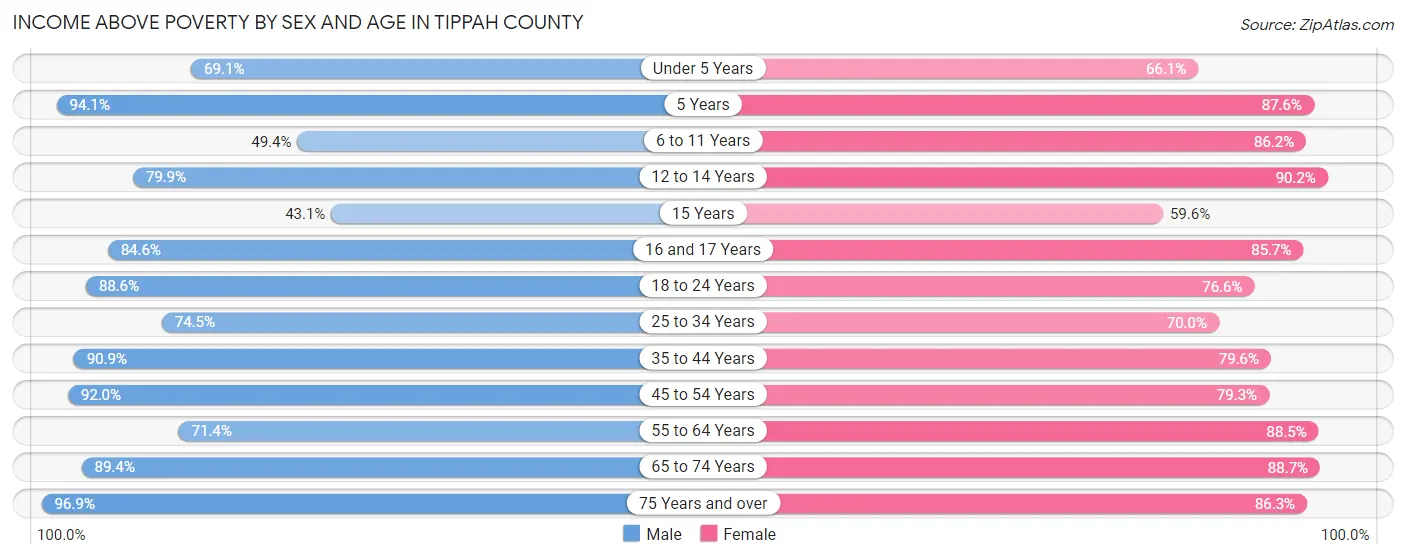
Income Above Poverty by Sex and Age in Tippah County
According to the poverty statistics in Tippah County, males aged 75 years and over and females aged 12 to 14 years are the age groups that are most secure financially, with 96.9% of males and 90.2% of females in these age groups living above the poverty line.
| Age Bracket | Male | Female |
| Under 5 Years | 344 (69.1%) | 406 (66.1%) |
| 5 Years | 285 (94.1%) | 106 (87.6%) |
| 6 to 11 Years | 358 (49.4%) | 660 (86.2%) |
| 12 to 14 Years | 509 (79.9%) | 496 (90.2%) |
| 15 Years | 53 (43.1%) | 155 (59.6%) |
| 16 and 17 Years | 285 (84.6%) | 191 (85.7%) |
| 18 to 24 Years | 951 (88.6%) | 712 (76.6%) |
| 25 to 34 Years | 831 (74.5%) | 806 (70.0%) |
| 35 to 44 Years | 986 (90.9%) | 1,243 (79.6%) |
| 45 to 54 Years | 1,465 (92.0%) | 1,040 (79.3%) |
| 55 to 64 Years | 979 (71.4%) | 1,200 (88.5%) |
| 65 to 74 Years | 896 (89.4%) | 1,095 (88.7%) |
| 75 Years and over | 494 (96.9%) | 682 (86.3%) |
| Total | 8,436 (81.3%) | 8,792 (80.9%) |
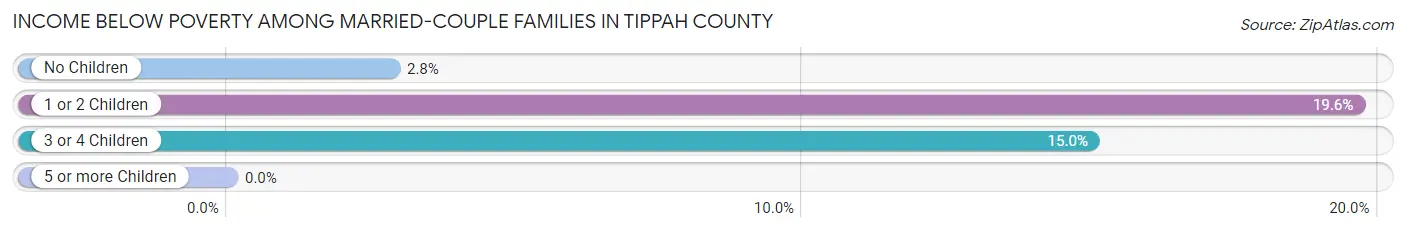
Income Below Poverty Among Married-Couple Families in Tippah County
The poverty statistics for married-couple families in Tippah County show that 8.6% or 369 of the total 4,293 families live below the poverty line. Families with 1 or 2 children have the highest poverty rate of 19.6%, comprising of 248 families. On the other hand, families with 5 or more children have the lowest poverty rate of 0.0%, which includes 0 families.
| Children | Above Poverty | Below Poverty |
| No Children | 2,618 (97.2%) | 76 (2.8%) |
| 1 or 2 Children | 1,016 (80.4%) | 248 (19.6%) |
| 3 or 4 Children | 255 (85.0%) | 45 (15.0%) |
| 5 or more Children | 35 (100.0%) | 0 (0.0%) |
| Total | 3,924 (91.4%) | 369 (8.6%) |
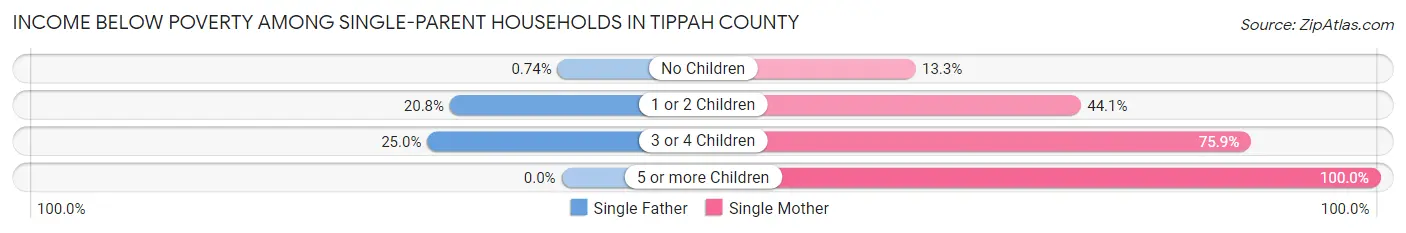
Income Below Poverty Among Single-Parent Households in Tippah County
According to the poverty data in Tippah County, 16.9% or 84 single-father households and 33.3% or 315 single-mother households are living below the poverty line. Among single-father households, those with 3 or 4 children have the highest poverty rate, with 46 households (25.0%) experiencing poverty. Likewise, among single-mother households, those with 5 or more children have the highest poverty rate, with 9 households (100.0%) falling below the poverty line.
| Children | Single Father | Single Mother |
| No Children | 1 (0.7%) | 54 (13.3%) |
| 1 or 2 Children | 37 (20.8%) | 208 (44.1%) |
| 3 or 4 Children | 46 (25.0%) | 44 (75.9%) |
| 5 or more Children | 0 (0.0%) | 9 (100.0%) |
| Total | 84 (16.9%) | 315 (33.3%) |
Income Below Poverty Among Married-Couple vs Single-Parent Households in Tippah County
The poverty data for Tippah County shows that 369 of the married-couple family households (8.6%) and 399 of the single-parent households (27.7%) are living below the poverty level. Within the married-couple family households, those with 1 or 2 children have the highest poverty rate, with 248 households (19.6%) falling below the poverty line. Among the single-parent households, those with 5 or more children have the highest poverty rate, with 9 household (100.0%) living below poverty.
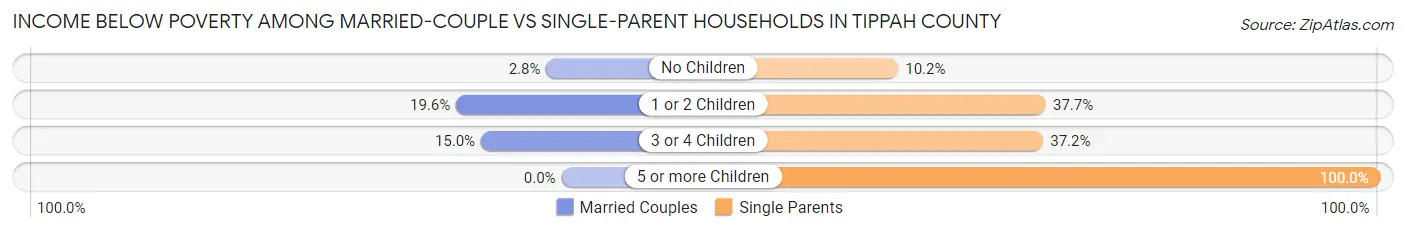
| Children | Married-Couple Families | Single-Parent Households |
| No Children | 76 (2.8%) | 55 (10.2%) |
| 1 or 2 Children | 248 (19.6%) | 245 (37.7%) |
| 3 or 4 Children | 45 (15.0%) | 90 (37.2%) |
| 5 or more Children | 0 (0.0%) | 9 (100.0%) |
| Total | 369 (8.6%) | 399 (27.7%) |
Race in Tippah County
The most populous races in Tippah County are White / Caucasian (16,782 | 77.1%), Black / African American (3,166 | 14.5%), and Hispanic or Latino (1,034 | 4.8%).
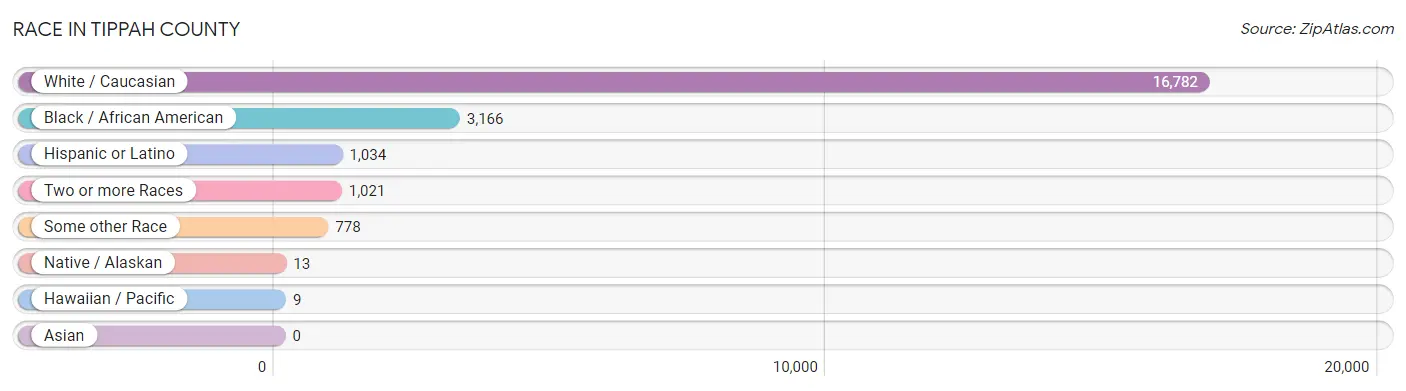
| Race | # Population | % Population |
| Asian | 0 | 0.0% |
| Black / African American | 3,166 | 14.5% |
| Hawaiian / Pacific | 9 | 0.0% |
| Hispanic or Latino | 1,034 | 4.8% |
| Native / Alaskan | 13 | 0.1% |
| White / Caucasian | 16,782 | 77.1% |
| Two or more Races | 1,021 | 4.7% |
| Some other Race | 778 | 3.6% |
| Total | 21,769 | 100.0% |
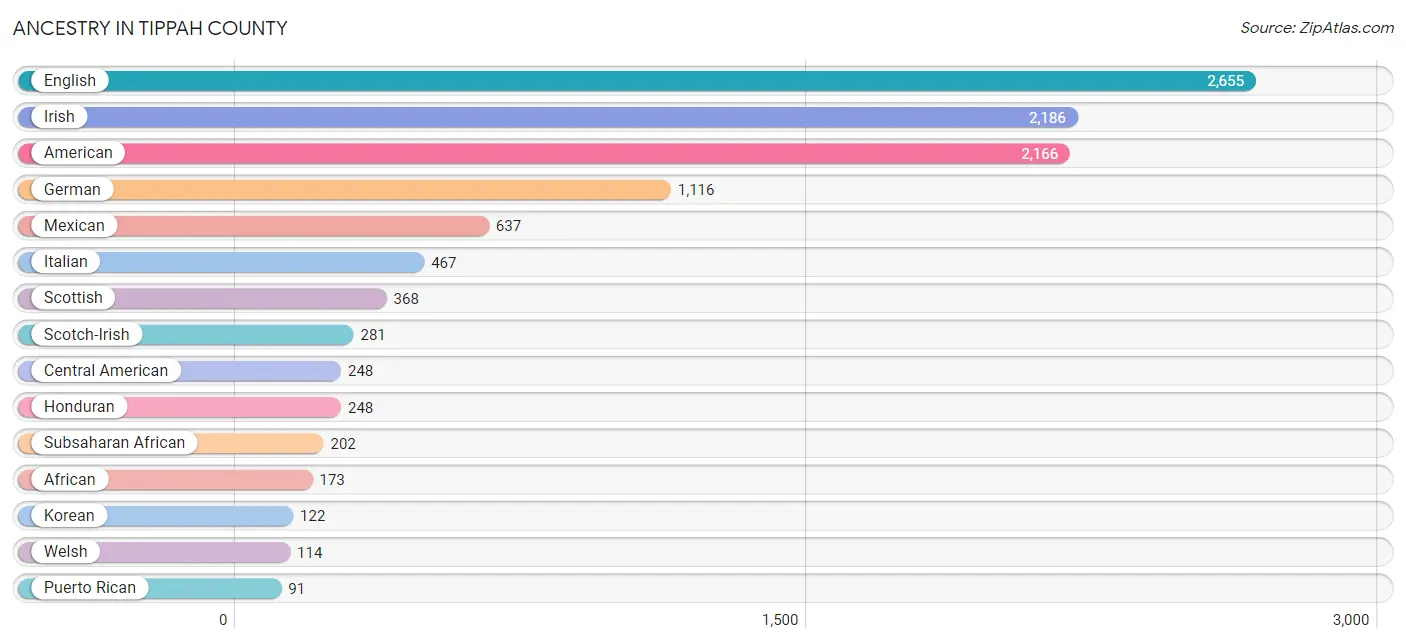
Ancestry in Tippah County
The most populous ancestries reported in Tippah County are English (2,655 | 12.2%), Irish (2,186 | 10.0%), American (2,166 | 10.0%), German (1,116 | 5.1%), and Mexican (637 | 2.9%), together accounting for 40.2% of all Tippah County residents.
| Ancestry | # Population | % Population |
| African | 173 | 0.8% |
| American | 2,166 | 10.0% |
| Blackfeet | 40 | 0.2% |
| British | 2 | 0.0% |
| Canadian | 24 | 0.1% |
| Central American | 248 | 1.1% |
| Cherokee | 2 | 0.0% |
| Choctaw | 24 | 0.1% |
| Colombian | 4 | 0.0% |
| Cuban | 4 | 0.0% |
| Czech | 12 | 0.1% |
| Danish | 1 | 0.0% |
| Dominican | 5 | 0.0% |
| Dutch | 62 | 0.3% |
| Eastern European | 2 | 0.0% |
| English | 2,655 | 12.2% |
| European | 87 | 0.4% |
| French | 78 | 0.4% |
| French Canadian | 1 | 0.0% |
| German | 1,116 | 5.1% |
| Honduran | 248 | 1.1% |
| Irish | 2,186 | 10.0% |
| Italian | 467 | 2.1% |
| Korean | 122 | 0.6% |
| Latvian | 10 | 0.1% |
| Mexican | 637 | 2.9% |
| Mexican American Indian | 5 | 0.0% |
| Mongolian | 4 | 0.0% |
| Nigerian | 14 | 0.1% |
| Norwegian | 21 | 0.1% |
| Puerto Rican | 91 | 0.4% |
| Russian | 11 | 0.1% |
| Samoan | 41 | 0.2% |
| Scotch-Irish | 281 | 1.3% |
| Scottish | 368 | 1.7% |
| Sioux | 12 | 0.1% |
| South American | 4 | 0.0% |
| Spaniard | 15 | 0.1% |
| Spanish | 6 | 0.0% |
| Subsaharan African | 202 | 0.9% |
| Swedish | 4 | 0.0% |
| Swiss | 4 | 0.0% |
| Ukrainian | 4 | 0.0% |
| Welsh | 114 | 0.5% | View All 44 Rows |
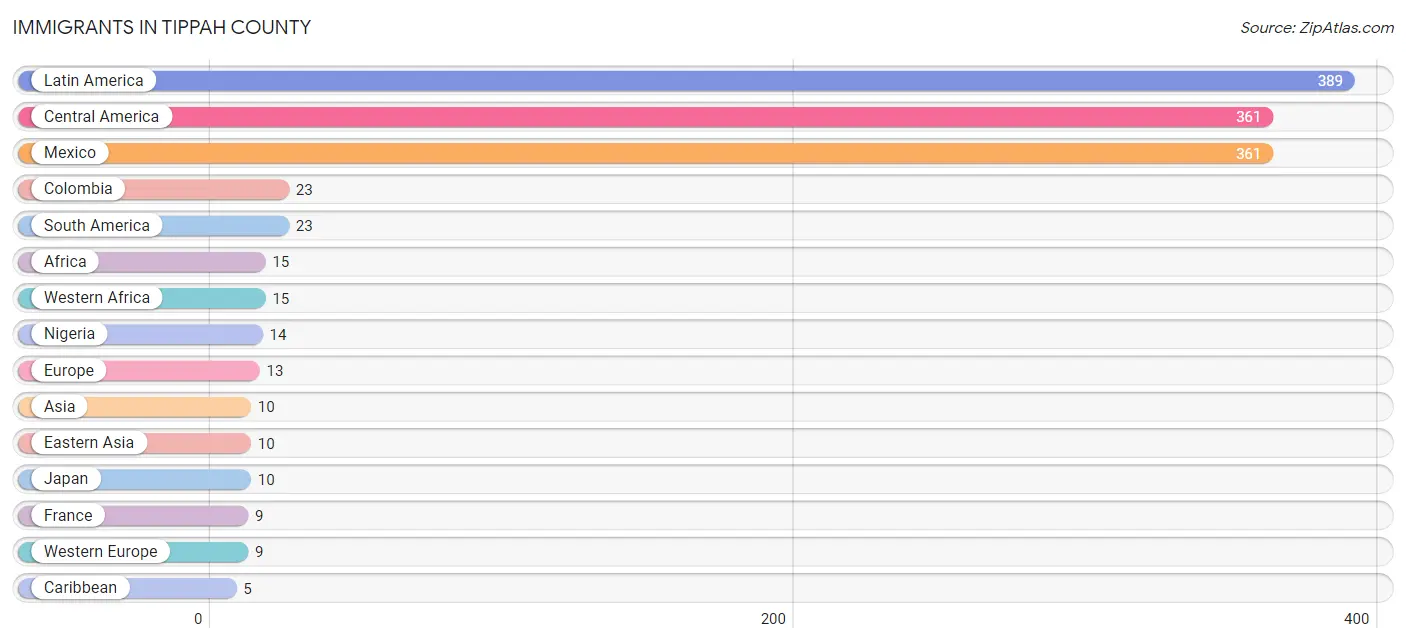
Immigrants in Tippah County
The most numerous immigrant groups reported in Tippah County came from Latin America (389 | 1.8%), Central America (361 | 1.7%), Mexico (361 | 1.7%), Colombia (23 | 0.1%), and South America (23 | 0.1%), together accounting for 5.3% of all Tippah County residents.
| Immigration Origin | # Population | % Population |
| Africa | 15 | 0.1% |
| Asia | 10 | 0.1% |
| Caribbean | 5 | 0.0% |
| Central America | 361 | 1.7% |
| Colombia | 23 | 0.1% |
| Dominican Republic | 5 | 0.0% |
| Eastern Asia | 10 | 0.1% |
| Eastern Europe | 4 | 0.0% |
| Europe | 13 | 0.1% |
| France | 9 | 0.0% |
| Ghana | 1 | 0.0% |
| Japan | 10 | 0.1% |
| Latin America | 389 | 1.8% |
| Mexico | 361 | 1.7% |
| Nigeria | 14 | 0.1% |
| South America | 23 | 0.1% |
| Ukraine | 4 | 0.0% |
| Western Africa | 15 | 0.1% |
| Western Europe | 9 | 0.0% | View All 19 Rows |
Sex and Age in Tippah County
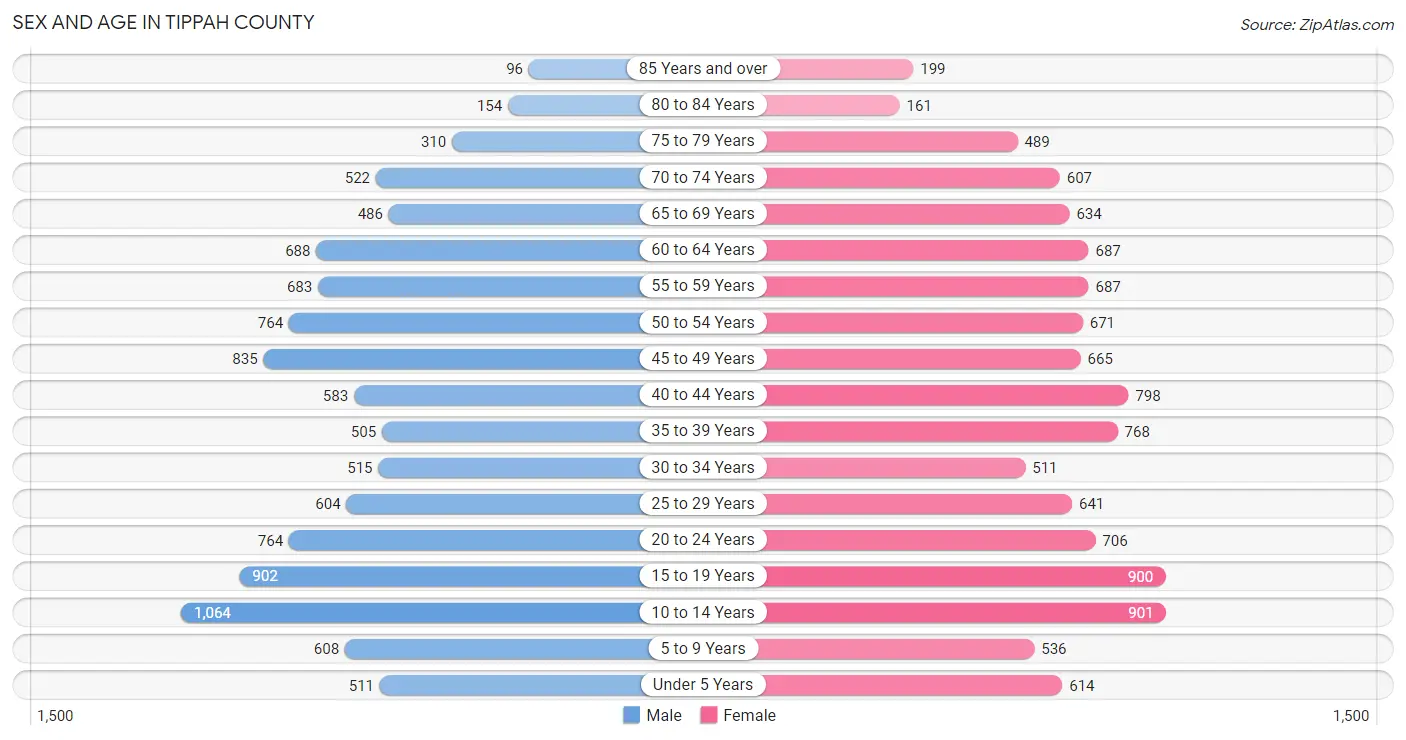
Sex and Age in Tippah County
The most populous age groups in Tippah County are 10 to 14 Years (1,064 | 10.0%) for men and 10 to 14 Years (901 | 8.1%) for women.
| Age Bracket | Male | Female |
| Under 5 Years | 511 (4.8%) | 614 (5.5%) |
| 5 to 9 Years | 608 (5.7%) | 536 (4.8%) |
| 10 to 14 Years | 1,064 (10.0%) | 901 (8.1%) |
| 15 to 19 Years | 902 (8.5%) | 900 (8.1%) |
| 20 to 24 Years | 764 (7.2%) | 706 (6.3%) |
| 25 to 29 Years | 604 (5.7%) | 641 (5.7%) |
| 30 to 34 Years | 515 (4.9%) | 511 (4.6%) |
| 35 to 39 Years | 505 (4.8%) | 768 (6.9%) |
| 40 to 44 Years | 583 (5.5%) | 798 (7.1%) |
| 45 to 49 Years | 835 (7.9%) | 665 (5.9%) |
| 50 to 54 Years | 764 (7.2%) | 671 (6.0%) |
| 55 to 59 Years | 683 (6.5%) | 687 (6.1%) |
| 60 to 64 Years | 688 (6.5%) | 687 (6.1%) |
| 65 to 69 Years | 486 (4.6%) | 634 (5.7%) |
| 70 to 74 Years | 522 (4.9%) | 607 (5.4%) |
| 75 to 79 Years | 310 (2.9%) | 489 (4.4%) |
| 80 to 84 Years | 154 (1.5%) | 161 (1.4%) |
| 85 Years and over | 96 (0.9%) | 199 (1.8%) |
| Total | 10,594 (100.0%) | 11,175 (100.0%) |
Families and Households in Tippah County
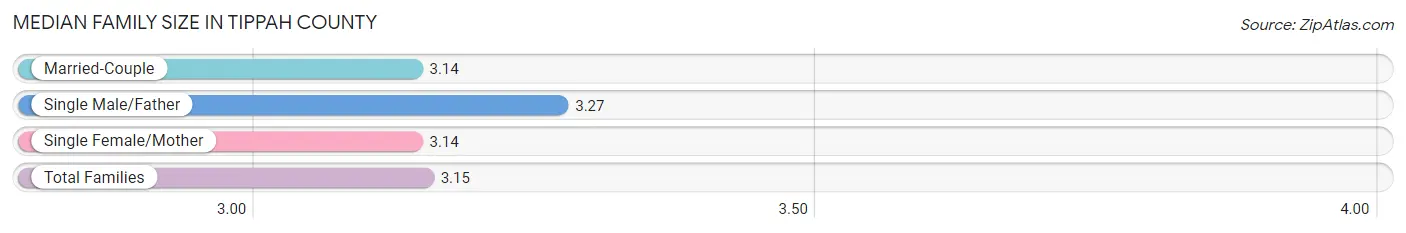
Median Family Size in Tippah County
The median family size in Tippah County is 3.15 persons per family, with single male/father families (497 | 8.7%) accounting for the largest median family size of 3.27 persons per family. On the other hand, married-couple families (4,293 | 74.9%) represent the smallest median family size with 3.14 persons per family.
| Family Type | # Families | Family Size |
| Married-Couple | 4,293 (74.9%) | 3.14 |
| Single Male/Father | 497 (8.7%) | 3.27 |
| Single Female/Mother | 945 (16.5%) | 3.14 |
| Total Families | 5,735 (100.0%) | 3.15 |
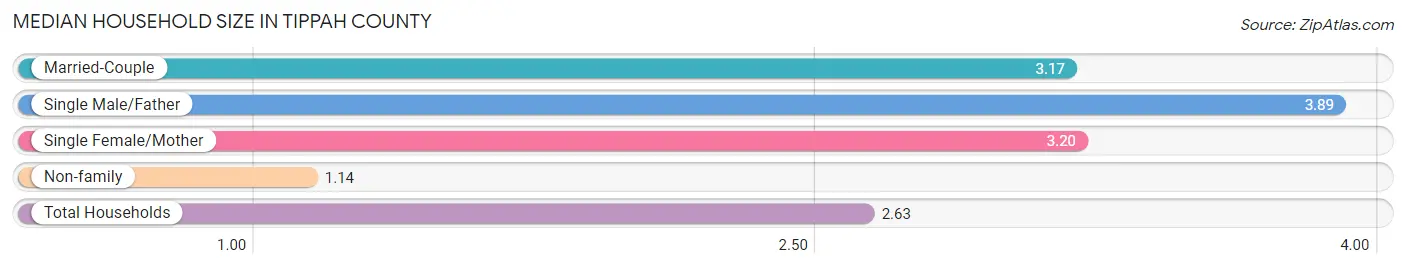
Median Household Size in Tippah County
The median household size in Tippah County is 2.63 persons per household, with single male/father households (497 | 6.1%) accounting for the largest median household size of 3.89 persons per household. non-family households (2,356 | 29.1%) represent the smallest median household size with 1.14 persons per household.
| Household Type | # Households | Household Size |
| Married-Couple | 4,293 (53.1%) | 3.17 |
| Single Male/Father | 497 (6.1%) | 3.89 |
| Single Female/Mother | 945 (11.7%) | 3.20 |
| Non-family | 2,356 (29.1%) | 1.14 |
| Total Households | 8,091 (100.0%) | 2.63 |
Household Size by Marriage Status in Tippah County
Out of a total of 8,091 households in Tippah County, 5,735 (70.9%) are family households, while 2,356 (29.1%) are nonfamily households. The most numerous type of family households are 2-person households, comprising 2,845, and the most common type of nonfamily households are 1-person households, comprising 2,114.

| Household Size | Family Households | Nonfamily Households |
| 1-Person Households | - | 2,114 (26.1%) |
| 2-Person Households | 2,845 (35.2%) | 212 (2.6%) |
| 3-Person Households | 1,031 (12.7%) | 18 (0.2%) |
| 4-Person Households | 1,201 (14.8%) | 8 (0.1%) |
| 5-Person Households | 370 (4.6%) | 4 (0.1%) |
| 6-Person Households | 140 (1.7%) | 0 (0.0%) |
| 7+ Person Households | 148 (1.8%) | 0 (0.0%) |
| Total | 5,735 (70.9%) | 2,356 (29.1%) |
Female Fertility in Tippah County
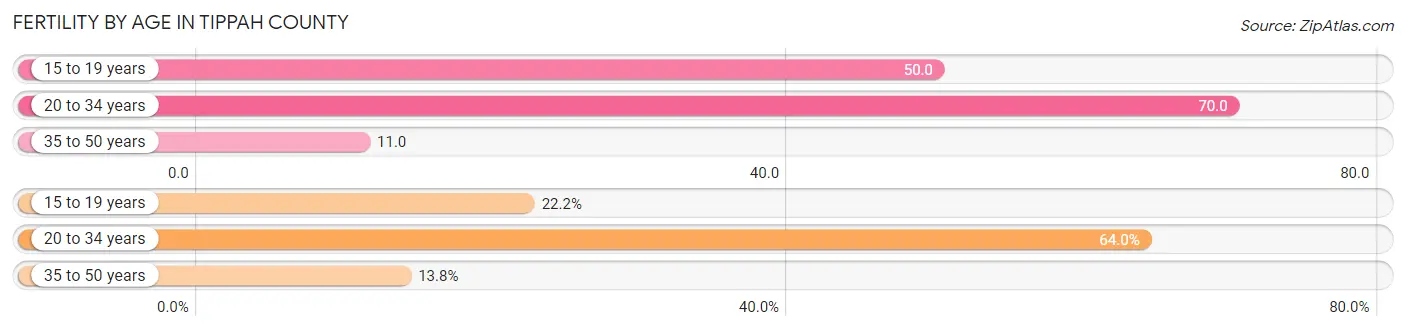
Fertility by Age in Tippah County
Average fertility rate in Tippah County is 39.0 births per 1,000 women. Women in the age bracket of 20 to 34 years have the highest fertility rate with 70.0 births per 1,000 women. Women in the age bracket of 20 to 34 years acount for 64.0% of all women with births.
| Age Bracket | Women with Births | Births / 1,000 Women |
| 15 to 19 years | 45 (22.2%) | 50.0 |
| 20 to 34 years | 130 (64.0%) | 70.0 |
| 35 to 50 years | 28 (13.8%) | 11.0 |
| Total | 203 (100.0%) | 39.0 |
Fertility by Age by Marriage Status in Tippah County
79.8% of women with births (203) in Tippah County are married. The highest percentage of unmarried women with births falls into 15 to 19 years age bracket with 88.9% of them unmarried at the time of birth, while the lowest percentage of unmarried women with births belong to 35 to 50 years age bracket with 0.0% of them unmarried.
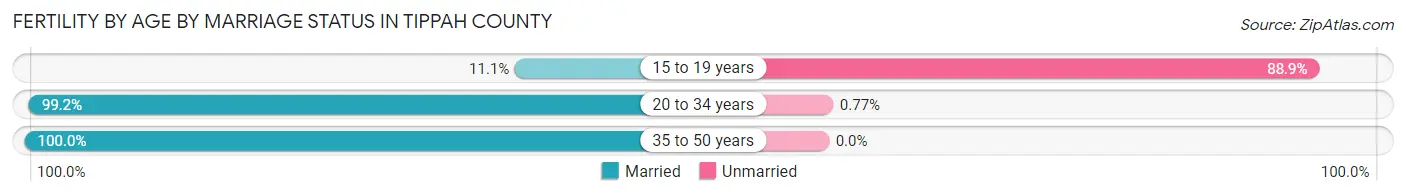
| Age Bracket | Married | Unmarried |
| 15 to 19 years | 5 (11.1%) | 40 (88.9%) |
| 20 to 34 years | 129 (99.2%) | 1 (0.8%) |
| 35 to 50 years | 28 (100.0%) | 0 (0.0%) |
| Total | 162 (79.8%) | 41 (20.2%) |
Fertility by Education in Tippah County
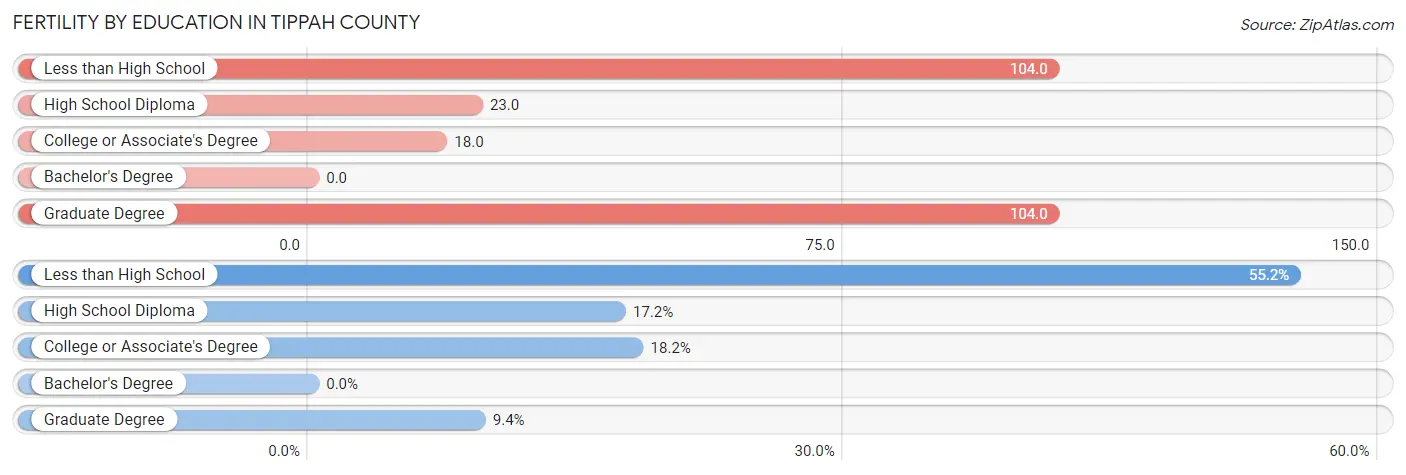
| Educational Attainment | Women with Births | Births / 1,000 Women |
| Less than High School | 112 (55.2%) | 104.0 |
| High School Diploma | 35 (17.2%) | 23.0 |
| College or Associate's Degree | 37 (18.2%) | 18.0 |
| Bachelor's Degree | 0 (0.0%) | 0.0 |
| Graduate Degree | 19 (9.4%) | 104.0 |
| Total | 203 (100.0%) | 39.0 |
Fertility by Education by Marriage Status in Tippah County
20.2% of women with births in Tippah County are unmarried. Women with the educational attainment of high school diploma are most likely to be married with 100.0% of them married at childbirth, while women with the educational attainment of less than high school are least likely to be married with 35.7% of them unmarried at childbirth.
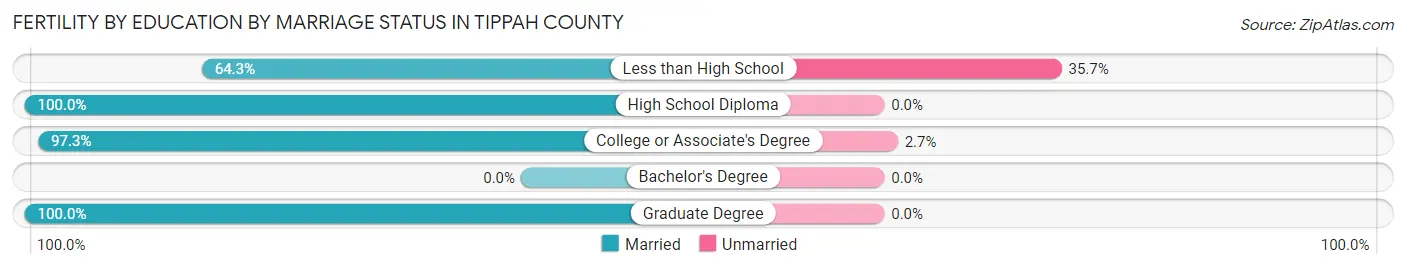
| Educational Attainment | Married | Unmarried |
| Less than High School | 72 (64.3%) | 40 (35.7%) |
| High School Diploma | 35 (100.0%) | 0 (0.0%) |
| College or Associate's Degree | 36 (97.3%) | 1 (2.7%) |
| Bachelor's Degree | 0 (0.0%) | 0 (0.0%) |
| Graduate Degree | 19 (100.0%) | 0 (0.0%) |
| Total | 162 (79.8%) | 41 (20.2%) |
Employment Characteristics in Tippah County
Employment by Class of Employer in Tippah County
Among the 9,100 employed individuals in Tippah County, private company employees (6,935 | 76.2%), local government employees (503 | 5.5%), and state government employees (460 | 5.1%) make up the most common classes of employment.
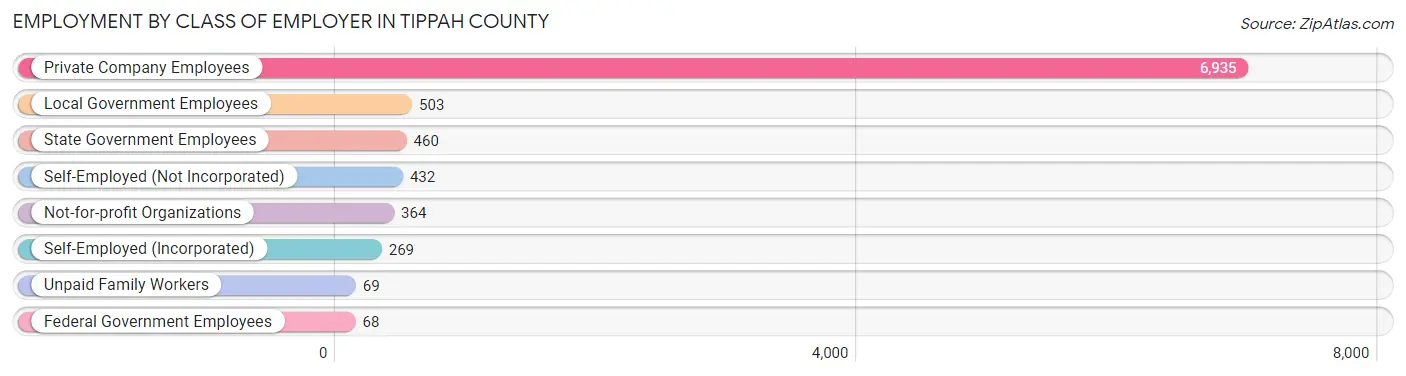
| Employer Class | # Employees | % Employees |
| Private Company Employees | 6,935 | 76.2% |
| Self-Employed (Incorporated) | 269 | 3.0% |
| Self-Employed (Not Incorporated) | 432 | 4.8% |
| Not-for-profit Organizations | 364 | 4.0% |
| Local Government Employees | 503 | 5.5% |
| State Government Employees | 460 | 5.1% |
| Federal Government Employees | 68 | 0.7% |
| Unpaid Family Workers | 69 | 0.8% |
| Total | 9,100 | 100.0% |
Employment Status by Age in Tippah County
According to the labor force statistics for Tippah County, out of the total population over 16 years of age (17,150), 57.3% or 9,827 individuals are in the labor force, with 6.0% or 590 of them unemployed. The age group with the highest labor force participation rate is 30 to 34 years, with 90.3% or 926 individuals in the labor force. Within the labor force, the 20 to 24 years age range has the highest percentage of unemployed individuals, with 14.5% or 133 of them being unemployed.
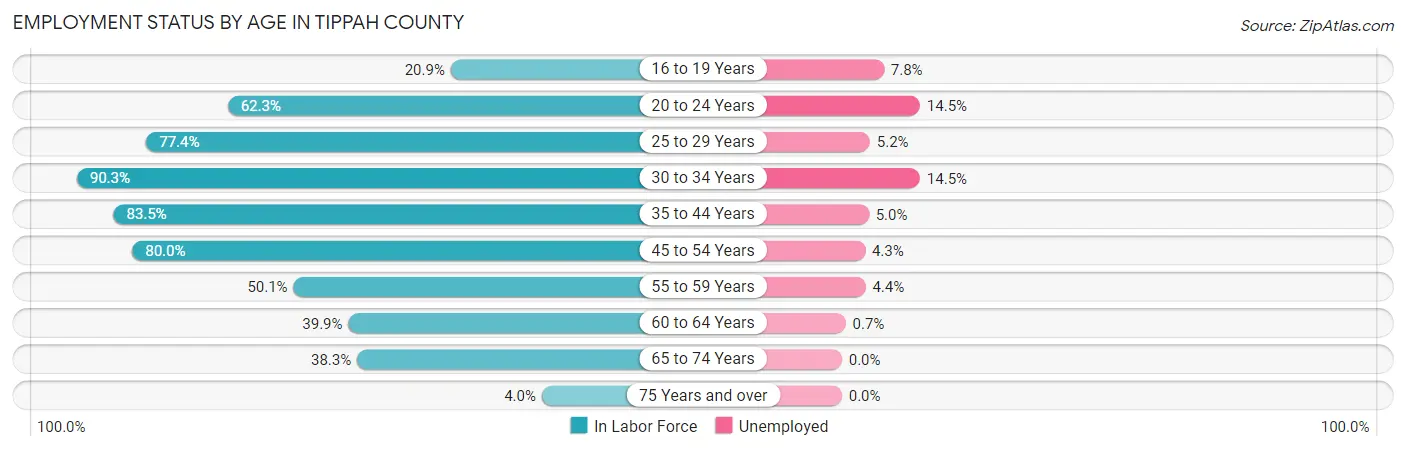
| Age Bracket | In Labor Force | Unemployed |
| 16 to 19 Years | 296 (20.9%) | 23 (7.8%) |
| 20 to 24 Years | 916 (62.3%) | 133 (14.5%) |
| 25 to 29 Years | 964 (77.4%) | 50 (5.2%) |
| 30 to 34 Years | 926 (90.3%) | 134 (14.5%) |
| 35 to 44 Years | 2,216 (83.5%) | 111 (5.0%) |
| 45 to 54 Years | 2,348 (80.0%) | 101 (4.3%) |
| 55 to 59 Years | 686 (50.1%) | 30 (4.4%) |
| 60 to 64 Years | 549 (39.9%) | 4 (0.7%) |
| 65 to 74 Years | 861 (38.3%) | 0 (0.0%) |
| 75 Years and over | 56 (4.0%) | 0 (0.0%) |
| Total | 9,827 (57.3%) | 590 (6.0%) |
Employment Status by Educational Attainment in Tippah County
According to labor force statistics for Tippah County, 72.5% of individuals (7,689) out of the total population between 25 and 64 years of age (10,605) are in the labor force, with 5.6% or 431 of them being unemployed. The group with the highest labor force participation rate are those with the educational attainment of college / associate degree, with 84.8% or 3,021 individuals in the labor force. Within the labor force, individuals with less than high school education have the highest percentage of unemployment, with 11.4% or 149 of them being unemployed.
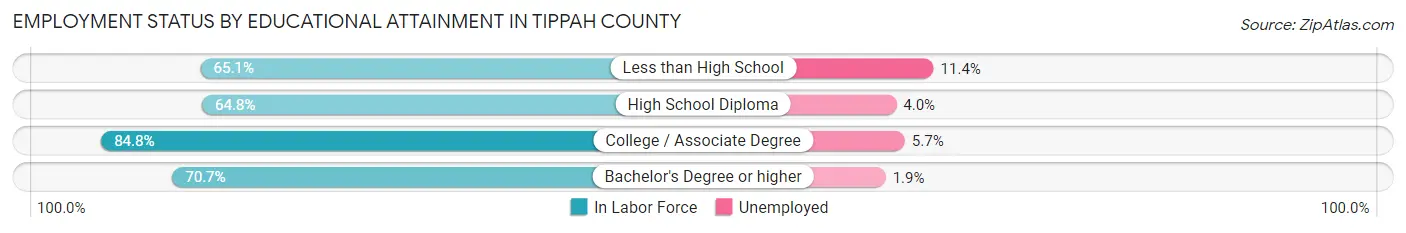
| Educational Attainment | In Labor Force | Unemployed |
| Less than High School | 1,303 (65.1%) | 228 (11.4%) |
| High School Diploma | 2,153 (64.8%) | 133 (4.0%) |
| College / Associate Degree | 3,021 (84.8%) | 203 (5.7%) |
| Bachelor's Degree or higher | 1,215 (70.7%) | 33 (1.9%) |
| Total | 7,689 (72.5%) | 594 (5.6%) |
Employment Occupations by Sex in Tippah County
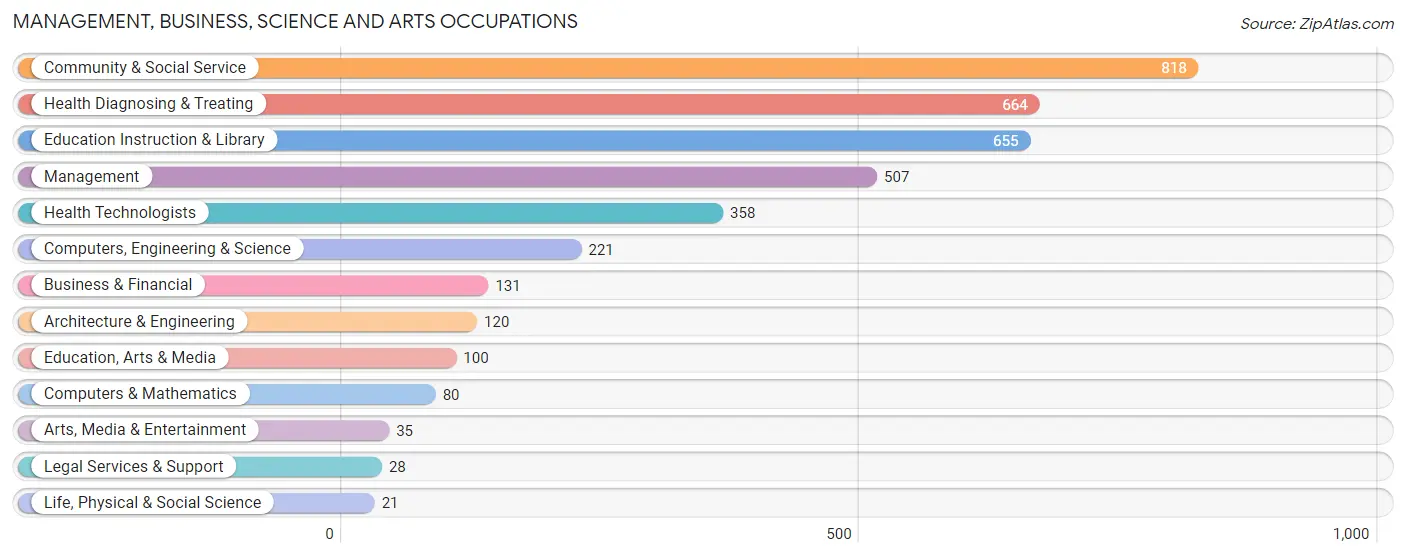
Management, Business, Science and Arts Occupations
The most common Management, Business, Science and Arts occupations in Tippah County are Community & Social Service (818 | 8.9%), Health Diagnosing & Treating (664 | 7.2%), Education Instruction & Library (655 | 7.1%), Management (507 | 5.5%), and Health Technologists (358 | 3.9%).
Management, Business, Science and Arts Occupations by Sex
Within the Management, Business, Science and Arts occupations in Tippah County, the most male-oriented occupations are Computers & Mathematics (100.0%), Arts, Media & Entertainment (100.0%), and Education, Arts & Media (97.0%), while the most female-oriented occupations are Legal Services & Support (100.0%), Health Technologists (97.2%), and Education Instruction & Library (90.1%).
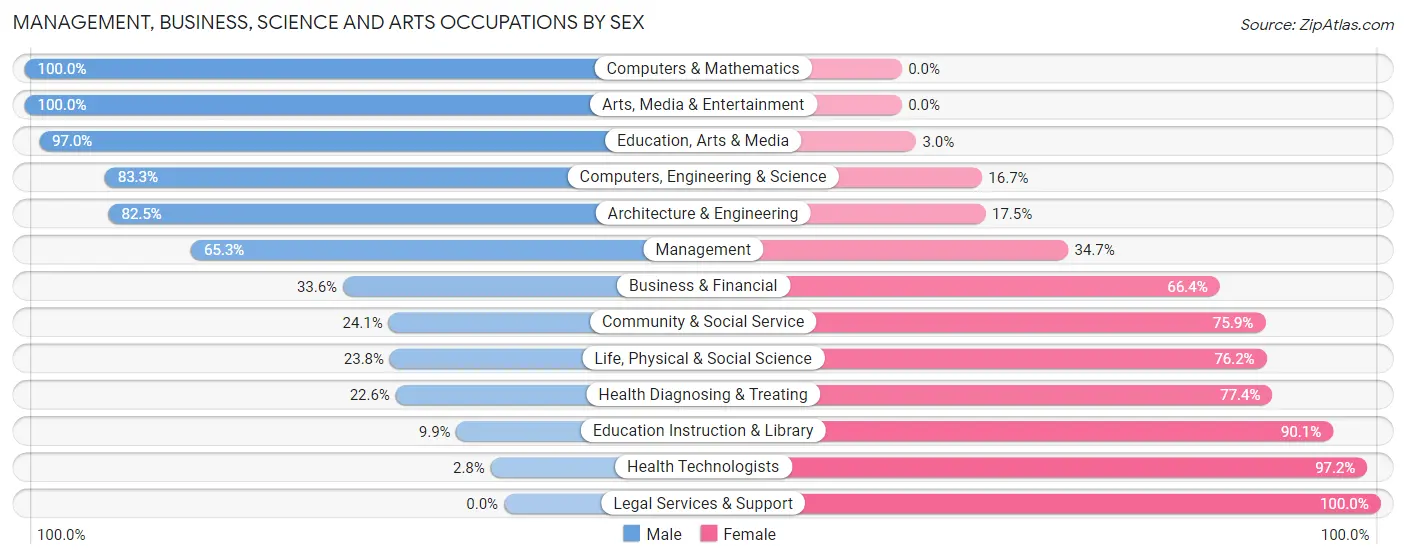
| Occupation | Male | Female |
| Management | 331 (65.3%) | 176 (34.7%) |
| Business & Financial | 44 (33.6%) | 87 (66.4%) |
| Computers, Engineering & Science | 184 (83.3%) | 37 (16.7%) |
| Computers & Mathematics | 80 (100.0%) | 0 (0.0%) |
| Architecture & Engineering | 99 (82.5%) | 21 (17.5%) |
| Life, Physical & Social Science | 5 (23.8%) | 16 (76.2%) |
| Community & Social Service | 197 (24.1%) | 621 (75.9%) |
| Education, Arts & Media | 97 (97.0%) | 3 (3.0%) |
| Legal Services & Support | 0 (0.0%) | 28 (100.0%) |
| Education Instruction & Library | 65 (9.9%) | 590 (90.1%) |
| Arts, Media & Entertainment | 35 (100.0%) | 0 (0.0%) |
| Health Diagnosing & Treating | 150 (22.6%) | 514 (77.4%) |
| Health Technologists | 10 (2.8%) | 348 (97.2%) |
| Total (Category) | 906 (38.7%) | 1,435 (61.3%) |
| Total (Overall) | 4,840 (52.4%) | 4,389 (47.6%) |
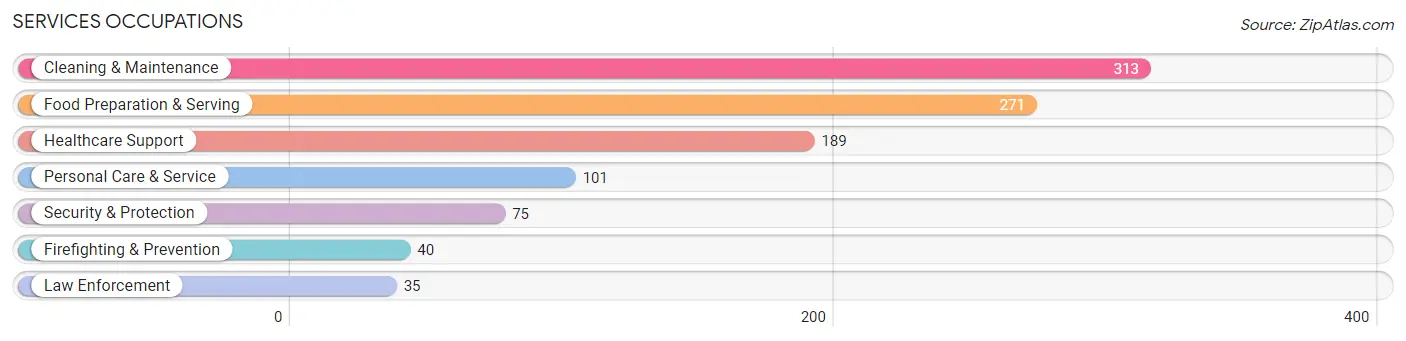
Services Occupations
The most common Services occupations in Tippah County are Cleaning & Maintenance (313 | 3.4%), Food Preparation & Serving (271 | 2.9%), Healthcare Support (189 | 2.1%), Personal Care & Service (101 | 1.1%), and Security & Protection (75 | 0.8%).
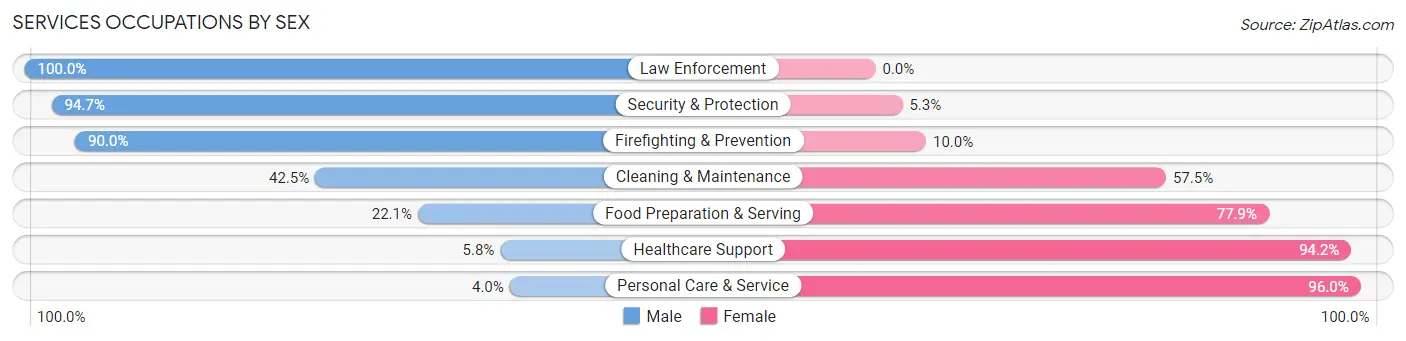
Services Occupations by Sex
Within the Services occupations in Tippah County, the most male-oriented occupations are Law Enforcement (100.0%), Security & Protection (94.7%), and Firefighting & Prevention (90.0%), while the most female-oriented occupations are Personal Care & Service (96.0%), Healthcare Support (94.2%), and Food Preparation & Serving (77.9%).
| Occupation | Male | Female |
| Healthcare Support | 11 (5.8%) | 178 (94.2%) |
| Security & Protection | 71 (94.7%) | 4 (5.3%) |
| Firefighting & Prevention | 36 (90.0%) | 4 (10.0%) |
| Law Enforcement | 35 (100.0%) | 0 (0.0%) |
| Food Preparation & Serving | 60 (22.1%) | 211 (77.9%) |
| Cleaning & Maintenance | 133 (42.5%) | 180 (57.5%) |
| Personal Care & Service | 4 (4.0%) | 97 (96.0%) |
| Total (Category) | 279 (29.4%) | 670 (70.6%) |
| Total (Overall) | 4,840 (52.4%) | 4,389 (47.6%) |
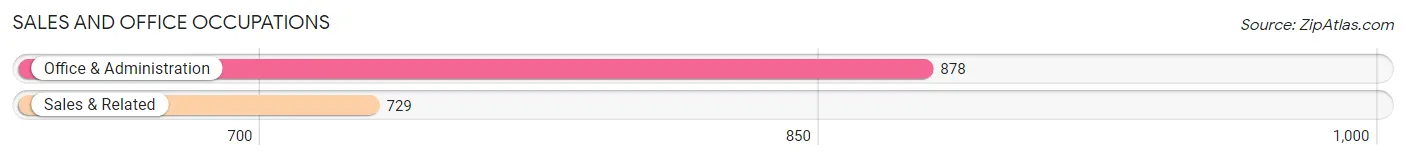
Sales and Office Occupations
The most common Sales and Office occupations in Tippah County are Office & Administration (878 | 9.5%), and Sales & Related (729 | 7.9%).
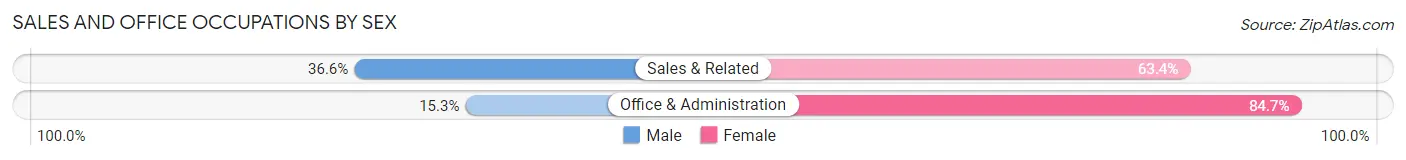
Sales and Office Occupations by Sex
| Occupation | Male | Female |
| Sales & Related | 267 (36.6%) | 462 (63.4%) |
| Office & Administration | 134 (15.3%) | 744 (84.7%) |
| Total (Category) | 401 (24.9%) | 1,206 (75.0%) |
| Total (Overall) | 4,840 (52.4%) | 4,389 (47.6%) |
Natural Resources, Construction and Maintenance Occupations
The most common Natural Resources, Construction and Maintenance occupations in Tippah County are Construction & Extraction (608 | 6.6%), Installation, Maintenance & Repair (369 | 4.0%), and Farming, Fishing & Forestry (81 | 0.9%).
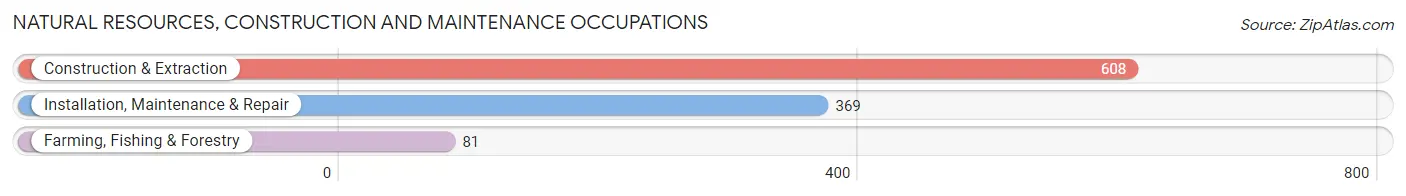
Natural Resources, Construction and Maintenance Occupations by Sex
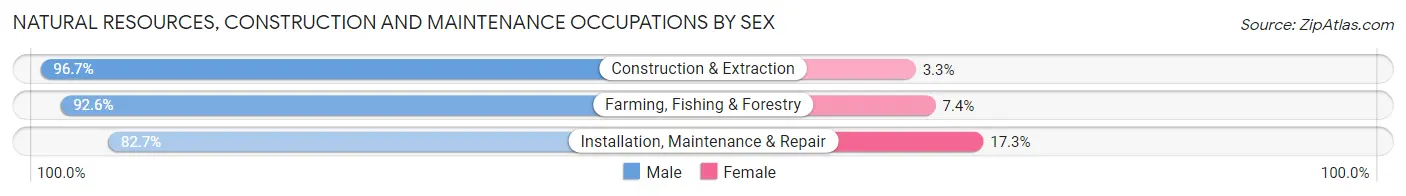
| Occupation | Male | Female |
| Farming, Fishing & Forestry | 75 (92.6%) | 6 (7.4%) |
| Construction & Extraction | 588 (96.7%) | 20 (3.3%) |
| Installation, Maintenance & Repair | 305 (82.7%) | 64 (17.3%) |
| Total (Category) | 968 (91.5%) | 90 (8.5%) |
| Total (Overall) | 4,840 (52.4%) | 4,389 (47.6%) |
Production, Transportation and Moving Occupations
The most common Production, Transportation and Moving occupations in Tippah County are Production (1,774 | 19.2%), Material Moving (994 | 10.8%), and Transportation (506 | 5.5%).
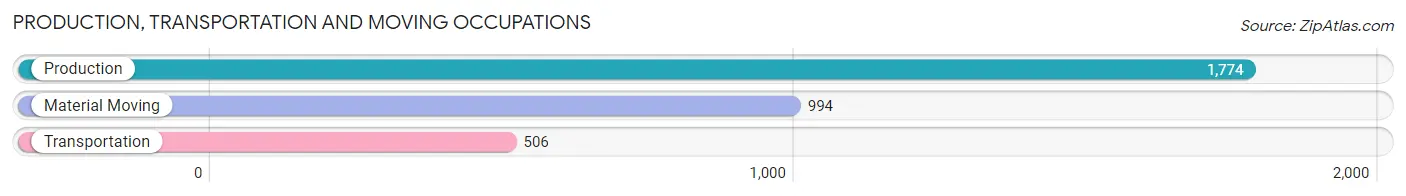
Production, Transportation and Moving Occupations by Sex
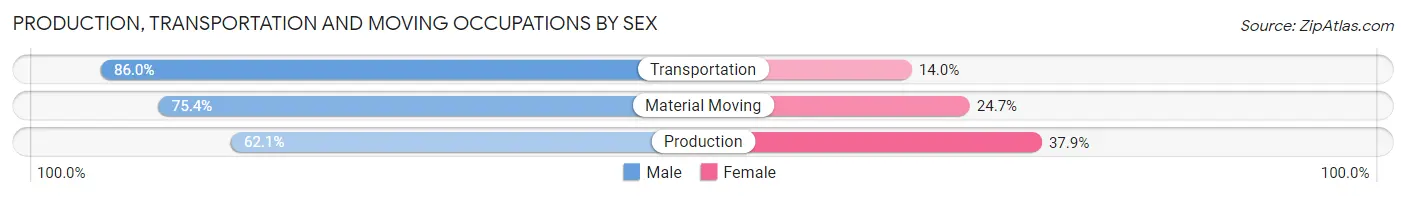
| Occupation | Male | Female |
| Production | 1,102 (62.1%) | 672 (37.9%) |
| Transportation | 435 (86.0%) | 71 (14.0%) |
| Material Moving | 749 (75.3%) | 245 (24.6%) |
| Total (Category) | 2,286 (69.8%) | 988 (30.2%) |
| Total (Overall) | 4,840 (52.4%) | 4,389 (47.6%) |
Employment Industries by Sex in Tippah County
Employment Industries in Tippah County
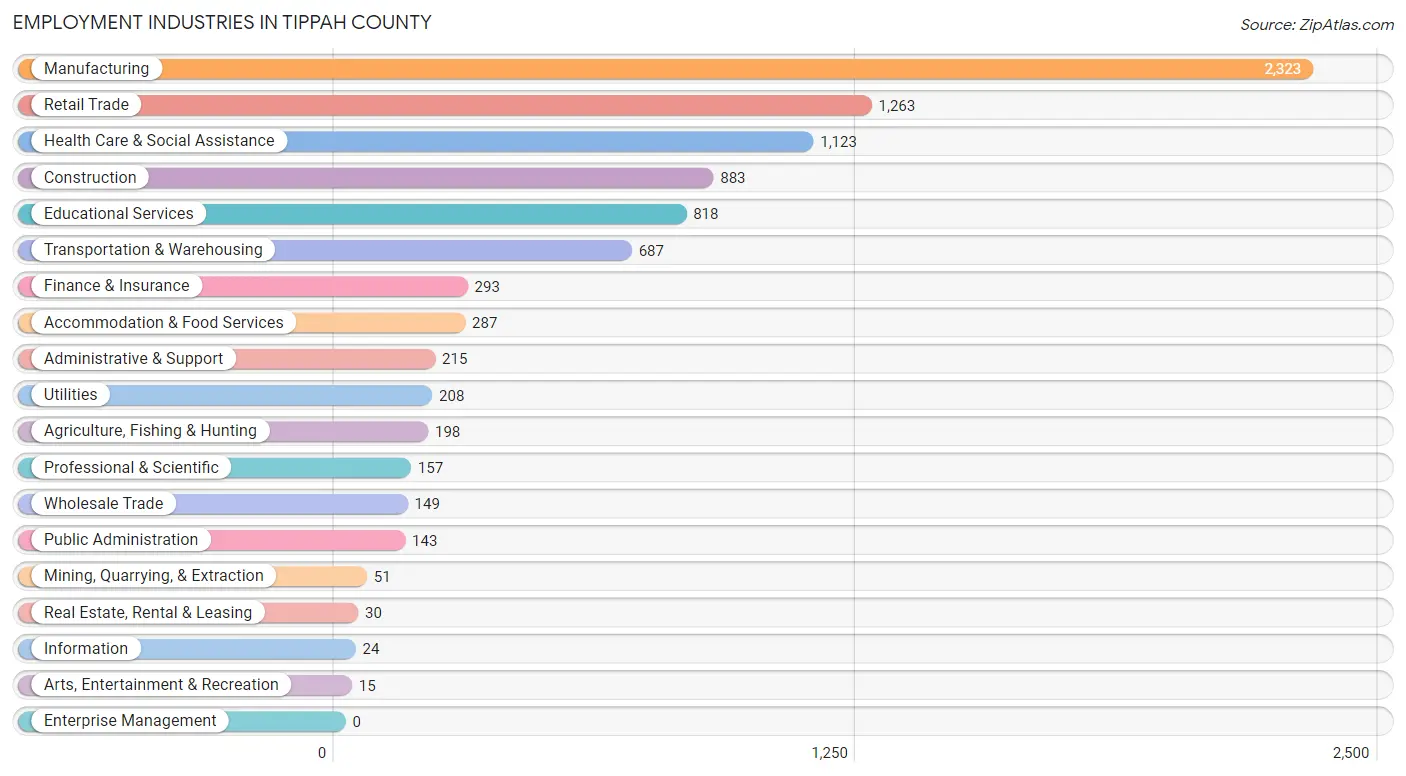
The major employment industries in Tippah County include Manufacturing (2,323 | 25.2%), Retail Trade (1,263 | 13.7%), Health Care & Social Assistance (1,123 | 12.2%), Construction (883 | 9.6%), and Educational Services (818 | 8.9%).
Employment Industries by Sex in Tippah County
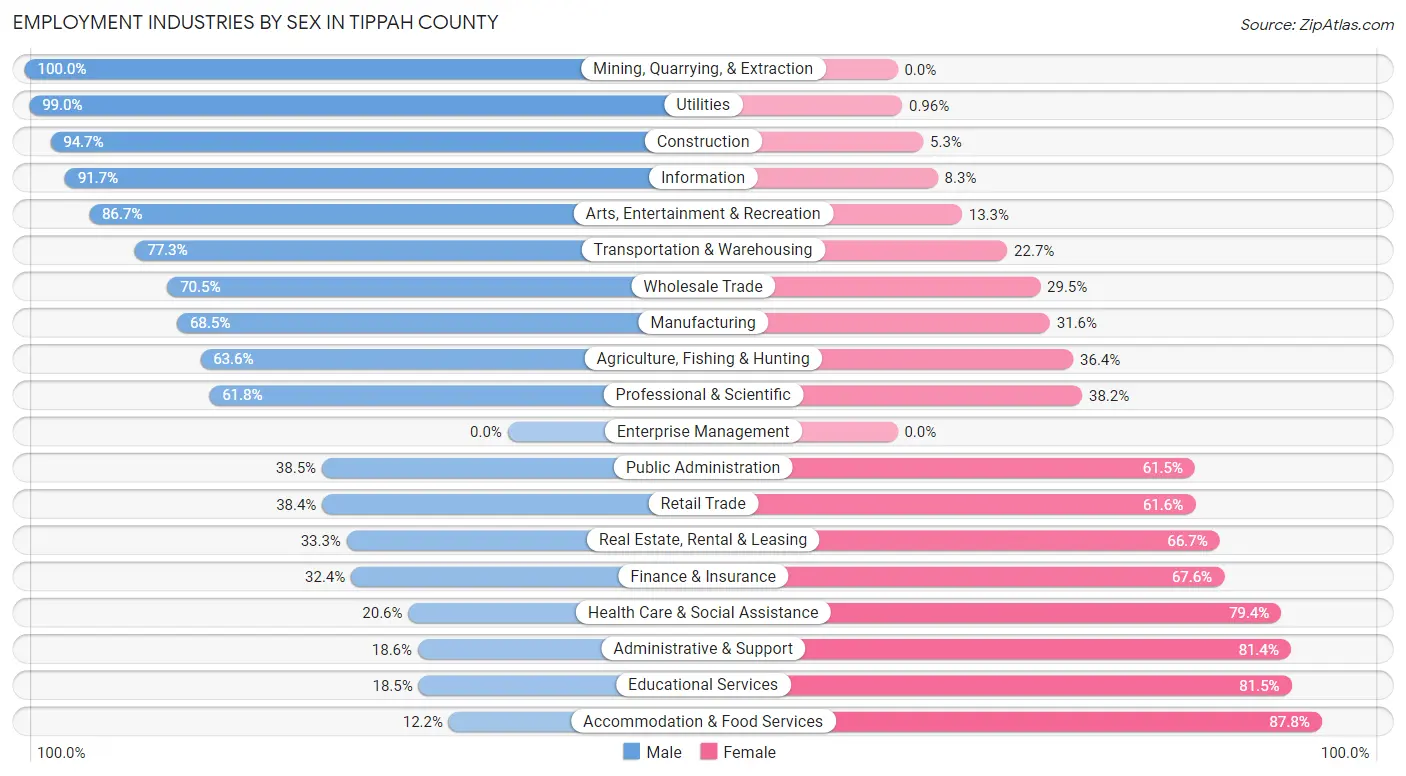
The Tippah County industries that see more men than women are Mining, Quarrying, & Extraction (100.0%), Utilities (99.0%), and Construction (94.7%), whereas the industries that tend to have a higher number of women are Accommodation & Food Services (87.8%), Educational Services (81.5%), and Administrative & Support (81.4%).
| Industry | Male | Female |
| Agriculture, Fishing & Hunting | 126 (63.6%) | 72 (36.4%) |
| Mining, Quarrying, & Extraction | 51 (100.0%) | 0 (0.0%) |
| Construction | 836 (94.7%) | 47 (5.3%) |
| Manufacturing | 1,590 (68.4%) | 733 (31.6%) |
| Wholesale Trade | 105 (70.5%) | 44 (29.5%) |
| Retail Trade | 485 (38.4%) | 778 (61.6%) |
| Transportation & Warehousing | 531 (77.3%) | 156 (22.7%) |
| Utilities | 206 (99.0%) | 2 (1.0%) |
| Information | 22 (91.7%) | 2 (8.3%) |
| Finance & Insurance | 95 (32.4%) | 198 (67.6%) |
| Real Estate, Rental & Leasing | 10 (33.3%) | 20 (66.7%) |
| Professional & Scientific | 97 (61.8%) | 60 (38.2%) |
| Enterprise Management | 0 (0.0%) | 0 (0.0%) |
| Administrative & Support | 40 (18.6%) | 175 (81.4%) |
| Educational Services | 151 (18.5%) | 667 (81.5%) |
| Health Care & Social Assistance | 231 (20.6%) | 892 (79.4%) |
| Arts, Entertainment & Recreation | 13 (86.7%) | 2 (13.3%) |
| Accommodation & Food Services | 35 (12.2%) | 252 (87.8%) |
| Public Administration | 55 (38.5%) | 88 (61.5%) |
| Total | 4,840 (52.4%) | 4,389 (47.6%) |
Education in Tippah County
School Enrollment in Tippah County
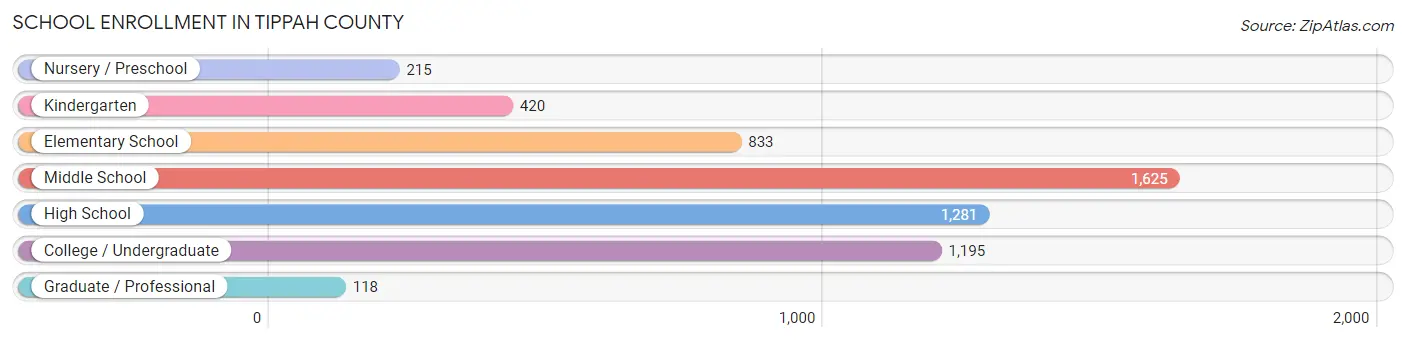
The most common levels of schooling among the 5,687 students in Tippah County are middle school (1,625 | 28.6%), high school (1,281 | 22.5%), and college / undergraduate (1,195 | 21.0%).
| School Level | # Students | % Students |
| Nursery / Preschool | 215 | 3.8% |
| Kindergarten | 420 | 7.4% |
| Elementary School | 833 | 14.6% |
| Middle School | 1,625 | 28.6% |
| High School | 1,281 | 22.5% |
| College / Undergraduate | 1,195 | 21.0% |
| Graduate / Professional | 118 | 2.1% |
| Total | 5,687 | 100.0% |
School Enrollment by Age by Funding Source in Tippah County
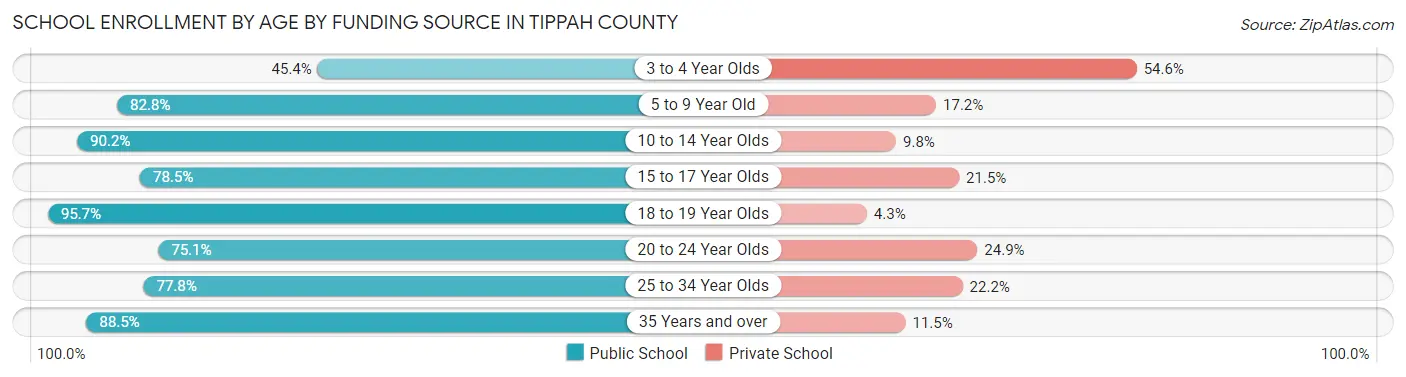
Out of a total of 5,687 students who are enrolled in schools in Tippah County, 927 (16.3%) attend a private institution, while the remaining 4,760 (83.7%) are enrolled in public schools. The age group of 3 to 4 year olds has the highest likelihood of being enrolled in private schools, with 137 (54.6% in the age bracket) enrolled. Conversely, the age group of 18 to 19 year olds has the lowest likelihood of being enrolled in a private school, with 619 (95.7% in the age bracket) attending a public institution.
| Age Bracket | Public School | Private School |
| 3 to 4 Year Olds | 114 (45.4%) | 137 (54.6%) |
| 5 to 9 Year Old | 822 (82.8%) | 171 (17.2%) |
| 10 to 14 Year Olds | 1,737 (90.2%) | 188 (9.8%) |
| 15 to 17 Year Olds | 719 (78.5%) | 197 (21.5%) |
| 18 to 19 Year Olds | 619 (95.7%) | 28 (4.3%) |
| 20 to 24 Year Olds | 428 (75.1%) | 142 (24.9%) |
| 25 to 34 Year Olds | 151 (77.8%) | 43 (22.2%) |
| 35 Years and over | 169 (88.5%) | 22 (11.5%) |
| Total | 4,760 (83.7%) | 927 (16.3%) |
Educational Attainment by Field of Study in Tippah County
Education (724 | 30.2%), business (469 | 19.6%), science & technology (335 | 14.0%), psychology (174 | 7.3%), and bio, nature & agricultural (170 | 7.1%) are the most common fields of study among 2,397 individuals in Tippah County who have obtained a bachelor's degree or higher.
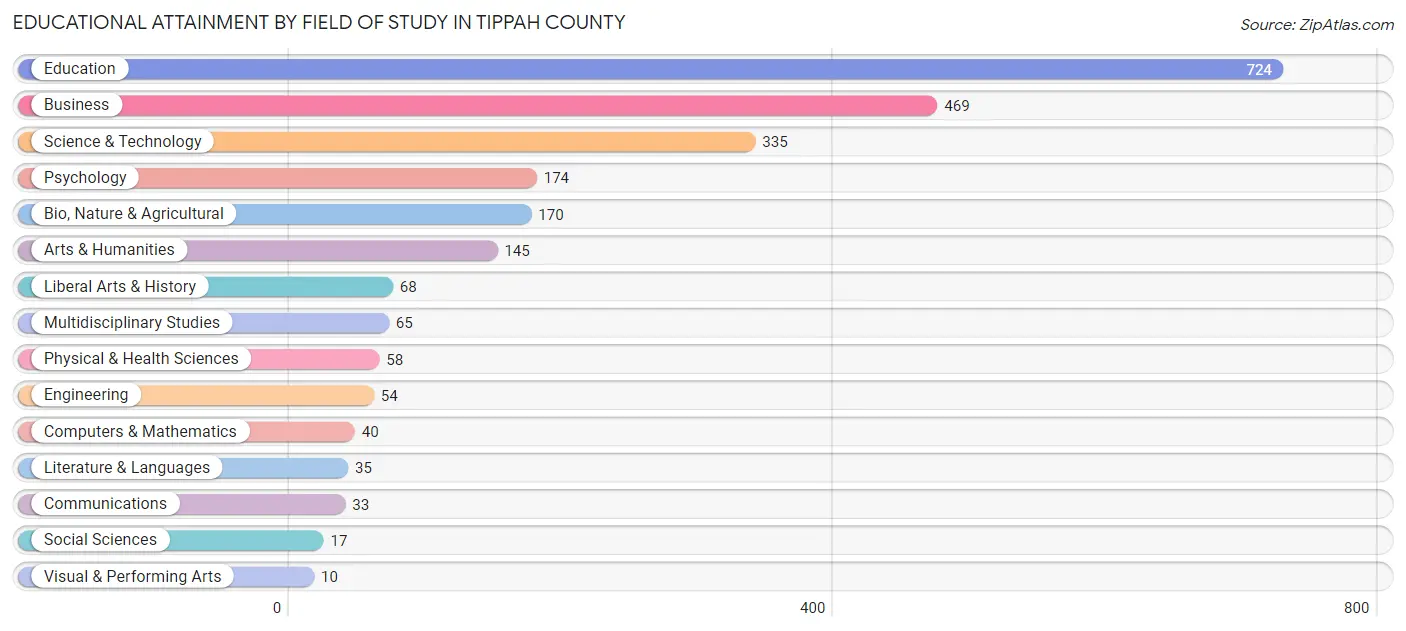
| Field of Study | # Graduates | % Graduates |
| Computers & Mathematics | 40 | 1.7% |
| Bio, Nature & Agricultural | 170 | 7.1% |
| Physical & Health Sciences | 58 | 2.4% |
| Psychology | 174 | 7.3% |
| Social Sciences | 17 | 0.7% |
| Engineering | 54 | 2.2% |
| Multidisciplinary Studies | 65 | 2.7% |
| Science & Technology | 335 | 14.0% |
| Business | 469 | 19.6% |
| Education | 724 | 30.2% |
| Literature & Languages | 35 | 1.5% |
| Liberal Arts & History | 68 | 2.8% |
| Visual & Performing Arts | 10 | 0.4% |
| Communications | 33 | 1.4% |
| Arts & Humanities | 145 | 6.0% |
| Total | 2,397 | 100.0% |
Transportation & Commute in Tippah County
Vehicle Availability by Sex in Tippah County
The most prevalent vehicle ownership categories in Tippah County are males with 2 vehicles (1,662, accounting for 34.7%) and females with 2 vehicles (1,770, making up 39.3%).
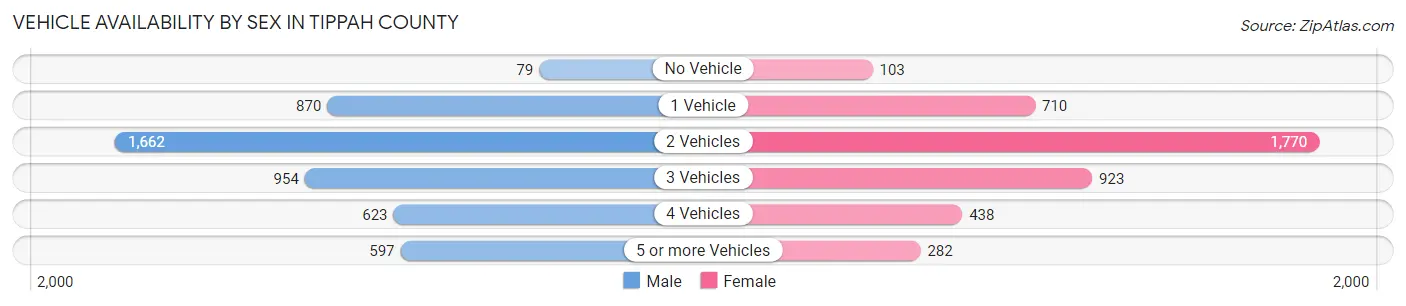
| Vehicles Available | Male | Female |
| No Vehicle | 79 (1.7%) | 103 (2.4%) |
| 1 Vehicle | 870 (18.2%) | 710 (16.8%) |
| 2 Vehicles | 1,662 (34.7%) | 1,770 (41.9%) |
| 3 Vehicles | 954 (19.9%) | 923 (21.8%) |
| 4 Vehicles | 623 (13.0%) | 438 (10.4%) |
| 5 or more Vehicles | 597 (12.5%) | 282 (6.7%) |
| Total | 4,785 (100.0%) | 4,226 (100.0%) |
Commute Time in Tippah County
The most frequently occuring commute durations in Tippah County are 20 to 24 minutes (1,505 commuters, 17.1%), 10 to 14 minutes (1,503 commuters, 17.0%), and 30 to 34 minutes (1,276 commuters, 14.4%).
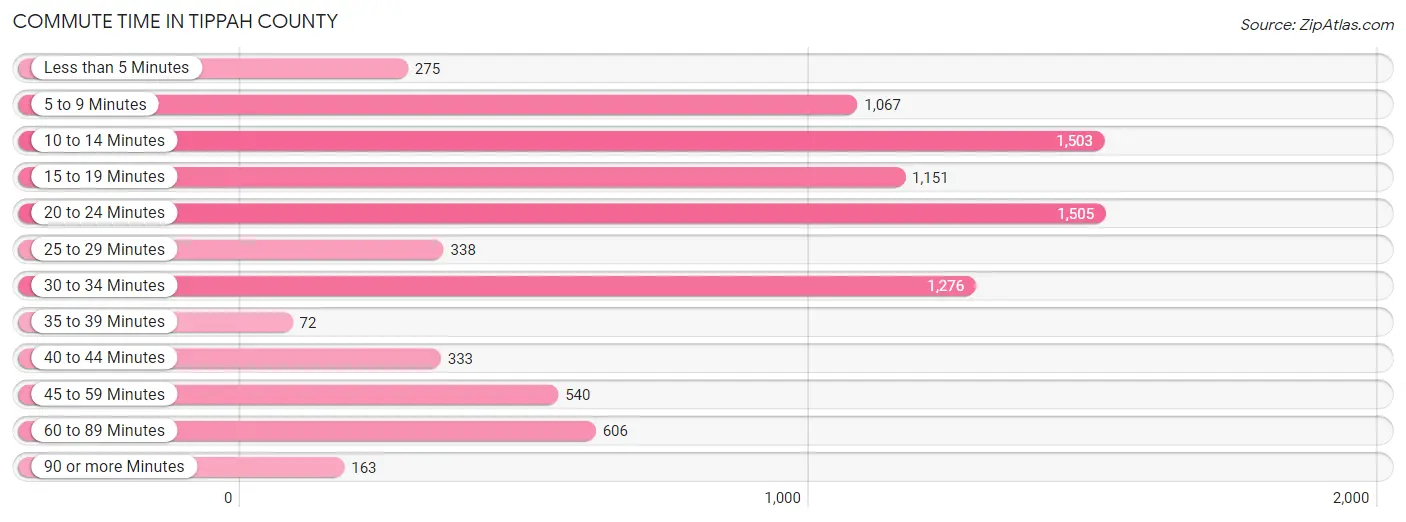
| Commute Time | # Commuters | % Commuters |
| Less than 5 Minutes | 275 | 3.1% |
| 5 to 9 Minutes | 1,067 | 12.1% |
| 10 to 14 Minutes | 1,503 | 17.0% |
| 15 to 19 Minutes | 1,151 | 13.0% |
| 20 to 24 Minutes | 1,505 | 17.1% |
| 25 to 29 Minutes | 338 | 3.8% |
| 30 to 34 Minutes | 1,276 | 14.4% |
| 35 to 39 Minutes | 72 | 0.8% |
| 40 to 44 Minutes | 333 | 3.8% |
| 45 to 59 Minutes | 540 | 6.1% |
| 60 to 89 Minutes | 606 | 6.9% |
| 90 or more Minutes | 163 | 1.8% |
Commute Time by Sex in Tippah County
The most common commute times in Tippah County are 20 to 24 minutes (855 commuters, 18.3%) for males and 10 to 14 minutes (811 commuters, 19.5%) for females.
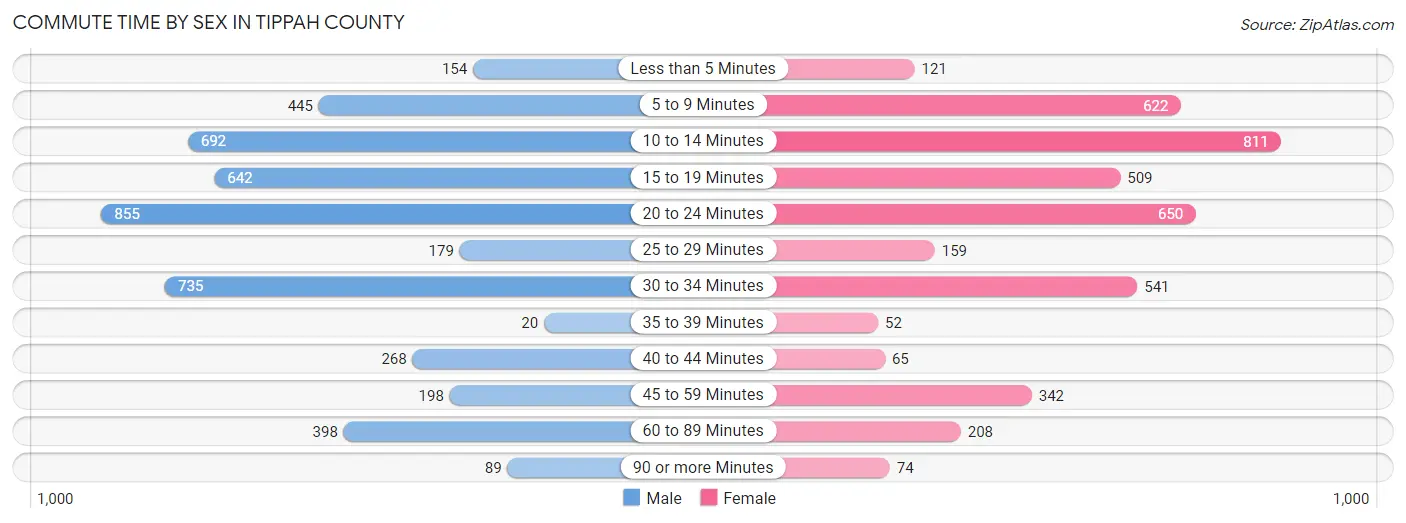
| Commute Time | Male | Female |
| Less than 5 Minutes | 154 (3.3%) | 121 (2.9%) |
| 5 to 9 Minutes | 445 (9.5%) | 622 (15.0%) |
| 10 to 14 Minutes | 692 (14.8%) | 811 (19.5%) |
| 15 to 19 Minutes | 642 (13.7%) | 509 (12.2%) |
| 20 to 24 Minutes | 855 (18.3%) | 650 (15.7%) |
| 25 to 29 Minutes | 179 (3.8%) | 159 (3.8%) |
| 30 to 34 Minutes | 735 (15.7%) | 541 (13.0%) |
| 35 to 39 Minutes | 20 (0.4%) | 52 (1.3%) |
| 40 to 44 Minutes | 268 (5.7%) | 65 (1.6%) |
| 45 to 59 Minutes | 198 (4.2%) | 342 (8.2%) |
| 60 to 89 Minutes | 398 (8.5%) | 208 (5.0%) |
| 90 or more Minutes | 89 (1.9%) | 74 (1.8%) |
Time of Departure to Work by Sex in Tippah County
The most frequent times of departure to work in Tippah County are 6:00 AM to 6:29 AM (869, 18.6%) for males and 7:00 AM to 7:29 AM (1,062, 25.6%) for females.
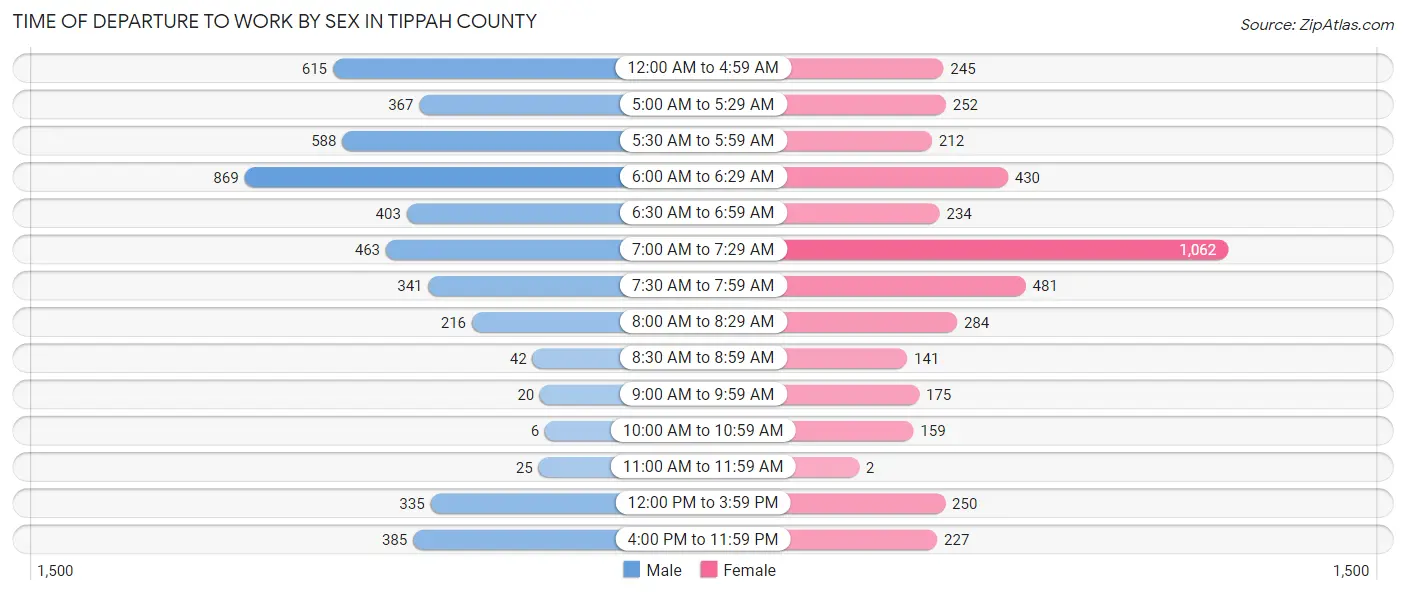
| Time of Departure | Male | Female |
| 12:00 AM to 4:59 AM | 615 (13.2%) | 245 (5.9%) |
| 5:00 AM to 5:29 AM | 367 (7.9%) | 252 (6.1%) |
| 5:30 AM to 5:59 AM | 588 (12.6%) | 212 (5.1%) |
| 6:00 AM to 6:29 AM | 869 (18.6%) | 430 (10.3%) |
| 6:30 AM to 6:59 AM | 403 (8.6%) | 234 (5.6%) |
| 7:00 AM to 7:29 AM | 463 (9.9%) | 1,062 (25.6%) |
| 7:30 AM to 7:59 AM | 341 (7.3%) | 481 (11.6%) |
| 8:00 AM to 8:29 AM | 216 (4.6%) | 284 (6.8%) |
| 8:30 AM to 8:59 AM | 42 (0.9%) | 141 (3.4%) |
| 9:00 AM to 9:59 AM | 20 (0.4%) | 175 (4.2%) |
| 10:00 AM to 10:59 AM | 6 (0.1%) | 159 (3.8%) |
| 11:00 AM to 11:59 AM | 25 (0.5%) | 2 (0.1%) |
| 12:00 PM to 3:59 PM | 335 (7.2%) | 250 (6.0%) |
| 4:00 PM to 11:59 PM | 385 (8.2%) | 227 (5.5%) |
| Total | 4,675 (100.0%) | 4,154 (100.0%) |
Housing Occupancy in Tippah County
Occupancy by Ownership in Tippah County
Of the total 8,091 dwellings in Tippah County, owner-occupied units account for 5,879 (72.7%), while renter-occupied units make up 2,212 (27.3%).
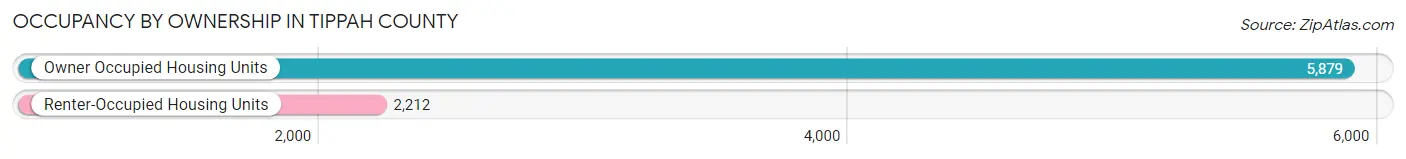
| Occupancy | # Housing Units | % Housing Units |
| Owner Occupied Housing Units | 5,879 | 72.7% |
| Renter-Occupied Housing Units | 2,212 | 27.3% |
| Total Occupied Housing Units | 8,091 | 100.0% |
Occupancy by Household Size in Tippah County
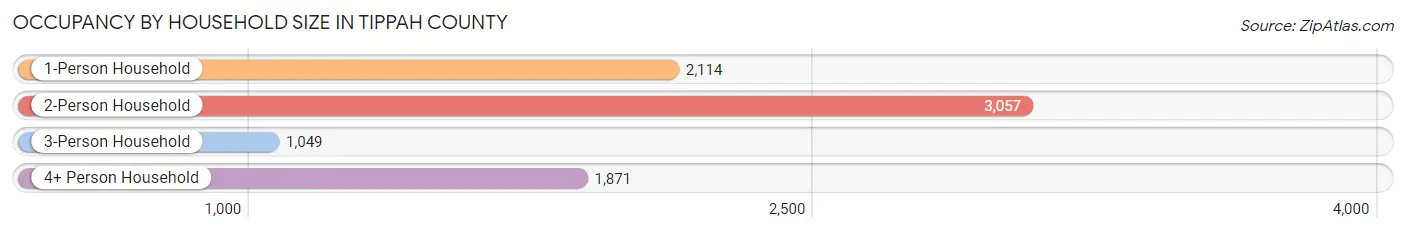
| Household Size | # Housing Units | % Housing Units |
| 1-Person Household | 2,114 | 26.1% |
| 2-Person Household | 3,057 | 37.8% |
| 3-Person Household | 1,049 | 13.0% |
| 4+ Person Household | 1,871 | 23.1% |
| Total Housing Units | 8,091 | 100.0% |
Occupancy by Ownership by Household Size in Tippah County
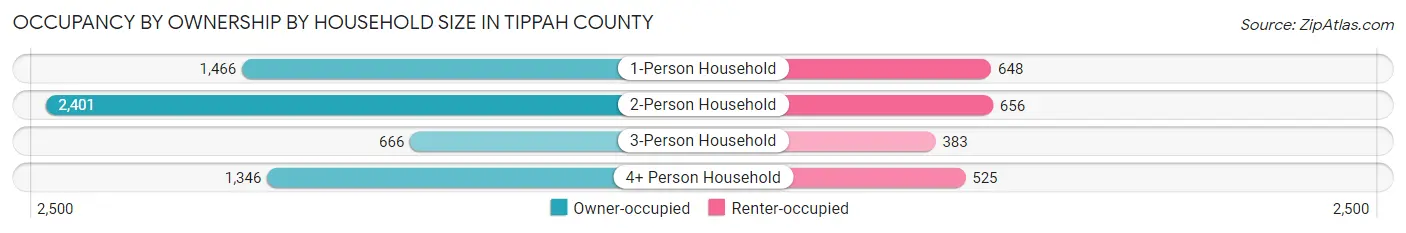
| Household Size | Owner-occupied | Renter-occupied |
| 1-Person Household | 1,466 (69.4%) | 648 (30.6%) |
| 2-Person Household | 2,401 (78.5%) | 656 (21.5%) |
| 3-Person Household | 666 (63.5%) | 383 (36.5%) |
| 4+ Person Household | 1,346 (71.9%) | 525 (28.1%) |
| Total Housing Units | 5,879 (72.7%) | 2,212 (27.3%) |
Occupancy by Educational Attainment in Tippah County
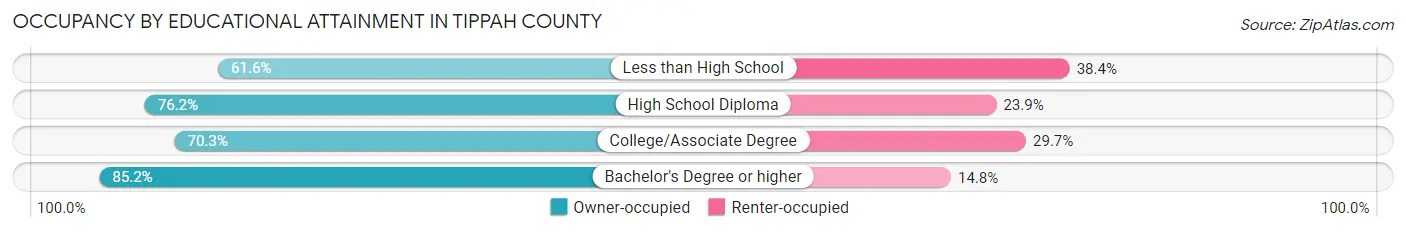
| Household Size | Owner-occupied | Renter-occupied |
| Less than High School | 1,114 (61.6%) | 694 (38.4%) |
| High School Diploma | 1,775 (76.1%) | 556 (23.8%) |
| College/Associate Degree | 1,773 (70.3%) | 750 (29.7%) |
| Bachelor's Degree or higher | 1,217 (85.2%) | 212 (14.8%) |
Occupancy by Age of Householder in Tippah County
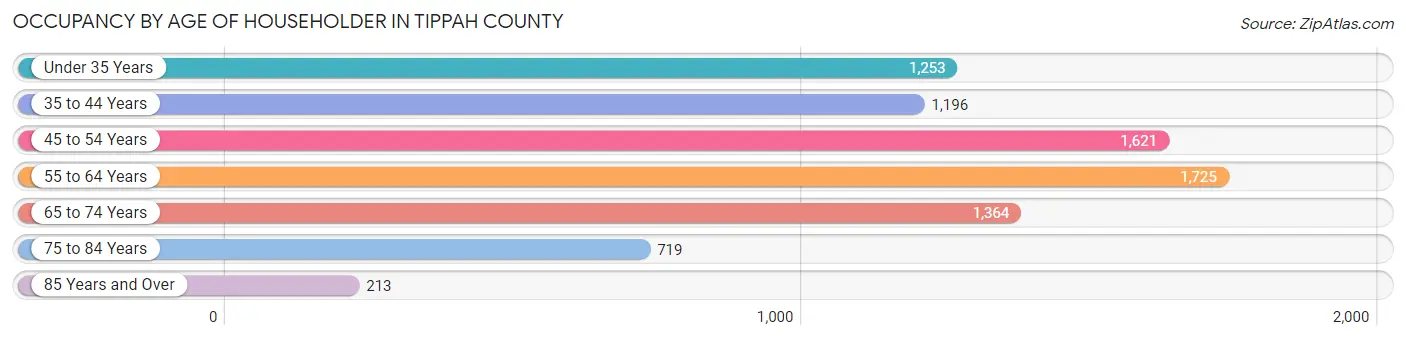
| Age Bracket | # Households | % Households |
| Under 35 Years | 1,253 | 15.5% |
| 35 to 44 Years | 1,196 | 14.8% |
| 45 to 54 Years | 1,621 | 20.0% |
| 55 to 64 Years | 1,725 | 21.3% |
| 65 to 74 Years | 1,364 | 16.9% |
| 75 to 84 Years | 719 | 8.9% |
| 85 Years and Over | 213 | 2.6% |
| Total | 8,091 | 100.0% |
Housing Finances in Tippah County
Median Income by Occupancy in Tippah County
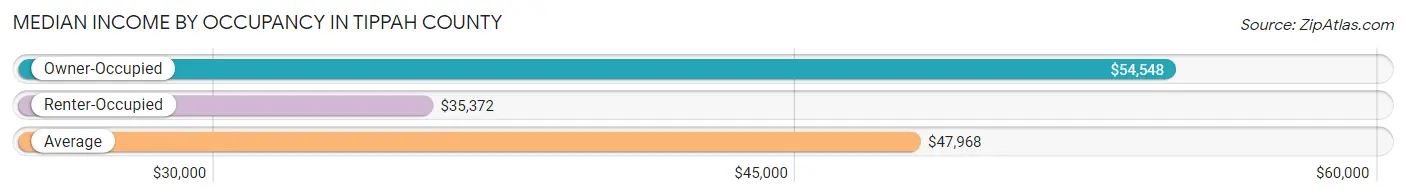
| Occupancy Type | # Households | Median Income |
| Owner-Occupied | 5,879 (72.7%) | $54,548 |
| Renter-Occupied | 2,212 (27.3%) | $35,372 |
| Average | 8,091 (100.0%) | $47,968 |
Occupancy by Householder Income Bracket in Tippah County
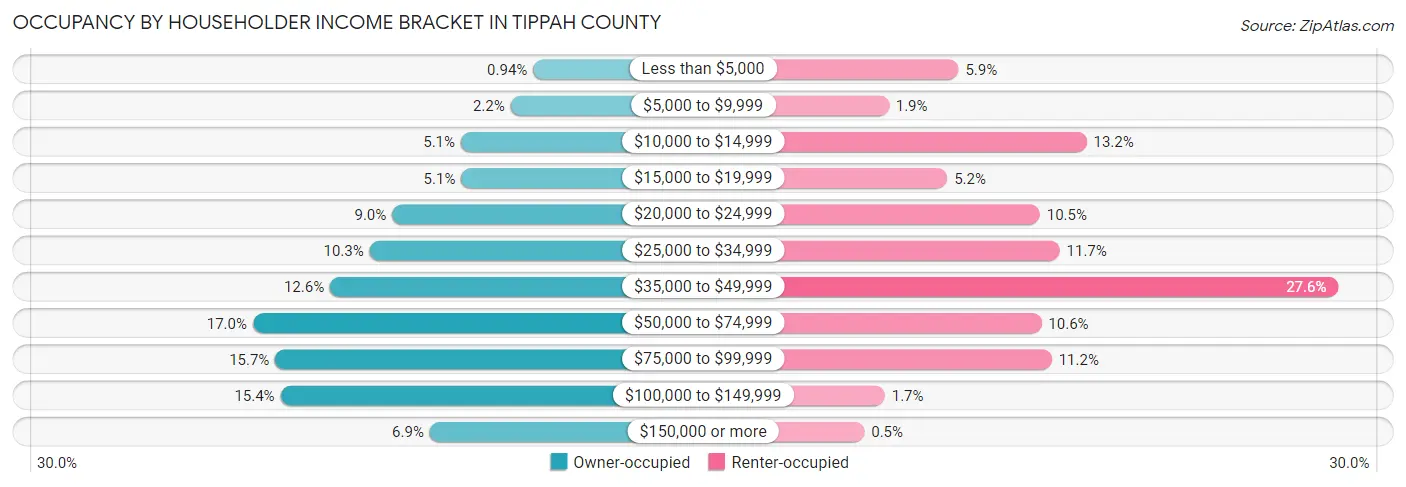
| Income Bracket | Owner-occupied | Renter-occupied |
| Less than $5,000 | 55 (0.9%) | 130 (5.9%) |
| $5,000 to $9,999 | 131 (2.2%) | 42 (1.9%) |
| $10,000 to $14,999 | 298 (5.1%) | 292 (13.2%) |
| $15,000 to $19,999 | 297 (5.1%) | 116 (5.2%) |
| $20,000 to $24,999 | 529 (9.0%) | 233 (10.5%) |
| $25,000 to $34,999 | 605 (10.3%) | 258 (11.7%) |
| $35,000 to $49,999 | 738 (12.6%) | 610 (27.6%) |
| $50,000 to $74,999 | 997 (17.0%) | 235 (10.6%) |
| $75,000 to $99,999 | 922 (15.7%) | 248 (11.2%) |
| $100,000 to $149,999 | 904 (15.4%) | 37 (1.7%) |
| $150,000 or more | 403 (6.9%) | 11 (0.5%) |
| Total | 5,879 (100.0%) | 2,212 (100.0%) |
Monthly Housing Cost Tiers in Tippah County
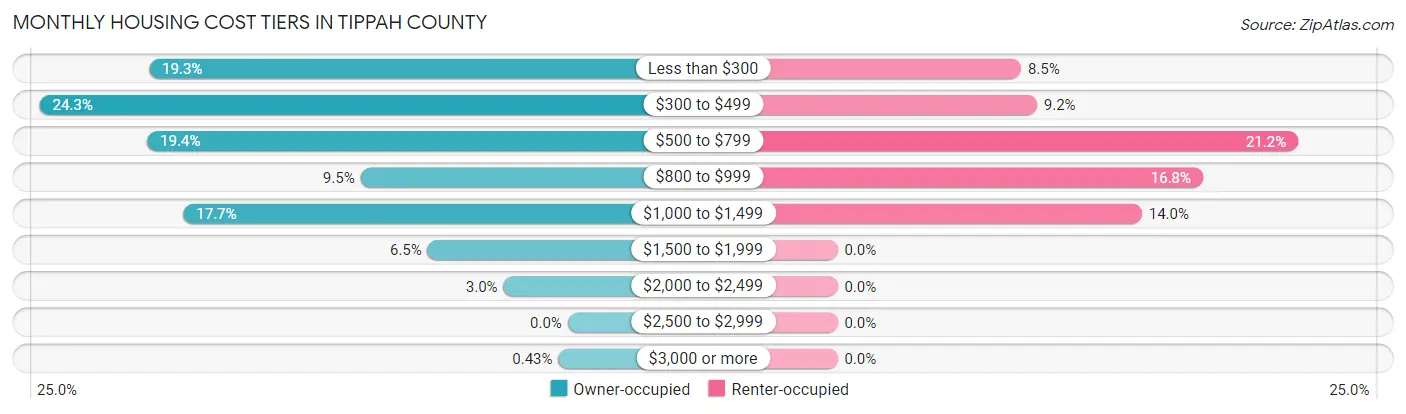
| Monthly Cost | Owner-occupied | Renter-occupied |
| Less than $300 | 1,133 (19.3%) | 187 (8.5%) |
| $300 to $499 | 1,429 (24.3%) | 203 (9.2%) |
| $500 to $799 | 1,138 (19.4%) | 469 (21.2%) |
| $800 to $999 | 561 (9.5%) | 372 (16.8%) |
| $1,000 to $1,499 | 1,040 (17.7%) | 310 (14.0%) |
| $1,500 to $1,999 | 379 (6.5%) | 0 (0.0%) |
| $2,000 to $2,499 | 174 (3.0%) | 0 (0.0%) |
| $2,500 to $2,999 | 0 (0.0%) | 0 (0.0%) |
| $3,000 or more | 25 (0.4%) | 0 (0.0%) |
| Total | 5,879 (100.0%) | 2,212 (100.0%) |
Physical Housing Characteristics in Tippah County
Housing Structures in Tippah County
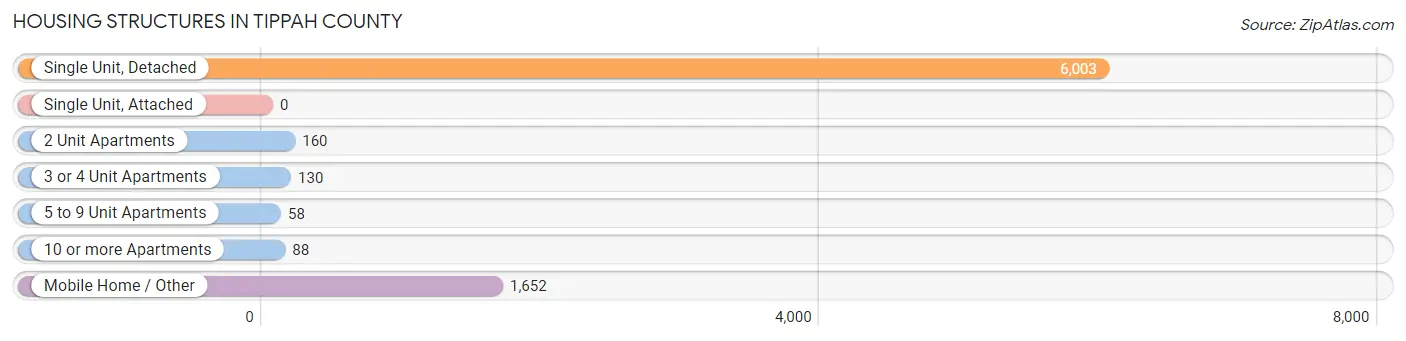
| Structure Type | # Housing Units | % Housing Units |
| Single Unit, Detached | 6,003 | 74.2% |
| Single Unit, Attached | 0 | 0.0% |
| 2 Unit Apartments | 160 | 2.0% |
| 3 or 4 Unit Apartments | 130 | 1.6% |
| 5 to 9 Unit Apartments | 58 | 0.7% |
| 10 or more Apartments | 88 | 1.1% |
| Mobile Home / Other | 1,652 | 20.4% |
| Total | 8,091 | 100.0% |
Housing Structures by Occupancy in Tippah County
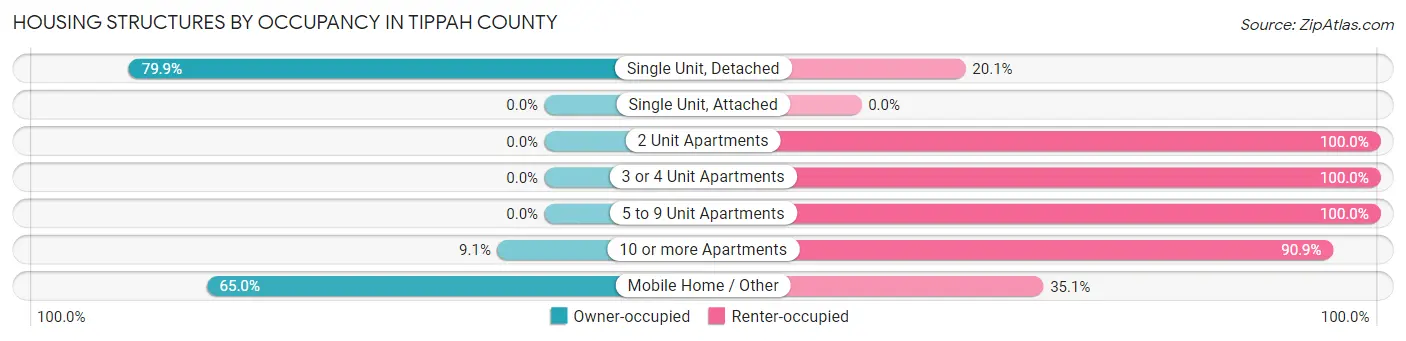
| Structure Type | Owner-occupied | Renter-occupied |
| Single Unit, Detached | 4,798 (79.9%) | 1,205 (20.1%) |
| Single Unit, Attached | 0 (0.0%) | 0 (0.0%) |
| 2 Unit Apartments | 0 (0.0%) | 160 (100.0%) |
| 3 or 4 Unit Apartments | 0 (0.0%) | 130 (100.0%) |
| 5 to 9 Unit Apartments | 0 (0.0%) | 58 (100.0%) |
| 10 or more Apartments | 8 (9.1%) | 80 (90.9%) |
| Mobile Home / Other | 1,073 (64.9%) | 579 (35.0%) |
| Total | 5,879 (72.7%) | 2,212 (27.3%) |
Housing Structures by Number of Rooms in Tippah County
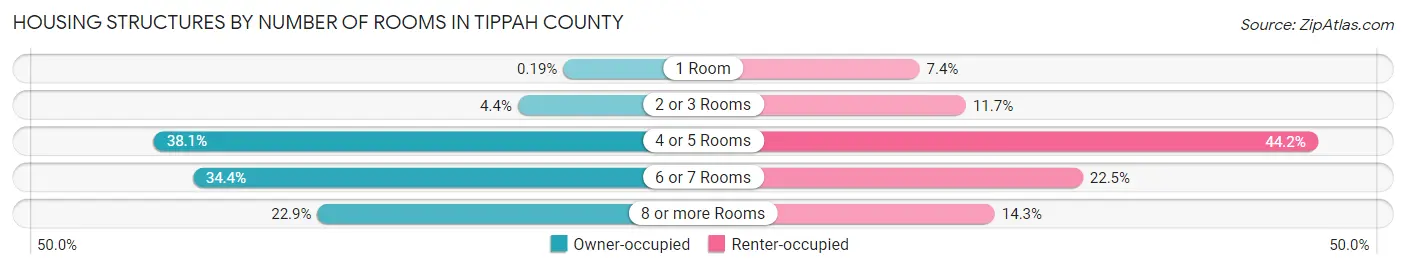
| Number of Rooms | Owner-occupied | Renter-occupied |
| 1 Room | 11 (0.2%) | 163 (7.4%) |
| 2 or 3 Rooms | 258 (4.4%) | 258 (11.7%) |
| 4 or 5 Rooms | 2,237 (38.1%) | 977 (44.2%) |
| 6 or 7 Rooms | 2,025 (34.4%) | 497 (22.5%) |
| 8 or more Rooms | 1,348 (22.9%) | 317 (14.3%) |
| Total | 5,879 (100.0%) | 2,212 (100.0%) |
Housing Structure by Heating Type in Tippah County
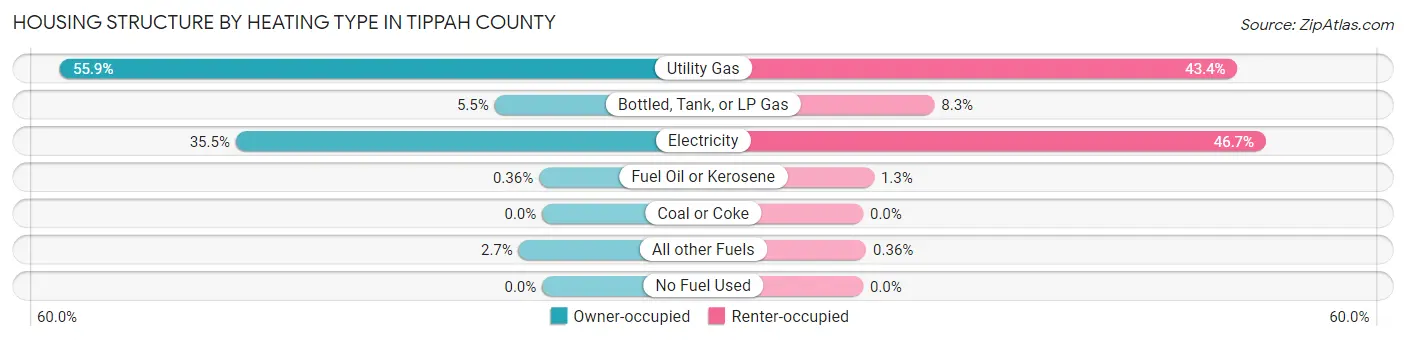
| Heating Type | Owner-occupied | Renter-occupied |
| Utility Gas | 3,286 (55.9%) | 960 (43.4%) |
| Bottled, Tank, or LP Gas | 324 (5.5%) | 183 (8.3%) |
| Electricity | 2,088 (35.5%) | 1,033 (46.7%) |
| Fuel Oil or Kerosene | 21 (0.4%) | 28 (1.3%) |
| Coal or Coke | 0 (0.0%) | 0 (0.0%) |
| All other Fuels | 160 (2.7%) | 8 (0.4%) |
| No Fuel Used | 0 (0.0%) | 0 (0.0%) |
| Total | 5,879 (100.0%) | 2,212 (100.0%) |
Household Vehicle Usage in Tippah County
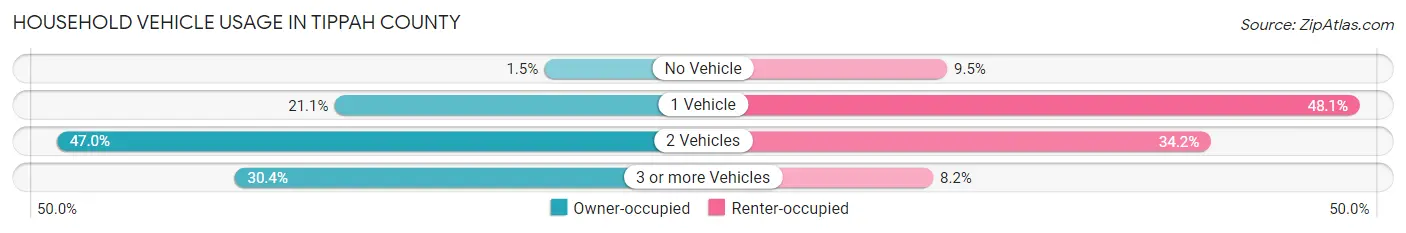
| Vehicles per Household | Owner-occupied | Renter-occupied |
| No Vehicle | 89 (1.5%) | 211 (9.5%) |
| 1 Vehicle | 1,240 (21.1%) | 1,063 (48.1%) |
| 2 Vehicles | 2,763 (47.0%) | 756 (34.2%) |
| 3 or more Vehicles | 1,787 (30.4%) | 182 (8.2%) |
| Total | 5,879 (100.0%) | 2,212 (100.0%) |
Real Estate & Mortgages in Tippah County
Real Estate and Mortgage Overview in Tippah County
| Characteristic | Without Mortgage | With Mortgage |
| Housing Units | 3,270 | 2,609 |
| Median Property Value | $96,700 | $139,700 |
| Median Household Income | $49,775 | $263 |
| Monthly Housing Costs | $376 | $25 |
| Real Estate Taxes | $707 | $443 |
Property Value by Mortgage Status in Tippah County
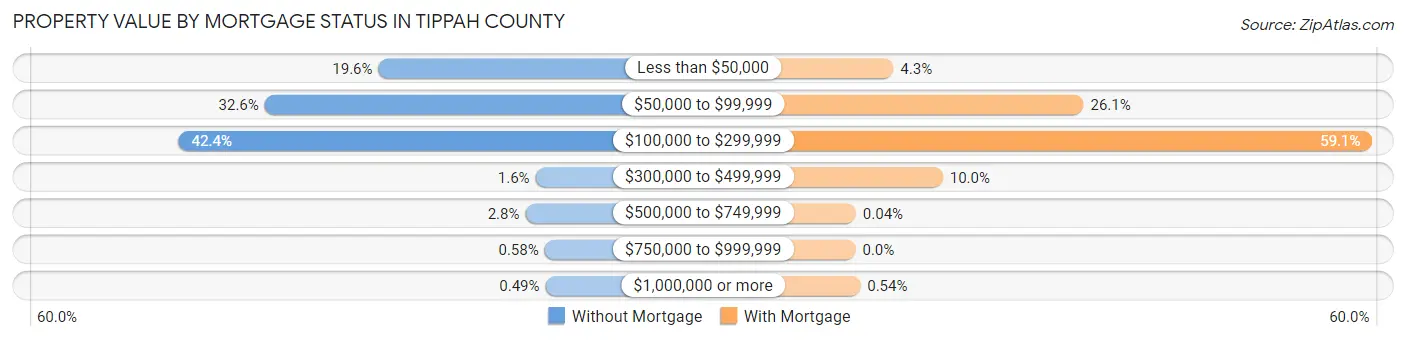
| Property Value | Without Mortgage | With Mortgage |
| Less than $50,000 | 640 (19.6%) | 113 (4.3%) |
| $50,000 to $99,999 | 1,065 (32.6%) | 680 (26.1%) |
| $100,000 to $299,999 | 1,386 (42.4%) | 1,541 (59.1%) |
| $300,000 to $499,999 | 53 (1.6%) | 260 (10.0%) |
| $500,000 to $749,999 | 91 (2.8%) | 1 (0.0%) |
| $750,000 to $999,999 | 19 (0.6%) | 0 (0.0%) |
| $1,000,000 or more | 16 (0.5%) | 14 (0.5%) |
| Total | 3,270 (100.0%) | 2,609 (100.0%) |
Household Income by Mortgage Status in Tippah County
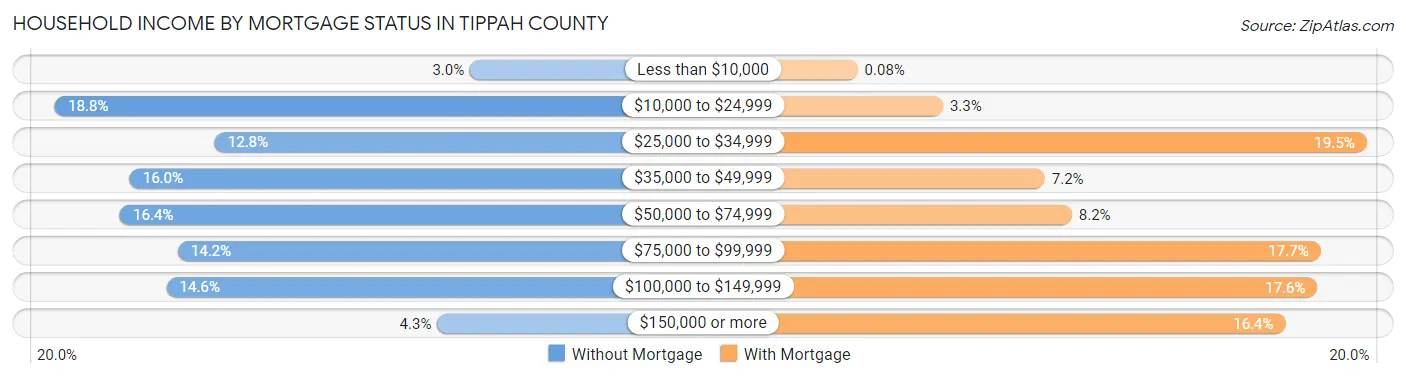
| Household Income | Without Mortgage | With Mortgage |
| Less than $10,000 | 99 (3.0%) | 2 (0.1%) |
| $10,000 to $24,999 | 616 (18.8%) | 87 (3.3%) |
| $25,000 to $34,999 | 417 (12.8%) | 508 (19.5%) |
| $35,000 to $49,999 | 523 (16.0%) | 188 (7.2%) |
| $50,000 to $74,999 | 535 (16.4%) | 215 (8.2%) |
| $75,000 to $99,999 | 463 (14.2%) | 462 (17.7%) |
| $100,000 to $149,999 | 477 (14.6%) | 459 (17.6%) |
| $150,000 or more | 140 (4.3%) | 427 (16.4%) |
| Total | 3,270 (100.0%) | 2,609 (100.0%) |
Property Value to Household Income Ratio in Tippah County
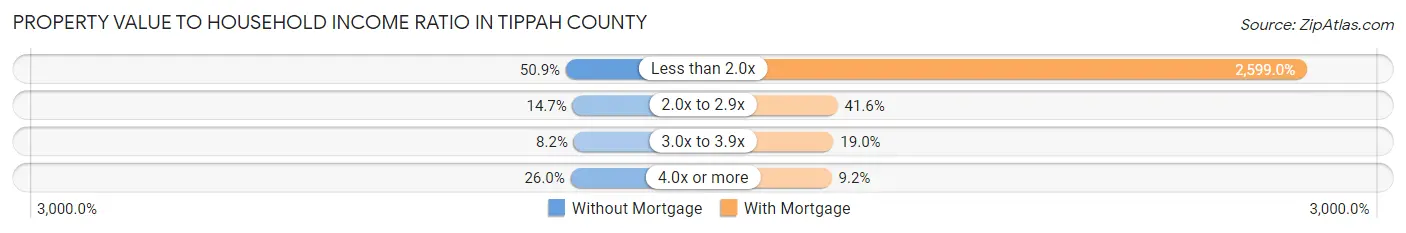
| Value-to-Income Ratio | Without Mortgage | With Mortgage |
| Less than 2.0x | 1,663 (50.9%) | 67,809 (2,599.0%) |
| 2.0x to 2.9x | 480 (14.7%) | 1,086 (41.6%) |
| 3.0x to 3.9x | 267 (8.2%) | 496 (19.0%) |
| 4.0x or more | 849 (26.0%) | 241 (9.2%) |
| Total | 3,270 (100.0%) | 2,609 (100.0%) |
Real Estate Taxes by Mortgage Status in Tippah County
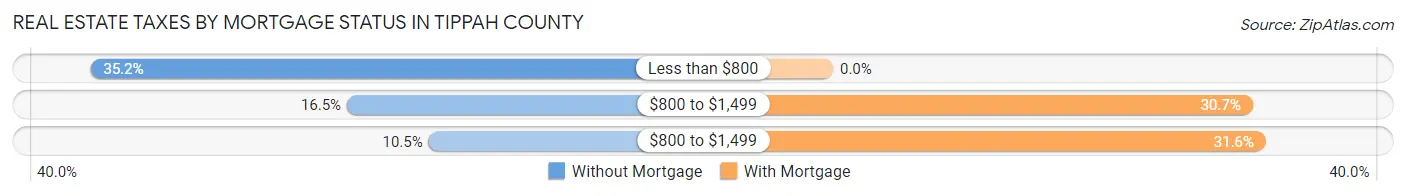
| Property Taxes | Without Mortgage | With Mortgage |
| Less than $800 | 1,151 (35.2%) | 0 (0.0%) |
| $800 to $1,499 | 538 (16.5%) | 800 (30.7%) |
| $800 to $1,499 | 343 (10.5%) | 825 (31.6%) |
| Total | 3,270 (100.0%) | 2,609 (100.0%) |
Health & Disability in Tippah County
Health Insurance Coverage by Age in Tippah County
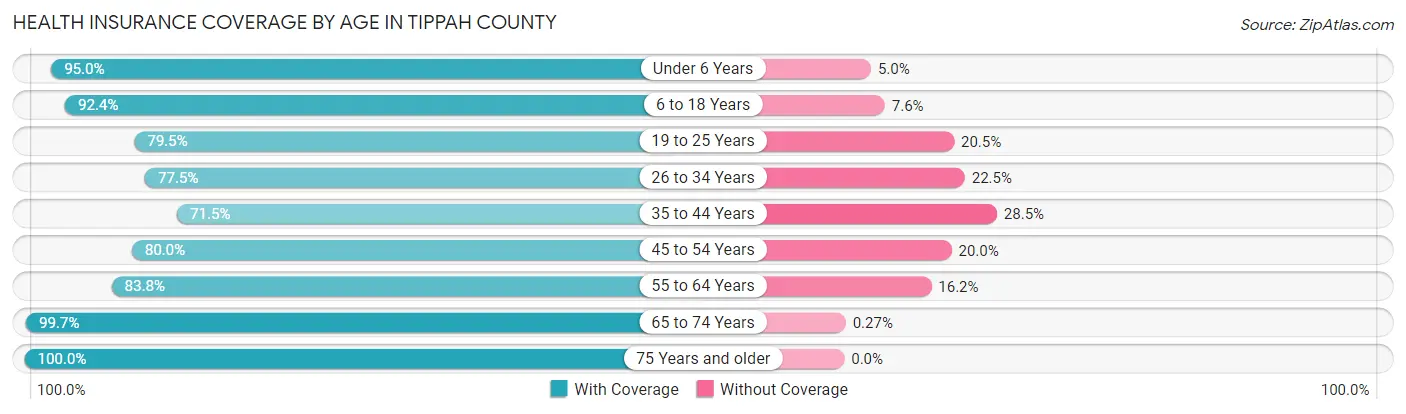
| Age Bracket | With Coverage | Without Coverage |
| Under 6 Years | 1,472 (95.0%) | 77 (5.0%) |
| 6 to 18 Years | 3,741 (92.4%) | 306 (7.6%) |
| 19 to 25 Years | 1,761 (79.5%) | 453 (20.5%) |
| 26 to 34 Years | 1,522 (77.5%) | 441 (22.5%) |
| 35 to 44 Years | 1,893 (71.5%) | 753 (28.5%) |
| 45 to 54 Years | 2,324 (80.0%) | 581 (20.0%) |
| 55 to 64 Years | 2,280 (83.8%) | 442 (16.2%) |
| 65 to 74 Years | 2,230 (99.7%) | 6 (0.3%) |
| 75 Years and older | 1,300 (100.0%) | 0 (0.0%) |
| Total | 18,523 (85.8%) | 3,059 (14.2%) |
Health Insurance Coverage by Citizenship Status in Tippah County
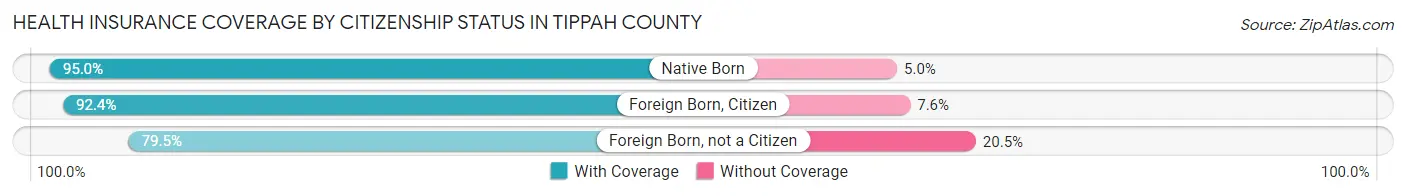
| Citizenship Status | With Coverage | Without Coverage |
| Native Born | 1,472 (95.0%) | 77 (5.0%) |
| Foreign Born, Citizen | 3,741 (92.4%) | 306 (7.6%) |
| Foreign Born, not a Citizen | 1,761 (79.5%) | 453 (20.5%) |
Health Insurance Coverage by Household Income in Tippah County
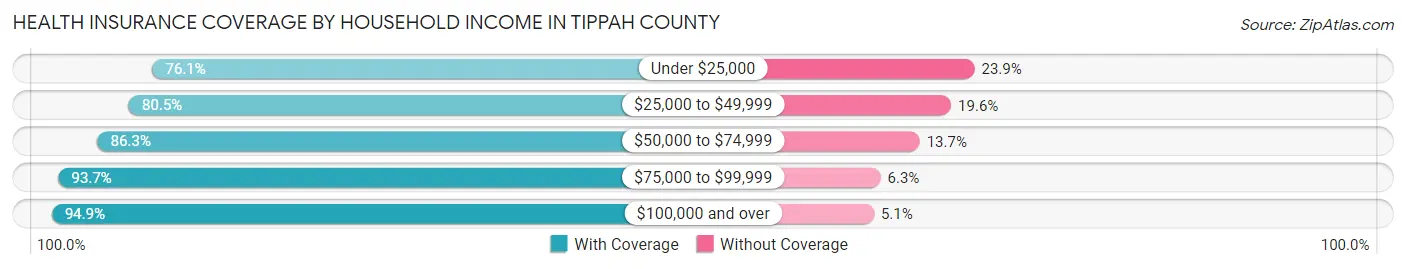
| Household Income | With Coverage | Without Coverage |
| Under $25,000 | 2,952 (76.1%) | 929 (23.9%) |
| $25,000 to $49,999 | 4,670 (80.4%) | 1,135 (19.6%) |
| $50,000 to $74,999 | 2,892 (86.3%) | 458 (13.7%) |
| $75,000 to $99,999 | 3,429 (93.7%) | 232 (6.3%) |
| $100,000 and over | 4,323 (94.9%) | 232 (5.1%) |
Public vs Private Health Insurance Coverage by Age in Tippah County
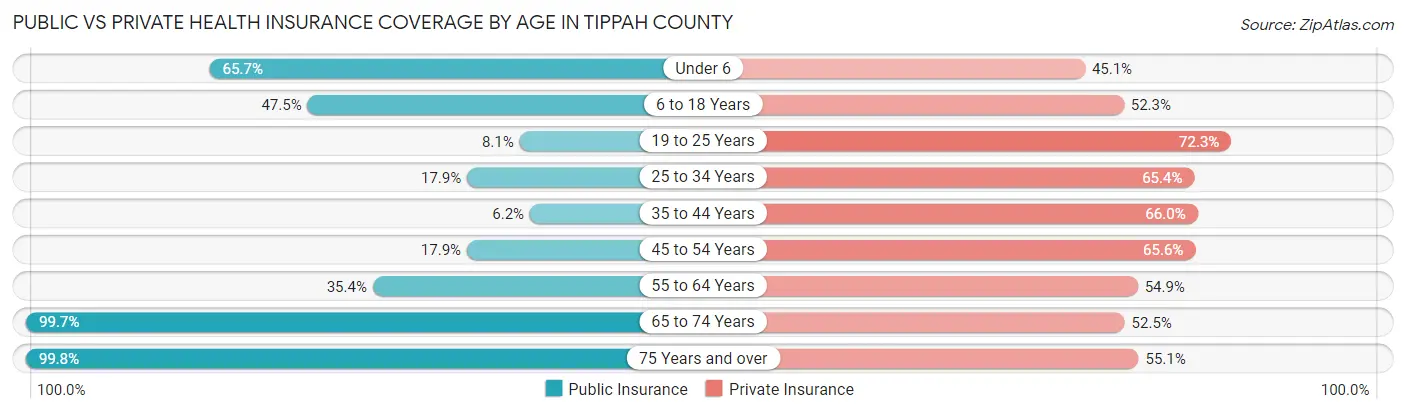
| Age Bracket | Public Insurance | Private Insurance |
| Under 6 | 1,017 (65.7%) | 699 (45.1%) |
| 6 to 18 Years | 1,922 (47.5%) | 2,118 (52.3%) |
| 19 to 25 Years | 180 (8.1%) | 1,600 (72.3%) |
| 25 to 34 Years | 351 (17.9%) | 1,284 (65.4%) |
| 35 to 44 Years | 164 (6.2%) | 1,747 (66.0%) |
| 45 to 54 Years | 520 (17.9%) | 1,905 (65.6%) |
| 55 to 64 Years | 963 (35.4%) | 1,495 (54.9%) |
| 65 to 74 Years | 2,230 (99.7%) | 1,174 (52.5%) |
| 75 Years and over | 1,297 (99.8%) | 716 (55.1%) |
| Total | 8,644 (40.1%) | 12,738 (59.0%) |
Disability Status by Sex by Age in Tippah County
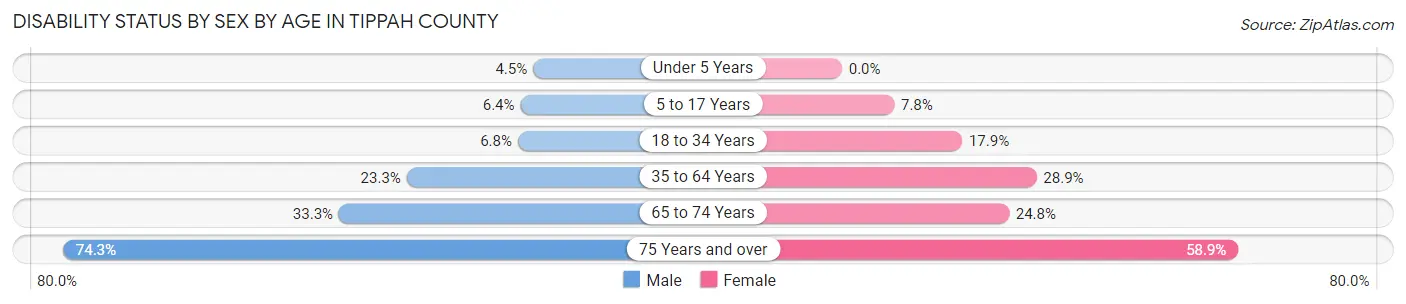
| Age Bracket | Male | Female |
| Under 5 Years | 23 (4.5%) | 0 (0.0%) |
| 5 to 17 Years | 136 (6.4%) | 149 (7.8%) |
| 18 to 34 Years | 157 (6.8%) | 406 (17.8%) |
| 35 to 64 Years | 941 (23.3%) | 1,222 (28.9%) |
| 65 to 74 Years | 334 (33.3%) | 306 (24.8%) |
| 75 Years and over | 379 (74.3%) | 465 (58.9%) |
Disability Class by Sex by Age in Tippah County
Disability Class: Hearing Difficulty
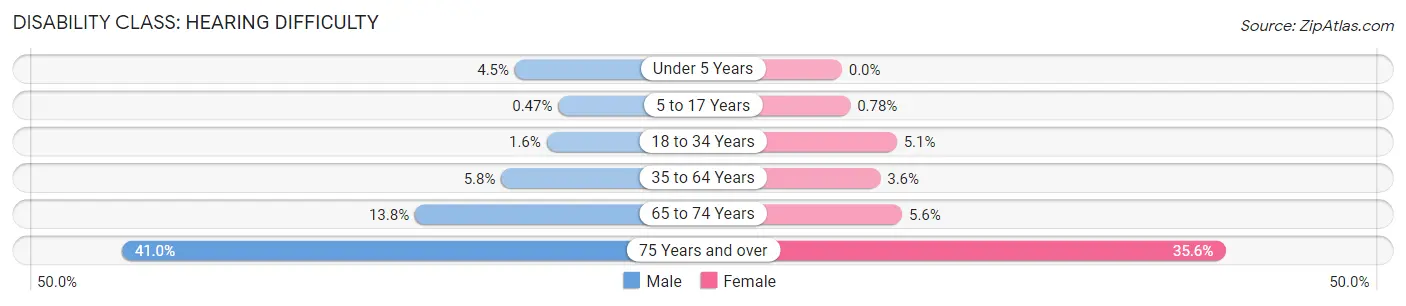
| Age Bracket | Male | Female |
| Under 5 Years | 23 (4.5%) | 0 (0.0%) |
| 5 to 17 Years | 10 (0.5%) | 15 (0.8%) |
| 18 to 34 Years | 36 (1.5%) | 116 (5.1%) |
| 35 to 64 Years | 233 (5.8%) | 151 (3.6%) |
| 65 to 74 Years | 138 (13.8%) | 69 (5.6%) |
| 75 Years and over | 209 (41.0%) | 281 (35.6%) |
Disability Class: Vision Difficulty
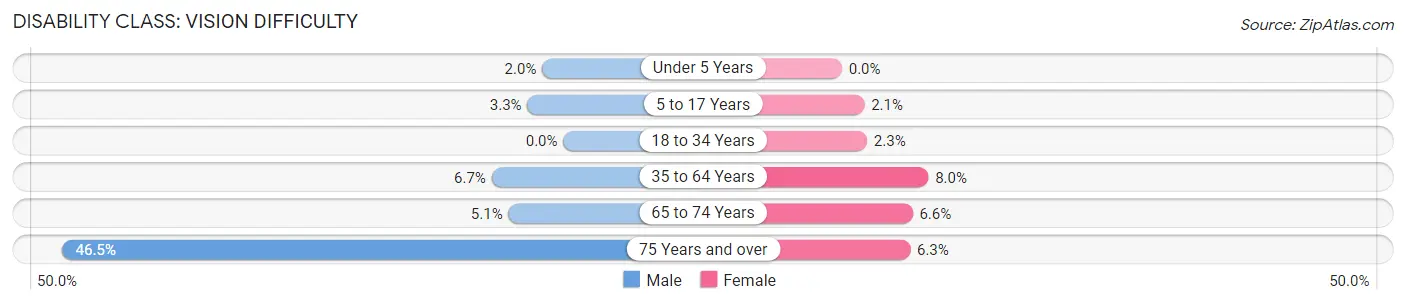
| Age Bracket | Male | Female |
| Under 5 Years | 10 (2.0%) | 0 (0.0%) |
| 5 to 17 Years | 71 (3.3%) | 40 (2.1%) |
| 18 to 34 Years | 0 (0.0%) | 53 (2.3%) |
| 35 to 64 Years | 269 (6.7%) | 339 (8.0%) |
| 65 to 74 Years | 51 (5.1%) | 81 (6.6%) |
| 75 Years and over | 237 (46.5%) | 50 (6.3%) |
Disability Class: Cognitive Difficulty
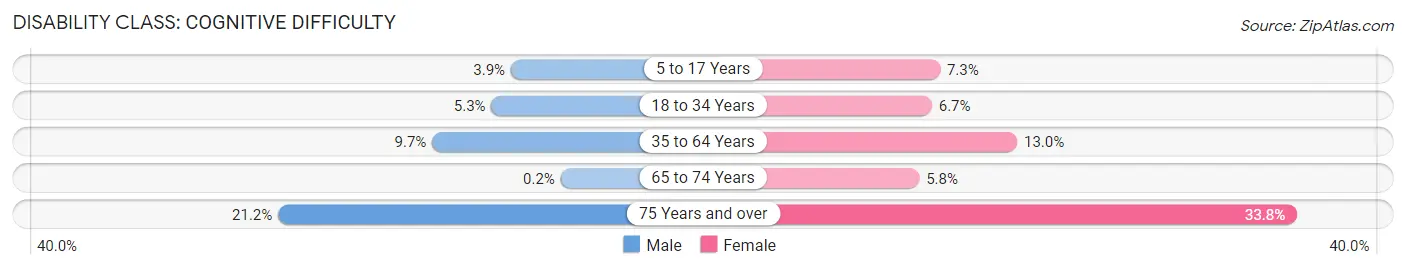
| Age Bracket | Male | Female |
| 5 to 17 Years | 83 (3.9%) | 140 (7.3%) |
| 18 to 34 Years | 124 (5.3%) | 152 (6.7%) |
| 35 to 64 Years | 394 (9.7%) | 550 (13.0%) |
| 65 to 74 Years | 2 (0.2%) | 71 (5.8%) |
| 75 Years and over | 108 (21.2%) | 267 (33.8%) |
Disability Class: Ambulatory Difficulty
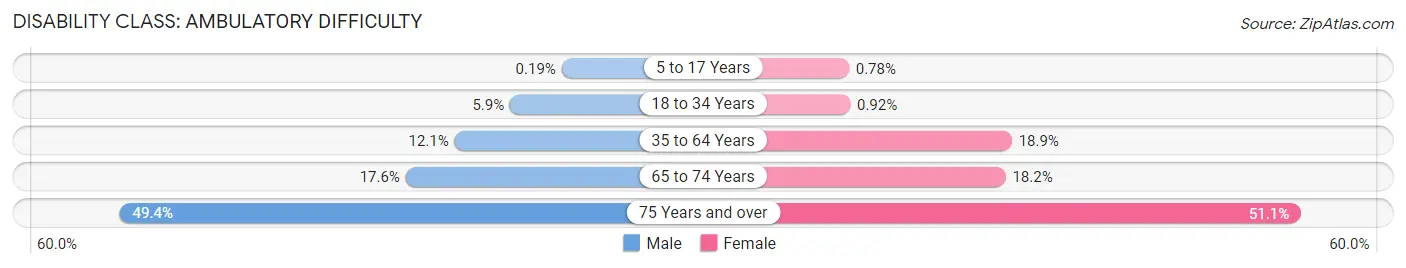
| Age Bracket | Male | Female |
| 5 to 17 Years | 4 (0.2%) | 15 (0.8%) |
| 18 to 34 Years | 138 (5.9%) | 21 (0.9%) |
| 35 to 64 Years | 490 (12.1%) | 800 (18.9%) |
| 65 to 74 Years | 176 (17.6%) | 225 (18.2%) |
| 75 Years and over | 252 (49.4%) | 404 (51.1%) |
Disability Class: Self-Care Difficulty
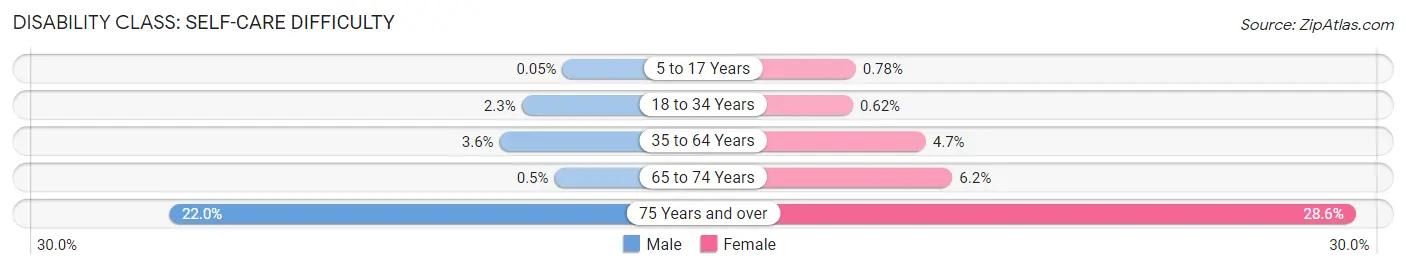
| Age Bracket | Male | Female |
| 5 to 17 Years | 1 (0.1%) | 15 (0.8%) |
| 18 to 34 Years | 54 (2.3%) | 14 (0.6%) |
| 35 to 64 Years | 144 (3.6%) | 198 (4.7%) |
| 65 to 74 Years | 5 (0.5%) | 76 (6.2%) |
| 75 Years and over | 112 (22.0%) | 226 (28.6%) |
Technology Access in Tippah County
Computing Device Access in Tippah County
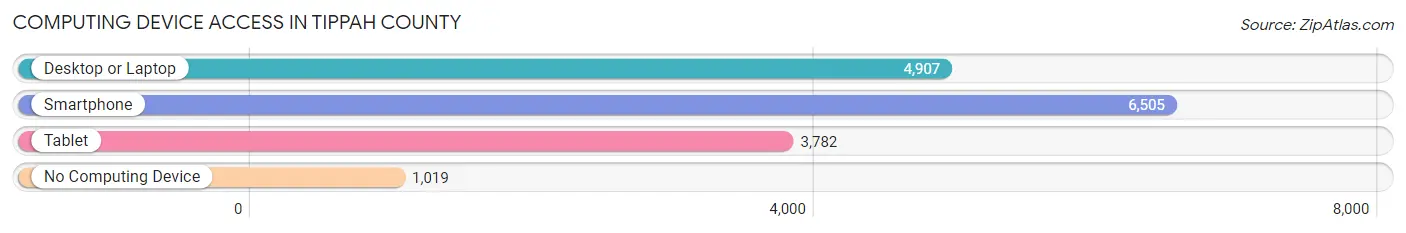
| Device Type | # Households | % Households |
| Desktop or Laptop | 4,907 | 60.7% |
| Smartphone | 6,505 | 80.4% |
| Tablet | 3,782 | 46.7% |
| No Computing Device | 1,019 | 12.6% |
| Total | 8,091 | 100.0% |
Internet Access in Tippah County
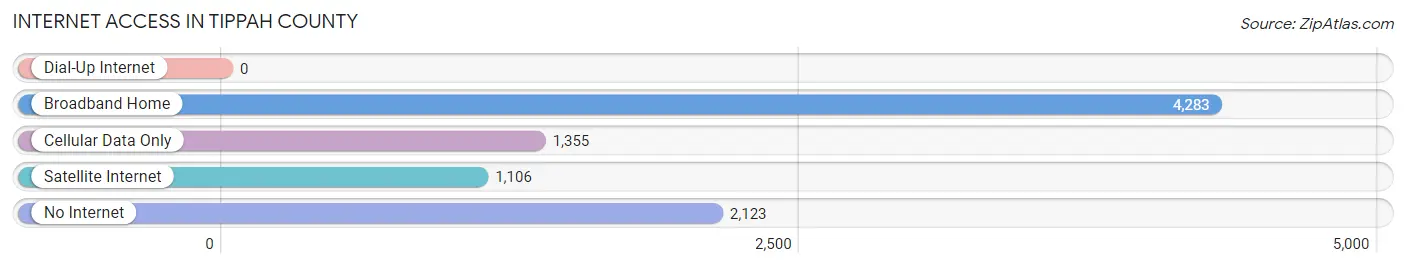
| Internet Type | # Households | % Households |
| Dial-Up Internet | 0 | 0.0% |
| Broadband Home | 4,283 | 52.9% |
| Cellular Data Only | 1,355 | 16.8% |
| Satellite Internet | 1,106 | 13.7% |
| No Internet | 2,123 | 26.2% |
| Total | 8,091 | 100.0% |
Tippah County Summary
Tippah County is located in the northeastern corner of Mississippi, and is bordered by the states of Tennessee and Arkansas. It is part of the larger region known as the Mississippi Delta, and is home to a population of 22,232 people as of the 2010 census. The county seat is Ripley, and other major towns include Walnut, Falkner, and Blue Mountain.
History
Tippah County was established in 1836, and was named after the Choctaw word for “cut off”, referring to the county’s location at the edge of the Choctaw Nation. The county was originally part of the Chickasaw Cession of 1832, and was later divided into two counties, Tippah and Benton. The county was home to a large population of Native Americans, including the Chickasaw, Choctaw, and Cherokee tribes.
During the Civil War, Tippah County was the site of several battles, including the Battle of Brice’s Crossroads and the Battle of Ripley. The county was also home to several Confederate camps, including Camp Brice and Camp Ripley.
Geography
Tippah County is located in the northeastern corner of Mississippi, and is bordered by the states of Tennessee and Arkansas. It is part of the larger region known as the Mississippi Delta, and is home to a population of 22,232 people as of the 2010 census. The county covers an area of 576 square miles, and is mostly rural, with the majority of the population living in small towns and villages. The terrain is mostly flat, with some rolling hills in the northern part of the county. The county is drained by the Tippah River, which flows through the county from north to south.
Economy
Tippah County’s economy is largely based on agriculture, with the majority of the population employed in farming and related industries. The county is home to several large farms, and is a major producer of cotton, soybeans, corn, and other crops. The county is also home to several manufacturing plants, including a furniture factory and a paper mill.
Demographics
As of the 2010 census, Tippah County had a population of 22,232 people. The racial makeup of the county was 79.3% White, 18.7% African American, 0.4% Native American, 0.2% Asian, 0.1% Pacific Islander, 0.7% from other races, and 0.9% from two or more races. Hispanic or Latino of any race were 1.7% of the population.
The median income for a household in the county was $30,945, and the median income for a family was $37,945. The per capita income for the county was $16,845. About 17.2% of families and 21.2% of the population were below the poverty line, including 28.2% of those under age 18 and 17.2% of those age 65 or over.
Common Questions
What is Per Capita Income in Tippah County?
Per Capita income in Tippah County is $27,762.
What is the Median Family Income in Tippah County?
Median Family Income in Tippah County is $56,358.
What is the Median Household income in Tippah County?
Median Household Income in Tippah County is $47,968.
What is Income or Wage Gap in Tippah County?
Income or Wage Gap in Tippah County is 40.8%.
Women in Tippah County earn 59.2 cents for every dollar earned by a man.
What is Family Income Deficit in Tippah County?
Family Income Deficit in Tippah County is $8,843.
Families that are below poverty line in Tippah County earn $8,843 less on average than the poverty threshold level.
What is Inequality or Gini Index in Tippah County?
Inequality or Gini Index in Tippah County is 0.46.
What is the Total Population of Tippah County?
Total Population of Tippah County is 21,769.
What is the Total Male Population of Tippah County?
Total Male Population of Tippah County is 10,594.
What is the Total Female Population of Tippah County?
Total Female Population of Tippah County is 11,175.
What is the Ratio of Males per 100 Females in Tippah County?
There are 94.80 Males per 100 Females in Tippah County.
What is the Ratio of Females per 100 Males in Tippah County?
There are 105.48 Females per 100 Males in Tippah County.
What is the Median Population Age in Tippah County?
Median Population Age in Tippah County is 39.6 Years.
What is the Average Family Size in Tippah County
Average Family Size in Tippah County is 3.1 People.
What is the Average Household Size in Tippah County
Average Household Size in Tippah County is 2.6 People.
How Large is the Labor Force in Tippah County?
There are 9,827 People in the Labor Forcein in Tippah County.
What is the Percentage of People in the Labor Force in Tippah County?
57.3% of People are in the Labor Force in Tippah County.
What is the Unemployment Rate in Tippah County?
Unemployment Rate in Tippah County is 6.0%.