Tallahatchie County, MS Map & Demographics
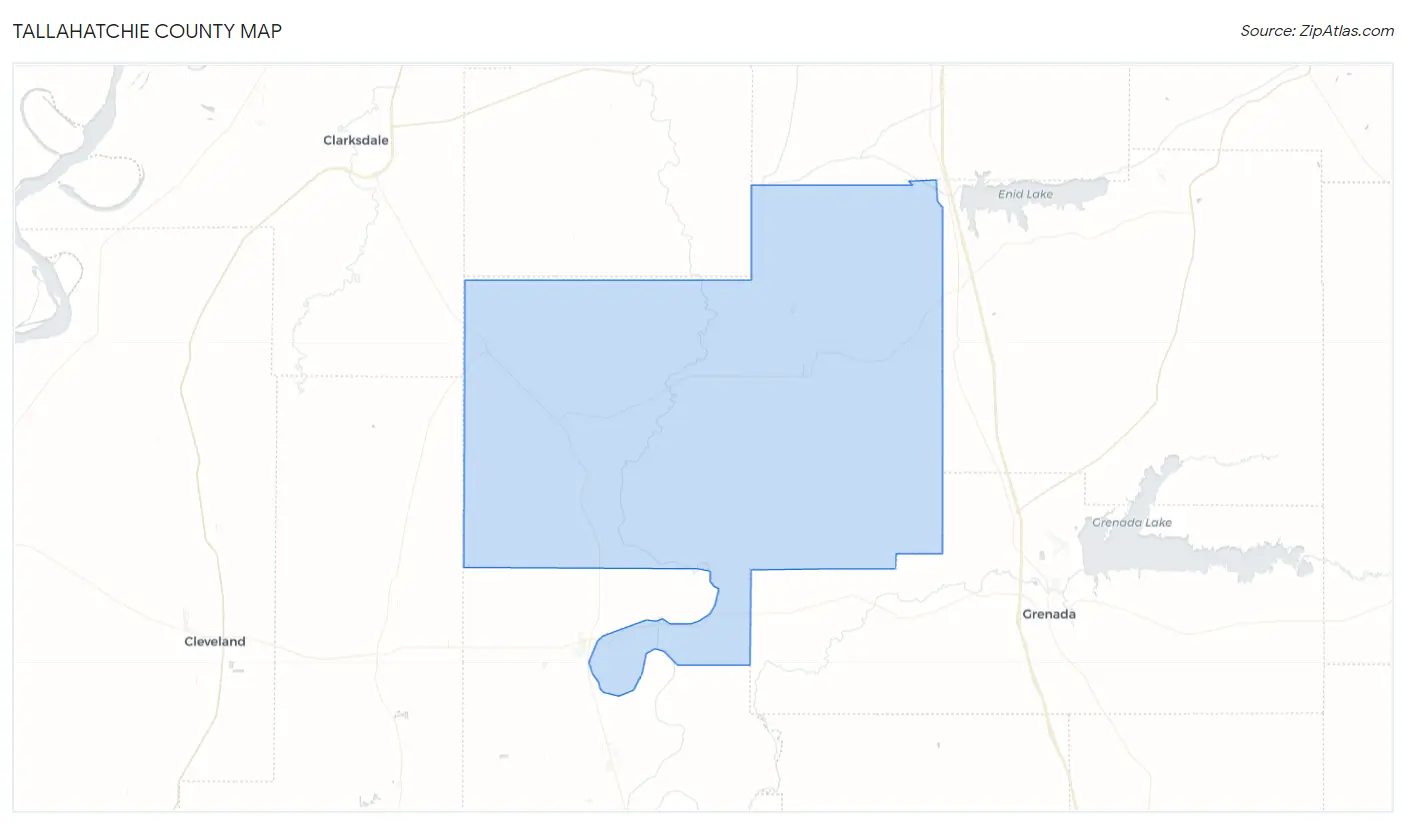
Tallahatchie County Map
Tallahatchie County Overview
$20,348
PER CAPITA INCOME
$45,565
AVG FAMILY INCOME
$35,428
AVG HOUSEHOLD INCOME
49.2%
WAGE / INCOME GAP [ % ]
50.8¢/ $1
WAGE / INCOME GAP [ $ ]
$9,357
FAMILY INCOME DEFICIT
0.44
INEQUALITY / GINI INDEX
12,621
TOTAL POPULATION
6,735
MALE POPULATION
5,886
FEMALE POPULATION
114.42
MALES / 100 FEMALES
87.39
FEMALES / 100 MALES
37.7
MEDIAN AGE
3.6
AVG FAMILY SIZE
2.8
AVG HOUSEHOLD SIZE
5,027
LABOR FORCE [ PEOPLE ]
48.9%
PERCENT IN LABOR FORCE
11.0%
UNEMPLOYMENT RATE
Tallahatchie County Area Codes
Income in Tallahatchie County
Income Overview in Tallahatchie County
Per Capita Income in Tallahatchie County is $20,348, while median incomes of families and households are $45,565 and $35,428 respectively.
| Characteristic | Number | Measure |
| Per Capita Income | 12,621 | $20,348 |
| Median Family Income | 2,826 | $45,565 |
| Mean Family Income | 2,826 | $59,005 |
| Median Household Income | 4,301 | $35,428 |
| Mean Household Income | 4,301 | $50,959 |
| Income Deficit | 2,826 | $9,357 |
| Wage / Income Gap (%) | 12,621 | 49.18% |
| Wage / Income Gap ($) | 12,621 | 50.82¢ per $1 |
| Gini / Inequality Index | 12,621 | 0.44 |
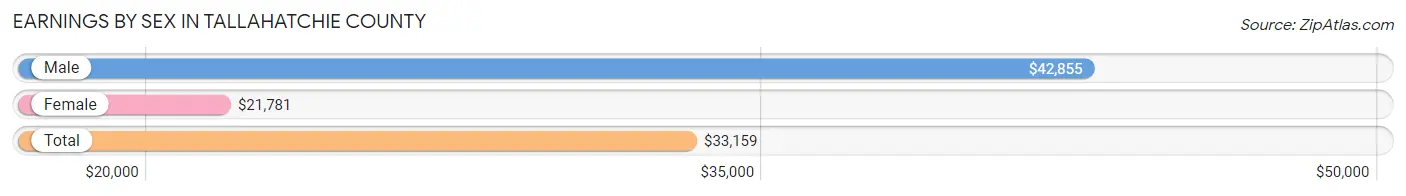
Earnings by Sex in Tallahatchie County
Average Earnings in Tallahatchie County are $33,159, $42,855 for men and $21,781 for women, a difference of 49.2%.
| Sex | Number | Average Earnings |
| Male | 2,983 (59.2%) | $42,855 |
| Female | 2,057 (40.8%) | $21,781 |
| Total | 5,040 (100.0%) | $33,159 |
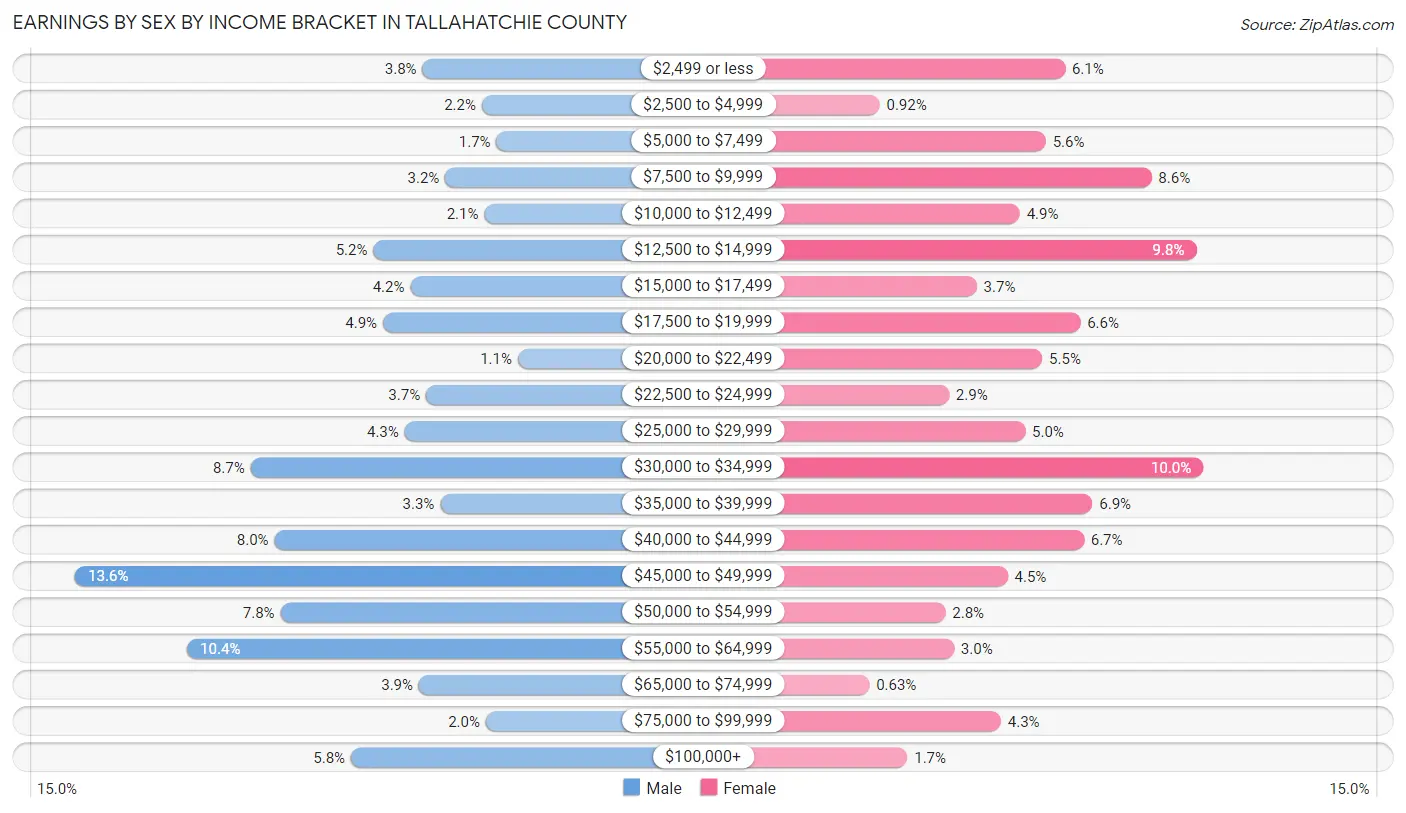
Earnings by Sex by Income Bracket in Tallahatchie County
The most common earnings brackets in Tallahatchie County are $45,000 to $49,999 for men (405 | 13.6%) and $30,000 to $34,999 for women (206 | 10.0%).
| Income | Male | Female |
| $2,499 or less | 114 (3.8%) | 126 (6.1%) |
| $2,500 to $4,999 | 64 (2.1%) | 19 (0.9%) |
| $5,000 to $7,499 | 52 (1.7%) | 115 (5.6%) |
| $7,500 to $9,999 | 95 (3.2%) | 176 (8.6%) |
| $10,000 to $12,499 | 62 (2.1%) | 100 (4.9%) |
| $12,500 to $14,999 | 155 (5.2%) | 202 (9.8%) |
| $15,000 to $17,499 | 124 (4.2%) | 75 (3.6%) |
| $17,500 to $19,999 | 147 (4.9%) | 135 (6.6%) |
| $20,000 to $22,499 | 34 (1.1%) | 113 (5.5%) |
| $22,500 to $24,999 | 111 (3.7%) | 59 (2.9%) |
| $25,000 to $29,999 | 129 (4.3%) | 103 (5.0%) |
| $30,000 to $34,999 | 258 (8.6%) | 206 (10.0%) |
| $35,000 to $39,999 | 99 (3.3%) | 142 (6.9%) |
| $40,000 to $44,999 | 238 (8.0%) | 137 (6.7%) |
| $45,000 to $49,999 | 405 (13.6%) | 93 (4.5%) |
| $50,000 to $54,999 | 233 (7.8%) | 57 (2.8%) |
| $55,000 to $64,999 | 311 (10.4%) | 62 (3.0%) |
| $65,000 to $74,999 | 117 (3.9%) | 13 (0.6%) |
| $75,000 to $99,999 | 61 (2.0%) | 89 (4.3%) |
| $100,000+ | 174 (5.8%) | 35 (1.7%) |
| Total | 2,983 (100.0%) | 2,057 (100.0%) |
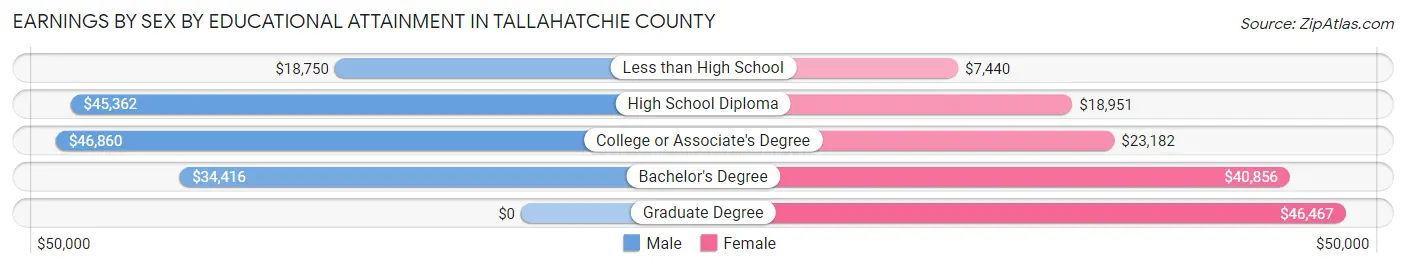
Earnings by Sex by Educational Attainment in Tallahatchie County
Average earnings in Tallahatchie County are $44,319 for men and $23,110 for women, a difference of 47.9%. Men with an educational attainment of college or associate's degree enjoy the highest average annual earnings of $46,860, while those with less than high school education earn the least with $18,750. Women with an educational attainment of graduate degree earn the most with the average annual earnings of $46,467, while those with less than high school education have the smallest earnings of $7,440.
| Educational Attainment | Male Income | Female Income |
| Less than High School | $18,750 | $7,440 |
| High School Diploma | $45,362 | $18,951 |
| College or Associate's Degree | $46,860 | $23,182 |
| Bachelor's Degree | $34,416 | $40,856 |
| Graduate Degree | - | - |
| Total | $44,319 | $23,110 |
Family Income in Tallahatchie County
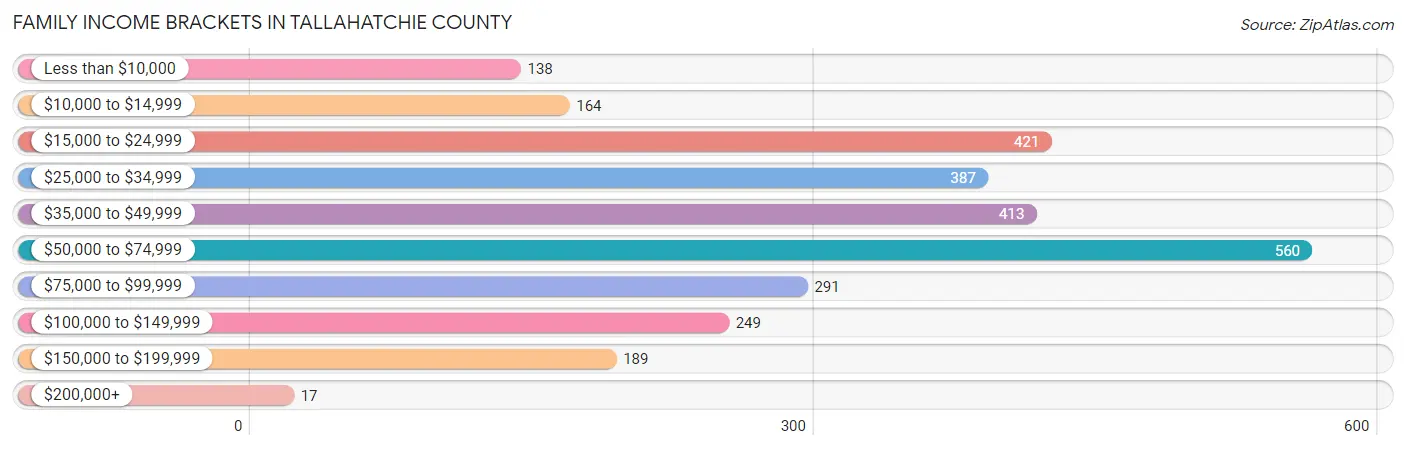
Family Income Brackets in Tallahatchie County
According to the Tallahatchie County family income data, there are 560 families falling into the $50,000 to $74,999 income range, which is the most common income bracket and makes up 19.8% of all families. Conversely, the $200,000+ income bracket is the least frequent group with only 17 families (0.6%) belonging to this category.
| Income Bracket | # Families | % Families |
| Less than $10,000 | 138 | 4.9% |
| $10,000 to $14,999 | 164 | 5.8% |
| $15,000 to $24,999 | 421 | 14.9% |
| $25,000 to $34,999 | 387 | 13.7% |
| $35,000 to $49,999 | 413 | 14.6% |
| $50,000 to $74,999 | 560 | 19.8% |
| $75,000 to $99,999 | 291 | 10.3% |
| $100,000 to $149,999 | 249 | 8.8% |
| $150,000 to $199,999 | 189 | 6.7% |
| $200,000+ | 17 | 0.6% |
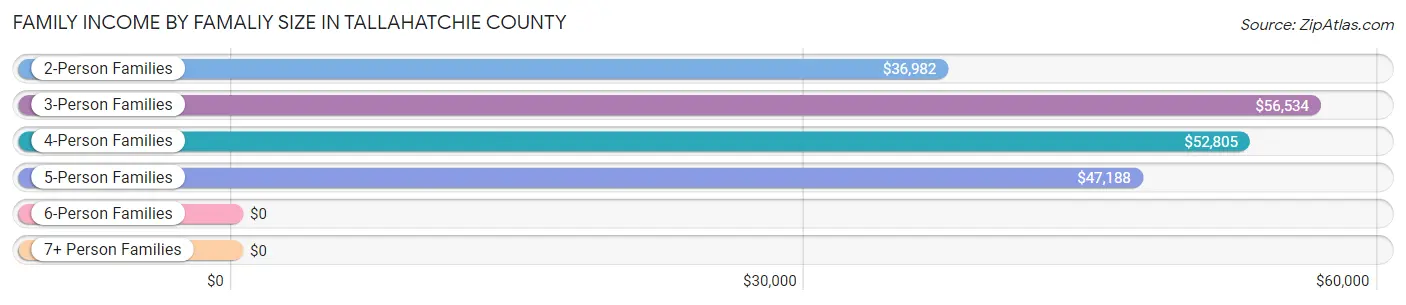
Family Income by Famaliy Size in Tallahatchie County
3-person families (727 | 25.7%) account for the highest median family income in Tallahatchie County with $56,534 per family, while 3-person families (727 | 25.7%) have the highest median income of $18,845 per family member.
| Income Bracket | # Families | Median Income |
| 2-Person Families | 1,228 (43.4%) | $36,982 |
| 3-Person Families | 727 (25.7%) | $56,534 |
| 4-Person Families | 526 (18.6%) | $52,805 |
| 5-Person Families | 316 (11.2%) | $47,188 |
| 6-Person Families | 18 (0.6%) | $0 |
| 7+ Person Families | 11 (0.4%) | $0 |
| Total | 2,826 (100.0%) | $45,565 |
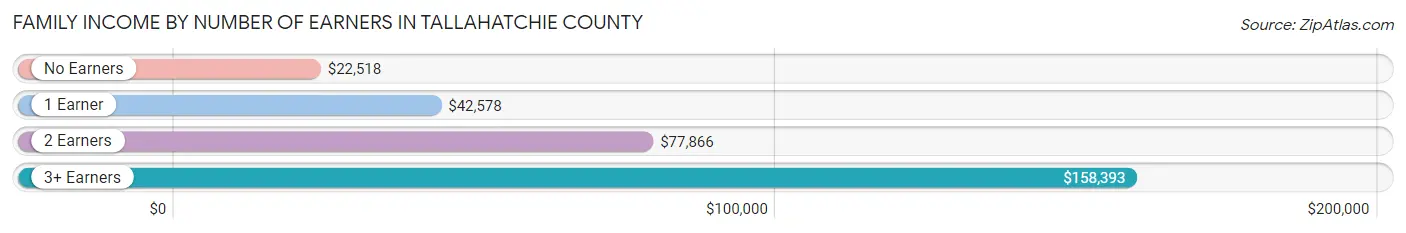
Family Income by Number of Earners in Tallahatchie County
The median family income in Tallahatchie County is $45,565, with families comprising 3+ earners (251) having the highest median family income of $158,393, while families with no earners (678) have the lowest median family income of $22,518, accounting for 8.9% and 24.0% of families, respectively.
| Number of Earners | # Families | Median Income |
| No Earners | 678 (24.0%) | $22,518 |
| 1 Earner | 1,339 (47.4%) | $42,578 |
| 2 Earners | 558 (19.8%) | $77,866 |
| 3+ Earners | 251 (8.9%) | $158,393 |
| Total | 2,826 (100.0%) | $45,565 |
Household Income in Tallahatchie County
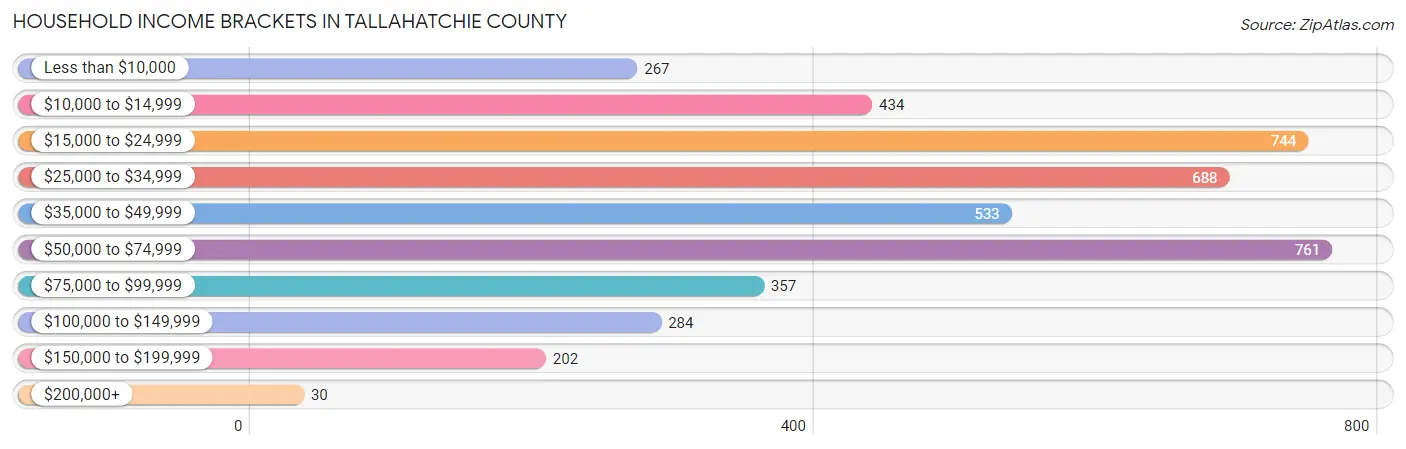
Household Income Brackets in Tallahatchie County
With 761 households falling in the category, the $50,000 to $74,999 income range is the most frequent in Tallahatchie County, accounting for 17.7% of all households. In contrast, only 30 households (0.7%) fall into the $200,000+ income bracket, making it the least populous group.
| Income Bracket | # Households | % Households |
| Less than $10,000 | 267 | 6.2% |
| $10,000 to $14,999 | 434 | 10.1% |
| $15,000 to $24,999 | 744 | 17.3% |
| $25,000 to $34,999 | 688 | 16.0% |
| $35,000 to $49,999 | 533 | 12.4% |
| $50,000 to $74,999 | 761 | 17.7% |
| $75,000 to $99,999 | 357 | 8.3% |
| $100,000 to $149,999 | 284 | 6.6% |
| $150,000 to $199,999 | 202 | 4.7% |
| $200,000+ | 30 | 0.7% |
Household Income by Householder Age in Tallahatchie County
The median household income in Tallahatchie County is $35,428, with the highest median household income of $53,570 found in the 25 to 44 years age bracket for the primary householder. A total of 1,265 households (29.4%) fall into this category. Meanwhile, the 65+ years age bracket for the primary householder has the lowest median household income of $29,321, with 1,375 households (32.0%) in this group.
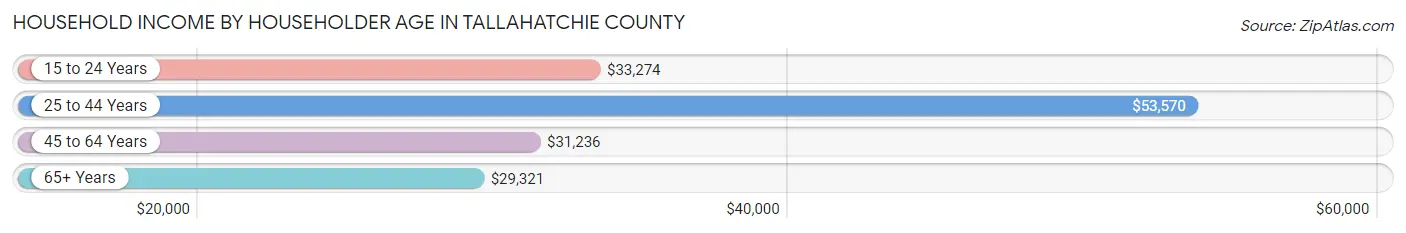
| Income Bracket | # Households | Median Income |
| 15 to 24 Years | 63 (1.5%) | $33,274 |
| 25 to 44 Years | 1,265 (29.4%) | $53,570 |
| 45 to 64 Years | 1,598 (37.1%) | $31,236 |
| 65+ Years | 1,375 (32.0%) | $29,321 |
| Total | 4,301 (100.0%) | $35,428 |
Poverty in Tallahatchie County
Income Below Poverty by Sex and Age in Tallahatchie County
With 25.1% poverty level for males and 26.3% for females among the residents of Tallahatchie County, 5 year old males and 5 year old females are the most vulnerable to poverty, with 38 males (77.5%) and 64 females (67.4%) in their respective age groups living below the poverty level.
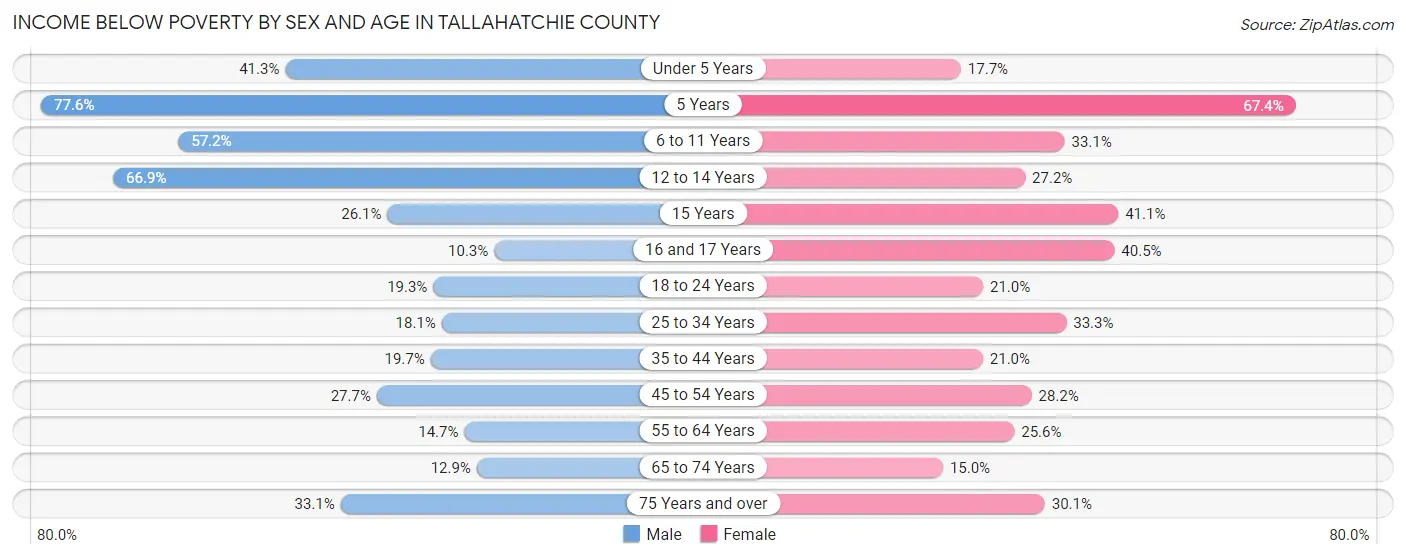
| Age Bracket | Male | Female |
| Under 5 Years | 133 (41.3%) | 69 (17.7%) |
| 5 Years | 38 (77.5%) | 64 (67.4%) |
| 6 to 11 Years | 263 (57.2%) | 131 (33.1%) |
| 12 to 14 Years | 119 (66.8%) | 58 (27.2%) |
| 15 Years | 23 (26.1%) | 39 (41.0%) |
| 16 and 17 Years | 11 (10.3%) | 51 (40.5%) |
| 18 to 24 Years | 144 (19.3%) | 108 (21.0%) |
| 25 to 34 Years | 145 (18.1%) | 196 (33.3%) |
| 35 to 44 Years | 267 (19.7%) | 145 (20.9%) |
| 45 to 54 Years | 161 (27.7%) | 206 (28.2%) |
| 55 to 64 Years | 108 (14.7%) | 208 (25.6%) |
| 65 to 74 Years | 78 (12.9%) | 93 (15.0%) |
| 75 Years and over | 86 (33.1%) | 151 (30.1%) |
| Total | 1,576 (25.1%) | 1,519 (26.3%) |
Income Above Poverty by Sex and Age in Tallahatchie County
According to the poverty statistics in Tallahatchie County, males aged 16 and 17 years and females aged 65 to 74 years are the age groups that are most secure financially, with 89.7% of males and 85.0% of females in these age groups living above the poverty line.
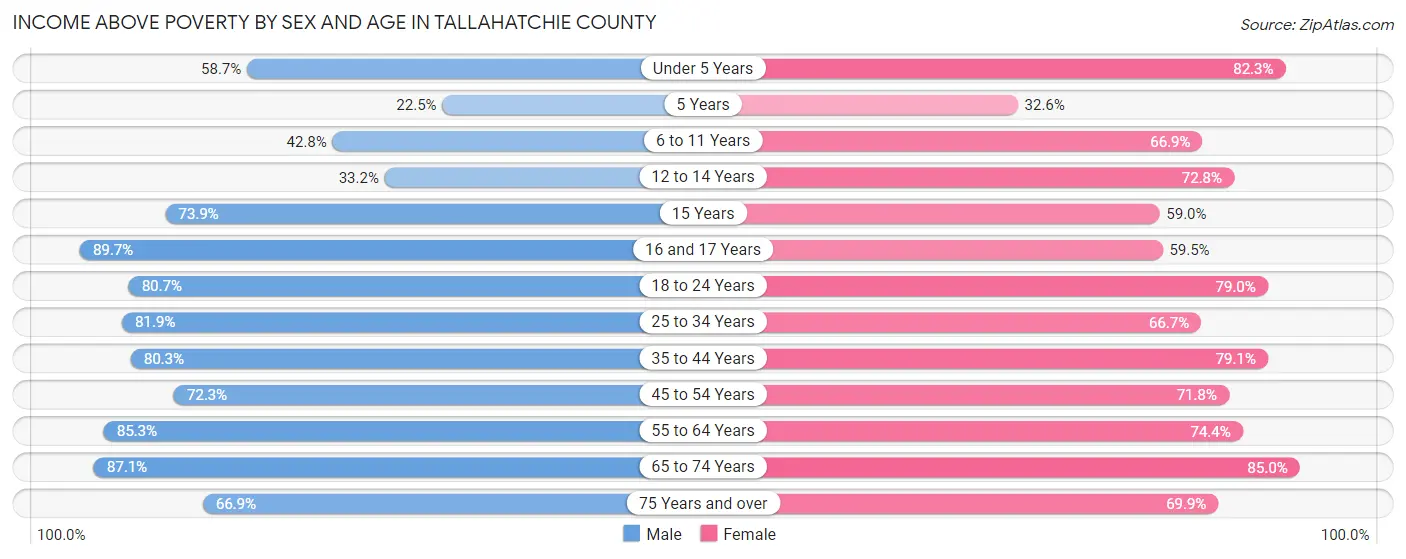
| Age Bracket | Male | Female |
| Under 5 Years | 189 (58.7%) | 321 (82.3%) |
| 5 Years | 11 (22.5%) | 31 (32.6%) |
| 6 to 11 Years | 197 (42.8%) | 265 (66.9%) |
| 12 to 14 Years | 59 (33.2%) | 155 (72.8%) |
| 15 Years | 65 (73.9%) | 56 (59.0%) |
| 16 and 17 Years | 96 (89.7%) | 75 (59.5%) |
| 18 to 24 Years | 601 (80.7%) | 407 (79.0%) |
| 25 to 34 Years | 657 (81.9%) | 392 (66.7%) |
| 35 to 44 Years | 1,087 (80.3%) | 547 (79.0%) |
| 45 to 54 Years | 420 (72.3%) | 525 (71.8%) |
| 55 to 64 Years | 626 (85.3%) | 604 (74.4%) |
| 65 to 74 Years | 528 (87.1%) | 526 (85.0%) |
| 75 Years and over | 174 (66.9%) | 350 (69.9%) |
| Total | 4,710 (74.9%) | 4,254 (73.7%) |
Income Below Poverty Among Married-Couple Families in Tallahatchie County
The poverty statistics for married-couple families in Tallahatchie County show that 8.3% or 124 of the total 1,496 families live below the poverty line. Families with 3 or 4 children have the highest poverty rate of 27.7%, comprising of 31 families. On the other hand, families with no children have the lowest poverty rate of 5.8%, which includes 56 families.
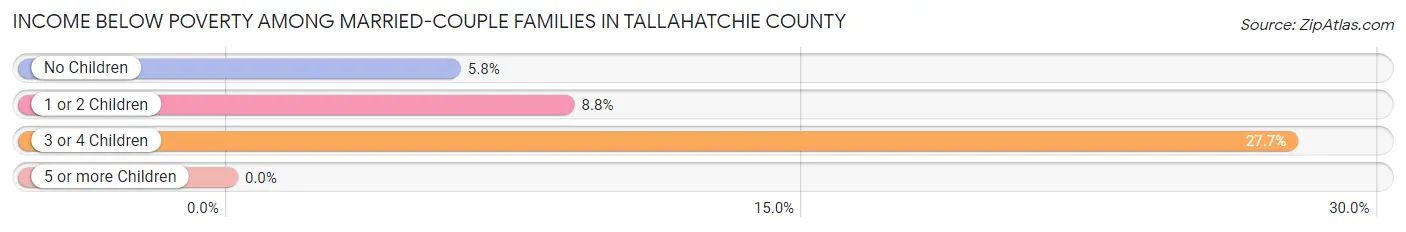
| Children | Above Poverty | Below Poverty |
| No Children | 907 (94.2%) | 56 (5.8%) |
| 1 or 2 Children | 384 (91.2%) | 37 (8.8%) |
| 3 or 4 Children | 81 (72.3%) | 31 (27.7%) |
| 5 or more Children | 0 (0.0%) | 0 (0.0%) |
| Total | 1,372 (91.7%) | 124 (8.3%) |
Income Below Poverty Among Single-Parent Households in Tallahatchie County
According to the poverty data in Tallahatchie County, 17.9% or 77 single-father households and 44.4% or 400 single-mother households are living below the poverty line. Among single-father households, those with 1 or 2 children have the highest poverty rate, with 68 households (39.5%) experiencing poverty. Likewise, among single-mother households, those with 5 or more children have the highest poverty rate, with 4 households (100.0%) falling below the poverty line.
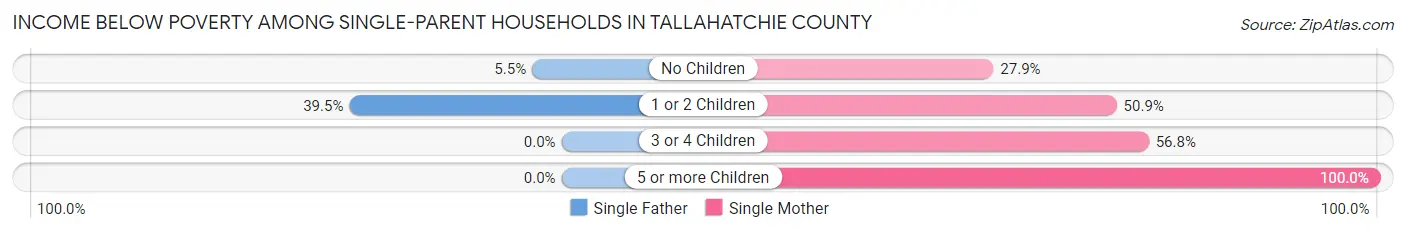
| Children | Single Father | Single Mother |
| No Children | 9 (5.5%) | 82 (27.9%) |
| 1 or 2 Children | 68 (39.5%) | 239 (50.8%) |
| 3 or 4 Children | 0 (0.0%) | 75 (56.8%) |
| 5 or more Children | 0 (0.0%) | 4 (100.0%) |
| Total | 77 (17.9%) | 400 (44.4%) |
Income Below Poverty Among Married-Couple vs Single-Parent Households in Tallahatchie County
The poverty data for Tallahatchie County shows that 124 of the married-couple family households (8.3%) and 477 of the single-parent households (35.9%) are living below the poverty level. Within the married-couple family households, those with 3 or 4 children have the highest poverty rate, with 31 households (27.7%) falling below the poverty line. Among the single-parent households, those with 5 or more children have the highest poverty rate, with 4 household (100.0%) living below poverty.
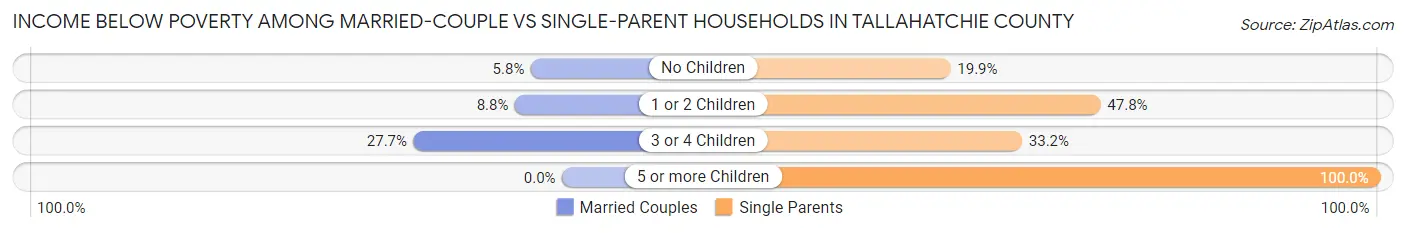
| Children | Married-Couple Families | Single-Parent Households |
| No Children | 56 (5.8%) | 91 (19.9%) |
| 1 or 2 Children | 37 (8.8%) | 307 (47.8%) |
| 3 or 4 Children | 31 (27.7%) | 75 (33.2%) |
| 5 or more Children | 0 (0.0%) | 4 (100.0%) |
| Total | 124 (8.3%) | 477 (35.9%) |
Race in Tallahatchie County
The most populous races in Tallahatchie County are Black / African American (7,764 | 61.5%), White / Caucasian (4,441 | 35.2%), and Two or more Races (243 | 1.9%).
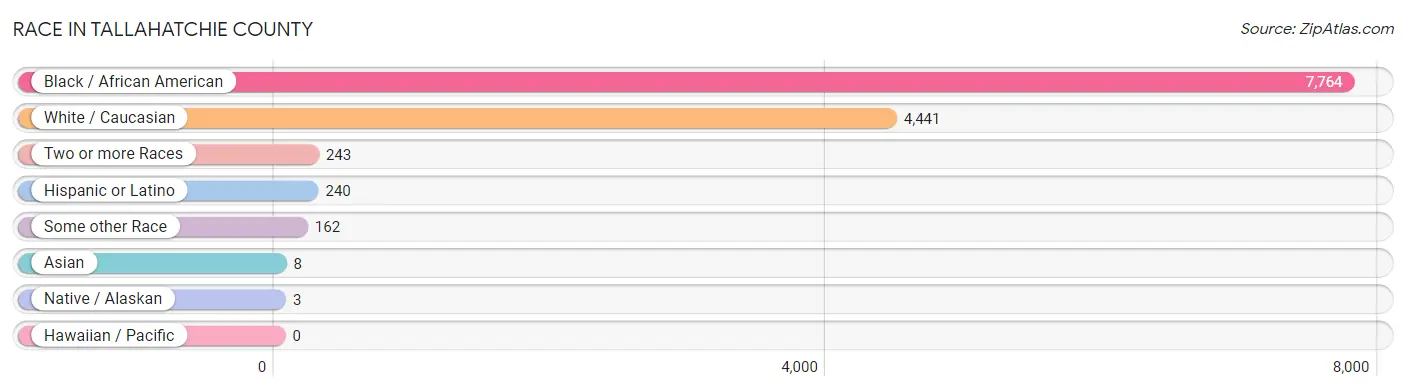
| Race | # Population | % Population |
| Asian | 8 | 0.1% |
| Black / African American | 7,764 | 61.5% |
| Hawaiian / Pacific | 0 | 0.0% |
| Hispanic or Latino | 240 | 1.9% |
| Native / Alaskan | 3 | 0.0% |
| White / Caucasian | 4,441 | 35.2% |
| Two or more Races | 243 | 1.9% |
| Some other Race | 162 | 1.3% |
| Total | 12,621 | 100.0% |
Ancestry in Tallahatchie County
The most populous ancestries reported in Tallahatchie County are English (1,738 | 13.8%), Irish (535 | 4.2%), American (419 | 3.3%), German (359 | 2.8%), and Scotch-Irish (215 | 1.7%), together accounting for 25.9% of all Tallahatchie County residents.
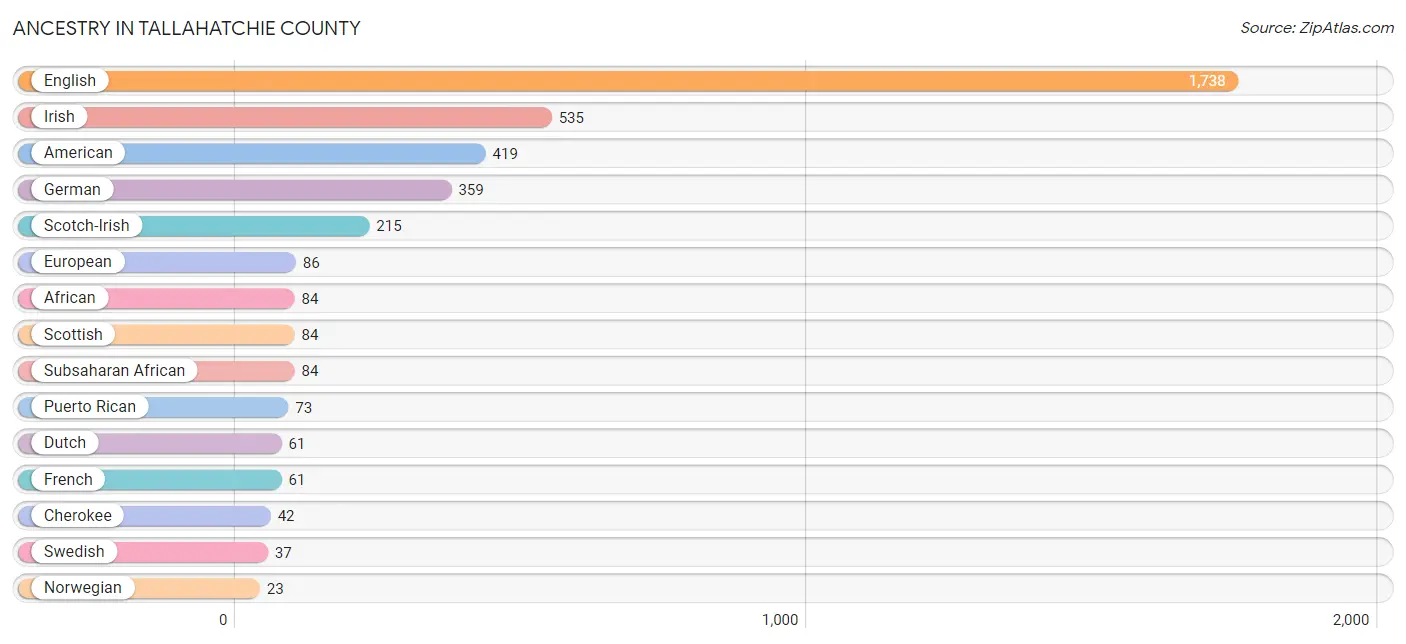
| Ancestry | # Population | % Population |
| African | 84 | 0.7% |
| American | 419 | 3.3% |
| Central American | 4 | 0.0% |
| Cherokee | 42 | 0.3% |
| Choctaw | 2 | 0.0% |
| Creek | 1 | 0.0% |
| Cuban | 4 | 0.0% |
| Danish | 13 | 0.1% |
| Dutch | 61 | 0.5% |
| Ecuadorian | 1 | 0.0% |
| English | 1,738 | 13.8% |
| European | 86 | 0.7% |
| French | 61 | 0.5% |
| French Canadian | 14 | 0.1% |
| German | 359 | 2.8% |
| Guatemalan | 1 | 0.0% |
| Honduran | 1 | 0.0% |
| Irish | 535 | 4.2% |
| Italian | 17 | 0.1% |
| Mexican | 7 | 0.1% |
| Norwegian | 23 | 0.2% |
| Puerto Rican | 73 | 0.6% |
| Russian | 1 | 0.0% |
| Salvadoran | 2 | 0.0% |
| Scotch-Irish | 215 | 1.7% |
| Scottish | 84 | 0.7% |
| Slovak | 6 | 0.1% |
| South American | 2 | 0.0% |
| South American Indian | 1 | 0.0% |
| Sri Lankan | 6 | 0.1% |
| Subsaharan African | 84 | 0.7% |
| Swedish | 37 | 0.3% |
| Thai | 11 | 0.1% |
| Venezuelan | 1 | 0.0% |
| Welsh | 19 | 0.2% | View All 35 Rows |
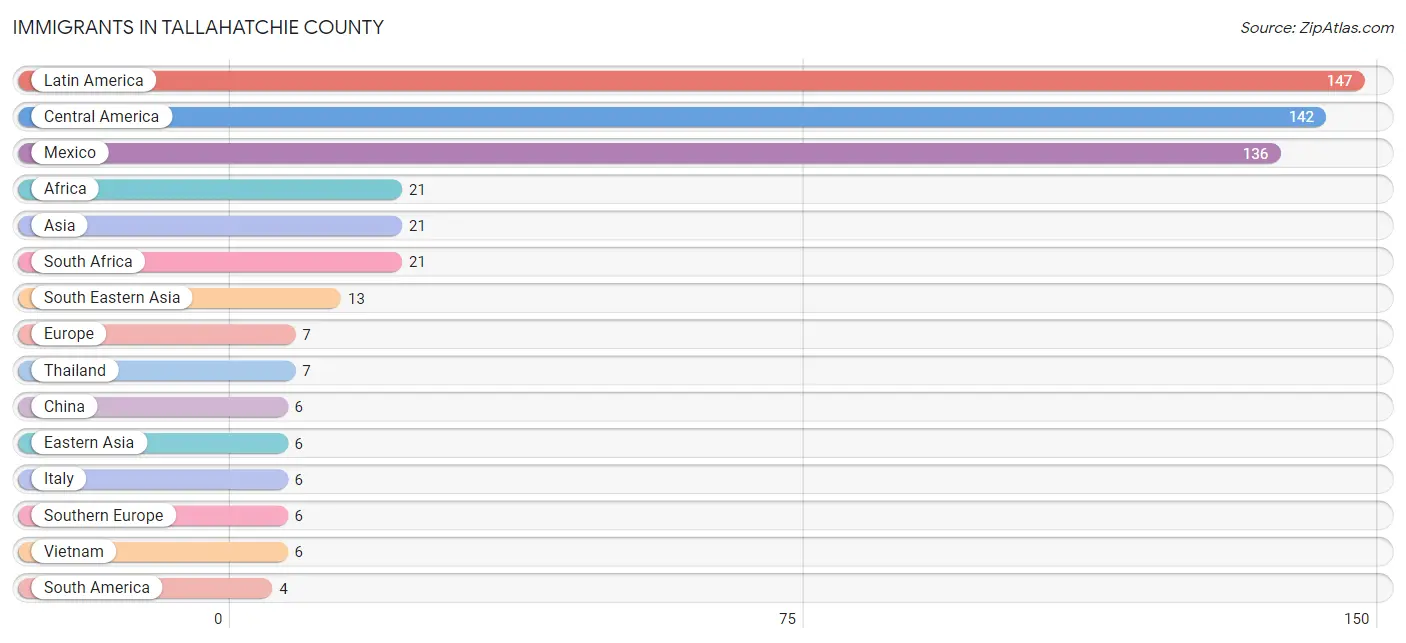
Immigrants in Tallahatchie County
The most numerous immigrant groups reported in Tallahatchie County came from Latin America (147 | 1.2%), Central America (142 | 1.1%), Mexico (136 | 1.1%), Africa (21 | 0.2%), and Asia (21 | 0.2%), together accounting for 3.7% of all Tallahatchie County residents.
| Immigration Origin | # Population | % Population |
| Africa | 21 | 0.2% |
| Asia | 21 | 0.2% |
| Caribbean | 1 | 0.0% |
| Central America | 142 | 1.1% |
| China | 6 | 0.1% |
| Cuba | 1 | 0.0% |
| Eastern Asia | 6 | 0.1% |
| Eastern Europe | 1 | 0.0% |
| Ecuador | 1 | 0.0% |
| El Salvador | 1 | 0.0% |
| Europe | 7 | 0.1% |
| Guatemala | 2 | 0.0% |
| Honduras | 2 | 0.0% |
| India | 2 | 0.0% |
| Italy | 6 | 0.1% |
| Latin America | 147 | 1.2% |
| Mexico | 136 | 1.1% |
| Panama | 1 | 0.0% |
| Russia | 1 | 0.0% |
| South Africa | 21 | 0.2% |
| South America | 4 | 0.0% |
| South Central Asia | 2 | 0.0% |
| South Eastern Asia | 13 | 0.1% |
| Southern Europe | 6 | 0.1% |
| Thailand | 7 | 0.1% |
| Venezuela | 3 | 0.0% |
| Vietnam | 6 | 0.1% | View All 27 Rows |
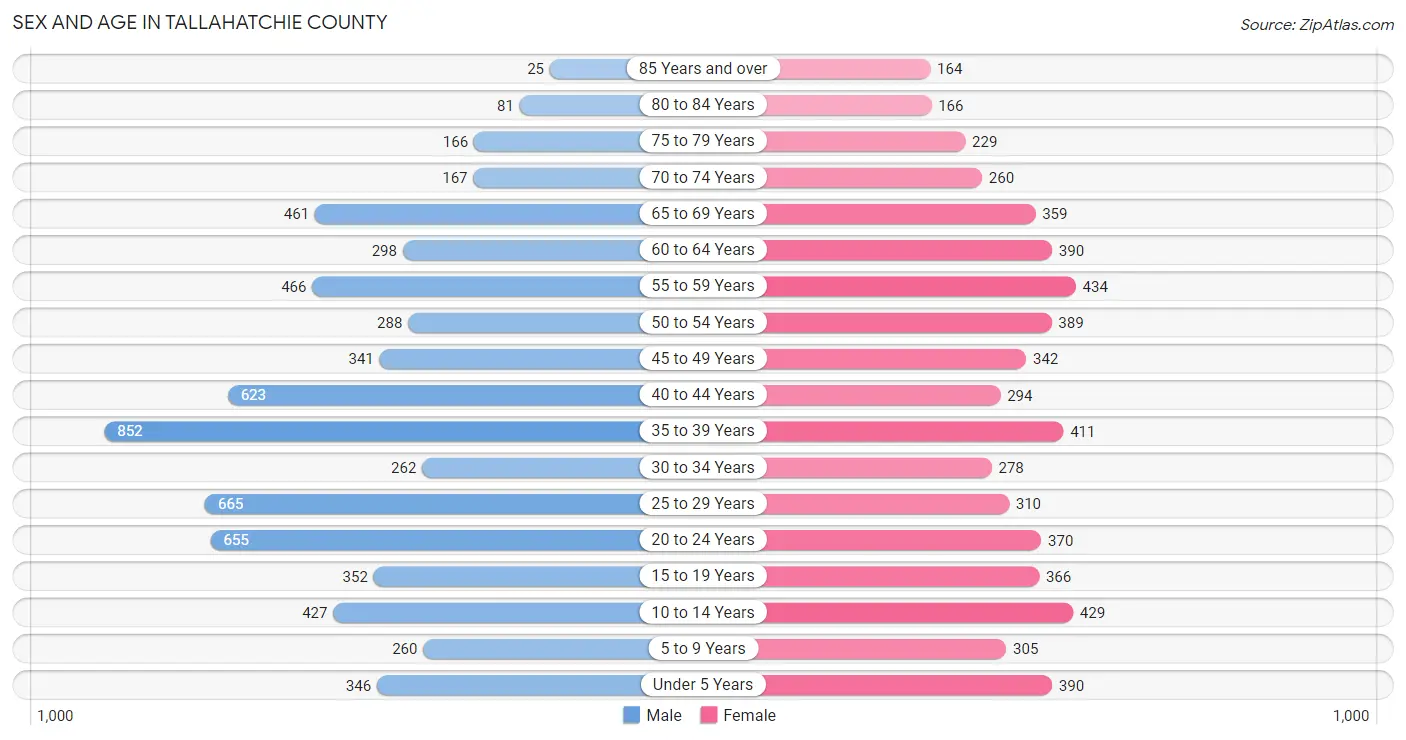
Sex and Age in Tallahatchie County
Sex and Age in Tallahatchie County
The most populous age groups in Tallahatchie County are 35 to 39 Years (852 | 12.7%) for men and 55 to 59 Years (434 | 7.4%) for women.
| Age Bracket | Male | Female |
| Under 5 Years | 346 (5.1%) | 390 (6.6%) |
| 5 to 9 Years | 260 (3.9%) | 305 (5.2%) |
| 10 to 14 Years | 427 (6.3%) | 429 (7.3%) |
| 15 to 19 Years | 352 (5.2%) | 366 (6.2%) |
| 20 to 24 Years | 655 (9.7%) | 370 (6.3%) |
| 25 to 29 Years | 665 (9.9%) | 310 (5.3%) |
| 30 to 34 Years | 262 (3.9%) | 278 (4.7%) |
| 35 to 39 Years | 852 (12.7%) | 411 (7.0%) |
| 40 to 44 Years | 623 (9.2%) | 294 (5.0%) |
| 45 to 49 Years | 341 (5.1%) | 342 (5.8%) |
| 50 to 54 Years | 288 (4.3%) | 389 (6.6%) |
| 55 to 59 Years | 466 (6.9%) | 434 (7.4%) |
| 60 to 64 Years | 298 (4.4%) | 390 (6.6%) |
| 65 to 69 Years | 461 (6.8%) | 359 (6.1%) |
| 70 to 74 Years | 167 (2.5%) | 260 (4.4%) |
| 75 to 79 Years | 166 (2.5%) | 229 (3.9%) |
| 80 to 84 Years | 81 (1.2%) | 166 (2.8%) |
| 85 Years and over | 25 (0.4%) | 164 (2.8%) |
| Total | 6,735 (100.0%) | 5,886 (100.0%) |
Families and Households in Tallahatchie County
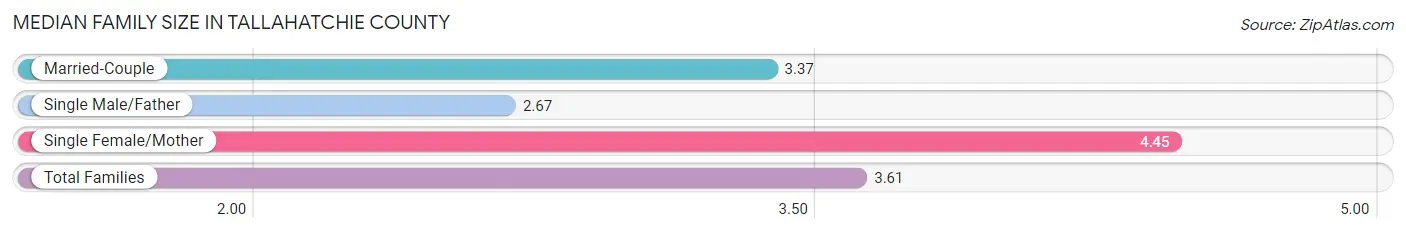
Median Family Size in Tallahatchie County
The median family size in Tallahatchie County is 3.61 persons per family, with single female/mother families (900 | 31.9%) accounting for the largest median family size of 4.45 persons per family. On the other hand, single male/father families (430 | 15.2%) represent the smallest median family size with 2.67 persons per family.
| Family Type | # Families | Family Size |
| Married-Couple | 1,496 (52.9%) | 3.37 |
| Single Male/Father | 430 (15.2%) | 2.67 |
| Single Female/Mother | 900 (31.9%) | 4.45 |
| Total Families | 2,826 (100.0%) | 3.61 |
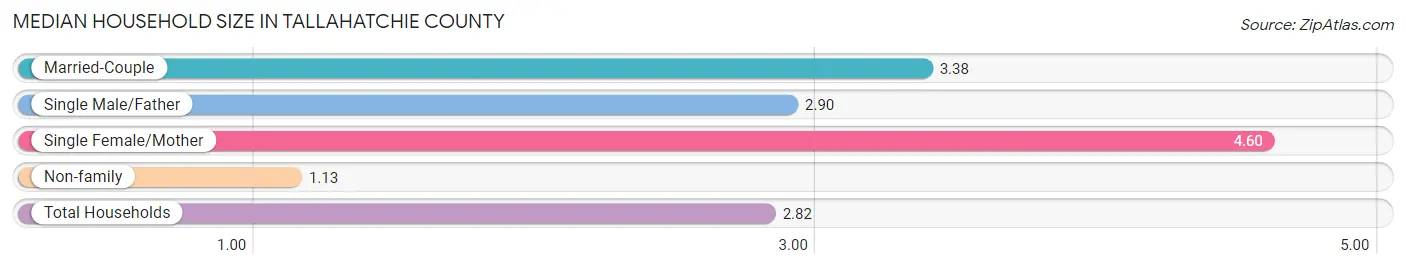
Median Household Size in Tallahatchie County
The median household size in Tallahatchie County is 2.82 persons per household, with single female/mother households (900 | 20.9%) accounting for the largest median household size of 4.6 persons per household. non-family households (1,475 | 34.3%) represent the smallest median household size with 1.13 persons per household.
| Household Type | # Households | Household Size |
| Married-Couple | 1,496 (34.8%) | 3.38 |
| Single Male/Father | 430 (10.0%) | 2.90 |
| Single Female/Mother | 900 (20.9%) | 4.60 |
| Non-family | 1,475 (34.3%) | 1.13 |
| Total Households | 4,301 (100.0%) | 2.82 |
Household Size by Marriage Status in Tallahatchie County
Out of a total of 4,301 households in Tallahatchie County, 2,826 (65.7%) are family households, while 1,475 (34.3%) are nonfamily households. The most numerous type of family households are 2-person households, comprising 1,156, and the most common type of nonfamily households are 1-person households, comprising 1,295.
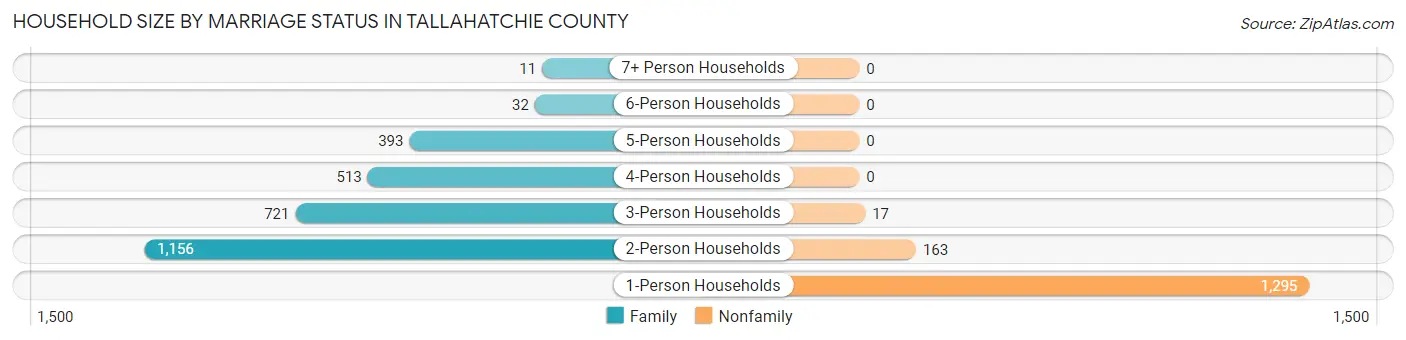
| Household Size | Family Households | Nonfamily Households |
| 1-Person Households | - | 1,295 (30.1%) |
| 2-Person Households | 1,156 (26.9%) | 163 (3.8%) |
| 3-Person Households | 721 (16.8%) | 17 (0.4%) |
| 4-Person Households | 513 (11.9%) | 0 (0.0%) |
| 5-Person Households | 393 (9.1%) | 0 (0.0%) |
| 6-Person Households | 32 (0.7%) | 0 (0.0%) |
| 7+ Person Households | 11 (0.3%) | 0 (0.0%) |
| Total | 2,826 (65.7%) | 1,475 (34.3%) |
Female Fertility in Tallahatchie County
Fertility by Age in Tallahatchie County
Average fertility rate in Tallahatchie County is 34.0 births per 1,000 women. Women in the age bracket of 20 to 34 years have the highest fertility rate with 90.0 births per 1,000 women. Women in the age bracket of 20 to 34 years acount for 100.0% of all women with births.
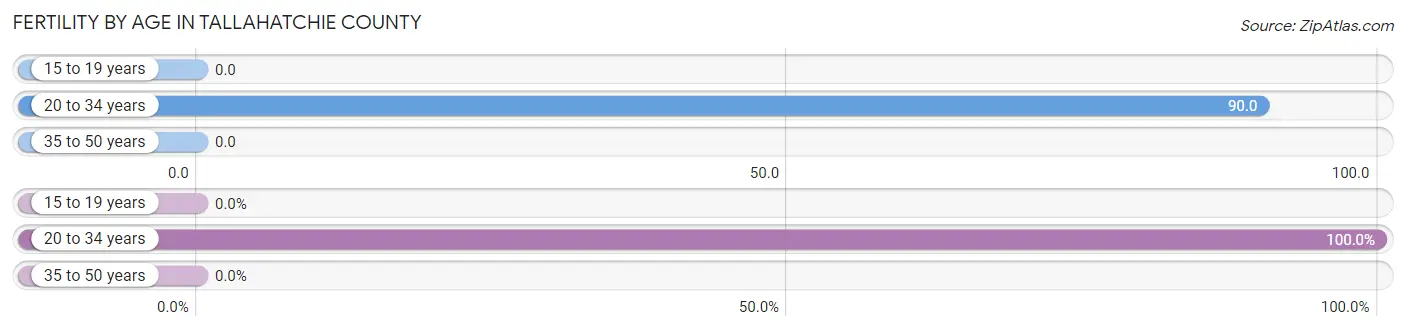
| Age Bracket | Women with Births | Births / 1,000 Women |
| 15 to 19 years | 0 (0.0%) | 0.0 |
| 20 to 34 years | 86 (100.0%) | 90.0 |
| 35 to 50 years | 0 (0.0%) | 0.0 |
| Total | 86 (100.0%) | 34.0 |
Fertility by Age by Marriage Status in Tallahatchie County
46.5% of women with births (86) in Tallahatchie County are married. The highest percentage of unmarried women with births falls into 20 to 34 years age bracket with 53.5% of them unmarried at the time of birth, while the lowest percentage of unmarried women with births belong to 20 to 34 years age bracket with 53.5% of them unmarried.
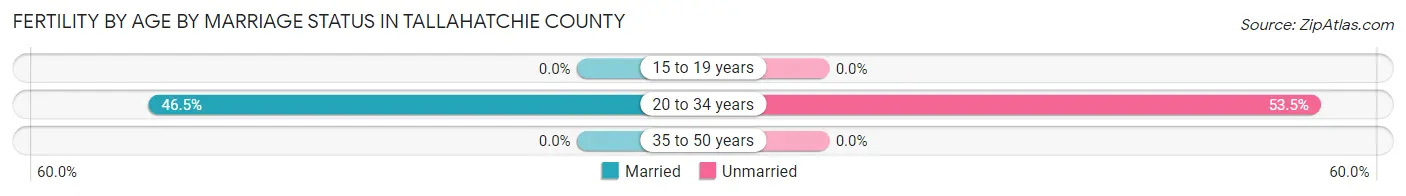
| Age Bracket | Married | Unmarried |
| 15 to 19 years | 0 (0.0%) | 0 (0.0%) |
| 20 to 34 years | 40 (46.5%) | 46 (53.5%) |
| 35 to 50 years | 0 (0.0%) | 0 (0.0%) |
| Total | 40 (46.5%) | 46 (53.5%) |
Fertility by Education in Tallahatchie County
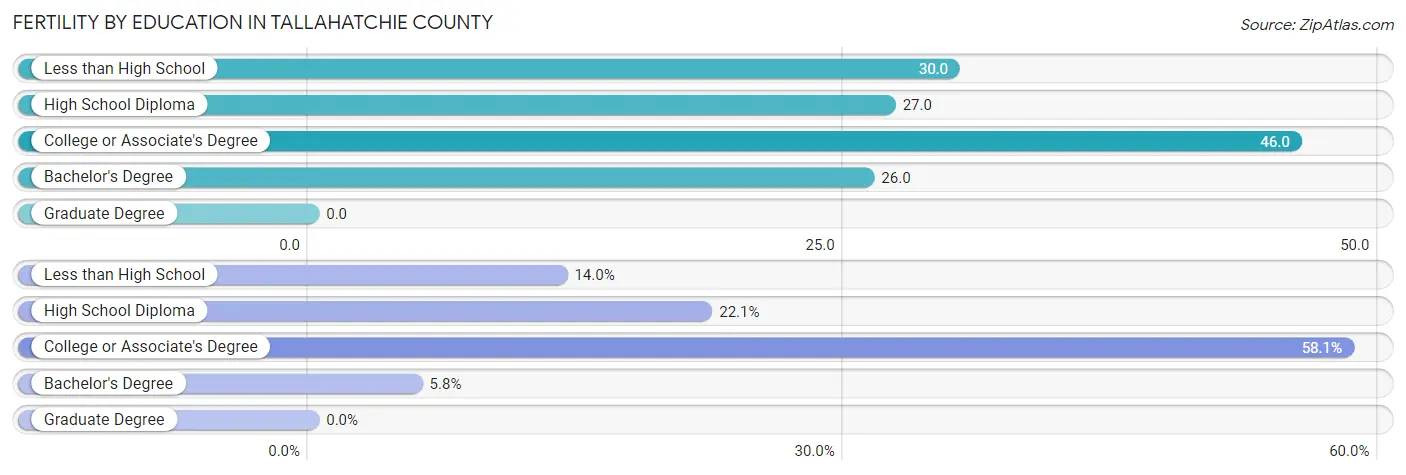
| Educational Attainment | Women with Births | Births / 1,000 Women |
| Less than High School | 12 (14.0%) | 30.0 |
| High School Diploma | 19 (22.1%) | 27.0 |
| College or Associate's Degree | 50 (58.1%) | 46.0 |
| Bachelor's Degree | 5 (5.8%) | 26.0 |
| Graduate Degree | 0 (0.0%) | 0.0 |
| Total | 86 (100.0%) | 34.0 |
Fertility by Education by Marriage Status in Tallahatchie County
53.5% of women with births in Tallahatchie County are unmarried. Women with the educational attainment of less than high school are most likely to be married with 100.0% of them married at childbirth, while women with the educational attainment of high school diploma are least likely to be married with 100.0% of them unmarried at childbirth.
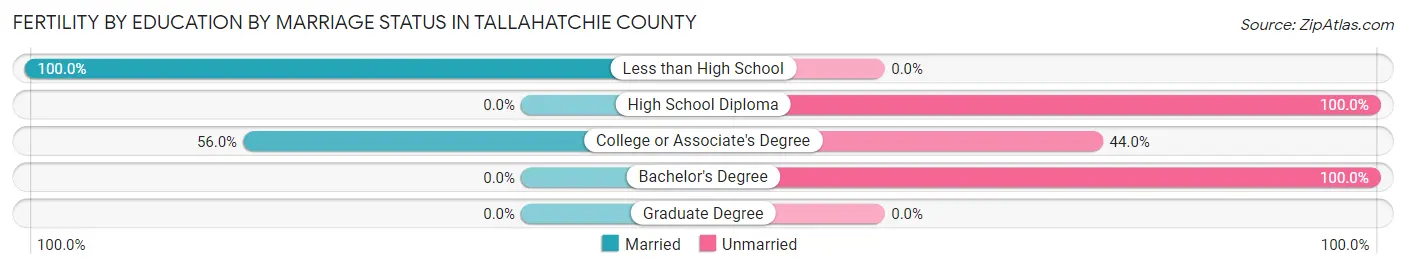
| Educational Attainment | Married | Unmarried |
| Less than High School | 12 (100.0%) | 0 (0.0%) |
| High School Diploma | 0 (0.0%) | 19 (100.0%) |
| College or Associate's Degree | 28 (56.0%) | 22 (44.0%) |
| Bachelor's Degree | 0 (0.0%) | 5 (100.0%) |
| Graduate Degree | 0 (0.0%) | 0 (0.0%) |
| Total | 40 (46.5%) | 46 (53.5%) |
Employment Characteristics in Tallahatchie County
Employment by Class of Employer in Tallahatchie County
Among the 4,407 employed individuals in Tallahatchie County, private company employees (2,668 | 60.5%), state government employees (751 | 17.0%), and self-employed (not incorporated) (412 | 9.3%) make up the most common classes of employment.
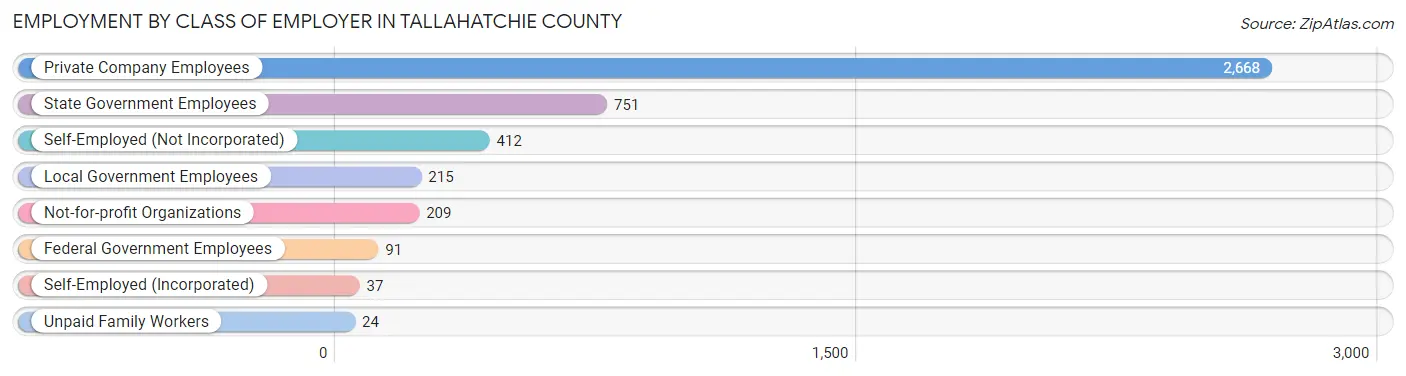
| Employer Class | # Employees | % Employees |
| Private Company Employees | 2,668 | 60.5% |
| Self-Employed (Incorporated) | 37 | 0.8% |
| Self-Employed (Not Incorporated) | 412 | 9.3% |
| Not-for-profit Organizations | 209 | 4.7% |
| Local Government Employees | 215 | 4.9% |
| State Government Employees | 751 | 17.0% |
| Federal Government Employees | 91 | 2.1% |
| Unpaid Family Workers | 24 | 0.5% |
| Total | 4,407 | 100.0% |
Employment Status by Age in Tallahatchie County
According to the labor force statistics for Tallahatchie County, out of the total population over 16 years of age (10,281), 48.9% or 5,027 individuals are in the labor force, with 11.0% or 553 of them unemployed. The age group with the highest labor force participation rate is 35 to 44 years, with 71.4% or 1,557 individuals in the labor force. Within the labor force, the 16 to 19 years age range has the highest percentage of unemployed individuals, with 57.1% or 24 of them being unemployed.
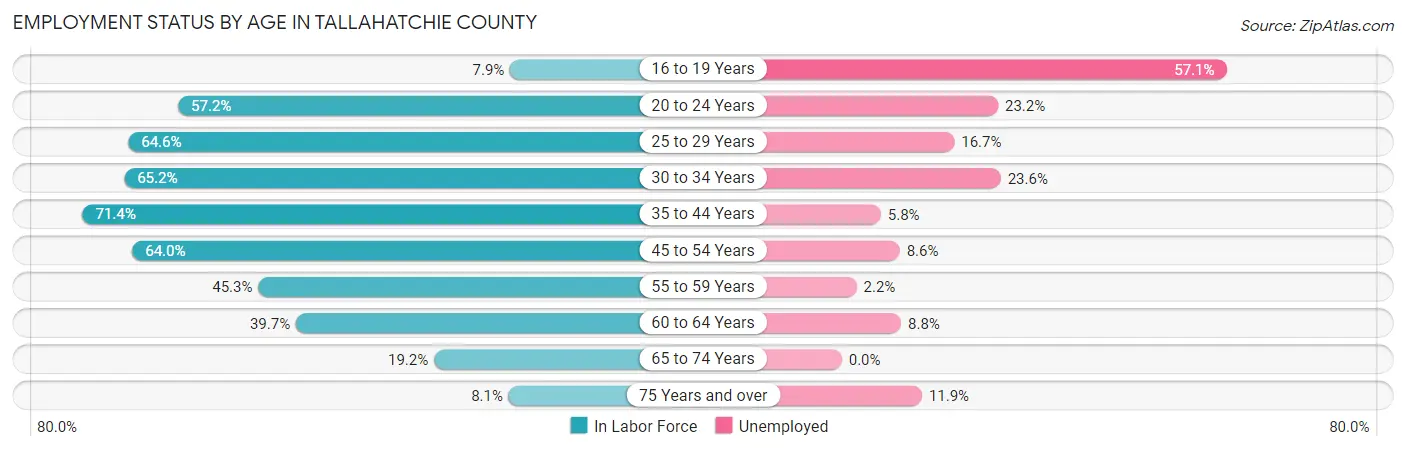
| Age Bracket | In Labor Force | Unemployed |
| 16 to 19 Years | 42 (7.9%) | 24 (57.1%) |
| 20 to 24 Years | 586 (57.2%) | 136 (23.2%) |
| 25 to 29 Years | 630 (64.6%) | 105 (16.7%) |
| 30 to 34 Years | 352 (65.2%) | 83 (23.6%) |
| 35 to 44 Years | 1,557 (71.4%) | 90 (5.8%) |
| 45 to 54 Years | 870 (64.0%) | 75 (8.6%) |
| 55 to 59 Years | 408 (45.3%) | 9 (2.2%) |
| 60 to 64 Years | 273 (39.7%) | 24 (8.8%) |
| 65 to 74 Years | 239 (19.2%) | 0 (0.0%) |
| 75 Years and over | 67 (8.1%) | 8 (11.9%) |
| Total | 5,027 (48.9%) | 553 (11.0%) |
Employment Status by Educational Attainment in Tallahatchie County
According to labor force statistics for Tallahatchie County, 61.6% of individuals (4,092) out of the total population between 25 and 64 years of age (6,643) are in the labor force, with 9.5% or 389 of them being unemployed. The group with the highest labor force participation rate are those with the educational attainment of bachelor's degree or higher, with 77.9% or 637 individuals in the labor force. Within the labor force, individuals with less than high school education have the highest percentage of unemployment, with 18.7% or 87 of them being unemployed.
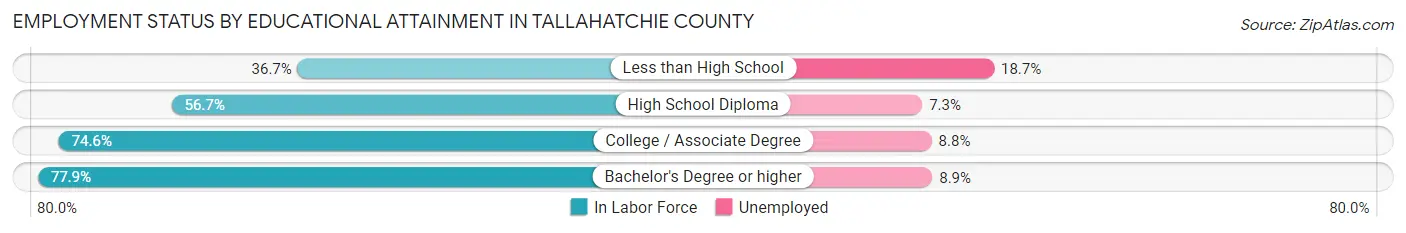
| Educational Attainment | In Labor Force | Unemployed |
| Less than High School | 466 (36.7%) | 237 (18.7%) |
| High School Diploma | 1,312 (56.7%) | 169 (7.3%) |
| College / Associate Degree | 1,673 (74.6%) | 197 (8.8%) |
| Bachelor's Degree or higher | 637 (77.9%) | 73 (8.9%) |
| Total | 4,092 (61.6%) | 631 (9.5%) |
Employment Occupations by Sex in Tallahatchie County
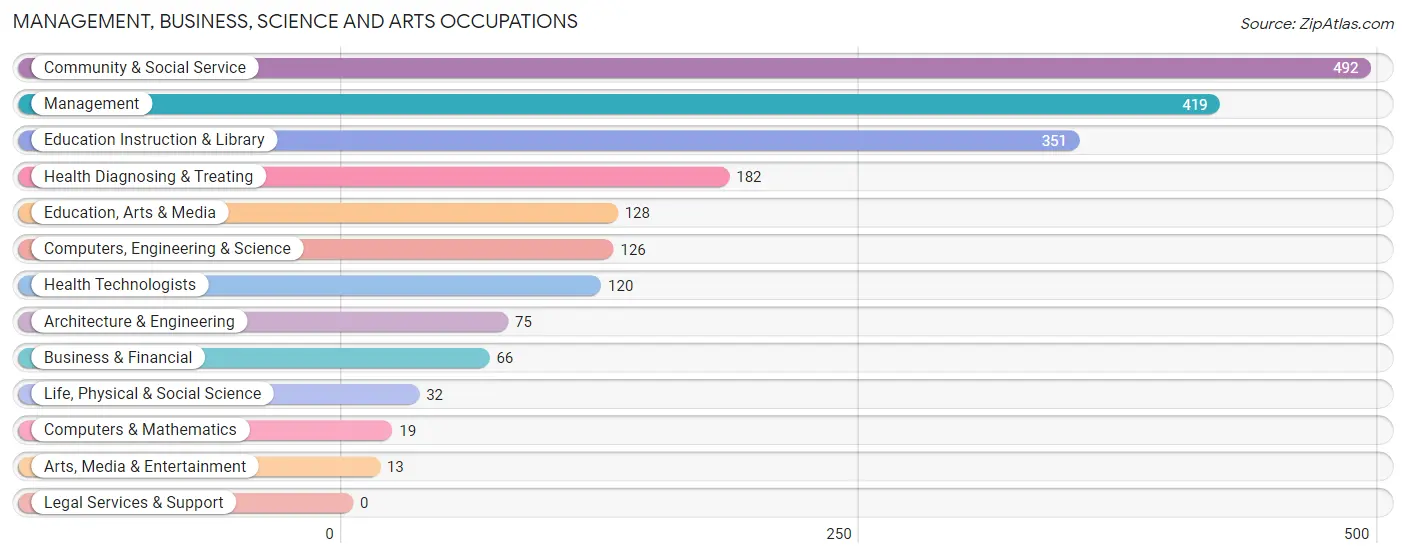
Management, Business, Science and Arts Occupations
The most common Management, Business, Science and Arts occupations in Tallahatchie County are Community & Social Service (492 | 11.0%), Management (419 | 9.4%), Education Instruction & Library (351 | 7.9%), Health Diagnosing & Treating (182 | 4.1%), and Education, Arts & Media (128 | 2.9%).
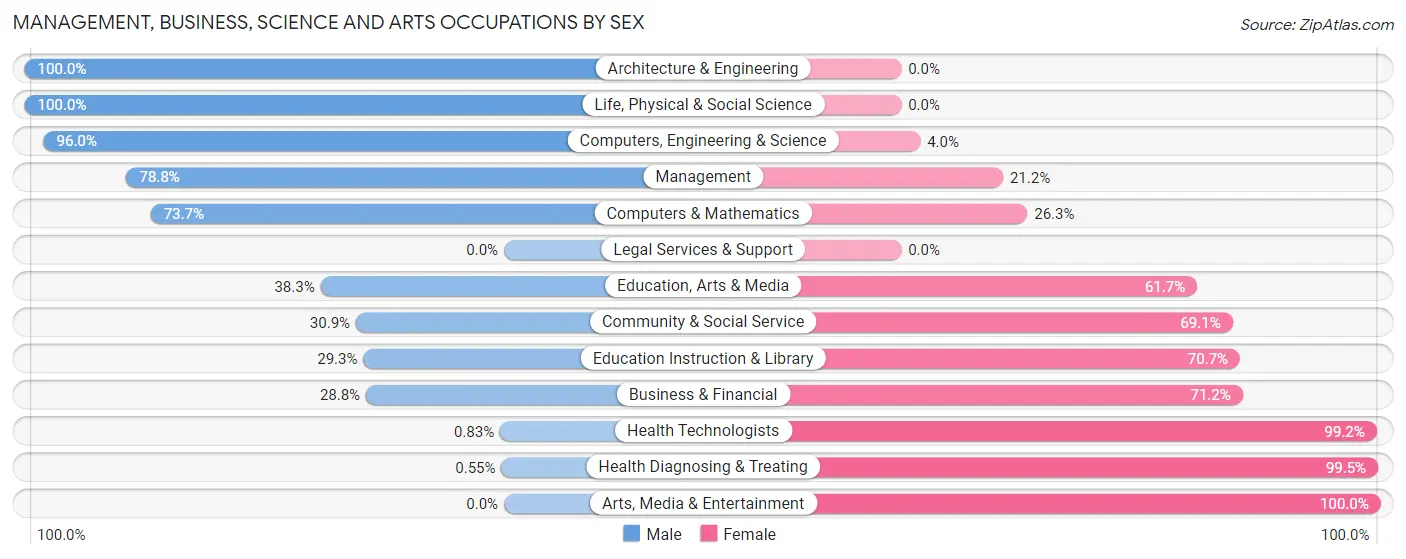
Management, Business, Science and Arts Occupations by Sex
Within the Management, Business, Science and Arts occupations in Tallahatchie County, the most male-oriented occupations are Architecture & Engineering (100.0%), Life, Physical & Social Science (100.0%), and Computers, Engineering & Science (96.0%), while the most female-oriented occupations are Arts, Media & Entertainment (100.0%), Health Diagnosing & Treating (99.5%), and Health Technologists (99.2%).
| Occupation | Male | Female |
| Management | 330 (78.8%) | 89 (21.2%) |
| Business & Financial | 19 (28.8%) | 47 (71.2%) |
| Computers, Engineering & Science | 121 (96.0%) | 5 (4.0%) |
| Computers & Mathematics | 14 (73.7%) | 5 (26.3%) |
| Architecture & Engineering | 75 (100.0%) | 0 (0.0%) |
| Life, Physical & Social Science | 32 (100.0%) | 0 (0.0%) |
| Community & Social Service | 152 (30.9%) | 340 (69.1%) |
| Education, Arts & Media | 49 (38.3%) | 79 (61.7%) |
| Legal Services & Support | 0 (0.0%) | 0 (0.0%) |
| Education Instruction & Library | 103 (29.3%) | 248 (70.7%) |
| Arts, Media & Entertainment | 0 (0.0%) | 13 (100.0%) |
| Health Diagnosing & Treating | 1 (0.5%) | 181 (99.5%) |
| Health Technologists | 1 (0.8%) | 119 (99.2%) |
| Total (Category) | 623 (48.5%) | 662 (51.5%) |
| Total (Overall) | 2,709 (60.6%) | 1,759 (39.4%) |
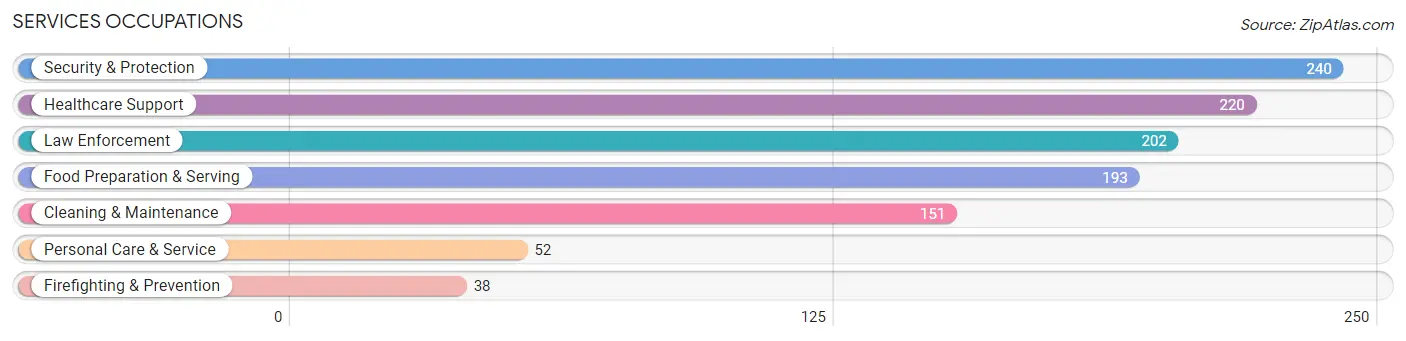
Services Occupations
The most common Services occupations in Tallahatchie County are Security & Protection (240 | 5.4%), Healthcare Support (220 | 4.9%), Law Enforcement (202 | 4.5%), Food Preparation & Serving (193 | 4.3%), and Cleaning & Maintenance (151 | 3.4%).
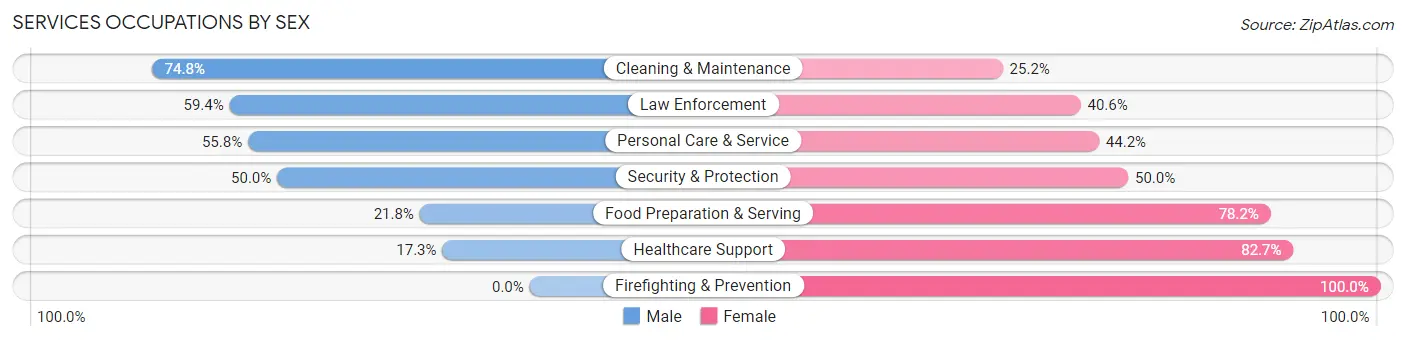
Services Occupations by Sex
Within the Services occupations in Tallahatchie County, the most male-oriented occupations are Cleaning & Maintenance (74.8%), Law Enforcement (59.4%), and Personal Care & Service (55.8%), while the most female-oriented occupations are Firefighting & Prevention (100.0%), Healthcare Support (82.7%), and Food Preparation & Serving (78.2%).
| Occupation | Male | Female |
| Healthcare Support | 38 (17.3%) | 182 (82.7%) |
| Security & Protection | 120 (50.0%) | 120 (50.0%) |
| Firefighting & Prevention | 0 (0.0%) | 38 (100.0%) |
| Law Enforcement | 120 (59.4%) | 82 (40.6%) |
| Food Preparation & Serving | 42 (21.8%) | 151 (78.2%) |
| Cleaning & Maintenance | 113 (74.8%) | 38 (25.2%) |
| Personal Care & Service | 29 (55.8%) | 23 (44.2%) |
| Total (Category) | 342 (40.0%) | 514 (60.1%) |
| Total (Overall) | 2,709 (60.6%) | 1,759 (39.4%) |
Sales and Office Occupations
The most common Sales and Office occupations in Tallahatchie County are Office & Administration (297 | 6.7%), and Sales & Related (234 | 5.2%).
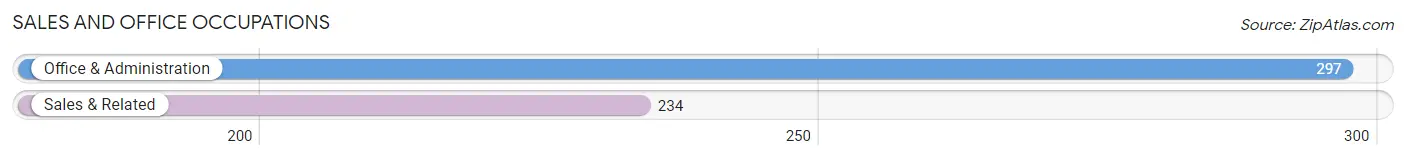
Sales and Office Occupations by Sex
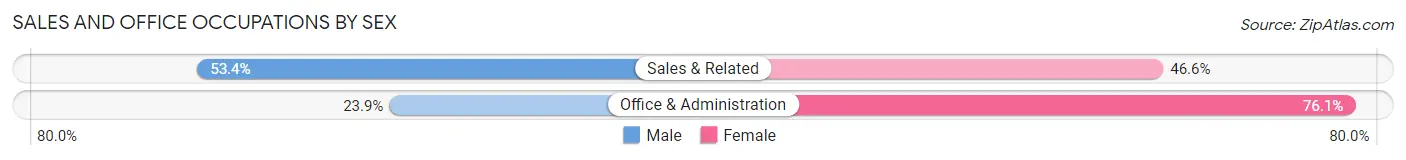
| Occupation | Male | Female |
| Sales & Related | 125 (53.4%) | 109 (46.6%) |
| Office & Administration | 71 (23.9%) | 226 (76.1%) |
| Total (Category) | 196 (36.9%) | 335 (63.1%) |
| Total (Overall) | 2,709 (60.6%) | 1,759 (39.4%) |
Natural Resources, Construction and Maintenance Occupations
The most common Natural Resources, Construction and Maintenance occupations in Tallahatchie County are Installation, Maintenance & Repair (174 | 3.9%), Construction & Extraction (169 | 3.8%), and Farming, Fishing & Forestry (149 | 3.3%).
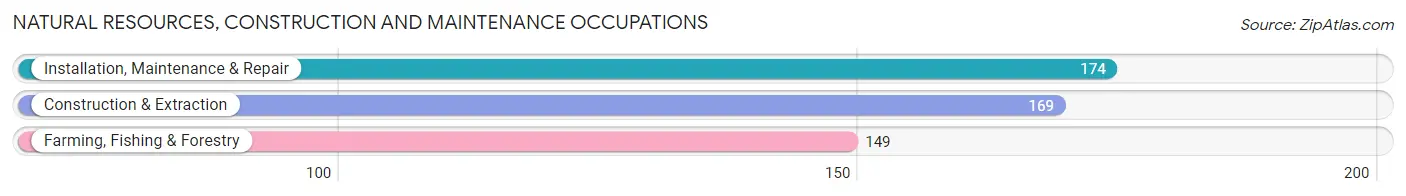
Natural Resources, Construction and Maintenance Occupations by Sex
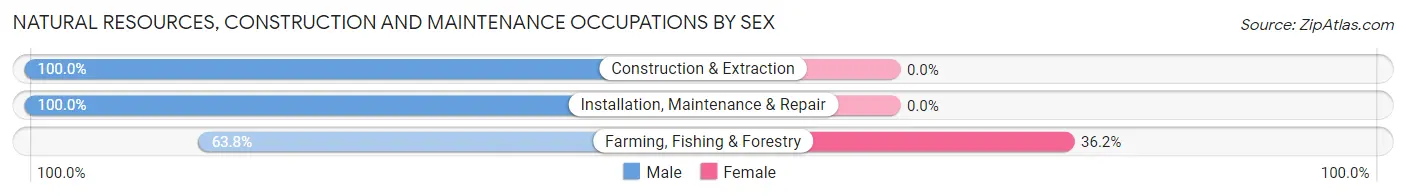
| Occupation | Male | Female |
| Farming, Fishing & Forestry | 95 (63.8%) | 54 (36.2%) |
| Construction & Extraction | 169 (100.0%) | 0 (0.0%) |
| Installation, Maintenance & Repair | 174 (100.0%) | 0 (0.0%) |
| Total (Category) | 438 (89.0%) | 54 (11.0%) |
| Total (Overall) | 2,709 (60.6%) | 1,759 (39.4%) |
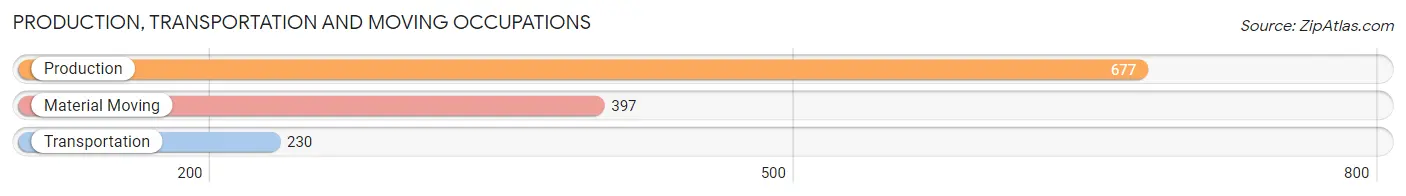
Production, Transportation and Moving Occupations
The most common Production, Transportation and Moving occupations in Tallahatchie County are Production (677 | 15.1%), Material Moving (397 | 8.9%), and Transportation (230 | 5.1%).
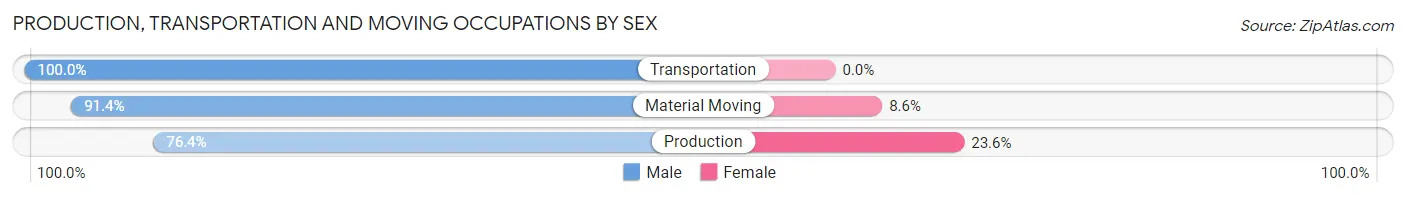
Production, Transportation and Moving Occupations by Sex
| Occupation | Male | Female |
| Production | 517 (76.4%) | 160 (23.6%) |
| Transportation | 230 (100.0%) | 0 (0.0%) |
| Material Moving | 363 (91.4%) | 34 (8.6%) |
| Total (Category) | 1,110 (85.1%) | 194 (14.9%) |
| Total (Overall) | 2,709 (60.6%) | 1,759 (39.4%) |
Employment Industries by Sex in Tallahatchie County
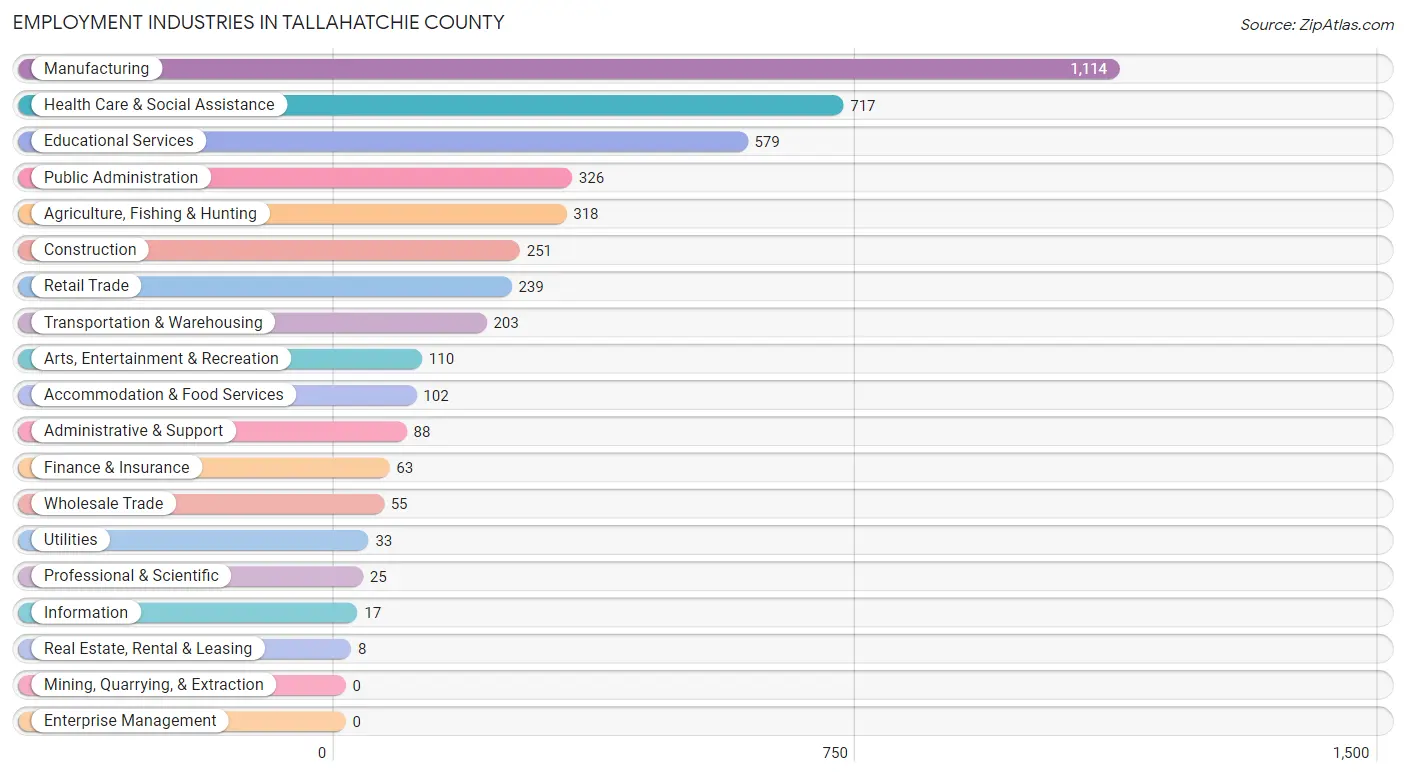
Employment Industries in Tallahatchie County
The major employment industries in Tallahatchie County include Manufacturing (1,114 | 24.9%), Health Care & Social Assistance (717 | 16.1%), Educational Services (579 | 13.0%), Public Administration (326 | 7.3%), and Agriculture, Fishing & Hunting (318 | 7.1%).
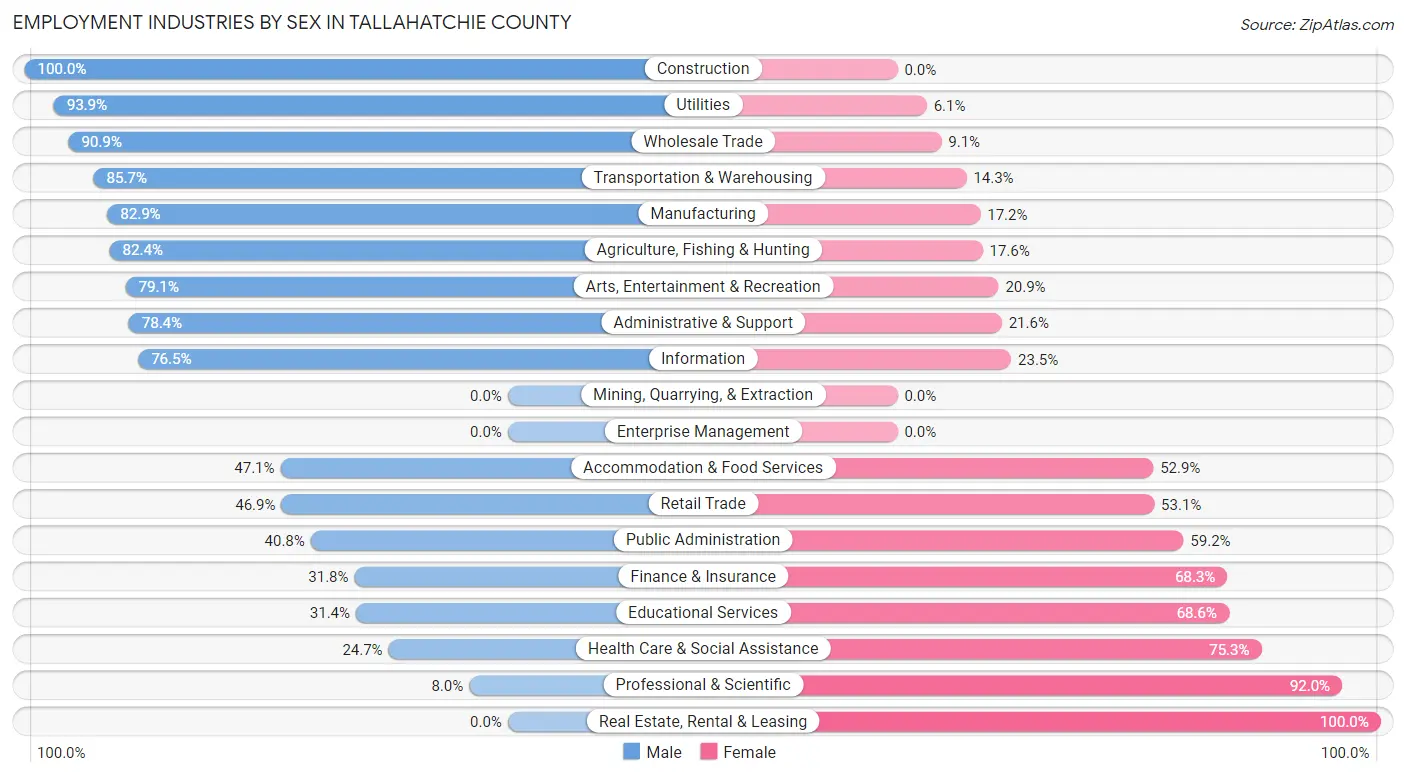
Employment Industries by Sex in Tallahatchie County
The Tallahatchie County industries that see more men than women are Construction (100.0%), Utilities (93.9%), and Wholesale Trade (90.9%), whereas the industries that tend to have a higher number of women are Real Estate, Rental & Leasing (100.0%), Professional & Scientific (92.0%), and Health Care & Social Assistance (75.3%).
| Industry | Male | Female |
| Agriculture, Fishing & Hunting | 262 (82.4%) | 56 (17.6%) |
| Mining, Quarrying, & Extraction | 0 (0.0%) | 0 (0.0%) |
| Construction | 251 (100.0%) | 0 (0.0%) |
| Manufacturing | 923 (82.9%) | 191 (17.2%) |
| Wholesale Trade | 50 (90.9%) | 5 (9.1%) |
| Retail Trade | 112 (46.9%) | 127 (53.1%) |
| Transportation & Warehousing | 174 (85.7%) | 29 (14.3%) |
| Utilities | 31 (93.9%) | 2 (6.1%) |
| Information | 13 (76.5%) | 4 (23.5%) |
| Finance & Insurance | 20 (31.8%) | 43 (68.2%) |
| Real Estate, Rental & Leasing | 0 (0.0%) | 8 (100.0%) |
| Professional & Scientific | 2 (8.0%) | 23 (92.0%) |
| Enterprise Management | 0 (0.0%) | 0 (0.0%) |
| Administrative & Support | 69 (78.4%) | 19 (21.6%) |
| Educational Services | 182 (31.4%) | 397 (68.6%) |
| Health Care & Social Assistance | 177 (24.7%) | 540 (75.3%) |
| Arts, Entertainment & Recreation | 87 (79.1%) | 23 (20.9%) |
| Accommodation & Food Services | 48 (47.1%) | 54 (52.9%) |
| Public Administration | 133 (40.8%) | 193 (59.2%) |
| Total | 2,709 (60.6%) | 1,759 (39.4%) |
Education in Tallahatchie County
School Enrollment in Tallahatchie County
The most common levels of schooling among the 2,755 students in Tallahatchie County are middle school (802 | 29.1%), college / undergraduate (574 | 20.8%), and high school (533 | 19.4%).
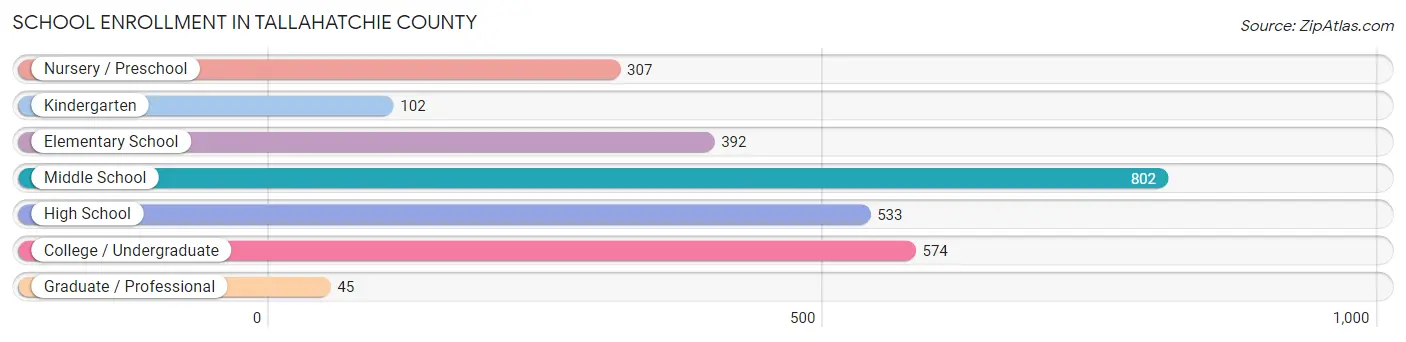
| School Level | # Students | % Students |
| Nursery / Preschool | 307 | 11.1% |
| Kindergarten | 102 | 3.7% |
| Elementary School | 392 | 14.2% |
| Middle School | 802 | 29.1% |
| High School | 533 | 19.4% |
| College / Undergraduate | 574 | 20.8% |
| Graduate / Professional | 45 | 1.6% |
| Total | 2,755 | 100.0% |
School Enrollment by Age by Funding Source in Tallahatchie County
Out of a total of 2,755 students who are enrolled in schools in Tallahatchie County, 339 (12.3%) attend a private institution, while the remaining 2,416 (87.7%) are enrolled in public schools. The age group of 25 to 34 year olds has the highest likelihood of being enrolled in private schools, with 69 (48.2% in the age bracket) enrolled. Conversely, the age group of 20 to 24 year olds has the lowest likelihood of being enrolled in a private school, with 298 (100.0% in the age bracket) attending a public institution.
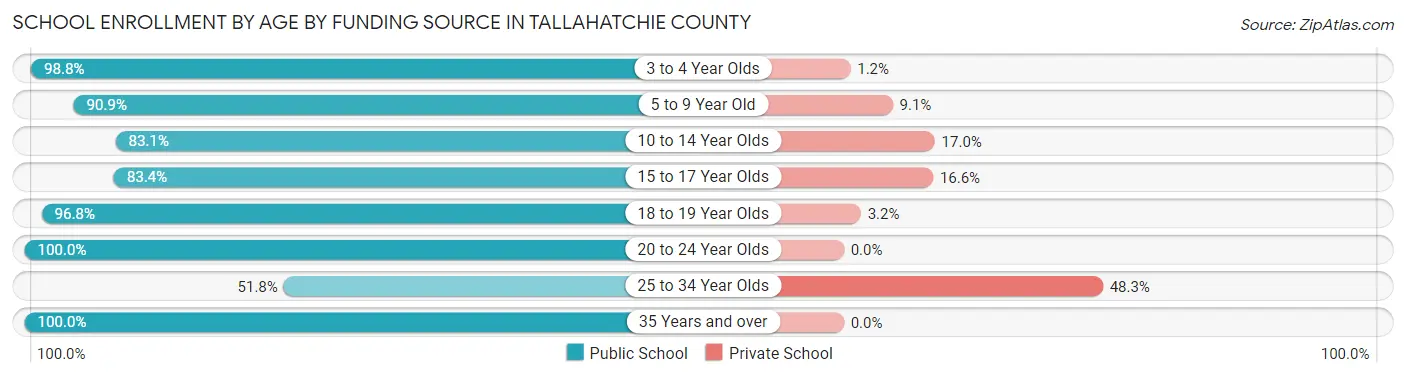
| Age Bracket | Public School | Private School |
| 3 to 4 Year Olds | 241 (98.8%) | 3 (1.2%) |
| 5 to 9 Year Old | 499 (90.9%) | 50 (9.1%) |
| 10 to 14 Year Olds | 691 (83.1%) | 141 (17.0%) |
| 15 to 17 Year Olds | 341 (83.4%) | 68 (16.6%) |
| 18 to 19 Year Olds | 244 (96.8%) | 8 (3.2%) |
| 20 to 24 Year Olds | 298 (100.0%) | 0 (0.0%) |
| 25 to 34 Year Olds | 74 (51.7%) | 69 (48.2%) |
| 35 Years and over | 28 (100.0%) | 0 (0.0%) |
| Total | 2,416 (87.7%) | 339 (12.3%) |
Educational Attainment by Field of Study in Tallahatchie County
Education (357 | 34.0%), arts & humanities (196 | 18.7%), business (166 | 15.8%), science & technology (78 | 7.4%), and liberal arts & history (63 | 6.0%) are the most common fields of study among 1,049 individuals in Tallahatchie County who have obtained a bachelor's degree or higher.
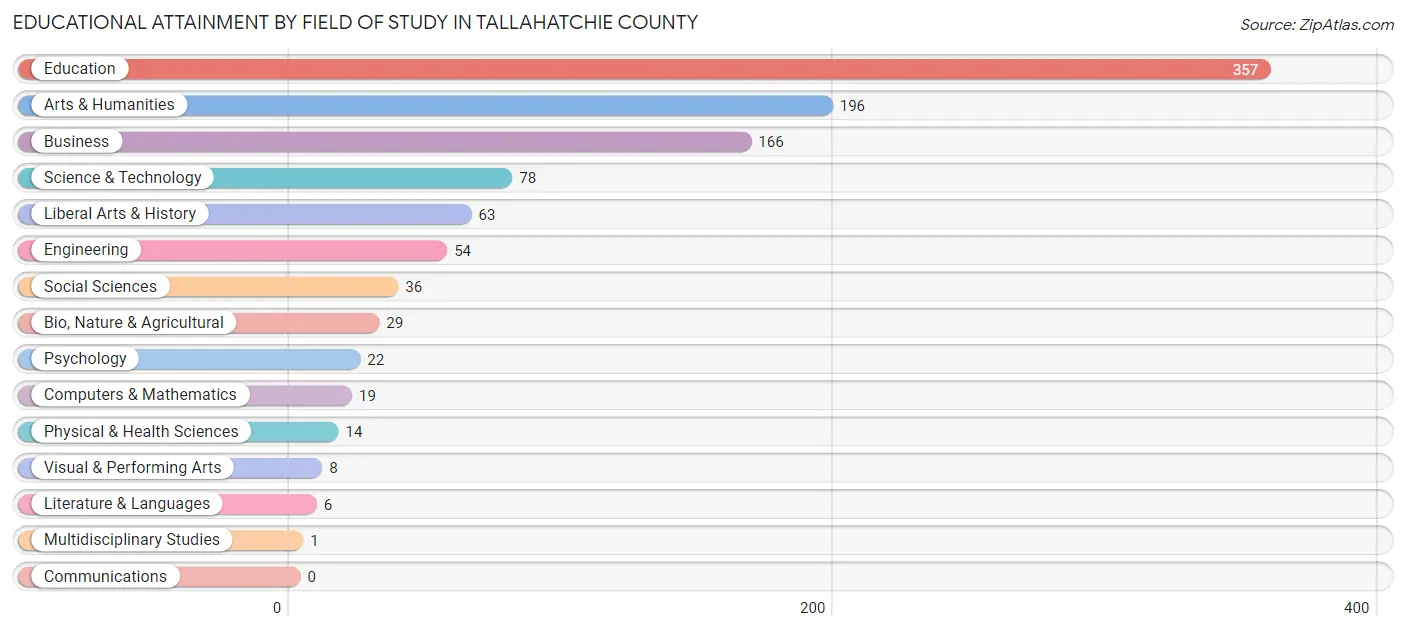
| Field of Study | # Graduates | % Graduates |
| Computers & Mathematics | 19 | 1.8% |
| Bio, Nature & Agricultural | 29 | 2.8% |
| Physical & Health Sciences | 14 | 1.3% |
| Psychology | 22 | 2.1% |
| Social Sciences | 36 | 3.4% |
| Engineering | 54 | 5.1% |
| Multidisciplinary Studies | 1 | 0.1% |
| Science & Technology | 78 | 7.4% |
| Business | 166 | 15.8% |
| Education | 357 | 34.0% |
| Literature & Languages | 6 | 0.6% |
| Liberal Arts & History | 63 | 6.0% |
| Visual & Performing Arts | 8 | 0.8% |
| Communications | 0 | 0.0% |
| Arts & Humanities | 196 | 18.7% |
| Total | 1,049 | 100.0% |
Transportation & Commute in Tallahatchie County
Vehicle Availability by Sex in Tallahatchie County
The most prevalent vehicle ownership categories in Tallahatchie County are males with 2 vehicles (1,076, accounting for 40.2%) and females with 2 vehicles (435, making up 62.1%).
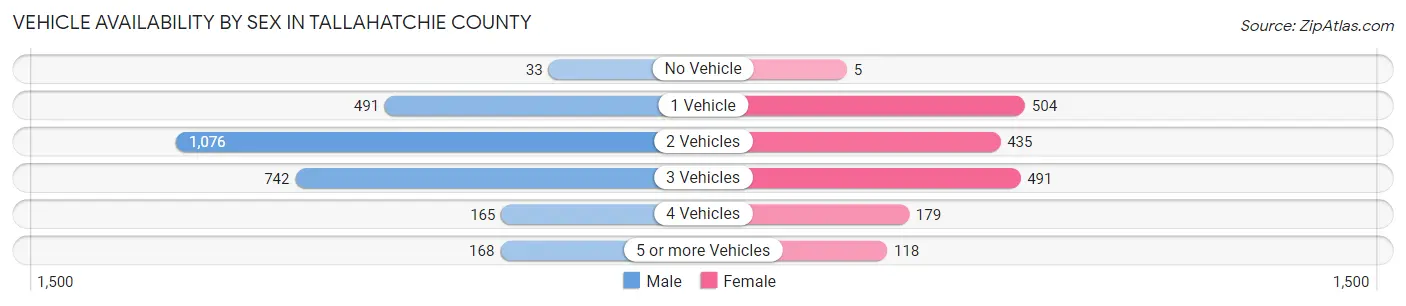
| Vehicles Available | Male | Female |
| No Vehicle | 33 (1.2%) | 5 (0.3%) |
| 1 Vehicle | 491 (18.4%) | 504 (29.1%) |
| 2 Vehicles | 1,076 (40.2%) | 435 (25.1%) |
| 3 Vehicles | 742 (27.7%) | 491 (28.3%) |
| 4 Vehicles | 165 (6.2%) | 179 (10.3%) |
| 5 or more Vehicles | 168 (6.3%) | 118 (6.8%) |
| Total | 2,675 (100.0%) | 1,732 (100.0%) |
Commute Time in Tallahatchie County
The most frequently occuring commute durations in Tallahatchie County are 15 to 19 minutes (694 commuters, 17.0%), 45 to 59 minutes (586 commuters, 14.4%), and 5 to 9 minutes (514 commuters, 12.6%).
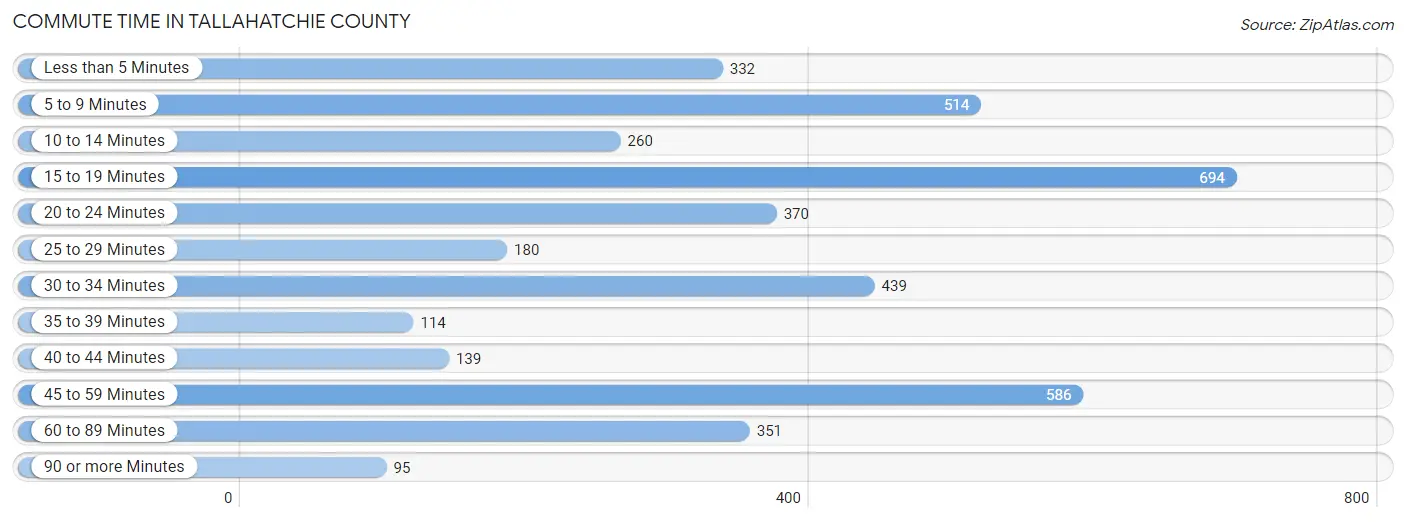
| Commute Time | # Commuters | % Commuters |
| Less than 5 Minutes | 332 | 8.2% |
| 5 to 9 Minutes | 514 | 12.6% |
| 10 to 14 Minutes | 260 | 6.4% |
| 15 to 19 Minutes | 694 | 17.0% |
| 20 to 24 Minutes | 370 | 9.1% |
| 25 to 29 Minutes | 180 | 4.4% |
| 30 to 34 Minutes | 439 | 10.8% |
| 35 to 39 Minutes | 114 | 2.8% |
| 40 to 44 Minutes | 139 | 3.4% |
| 45 to 59 Minutes | 586 | 14.4% |
| 60 to 89 Minutes | 351 | 8.6% |
| 90 or more Minutes | 95 | 2.3% |
Commute Time by Sex in Tallahatchie County
The most common commute times in Tallahatchie County are 45 to 59 minutes (486 commuters, 20.2%) for males and 20 to 24 minutes (289 commuters, 17.4%) for females.
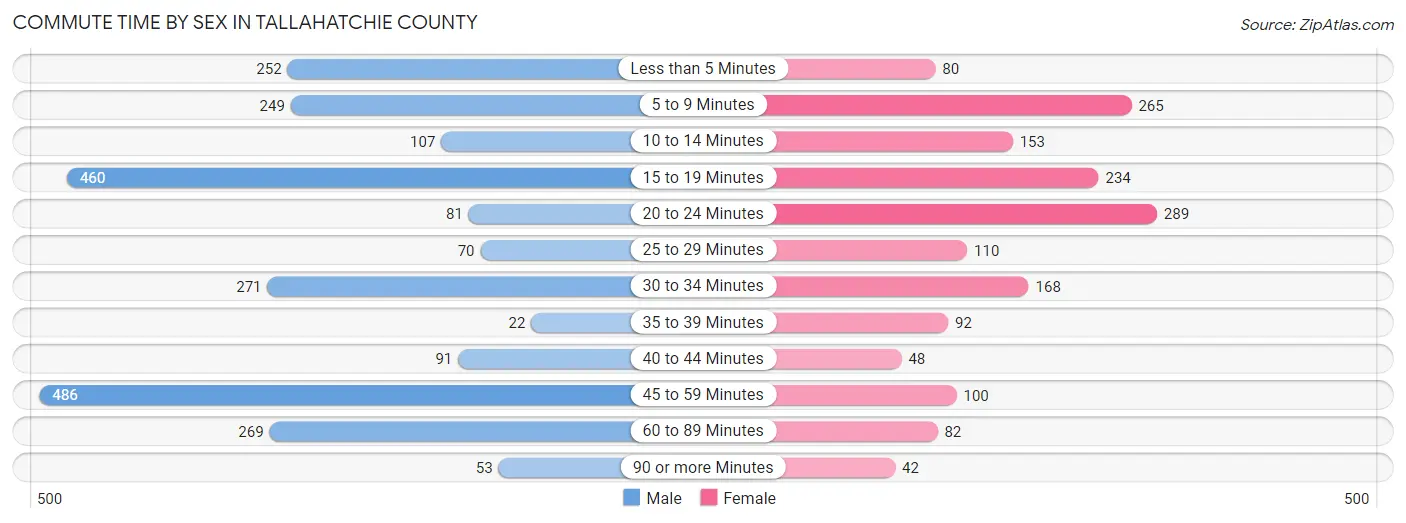
| Commute Time | Male | Female |
| Less than 5 Minutes | 252 (10.4%) | 80 (4.8%) |
| 5 to 9 Minutes | 249 (10.3%) | 265 (15.9%) |
| 10 to 14 Minutes | 107 (4.4%) | 153 (9.2%) |
| 15 to 19 Minutes | 460 (19.1%) | 234 (14.1%) |
| 20 to 24 Minutes | 81 (3.4%) | 289 (17.4%) |
| 25 to 29 Minutes | 70 (2.9%) | 110 (6.6%) |
| 30 to 34 Minutes | 271 (11.2%) | 168 (10.1%) |
| 35 to 39 Minutes | 22 (0.9%) | 92 (5.5%) |
| 40 to 44 Minutes | 91 (3.8%) | 48 (2.9%) |
| 45 to 59 Minutes | 486 (20.2%) | 100 (6.0%) |
| 60 to 89 Minutes | 269 (11.2%) | 82 (4.9%) |
| 90 or more Minutes | 53 (2.2%) | 42 (2.5%) |
Time of Departure to Work by Sex in Tallahatchie County
The most frequent times of departure to work in Tallahatchie County are 7:00 AM to 7:29 AM (545, 22.6%) for males and 6:00 AM to 6:29 AM (318, 19.1%) for females.
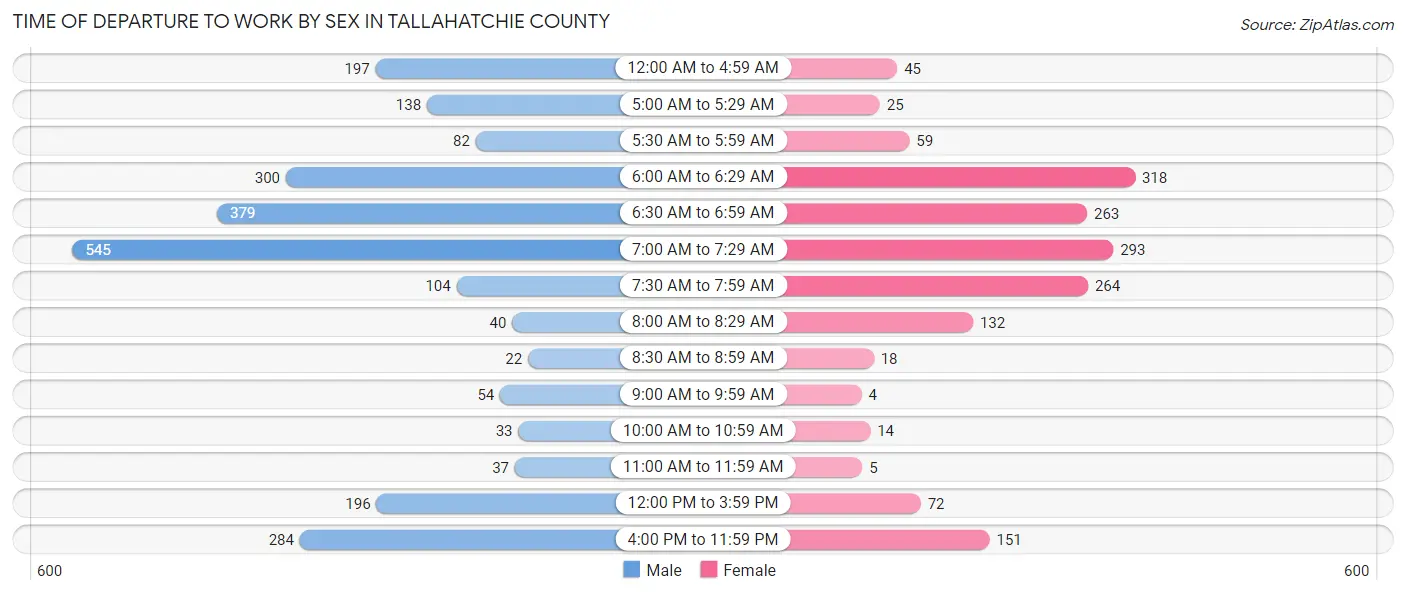
| Time of Departure | Male | Female |
| 12:00 AM to 4:59 AM | 197 (8.2%) | 45 (2.7%) |
| 5:00 AM to 5:29 AM | 138 (5.7%) | 25 (1.5%) |
| 5:30 AM to 5:59 AM | 82 (3.4%) | 59 (3.5%) |
| 6:00 AM to 6:29 AM | 300 (12.4%) | 318 (19.1%) |
| 6:30 AM to 6:59 AM | 379 (15.7%) | 263 (15.8%) |
| 7:00 AM to 7:29 AM | 545 (22.6%) | 293 (17.6%) |
| 7:30 AM to 7:59 AM | 104 (4.3%) | 264 (15.9%) |
| 8:00 AM to 8:29 AM | 40 (1.7%) | 132 (7.9%) |
| 8:30 AM to 8:59 AM | 22 (0.9%) | 18 (1.1%) |
| 9:00 AM to 9:59 AM | 54 (2.2%) | 4 (0.2%) |
| 10:00 AM to 10:59 AM | 33 (1.4%) | 14 (0.8%) |
| 11:00 AM to 11:59 AM | 37 (1.5%) | 5 (0.3%) |
| 12:00 PM to 3:59 PM | 196 (8.1%) | 72 (4.3%) |
| 4:00 PM to 11:59 PM | 284 (11.8%) | 151 (9.1%) |
| Total | 2,411 (100.0%) | 1,663 (100.0%) |
Housing Occupancy in Tallahatchie County
Occupancy by Ownership in Tallahatchie County
Of the total 4,301 dwellings in Tallahatchie County, owner-occupied units account for 2,740 (63.7%), while renter-occupied units make up 1,561 (36.3%).
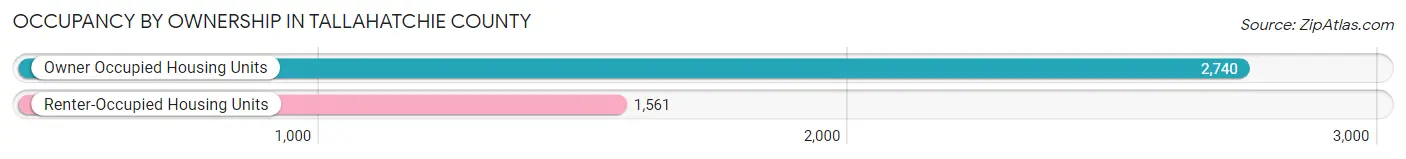
| Occupancy | # Housing Units | % Housing Units |
| Owner Occupied Housing Units | 2,740 | 63.7% |
| Renter-Occupied Housing Units | 1,561 | 36.3% |
| Total Occupied Housing Units | 4,301 | 100.0% |
Occupancy by Household Size in Tallahatchie County
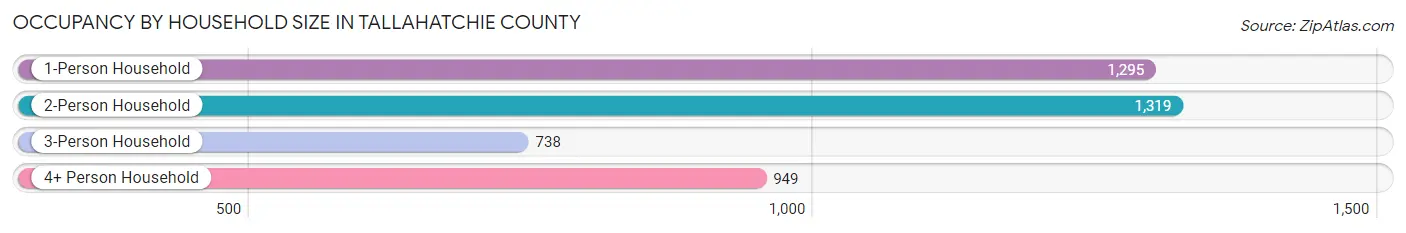
| Household Size | # Housing Units | % Housing Units |
| 1-Person Household | 1,295 | 30.1% |
| 2-Person Household | 1,319 | 30.7% |
| 3-Person Household | 738 | 17.2% |
| 4+ Person Household | 949 | 22.1% |
| Total Housing Units | 4,301 | 100.0% |
Occupancy by Ownership by Household Size in Tallahatchie County
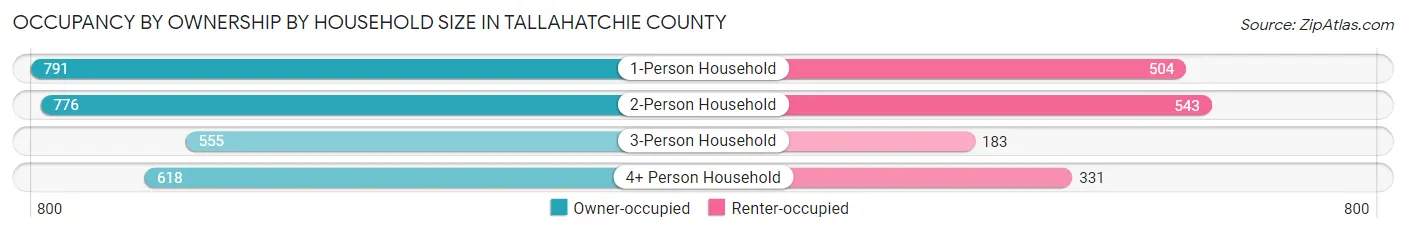
| Household Size | Owner-occupied | Renter-occupied |
| 1-Person Household | 791 (61.1%) | 504 (38.9%) |
| 2-Person Household | 776 (58.8%) | 543 (41.2%) |
| 3-Person Household | 555 (75.2%) | 183 (24.8%) |
| 4+ Person Household | 618 (65.1%) | 331 (34.9%) |
| Total Housing Units | 2,740 (63.7%) | 1,561 (36.3%) |
Occupancy by Educational Attainment in Tallahatchie County
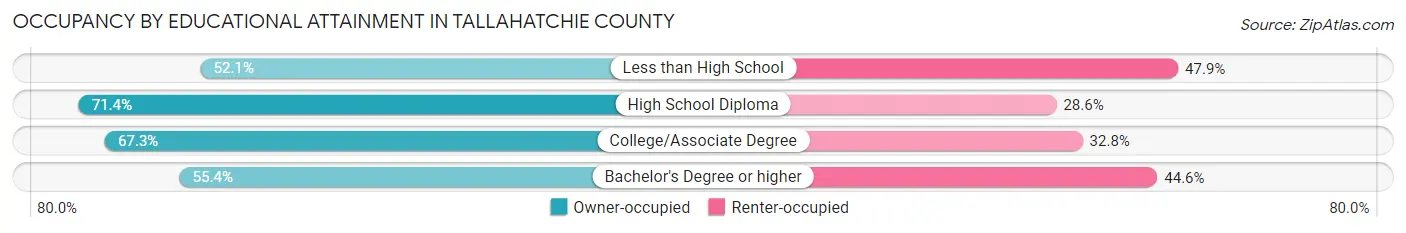
| Household Size | Owner-occupied | Renter-occupied |
| Less than High School | 483 (52.1%) | 444 (47.9%) |
| High School Diploma | 981 (71.4%) | 393 (28.6%) |
| College/Associate Degree | 953 (67.2%) | 464 (32.8%) |
| Bachelor's Degree or higher | 323 (55.4%) | 260 (44.6%) |
Occupancy by Age of Householder in Tallahatchie County
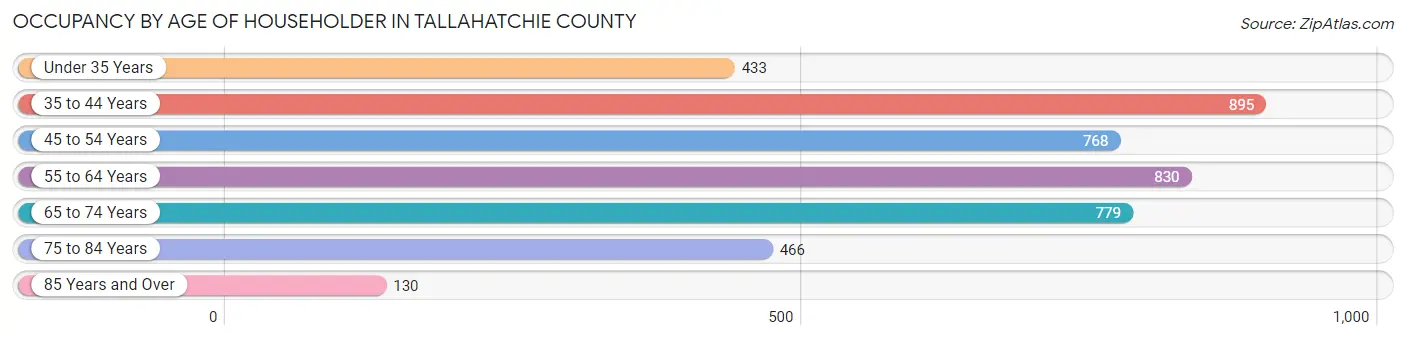
| Age Bracket | # Households | % Households |
| Under 35 Years | 433 | 10.1% |
| 35 to 44 Years | 895 | 20.8% |
| 45 to 54 Years | 768 | 17.9% |
| 55 to 64 Years | 830 | 19.3% |
| 65 to 74 Years | 779 | 18.1% |
| 75 to 84 Years | 466 | 10.8% |
| 85 Years and Over | 130 | 3.0% |
| Total | 4,301 | 100.0% |
Housing Finances in Tallahatchie County
Median Income by Occupancy in Tallahatchie County
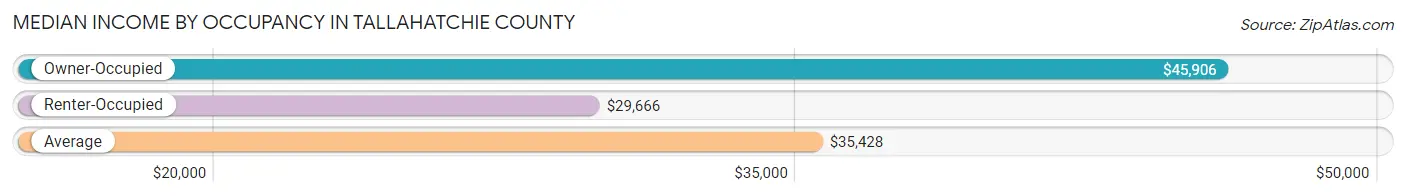
| Occupancy Type | # Households | Median Income |
| Owner-Occupied | 2,740 (63.7%) | $45,906 |
| Renter-Occupied | 1,561 (36.3%) | $29,666 |
| Average | 4,301 (100.0%) | $35,428 |
Occupancy by Householder Income Bracket in Tallahatchie County
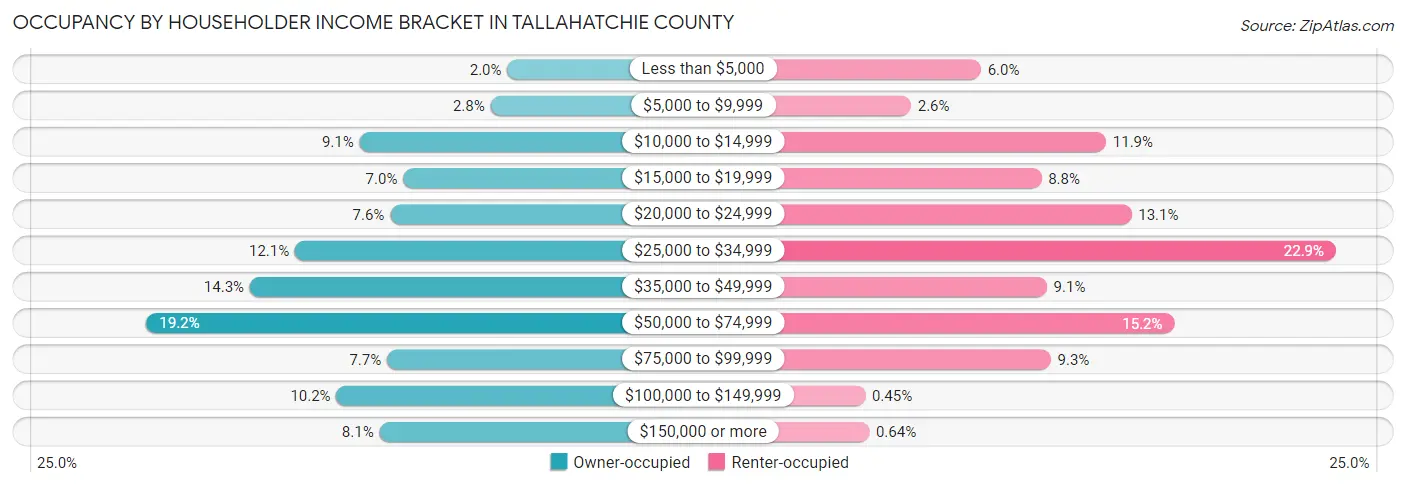
| Income Bracket | Owner-occupied | Renter-occupied |
| Less than $5,000 | 55 (2.0%) | 93 (6.0%) |
| $5,000 to $9,999 | 77 (2.8%) | 41 (2.6%) |
| $10,000 to $14,999 | 248 (9.0%) | 186 (11.9%) |
| $15,000 to $19,999 | 191 (7.0%) | 138 (8.8%) |
| $20,000 to $24,999 | 208 (7.6%) | 205 (13.1%) |
| $25,000 to $34,999 | 332 (12.1%) | 357 (22.9%) |
| $35,000 to $49,999 | 391 (14.3%) | 142 (9.1%) |
| $50,000 to $74,999 | 526 (19.2%) | 237 (15.2%) |
| $75,000 to $99,999 | 212 (7.7%) | 145 (9.3%) |
| $100,000 to $149,999 | 278 (10.2%) | 7 (0.4%) |
| $150,000 or more | 222 (8.1%) | 10 (0.6%) |
| Total | 2,740 (100.0%) | 1,561 (100.0%) |
Monthly Housing Cost Tiers in Tallahatchie County

| Monthly Cost | Owner-occupied | Renter-occupied |
| Less than $300 | 608 (22.2%) | 70 (4.5%) |
| $300 to $499 | 867 (31.6%) | 120 (7.7%) |
| $500 to $799 | 527 (19.2%) | 548 (35.1%) |
| $800 to $999 | 253 (9.2%) | 266 (17.0%) |
| $1,000 to $1,499 | 323 (11.8%) | 193 (12.4%) |
| $1,500 to $1,999 | 133 (4.9%) | 5 (0.3%) |
| $2,000 to $2,499 | 15 (0.5%) | 0 (0.0%) |
| $2,500 to $2,999 | 14 (0.5%) | 0 (0.0%) |
| $3,000 or more | 0 (0.0%) | 0 (0.0%) |
| Total | 2,740 (100.0%) | 1,561 (100.0%) |
Physical Housing Characteristics in Tallahatchie County
Housing Structures in Tallahatchie County
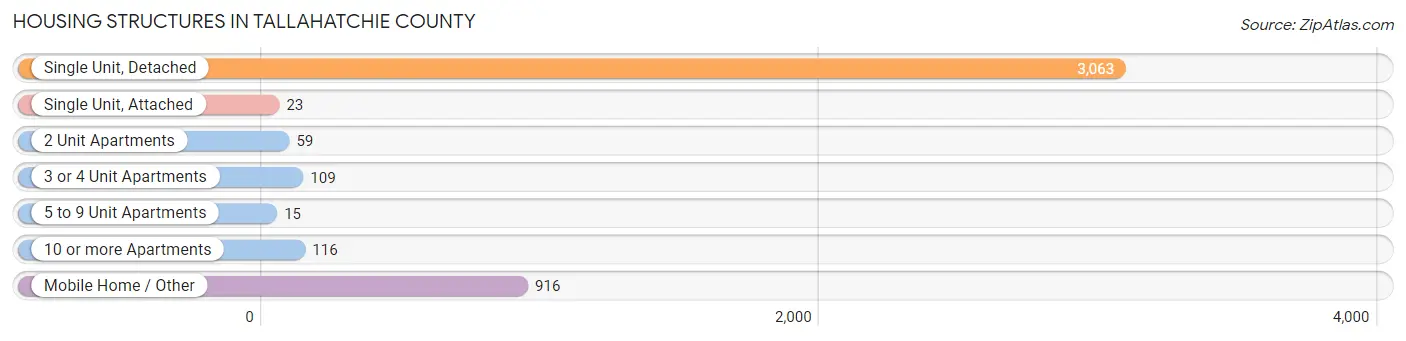
| Structure Type | # Housing Units | % Housing Units |
| Single Unit, Detached | 3,063 | 71.2% |
| Single Unit, Attached | 23 | 0.5% |
| 2 Unit Apartments | 59 | 1.4% |
| 3 or 4 Unit Apartments | 109 | 2.5% |
| 5 to 9 Unit Apartments | 15 | 0.4% |
| 10 or more Apartments | 116 | 2.7% |
| Mobile Home / Other | 916 | 21.3% |
| Total | 4,301 | 100.0% |
Housing Structures by Occupancy in Tallahatchie County
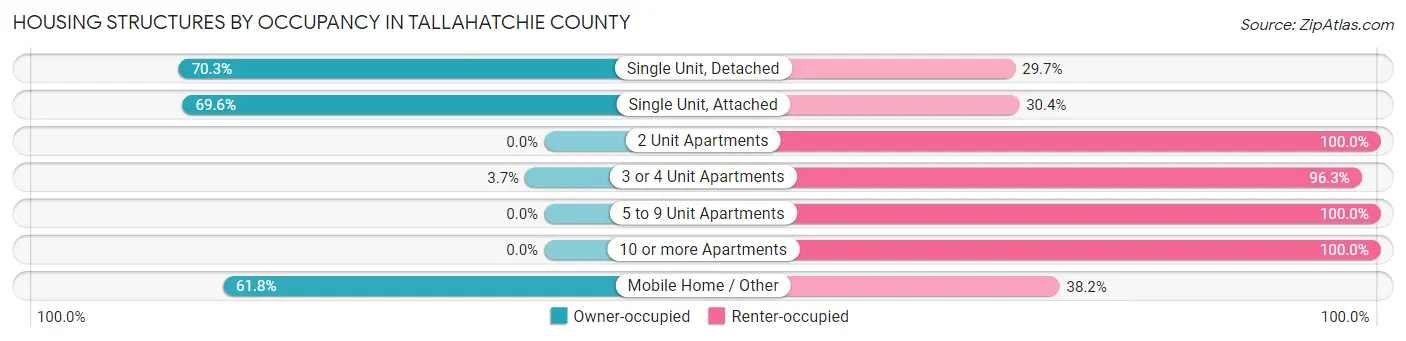
| Structure Type | Owner-occupied | Renter-occupied |
| Single Unit, Detached | 2,154 (70.3%) | 909 (29.7%) |
| Single Unit, Attached | 16 (69.6%) | 7 (30.4%) |
| 2 Unit Apartments | 0 (0.0%) | 59 (100.0%) |
| 3 or 4 Unit Apartments | 4 (3.7%) | 105 (96.3%) |
| 5 to 9 Unit Apartments | 0 (0.0%) | 15 (100.0%) |
| 10 or more Apartments | 0 (0.0%) | 116 (100.0%) |
| Mobile Home / Other | 566 (61.8%) | 350 (38.2%) |
| Total | 2,740 (63.7%) | 1,561 (36.3%) |
Housing Structures by Number of Rooms in Tallahatchie County
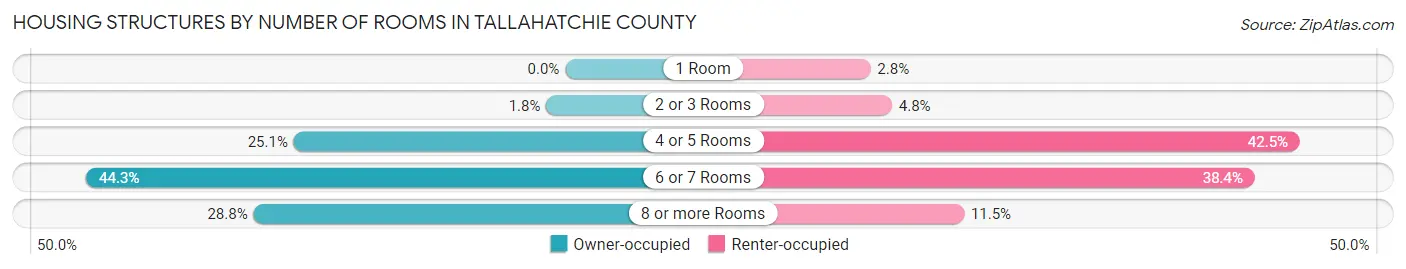
| Number of Rooms | Owner-occupied | Renter-occupied |
| 1 Room | 0 (0.0%) | 44 (2.8%) |
| 2 or 3 Rooms | 48 (1.8%) | 75 (4.8%) |
| 4 or 5 Rooms | 688 (25.1%) | 664 (42.5%) |
| 6 or 7 Rooms | 1,214 (44.3%) | 599 (38.4%) |
| 8 or more Rooms | 790 (28.8%) | 179 (11.5%) |
| Total | 2,740 (100.0%) | 1,561 (100.0%) |
Housing Structure by Heating Type in Tallahatchie County
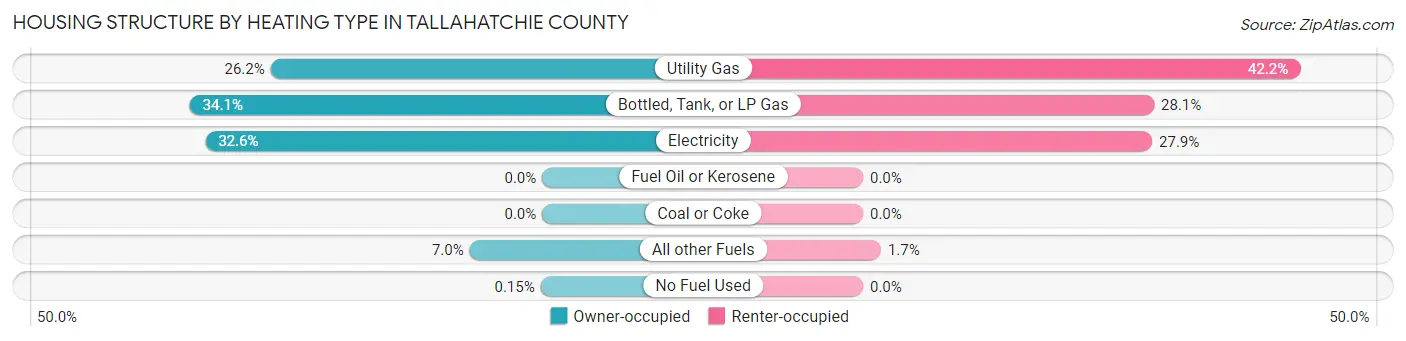
| Heating Type | Owner-occupied | Renter-occupied |
| Utility Gas | 719 (26.2%) | 659 (42.2%) |
| Bottled, Tank, or LP Gas | 933 (34.1%) | 439 (28.1%) |
| Electricity | 892 (32.6%) | 436 (27.9%) |
| Fuel Oil or Kerosene | 0 (0.0%) | 0 (0.0%) |
| Coal or Coke | 0 (0.0%) | 0 (0.0%) |
| All other Fuels | 192 (7.0%) | 27 (1.7%) |
| No Fuel Used | 4 (0.2%) | 0 (0.0%) |
| Total | 2,740 (100.0%) | 1,561 (100.0%) |
Household Vehicle Usage in Tallahatchie County
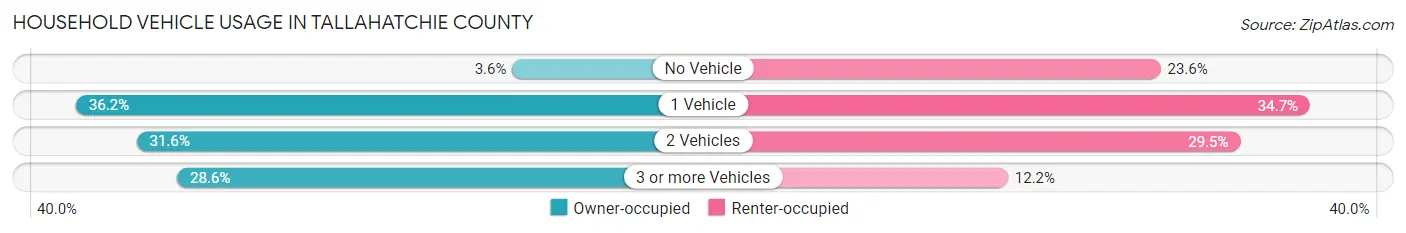
| Vehicles per Household | Owner-occupied | Renter-occupied |
| No Vehicle | 98 (3.6%) | 368 (23.6%) |
| 1 Vehicle | 991 (36.2%) | 542 (34.7%) |
| 2 Vehicles | 867 (31.6%) | 461 (29.5%) |
| 3 or more Vehicles | 784 (28.6%) | 190 (12.2%) |
| Total | 2,740 (100.0%) | 1,561 (100.0%) |
Real Estate & Mortgages in Tallahatchie County
Real Estate and Mortgage Overview in Tallahatchie County
| Characteristic | Without Mortgage | With Mortgage |
| Housing Units | 1,858 | 882 |
| Median Property Value | $76,900 | $90,300 |
| Median Household Income | $37,900 | $60 |
| Monthly Housing Costs | $372 | $0 |
| Real Estate Taxes | $497 | $262 |
Property Value by Mortgage Status in Tallahatchie County
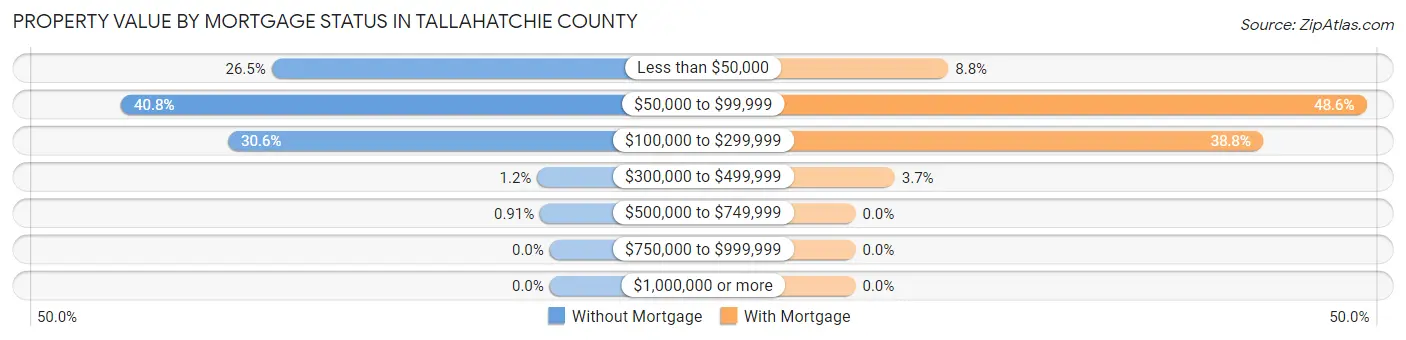
| Property Value | Without Mortgage | With Mortgage |
| Less than $50,000 | 492 (26.5%) | 78 (8.8%) |
| $50,000 to $99,999 | 758 (40.8%) | 429 (48.6%) |
| $100,000 to $299,999 | 569 (30.6%) | 342 (38.8%) |
| $300,000 to $499,999 | 22 (1.2%) | 33 (3.7%) |
| $500,000 to $749,999 | 17 (0.9%) | 0 (0.0%) |
| $750,000 to $999,999 | 0 (0.0%) | 0 (0.0%) |
| $1,000,000 or more | 0 (0.0%) | 0 (0.0%) |
| Total | 1,858 (100.0%) | 882 (100.0%) |
Household Income by Mortgage Status in Tallahatchie County
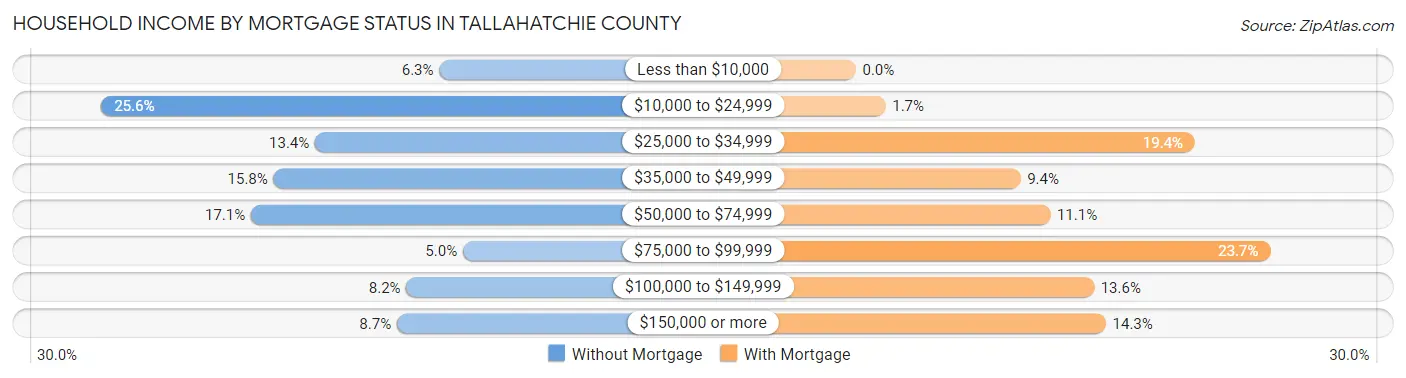
| Household Income | Without Mortgage | With Mortgage |
| Less than $10,000 | 117 (6.3%) | 0 (0.0%) |
| $10,000 to $24,999 | 476 (25.6%) | 15 (1.7%) |
| $25,000 to $34,999 | 249 (13.4%) | 171 (19.4%) |
| $35,000 to $49,999 | 293 (15.8%) | 83 (9.4%) |
| $50,000 to $74,999 | 317 (17.1%) | 98 (11.1%) |
| $75,000 to $99,999 | 92 (5.0%) | 209 (23.7%) |
| $100,000 to $149,999 | 152 (8.2%) | 120 (13.6%) |
| $150,000 or more | 162 (8.7%) | 126 (14.3%) |
| Total | 1,858 (100.0%) | 882 (100.0%) |
Property Value to Household Income Ratio in Tallahatchie County
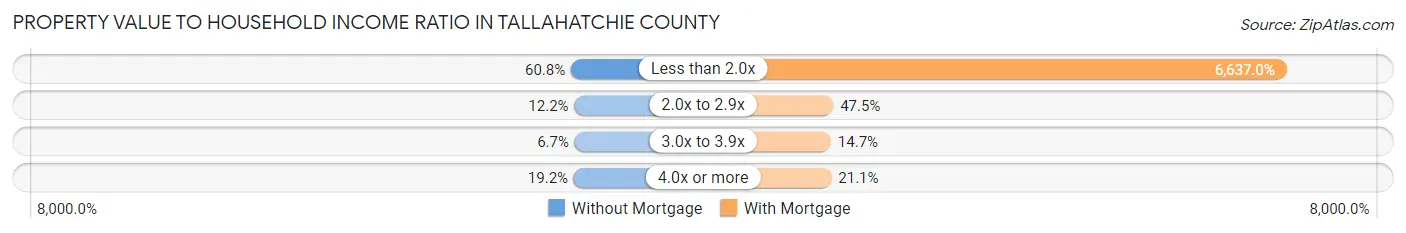
| Value-to-Income Ratio | Without Mortgage | With Mortgage |
| Less than 2.0x | 1,130 (60.8%) | 58,538 (6,637.0%) |
| 2.0x to 2.9x | 226 (12.2%) | 419 (47.5%) |
| 3.0x to 3.9x | 124 (6.7%) | 130 (14.7%) |
| 4.0x or more | 357 (19.2%) | 186 (21.1%) |
| Total | 1,858 (100.0%) | 882 (100.0%) |
Real Estate Taxes by Mortgage Status in Tallahatchie County
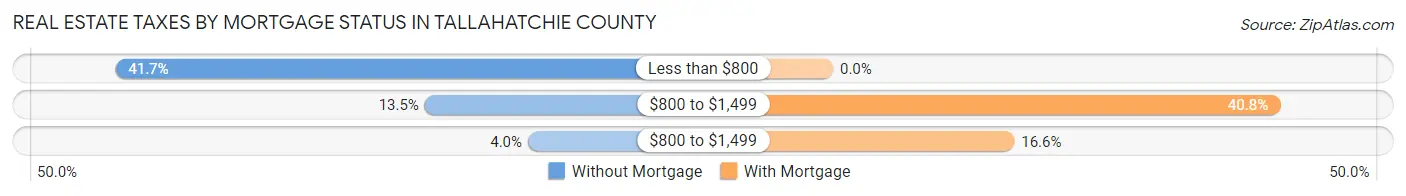
| Property Taxes | Without Mortgage | With Mortgage |
| Less than $800 | 775 (41.7%) | 0 (0.0%) |
| $800 to $1,499 | 250 (13.5%) | 360 (40.8%) |
| $800 to $1,499 | 75 (4.0%) | 146 (16.6%) |
| Total | 1,858 (100.0%) | 882 (100.0%) |
Health & Disability in Tallahatchie County
Health Insurance Coverage by Age in Tallahatchie County
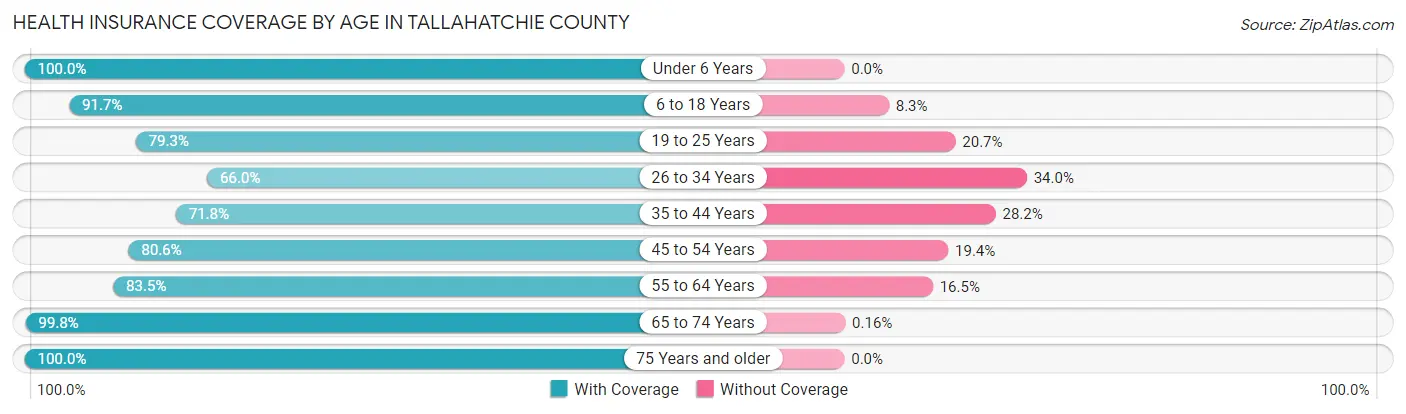
| Age Bracket | With Coverage | Without Coverage |
| Under 6 Years | 880 (100.0%) | 0 (0.0%) |
| 6 to 18 Years | 1,725 (91.7%) | 156 (8.3%) |
| 19 to 25 Years | 915 (79.3%) | 239 (20.7%) |
| 26 to 34 Years | 863 (66.0%) | 445 (34.0%) |
| 35 to 44 Years | 1,469 (71.8%) | 577 (28.2%) |
| 45 to 54 Years | 1,058 (80.6%) | 254 (19.4%) |
| 55 to 64 Years | 1,291 (83.5%) | 255 (16.5%) |
| 65 to 74 Years | 1,223 (99.8%) | 2 (0.2%) |
| 75 Years and older | 761 (100.0%) | 0 (0.0%) |
| Total | 10,185 (84.1%) | 1,928 (15.9%) |
Health Insurance Coverage by Citizenship Status in Tallahatchie County
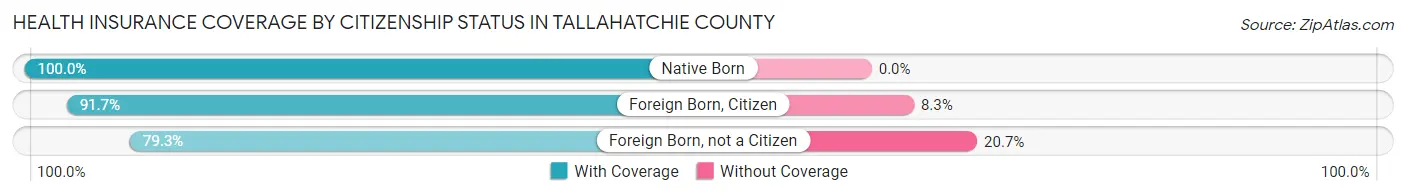
| Citizenship Status | With Coverage | Without Coverage |
| Native Born | 880 (100.0%) | 0 (0.0%) |
| Foreign Born, Citizen | 1,725 (91.7%) | 156 (8.3%) |
| Foreign Born, not a Citizen | 915 (79.3%) | 239 (20.7%) |
Health Insurance Coverage by Household Income in Tallahatchie County
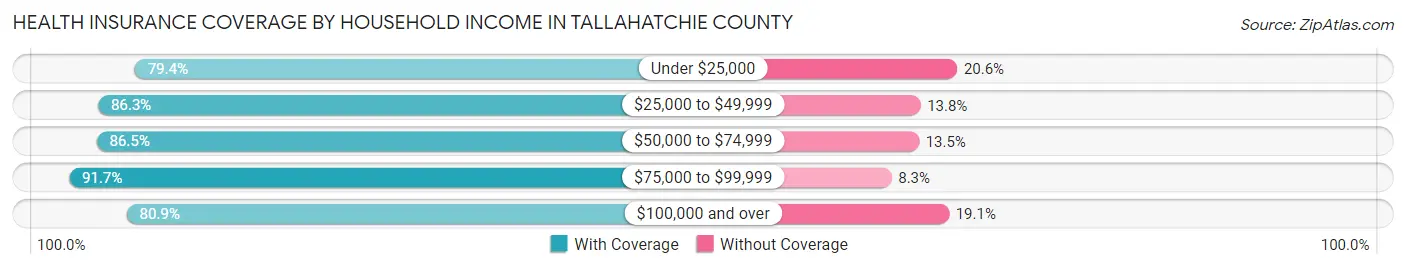
| Household Income | With Coverage | Without Coverage |
| Under $25,000 | 2,495 (79.4%) | 649 (20.6%) |
| $25,000 to $49,999 | 2,778 (86.3%) | 443 (13.8%) |
| $50,000 to $74,999 | 2,235 (86.5%) | 348 (13.5%) |
| $75,000 to $99,999 | 991 (91.7%) | 90 (8.3%) |
| $100,000 and over | 1,686 (80.9%) | 398 (19.1%) |
Public vs Private Health Insurance Coverage by Age in Tallahatchie County
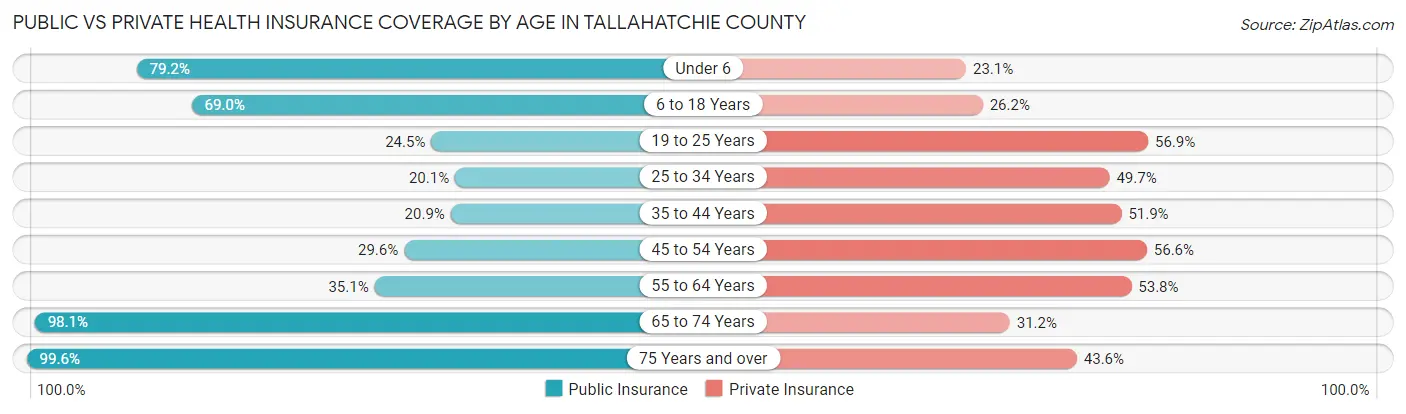
| Age Bracket | Public Insurance | Private Insurance |
| Under 6 | 697 (79.2%) | 203 (23.1%) |
| 6 to 18 Years | 1,298 (69.0%) | 492 (26.2%) |
| 19 to 25 Years | 283 (24.5%) | 656 (56.9%) |
| 25 to 34 Years | 263 (20.1%) | 650 (49.7%) |
| 35 to 44 Years | 428 (20.9%) | 1,062 (51.9%) |
| 45 to 54 Years | 388 (29.6%) | 743 (56.6%) |
| 55 to 64 Years | 542 (35.1%) | 831 (53.7%) |
| 65 to 74 Years | 1,202 (98.1%) | 382 (31.2%) |
| 75 Years and over | 758 (99.6%) | 332 (43.6%) |
| Total | 5,859 (48.4%) | 5,351 (44.2%) |
Disability Status by Sex by Age in Tallahatchie County
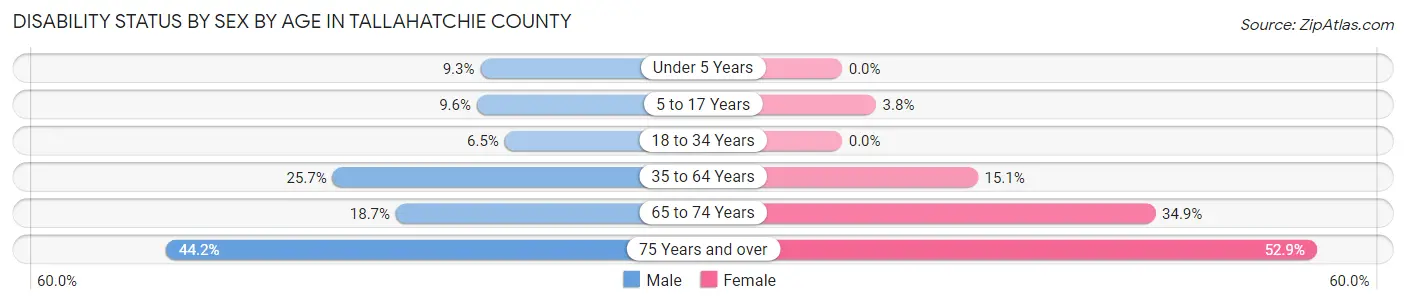
| Age Bracket | Male | Female |
| Under 5 Years | 32 (9.2%) | 0 (0.0%) |
| 5 to 17 Years | 85 (9.6%) | 36 (3.8%) |
| 18 to 34 Years | 101 (6.5%) | 0 (0.0%) |
| 35 to 64 Years | 686 (25.7%) | 338 (15.1%) |
| 65 to 74 Years | 113 (18.6%) | 216 (34.9%) |
| 75 Years and over | 115 (44.2%) | 265 (52.9%) |
Disability Class by Sex by Age in Tallahatchie County
Disability Class: Hearing Difficulty
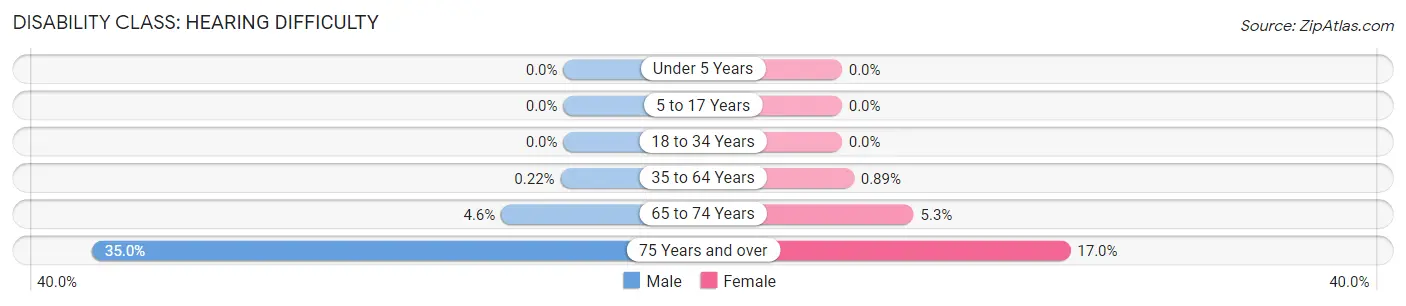
| Age Bracket | Male | Female |
| Under 5 Years | 0 (0.0%) | 0 (0.0%) |
| 5 to 17 Years | 0 (0.0%) | 0 (0.0%) |
| 18 to 34 Years | 0 (0.0%) | 0 (0.0%) |
| 35 to 64 Years | 6 (0.2%) | 20 (0.9%) |
| 65 to 74 Years | 28 (4.6%) | 33 (5.3%) |
| 75 Years and over | 91 (35.0%) | 85 (17.0%) |
Disability Class: Vision Difficulty
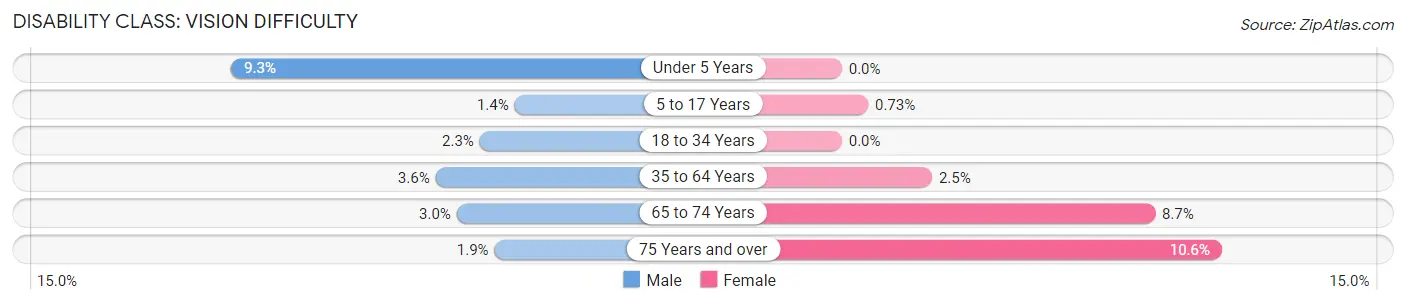
| Age Bracket | Male | Female |
| Under 5 Years | 32 (9.2%) | 0 (0.0%) |
| 5 to 17 Years | 12 (1.4%) | 7 (0.7%) |
| 18 to 34 Years | 36 (2.3%) | 0 (0.0%) |
| 35 to 64 Years | 95 (3.6%) | 56 (2.5%) |
| 65 to 74 Years | 18 (3.0%) | 54 (8.7%) |
| 75 Years and over | 5 (1.9%) | 53 (10.6%) |
Disability Class: Cognitive Difficulty
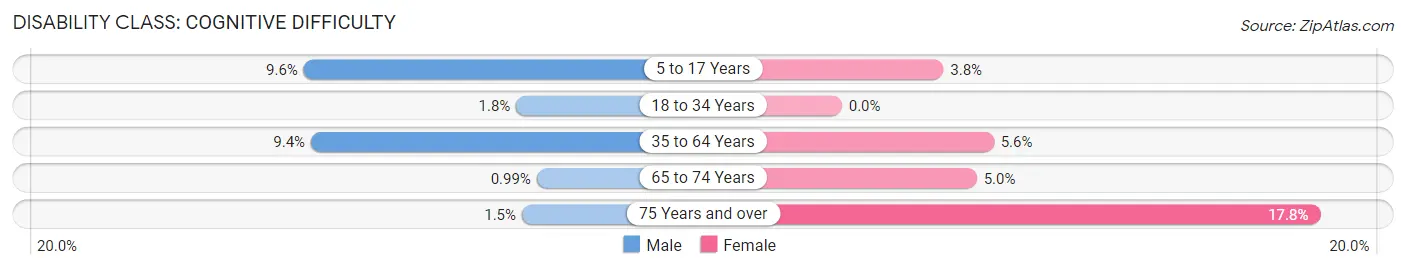
| Age Bracket | Male | Female |
| 5 to 17 Years | 85 (9.6%) | 36 (3.8%) |
| 18 to 34 Years | 27 (1.8%) | 0 (0.0%) |
| 35 to 64 Years | 250 (9.4%) | 126 (5.6%) |
| 65 to 74 Years | 6 (1.0%) | 31 (5.0%) |
| 75 Years and over | 4 (1.5%) | 89 (17.8%) |
Disability Class: Ambulatory Difficulty
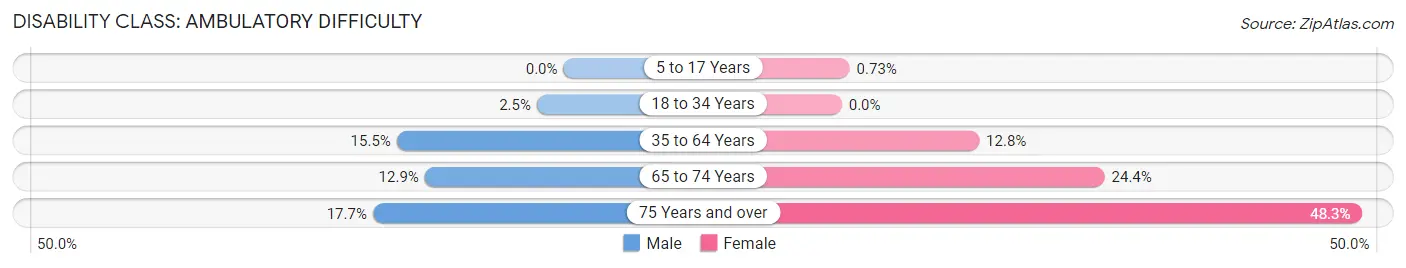
| Age Bracket | Male | Female |
| 5 to 17 Years | 0 (0.0%) | 7 (0.7%) |
| 18 to 34 Years | 38 (2.5%) | 0 (0.0%) |
| 35 to 64 Years | 413 (15.5%) | 285 (12.8%) |
| 65 to 74 Years | 78 (12.9%) | 151 (24.4%) |
| 75 Years and over | 46 (17.7%) | 242 (48.3%) |
Disability Class: Self-Care Difficulty
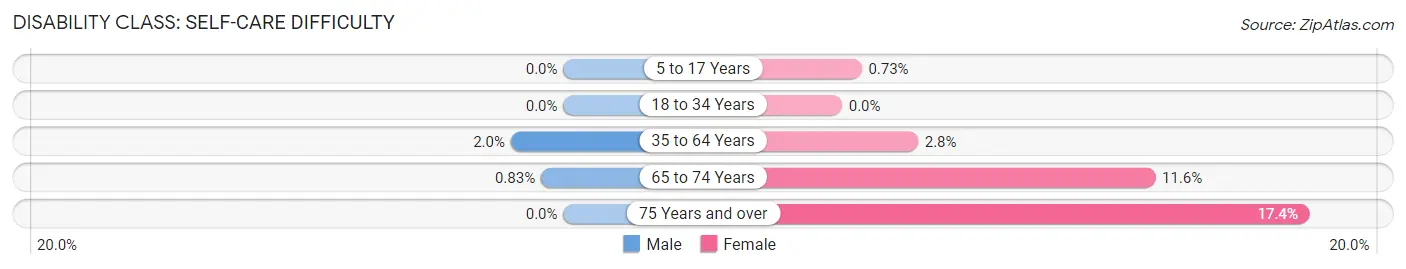
| Age Bracket | Male | Female |
| 5 to 17 Years | 0 (0.0%) | 7 (0.7%) |
| 18 to 34 Years | 0 (0.0%) | 0 (0.0%) |
| 35 to 64 Years | 52 (1.9%) | 63 (2.8%) |
| 65 to 74 Years | 5 (0.8%) | 72 (11.6%) |
| 75 Years and over | 0 (0.0%) | 87 (17.4%) |
Technology Access in Tallahatchie County
Computing Device Access in Tallahatchie County
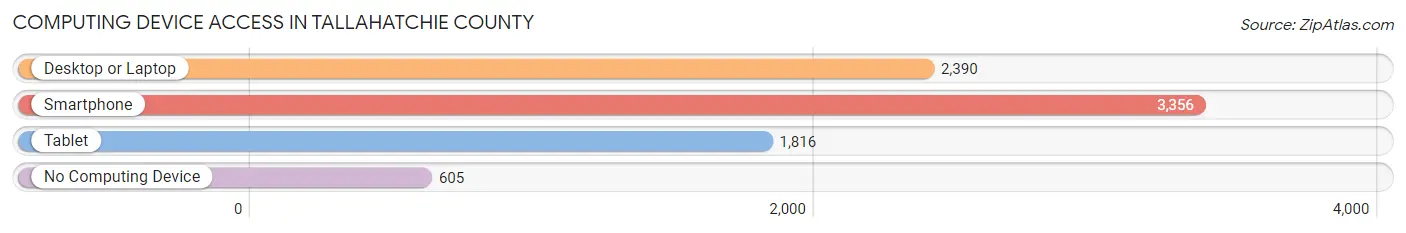
| Device Type | # Households | % Households |
| Desktop or Laptop | 2,390 | 55.6% |
| Smartphone | 3,356 | 78.0% |
| Tablet | 1,816 | 42.2% |
| No Computing Device | 605 | 14.1% |
| Total | 4,301 | 100.0% |
Internet Access in Tallahatchie County
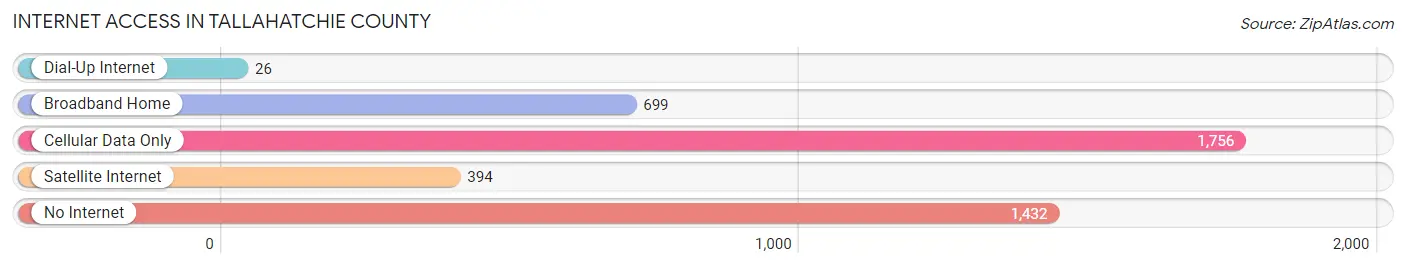
| Internet Type | # Households | % Households |
| Dial-Up Internet | 26 | 0.6% |
| Broadband Home | 699 | 16.3% |
| Cellular Data Only | 1,756 | 40.8% |
| Satellite Internet | 394 | 9.2% |
| No Internet | 1,432 | 33.3% |
| Total | 4,301 | 100.0% |
Tallahatchie County Summary
Tallahatchie County is located in the northwestern part of the state of Mississippi, in the United States. It is bordered by the counties of Quitman, Panola, Yalobusha, Lafayette, and Tunica. The county seat is Charleston, and the county has a total area of 576 square miles. As of the 2010 census, the population was 15,378.
History
Tallahatchie County was established in 1833, and was named after the Tallahatchie River, which runs through the county. The county was originally part of the Chickasaw Nation, and was later part of the Choctaw Nation. The county was part of the Yazoo Purchase, which was a land deal between the United States and the Choctaw Nation in 1820.
The county was home to several Native American tribes, including the Chickasaw, Choctaw, and Yazoo. The first European settlers arrived in the area in the early 1800s, and the county was officially organized in 1833.
During the Civil War, the county was the site of several battles, including the Battle of Brice’s Crossroads and the Battle of Harrisburg. After the war, the county was home to several freedmen’s towns, including Mound Bayou and Allensville.
Geography
Tallahatchie County is located in the northwestern part of the state of Mississippi. It is bordered by the counties of Quitman, Panola, Yalobusha, Lafayette, and Tunica. The county has a total area of 576 square miles, and is mostly flat, with some rolling hills. The county is drained by the Tallahatchie River, which runs through the county.
The county is home to several state parks, including the Tishomingo State Park, which is located in the northern part of the county. The park is home to several hiking trails, as well as a lake and several other recreational activities.
Economy
Tallahatchie County’s economy is largely based on agriculture. The county is home to several large farms, which produce cotton, soybeans, corn, and other crops. The county is also home to several timber companies, which harvest timber from the county’s forests.
The county is also home to several manufacturing companies, which produce furniture, textiles, and other products. The county is also home to several oil and gas companies, which produce oil and natural gas from the county’s oil and gas fields.
Demographics
As of the 2010 census, the population of Tallahatchie County was 15,378. The population is mostly white (77.3%), with African Americans making up the majority of the remaining population (20.3%). The median household income in the county is $30,945, and the median age is 38.7 years.
Conclusion
Tallahatchie County is located in the northwestern part of the state of Mississippi. The county was established in 1833, and was named after the Tallahatchie River, which runs through the county. The county’s economy is largely based on agriculture, and the county is home to several large farms, timber companies, and manufacturing companies. As of the 2010 census, the population of Tallahatchie County was 15,378, with the majority of the population being white (77.3%) and African American (20.3%).
Common Questions
What is Per Capita Income in Tallahatchie County?
Per Capita income in Tallahatchie County is $20,348.
What is the Median Family Income in Tallahatchie County?
Median Family Income in Tallahatchie County is $45,565.
What is the Median Household income in Tallahatchie County?
Median Household Income in Tallahatchie County is $35,428.
What is Income or Wage Gap in Tallahatchie County?
Income or Wage Gap in Tallahatchie County is 49.2%.
Women in Tallahatchie County earn 50.8 cents for every dollar earned by a man.
What is Family Income Deficit in Tallahatchie County?
Family Income Deficit in Tallahatchie County is $9,357.
Families that are below poverty line in Tallahatchie County earn $9,357 less on average than the poverty threshold level.
What is Inequality or Gini Index in Tallahatchie County?
Inequality or Gini Index in Tallahatchie County is 0.44.
What is the Total Population of Tallahatchie County?
Total Population of Tallahatchie County is 12,621.
What is the Total Male Population of Tallahatchie County?
Total Male Population of Tallahatchie County is 6,735.
What is the Total Female Population of Tallahatchie County?
Total Female Population of Tallahatchie County is 5,886.
What is the Ratio of Males per 100 Females in Tallahatchie County?
There are 114.42 Males per 100 Females in Tallahatchie County.
What is the Ratio of Females per 100 Males in Tallahatchie County?
There are 87.39 Females per 100 Males in Tallahatchie County.
What is the Median Population Age in Tallahatchie County?
Median Population Age in Tallahatchie County is 37.7 Years.
What is the Average Family Size in Tallahatchie County
Average Family Size in Tallahatchie County is 3.6 People.
What is the Average Household Size in Tallahatchie County
Average Household Size in Tallahatchie County is 2.8 People.
How Large is the Labor Force in Tallahatchie County?
There are 5,027 People in the Labor Forcein in Tallahatchie County.
What is the Percentage of People in the Labor Force in Tallahatchie County?
48.9% of People are in the Labor Force in Tallahatchie County.
What is the Unemployment Rate in Tallahatchie County?
Unemployment Rate in Tallahatchie County is 11.0%.