Sharkey County, MS Map & Demographics
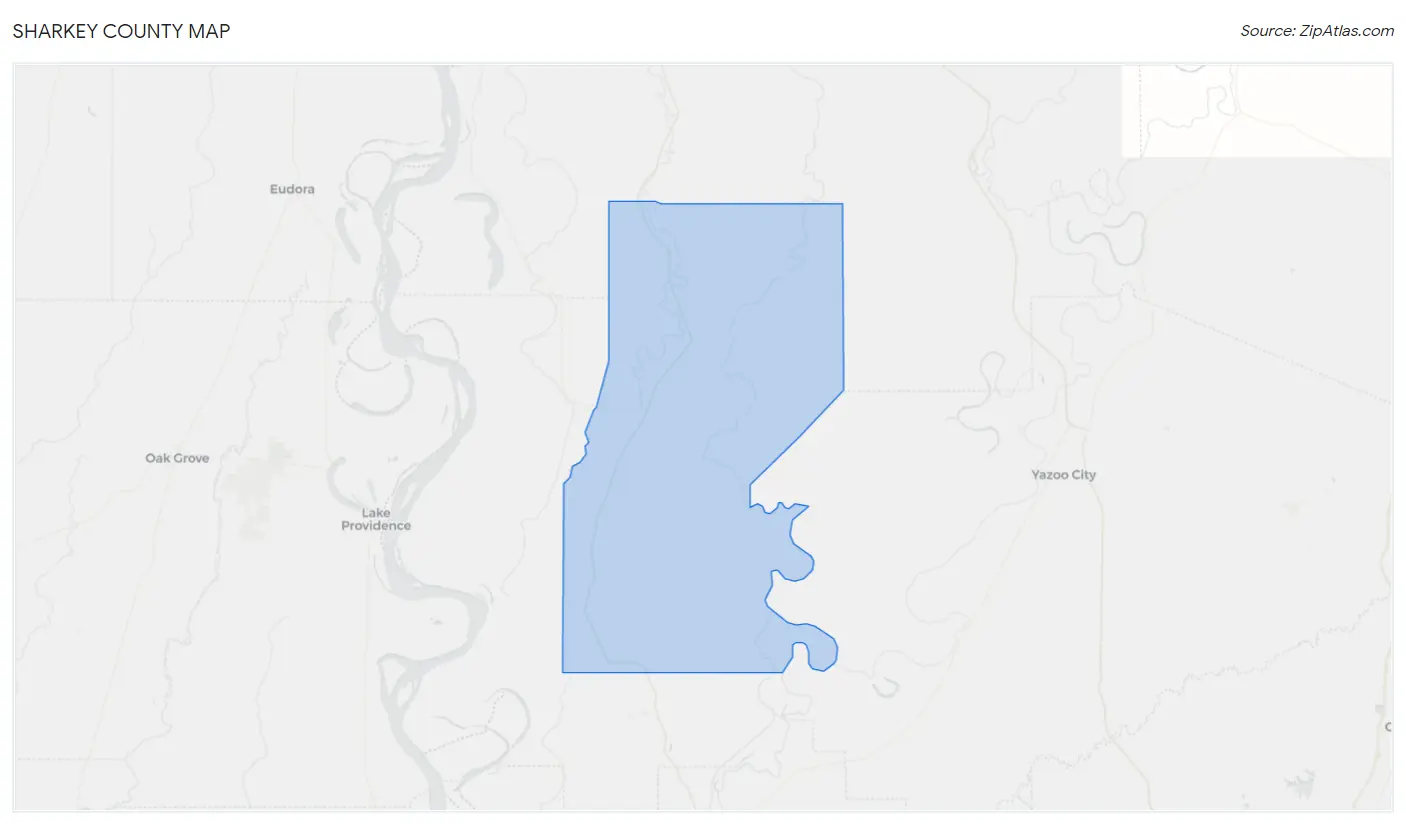
Sharkey County Map
Sharkey County Overview
$22,203
PER CAPITA INCOME
$60,076
AVG FAMILY INCOME
$41,000
AVG HOUSEHOLD INCOME
10.4%
WAGE / INCOME GAP [ % ]
89.6¢/ $1
WAGE / INCOME GAP [ $ ]
0.47
INEQUALITY / GINI INDEX
3,910
TOTAL POPULATION
1,950
MALE POPULATION
1,960
FEMALE POPULATION
99.49
MALES / 100 FEMALES
100.51
FEMALES / 100 MALES
37.0
MEDIAN AGE
3.5
AVG FAMILY SIZE
2.8
AVG HOUSEHOLD SIZE
1,746
LABOR FORCE [ PEOPLE ]
56.1%
PERCENT IN LABOR FORCE
12.8%
UNEMPLOYMENT RATE
Sharkey County Area Codes
Income in Sharkey County
Income Overview in Sharkey County
Per Capita Income in Sharkey County is $22,203, while median incomes of families and households are $60,076 and $41,000 respectively.
| Characteristic | Number | Measure |
| Per Capita Income | 3,910 | $22,203 |
| Median Family Income | 860 | $60,076 |
| Mean Family Income | 860 | $70,379 |
| Median Household Income | 1,374 | $41,000 |
| Mean Household Income | 1,374 | $59,008 |
| Income Deficit | 860 | $0 |
| Wage / Income Gap (%) | 3,910 | 10.40% |
| Wage / Income Gap ($) | 3,910 | 89.60¢ per $1 |
| Gini / Inequality Index | 3,910 | 0.47 |
Earnings by Sex in Sharkey County
Average Earnings in Sharkey County are $30,380, $31,472 for men and $28,198 for women, a difference of 10.4%.
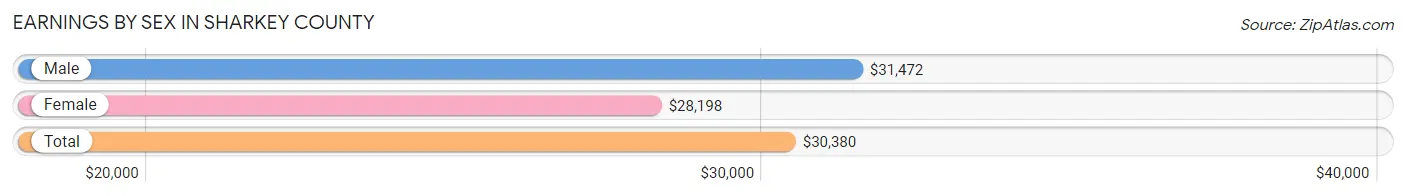
| Sex | Number | Average Earnings |
| Male | 843 (50.6%) | $31,472 |
| Female | 824 (49.4%) | $28,198 |
| Total | 1,667 (100.0%) | $30,380 |
Earnings by Sex by Income Bracket in Sharkey County
The most common earnings brackets in Sharkey County are $30,000 to $34,999 for men (115 | 13.6%) and $35,000 to $39,999 for women (126 | 15.3%).
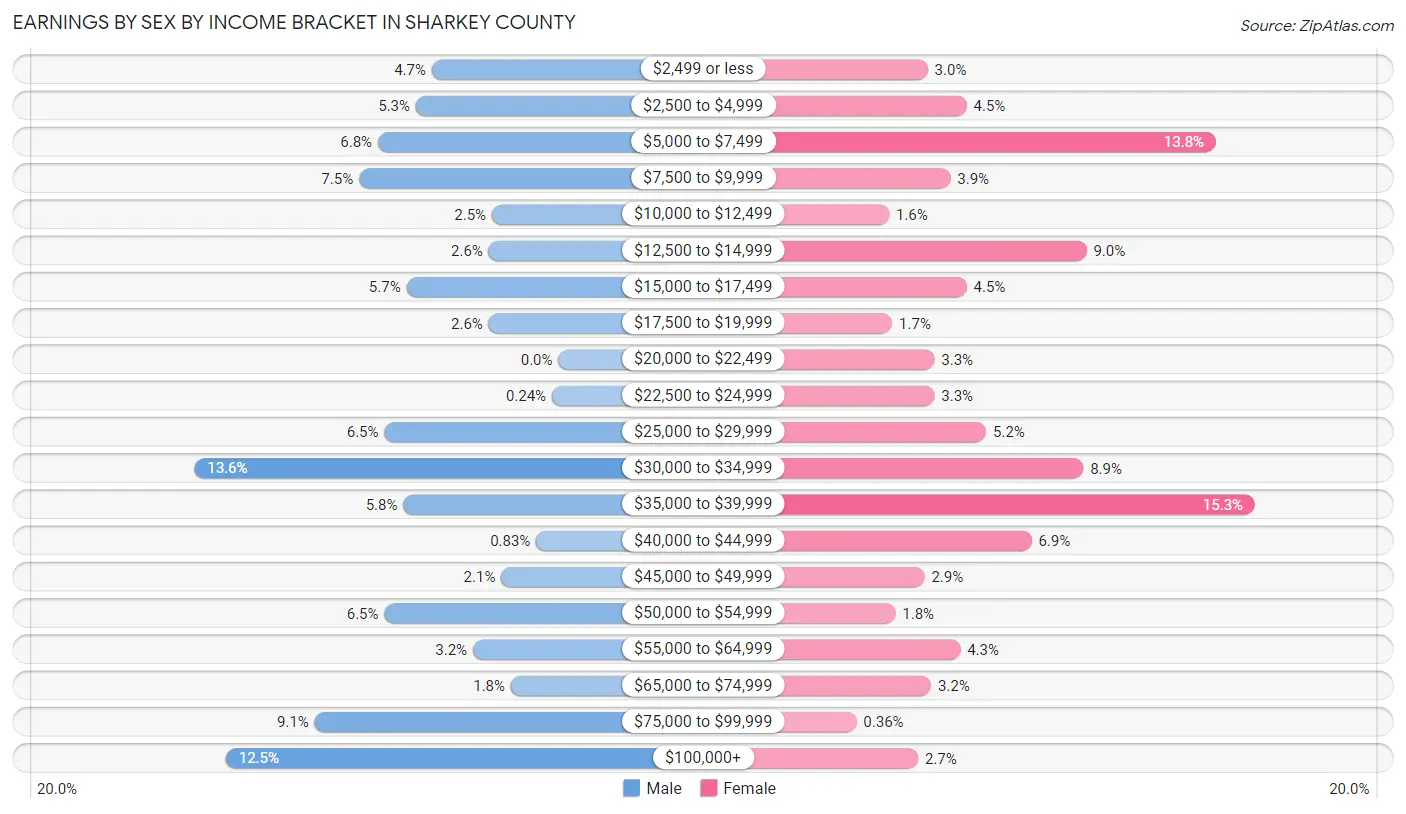
| Income | Male | Female |
| $2,499 or less | 40 (4.7%) | 25 (3.0%) |
| $2,500 to $4,999 | 45 (5.3%) | 37 (4.5%) |
| $5,000 to $7,499 | 57 (6.8%) | 114 (13.8%) |
| $7,500 to $9,999 | 63 (7.5%) | 32 (3.9%) |
| $10,000 to $12,499 | 21 (2.5%) | 13 (1.6%) |
| $12,500 to $14,999 | 22 (2.6%) | 74 (9.0%) |
| $15,000 to $17,499 | 48 (5.7%) | 37 (4.5%) |
| $17,500 to $19,999 | 22 (2.6%) | 14 (1.7%) |
| $20,000 to $22,499 | 0 (0.0%) | 27 (3.3%) |
| $22,500 to $24,999 | 2 (0.2%) | 27 (3.3%) |
| $25,000 to $29,999 | 55 (6.5%) | 43 (5.2%) |
| $30,000 to $34,999 | 115 (13.6%) | 73 (8.9%) |
| $35,000 to $39,999 | 49 (5.8%) | 126 (15.3%) |
| $40,000 to $44,999 | 7 (0.8%) | 57 (6.9%) |
| $45,000 to $49,999 | 18 (2.1%) | 24 (2.9%) |
| $50,000 to $54,999 | 55 (6.5%) | 15 (1.8%) |
| $55,000 to $64,999 | 27 (3.2%) | 35 (4.3%) |
| $65,000 to $74,999 | 15 (1.8%) | 26 (3.2%) |
| $75,000 to $99,999 | 77 (9.1%) | 3 (0.4%) |
| $100,000+ | 105 (12.5%) | 22 (2.7%) |
| Total | 843 (100.0%) | 824 (100.0%) |
Earnings by Sex by Educational Attainment in Sharkey County
Average earnings in Sharkey County are $35,000 for men and $33,200 for women, a difference of 5.1%. Men with an educational attainment of bachelor's degree enjoy the highest average annual earnings of $100,625, while those with high school diploma education earn the least with $31,155. Women with an educational attainment of bachelor's degree earn the most with the average annual earnings of $37,321, while those with high school diploma education have the smallest earnings of $24,728.
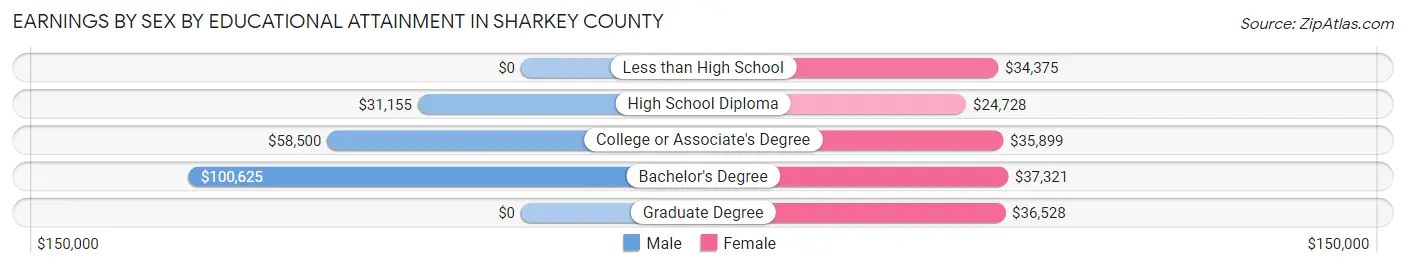
| Educational Attainment | Male Income | Female Income |
| Less than High School | - | - |
| High School Diploma | $31,155 | $24,728 |
| College or Associate's Degree | $58,500 | $35,899 |
| Bachelor's Degree | $100,625 | $37,321 |
| Graduate Degree | - | - |
| Total | $35,000 | $33,200 |
Family Income in Sharkey County
Family Income Brackets in Sharkey County
According to the Sharkey County family income data, there are 232 families falling into the $100,000 to $149,999 income range, which is the most common income bracket and makes up 27.0% of all families. Conversely, the $150,000 to $199,999 income bracket is the least frequent group with only 8 families (0.9%) belonging to this category.
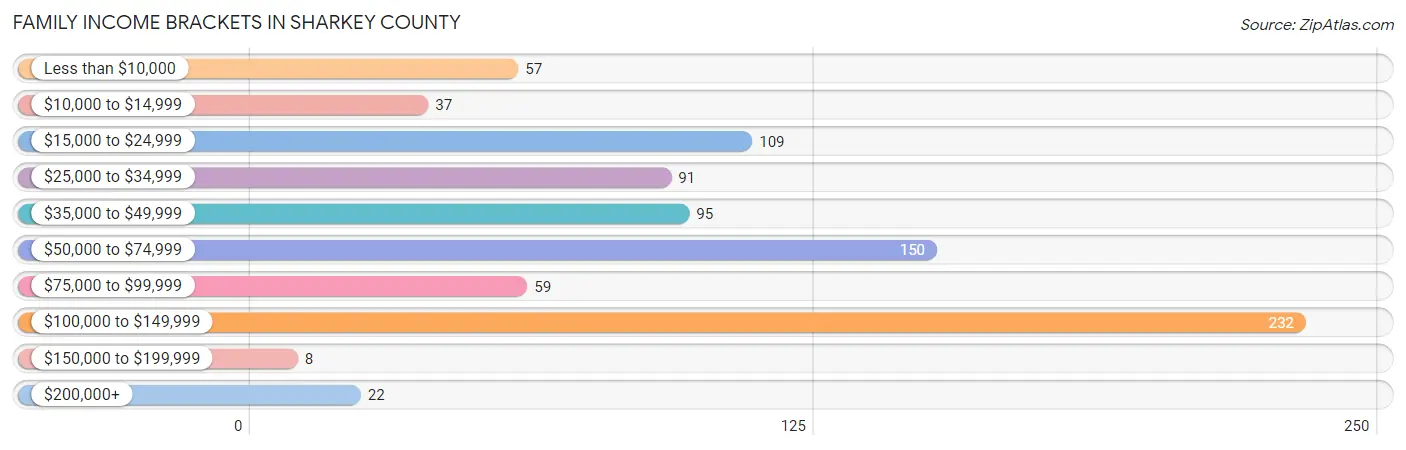
| Income Bracket | # Families | % Families |
| Less than $10,000 | 57 | 6.6% |
| $10,000 to $14,999 | 37 | 4.3% |
| $15,000 to $24,999 | 109 | 12.7% |
| $25,000 to $34,999 | 91 | 10.6% |
| $35,000 to $49,999 | 95 | 11.0% |
| $50,000 to $74,999 | 150 | 17.4% |
| $75,000 to $99,999 | 59 | 6.9% |
| $100,000 to $149,999 | 232 | 27.0% |
| $150,000 to $199,999 | 8 | 0.9% |
| $200,000+ | 22 | 2.6% |
Family Income by Famaliy Size in Sharkey County
4-person families (190 | 22.1%) account for the highest median family income in Sharkey County with $103,375 per family, while 4-person families (190 | 22.1%) have the highest median income of $25,844 per family member.
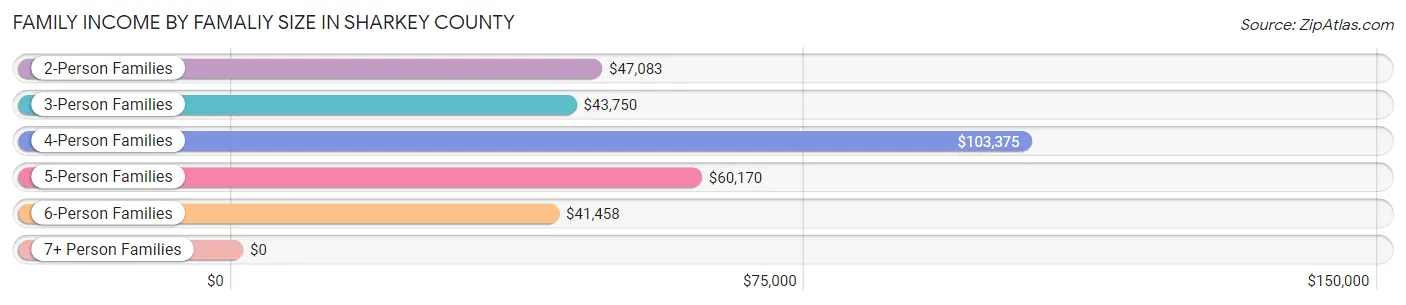
| Income Bracket | # Families | Median Income |
| 2-Person Families | 329 (38.3%) | $47,083 |
| 3-Person Families | 215 (25.0%) | $43,750 |
| 4-Person Families | 190 (22.1%) | $103,375 |
| 5-Person Families | 71 (8.3%) | $60,170 |
| 6-Person Families | 45 (5.2%) | $41,458 |
| 7+ Person Families | 10 (1.2%) | $0 |
| Total | 860 (100.0%) | $60,076 |
Family Income by Number of Earners in Sharkey County
The median family income in Sharkey County is $60,076, with families comprising 2 earners (255) having the highest median family income of $103,527, while families with no earners (108) have the lowest median family income of $22,727, accounting for 29.6% and 12.6% of families, respectively.
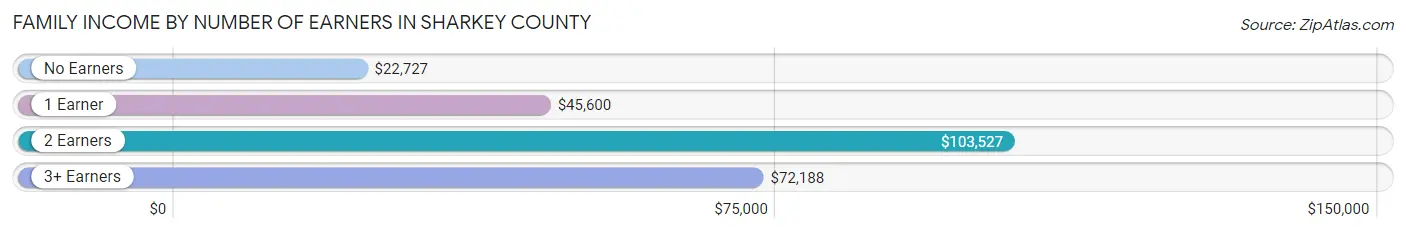
| Number of Earners | # Families | Median Income |
| No Earners | 108 (12.6%) | $22,727 |
| 1 Earner | 428 (49.8%) | $45,600 |
| 2 Earners | 255 (29.6%) | $103,527 |
| 3+ Earners | 69 (8.0%) | $72,188 |
| Total | 860 (100.0%) | $60,076 |
Household Income in Sharkey County
Household Income Brackets in Sharkey County
With 262 households falling in the category, the $15,000 to $24,999 income range is the most frequent in Sharkey County, accounting for 19.1% of all households. In contrast, only 16 households (1.2%) fall into the $150,000 to $199,999 income bracket, making it the least populous group.
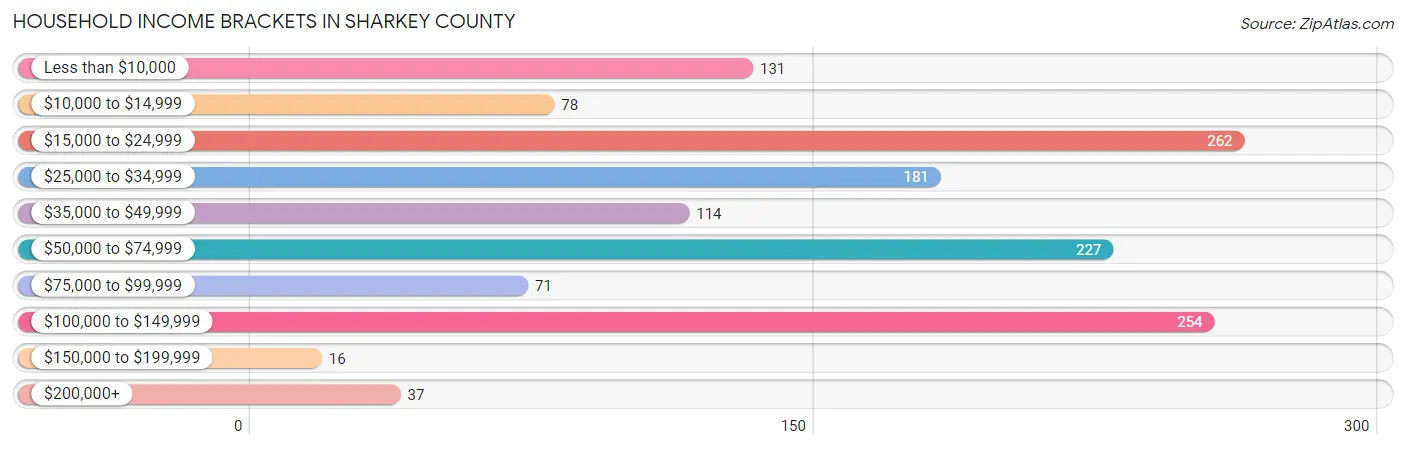
| Income Bracket | # Households | % Households |
| Less than $10,000 | 131 | 9.5% |
| $10,000 to $14,999 | 78 | 5.7% |
| $15,000 to $24,999 | 262 | 19.1% |
| $25,000 to $34,999 | 181 | 13.2% |
| $35,000 to $49,999 | 114 | 8.3% |
| $50,000 to $74,999 | 227 | 16.5% |
| $75,000 to $99,999 | 71 | 5.2% |
| $100,000 to $149,999 | 254 | 18.5% |
| $150,000 to $199,999 | 16 | 1.2% |
| $200,000+ | 37 | 2.7% |
Household Income by Householder Age in Sharkey County
The median household income in Sharkey County is $41,000, with the highest median household income of $46,458 found in the 65+ years age bracket for the primary householder. A total of 365 households (26.6%) fall into this category. Meanwhile, the 15 to 24 years age bracket for the primary householder has the lowest median household income of $5,724, with 29 households (2.1%) in this group.
| Income Bracket | # Households | Median Income |
| 15 to 24 Years | 29 (2.1%) | $5,724 |
| 25 to 44 Years | 356 (25.9%) | $41,188 |
| 45 to 64 Years | 624 (45.4%) | $43,047 |
| 65+ Years | 365 (26.6%) | $46,458 |
| Total | 1,374 (100.0%) | $41,000 |
Poverty in Sharkey County
Income Below Poverty by Sex and Age in Sharkey County
With 26.9% poverty level for males and 27.0% for females among the residents of Sharkey County, 12 to 14 year old males and 15 year old females are the most vulnerable to poverty, with 44 males (88.0%) and 15 females (100.0%) in their respective age groups living below the poverty level.
| Age Bracket | Male | Female |
| Under 5 Years | 45 (34.1%) | 42 (38.5%) |
| 5 Years | 11 (24.4%) | 4 (10.3%) |
| 6 to 11 Years | 56 (36.8%) | 29 (20.9%) |
| 12 to 14 Years | 44 (88.0%) | 9 (11.3%) |
| 15 Years | 25 (75.8%) | 15 (100.0%) |
| 16 and 17 Years | 14 (14.4%) | 16 (48.5%) |
| 18 to 24 Years | 133 (43.8%) | 47 (31.5%) |
| 25 to 34 Years | 65 (25.0%) | 44 (24.2%) |
| 35 to 44 Years | 38 (34.9%) | 79 (28.1%) |
| 45 to 54 Years | 3 (1.8%) | 50 (31.9%) |
| 55 to 64 Years | 73 (24.2%) | 72 (20.2%) |
| 65 to 74 Years | 11 (6.9%) | 100 (45.3%) |
| 75 Years and over | 0 (0.0%) | 0 (0.0%) |
| Total | 518 (26.9%) | 507 (27.0%) |
Income Above Poverty by Sex and Age in Sharkey County
According to the poverty statistics in Sharkey County, males aged 75 years and over and females aged 75 years and over are the age groups that are most secure financially, with 100.0% of males and 100.0% of females in these age groups living above the poverty line.
| Age Bracket | Male | Female |
| Under 5 Years | 87 (65.9%) | 67 (61.5%) |
| 5 Years | 34 (75.6%) | 35 (89.7%) |
| 6 to 11 Years | 96 (63.2%) | 110 (79.1%) |
| 12 to 14 Years | 6 (12.0%) | 71 (88.7%) |
| 15 Years | 8 (24.2%) | 0 (0.0%) |
| 16 and 17 Years | 83 (85.6%) | 17 (51.5%) |
| 18 to 24 Years | 171 (56.2%) | 102 (68.5%) |
| 25 to 34 Years | 195 (75.0%) | 138 (75.8%) |
| 35 to 44 Years | 71 (65.1%) | 202 (71.9%) |
| 45 to 54 Years | 163 (98.2%) | 107 (68.1%) |
| 55 to 64 Years | 228 (75.7%) | 284 (79.8%) |
| 65 to 74 Years | 149 (93.1%) | 121 (54.7%) |
| 75 Years and over | 120 (100.0%) | 119 (100.0%) |
| Total | 1,411 (73.2%) | 1,373 (73.0%) |
Income Below Poverty Among Married-Couple Families in Sharkey County
The poverty statistics for married-couple families in Sharkey County show that 0.2% or 1 of the total 485 families live below the poverty line. Families with 1 or 2 children have the highest poverty rate of 0.4%, comprising of 1 families. On the other hand, families with no children have the lowest poverty rate of 0.0%, which includes 0 families.
| Children | Above Poverty | Below Poverty |
| No Children | 248 (100.0%) | 0 (0.0%) |
| 1 or 2 Children | 221 (99.6%) | 1 (0.4%) |
| 3 or 4 Children | 15 (100.0%) | 0 (0.0%) |
| 5 or more Children | 0 (0.0%) | 0 (0.0%) |
| Total | 484 (99.8%) | 1 (0.2%) |
Income Below Poverty Among Single-Parent Households in Sharkey County
According to the poverty data in Sharkey County, 95.2% or 20 single-father households and 45.5% or 161 single-mother households are living below the poverty line. Among single-father households, those with 3 or 4 children have the highest poverty rate, with 20 households (100.0%) experiencing poverty. Likewise, among single-mother households, those with 5 or more children have the highest poverty rate, with 9 households (81.8%) falling below the poverty line.
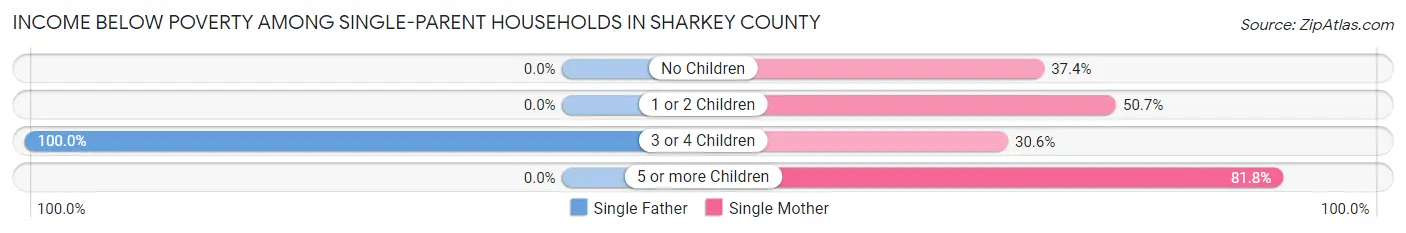
| Children | Single Father | Single Mother |
| No Children | 0 (0.0%) | 34 (37.4%) |
| 1 or 2 Children | 0 (0.0%) | 103 (50.7%) |
| 3 or 4 Children | 20 (100.0%) | 15 (30.6%) |
| 5 or more Children | 0 (0.0%) | 9 (81.8%) |
| Total | 20 (95.2%) | 161 (45.5%) |
Income Below Poverty Among Married-Couple vs Single-Parent Households in Sharkey County
The poverty data for Sharkey County shows that 1 of the married-couple family households (0.2%) and 181 of the single-parent households (48.3%) are living below the poverty level. Within the married-couple family households, those with 1 or 2 children have the highest poverty rate, with 1 households (0.4%) falling below the poverty line. Among the single-parent households, those with 5 or more children have the highest poverty rate, with 9 household (81.8%) living below poverty.
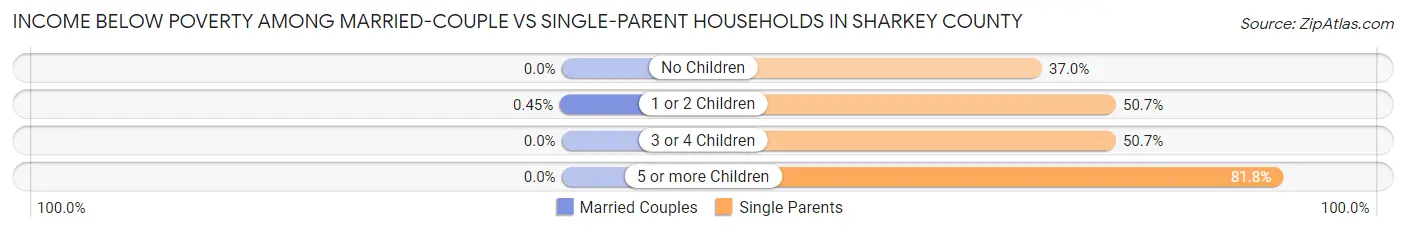
| Children | Married-Couple Families | Single-Parent Households |
| No Children | 0 (0.0%) | 34 (37.0%) |
| 1 or 2 Children | 1 (0.4%) | 103 (50.7%) |
| 3 or 4 Children | 0 (0.0%) | 35 (50.7%) |
| 5 or more Children | 0 (0.0%) | 9 (81.8%) |
| Total | 1 (0.2%) | 181 (48.3%) |
Race in Sharkey County
The most populous races in Sharkey County are Black / African American (2,836 | 72.5%), White / Caucasian (1,035 | 26.5%), and Hispanic or Latino (28 | 0.7%).
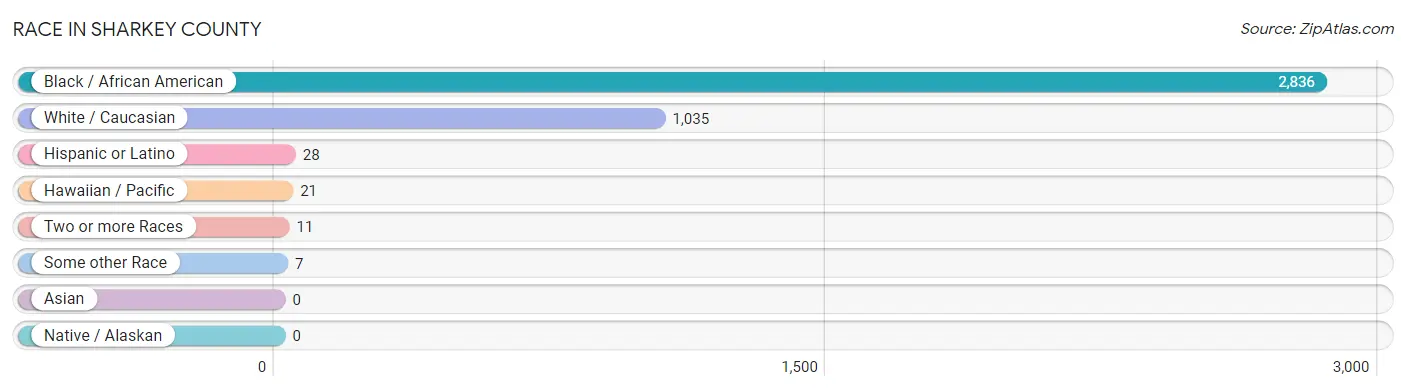
| Race | # Population | % Population |
| Asian | 0 | 0.0% |
| Black / African American | 2,836 | 72.5% |
| Hawaiian / Pacific | 21 | 0.5% |
| Hispanic or Latino | 28 | 0.7% |
| Native / Alaskan | 0 | 0.0% |
| White / Caucasian | 1,035 | 26.5% |
| Two or more Races | 11 | 0.3% |
| Some other Race | 7 | 0.2% |
| Total | 3,910 | 100.0% |
Ancestry in Sharkey County
The most populous ancestries reported in Sharkey County are American (484 | 12.4%), Irish (117 | 3.0%), English (86 | 2.2%), French (74 | 1.9%), and German (22 | 0.6%), together accounting for 20.0% of all Sharkey County residents.
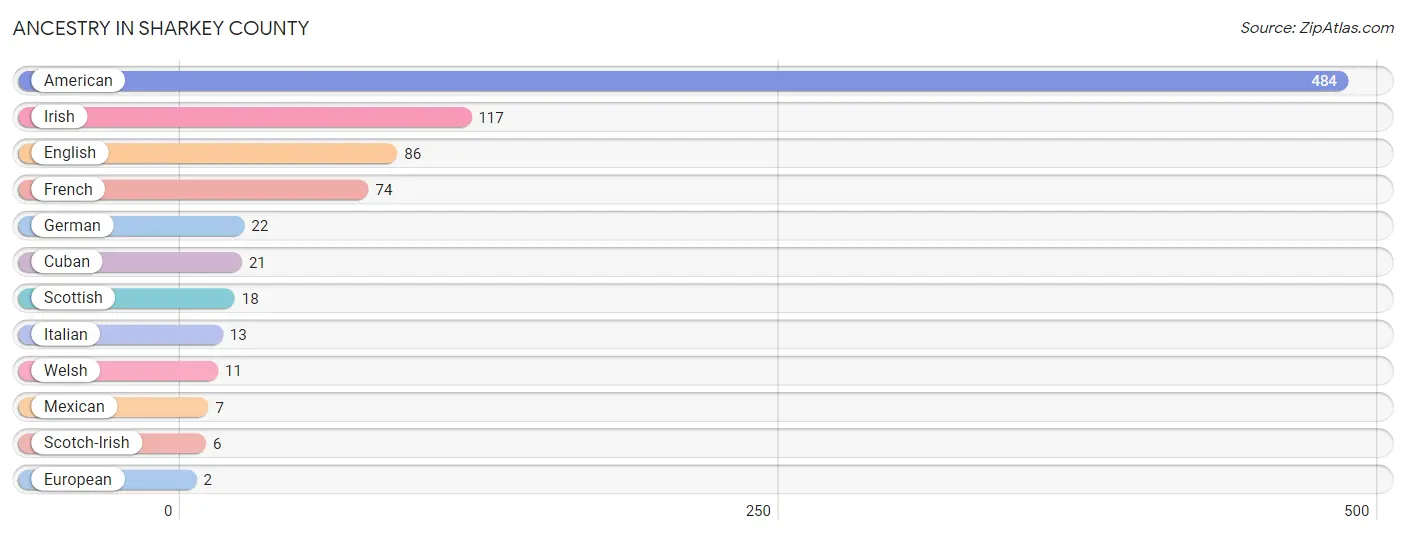
| Ancestry | # Population | % Population |
| American | 484 | 12.4% |
| Cuban | 21 | 0.5% |
| English | 86 | 2.2% |
| European | 2 | 0.1% |
| French | 74 | 1.9% |
| German | 22 | 0.6% |
| Irish | 117 | 3.0% |
| Italian | 13 | 0.3% |
| Mexican | 7 | 0.2% |
| Scotch-Irish | 6 | 0.2% |
| Scottish | 18 | 0.5% |
| Welsh | 11 | 0.3% | View All 12 Rows |
Immigrants in Sharkey County

| Immigration Origin | # Population | % Population | View All 0 Rows |
Sex and Age in Sharkey County
Sex and Age in Sharkey County
The most populous age groups in Sharkey County are 15 to 19 Years (250 | 12.8%) for men and 55 to 59 Years (202 | 10.3%) for women.
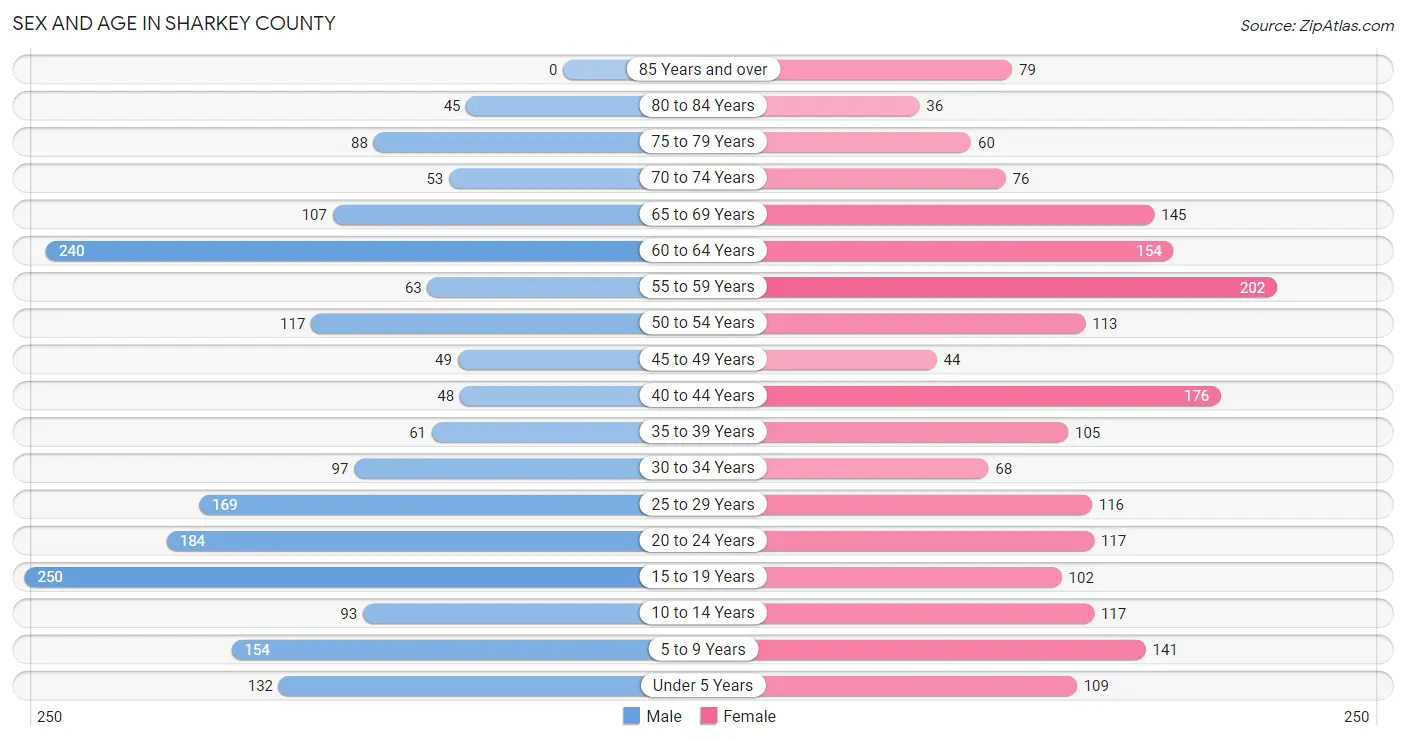
| Age Bracket | Male | Female |
| Under 5 Years | 132 (6.8%) | 109 (5.6%) |
| 5 to 9 Years | 154 (7.9%) | 141 (7.2%) |
| 10 to 14 Years | 93 (4.8%) | 117 (6.0%) |
| 15 to 19 Years | 250 (12.8%) | 102 (5.2%) |
| 20 to 24 Years | 184 (9.4%) | 117 (6.0%) |
| 25 to 29 Years | 169 (8.7%) | 116 (5.9%) |
| 30 to 34 Years | 97 (5.0%) | 68 (3.5%) |
| 35 to 39 Years | 61 (3.1%) | 105 (5.4%) |
| 40 to 44 Years | 48 (2.5%) | 176 (9.0%) |
| 45 to 49 Years | 49 (2.5%) | 44 (2.2%) |
| 50 to 54 Years | 117 (6.0%) | 113 (5.8%) |
| 55 to 59 Years | 63 (3.2%) | 202 (10.3%) |
| 60 to 64 Years | 240 (12.3%) | 154 (7.9%) |
| 65 to 69 Years | 107 (5.5%) | 145 (7.4%) |
| 70 to 74 Years | 53 (2.7%) | 76 (3.9%) |
| 75 to 79 Years | 88 (4.5%) | 60 (3.1%) |
| 80 to 84 Years | 45 (2.3%) | 36 (1.8%) |
| 85 Years and over | 0 (0.0%) | 79 (4.0%) |
| Total | 1,950 (100.0%) | 1,960 (100.0%) |
Families and Households in Sharkey County
Median Family Size in Sharkey County
The median family size in Sharkey County is 3.55 persons per family, with single female/mother families (354 | 41.2%) accounting for the largest median family size of 4.5 persons per family. On the other hand, single male/father families (21 | 2.4%) represent the smallest median family size with 2.38 persons per family.
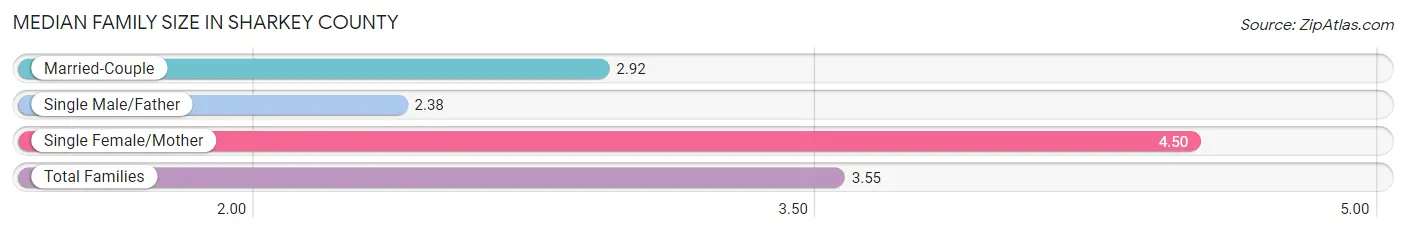
| Family Type | # Families | Family Size |
| Married-Couple | 485 (56.4%) | 2.92 |
| Single Male/Father | 21 (2.4%) | 2.38 |
| Single Female/Mother | 354 (41.2%) | 4.50 |
| Total Families | 860 (100.0%) | 3.55 |
Median Household Size in Sharkey County
The median household size in Sharkey County is 2.75 persons per household, with single female/mother households (354 | 25.8%) accounting for the largest median household size of 4.7 persons per household. non-family households (514 | 37.4%) represent the smallest median household size with 1.21 persons per household.
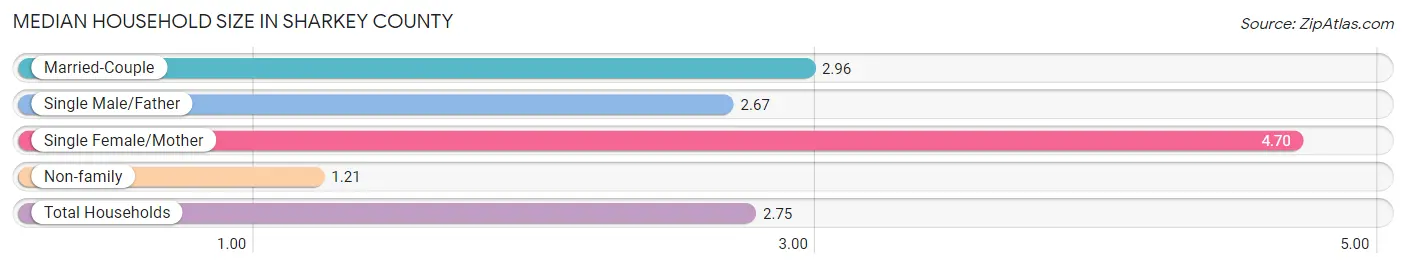
| Household Type | # Households | Household Size |
| Married-Couple | 485 (35.3%) | 2.96 |
| Single Male/Father | 21 (1.5%) | 2.67 |
| Single Female/Mother | 354 (25.8%) | 4.70 |
| Non-family | 514 (37.4%) | 1.21 |
| Total Households | 1,374 (100.0%) | 2.75 |
Household Size by Marriage Status in Sharkey County
Out of a total of 1,374 households in Sharkey County, 860 (62.6%) are family households, while 514 (37.4%) are nonfamily households. The most numerous type of family households are 2-person households, comprising 321, and the most common type of nonfamily households are 1-person households, comprising 409.
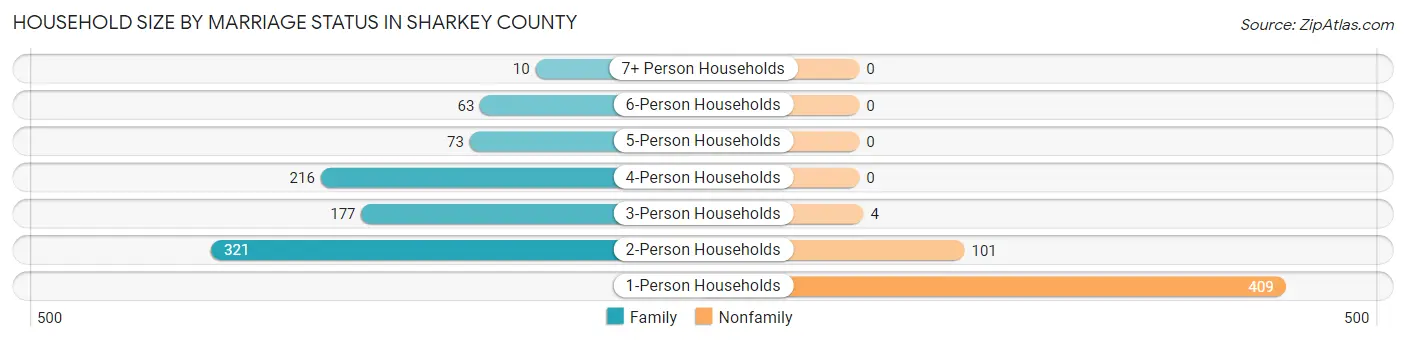
| Household Size | Family Households | Nonfamily Households |
| 1-Person Households | - | 409 (29.8%) |
| 2-Person Households | 321 (23.4%) | 101 (7.3%) |
| 3-Person Households | 177 (12.9%) | 4 (0.3%) |
| 4-Person Households | 216 (15.7%) | 0 (0.0%) |
| 5-Person Households | 73 (5.3%) | 0 (0.0%) |
| 6-Person Households | 63 (4.6%) | 0 (0.0%) |
| 7+ Person Households | 10 (0.7%) | 0 (0.0%) |
| Total | 860 (62.6%) | 514 (37.4%) |
Female Fertility in Sharkey County
Fertility by Age in Sharkey County
Average fertility rate in Sharkey County is 17.0 births per 1,000 women. Women in the age bracket of 20 to 34 years have the highest fertility rate with 43.0 births per 1,000 women. Women in the age bracket of 20 to 34 years acount for 100.0% of all women with births.
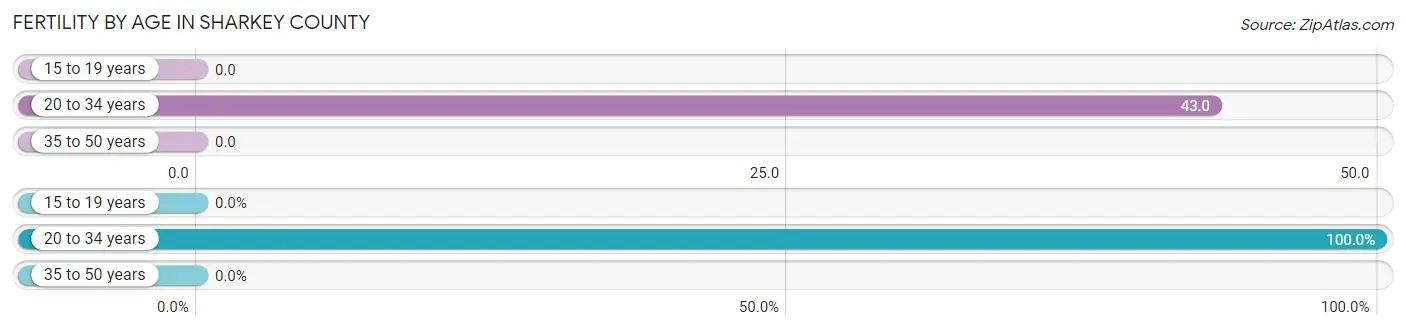
| Age Bracket | Women with Births | Births / 1,000 Women |
| 15 to 19 years | 0 (0.0%) | 0.0 |
| 20 to 34 years | 13 (100.0%) | 43.0 |
| 35 to 50 years | 0 (0.0%) | 0.0 |
| Total | 13 (100.0%) | 17.0 |
Fertility by Age by Marriage Status in Sharkey County
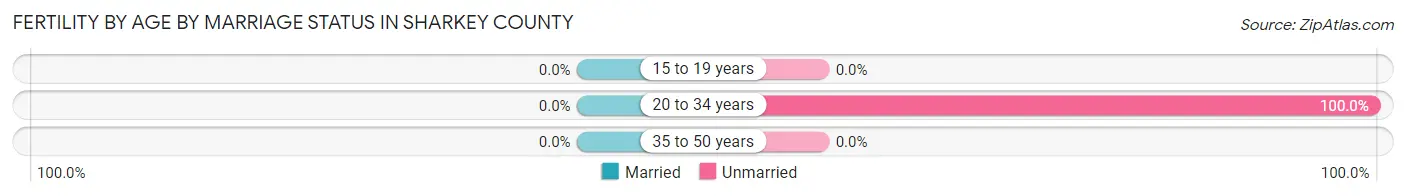
| Age Bracket | Married | Unmarried |
| 15 to 19 years | 0 (0.0%) | 0 (0.0%) |
| 20 to 34 years | 0 (0.0%) | 13 (100.0%) |
| 35 to 50 years | 0 (0.0%) | 0 (0.0%) |
| Total | 0 (0.0%) | 13 (100.0%) |
Fertility by Education in Sharkey County
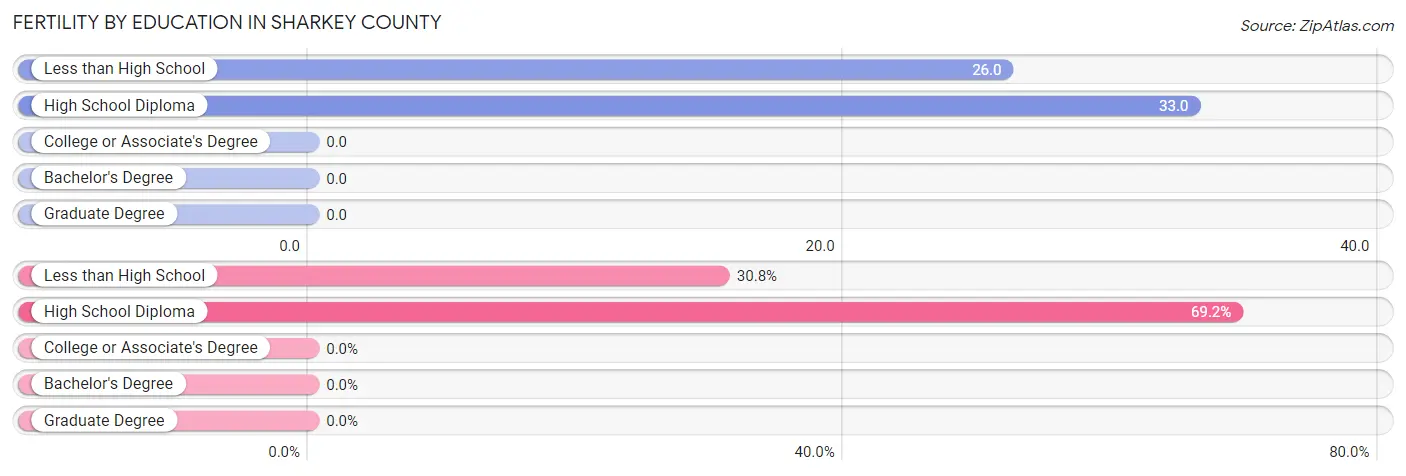
| Educational Attainment | Women with Births | Births / 1,000 Women |
| Less than High School | 4 (30.8%) | 26.0 |
| High School Diploma | 9 (69.2%) | 33.0 |
| College or Associate's Degree | 0 (0.0%) | 0.0 |
| Bachelor's Degree | 0 (0.0%) | 0.0 |
| Graduate Degree | 0 (0.0%) | 0.0 |
| Total | 13 (100.0%) | 17.0 |
Fertility by Education by Marriage Status in Sharkey County
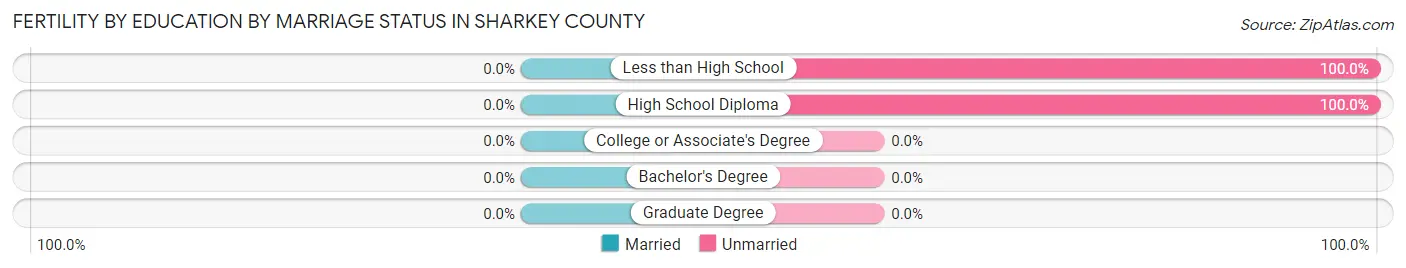
| Educational Attainment | Married | Unmarried |
| Less than High School | 0 (0.0%) | 4 (100.0%) |
| High School Diploma | 0 (0.0%) | 9 (100.0%) |
| College or Associate's Degree | 0 (0.0%) | 0 (0.0%) |
| Bachelor's Degree | 0 (0.0%) | 0 (0.0%) |
| Graduate Degree | 0 (0.0%) | 0 (0.0%) |
| Total | 0 (0.0%) | 13 (100.0%) |
Employment Characteristics in Sharkey County
Employment by Class of Employer in Sharkey County
Among the 1,474 employed individuals in Sharkey County, private company employees (831 | 56.4%), state government employees (252 | 17.1%), and not-for-profit organizations (158 | 10.7%) make up the most common classes of employment.
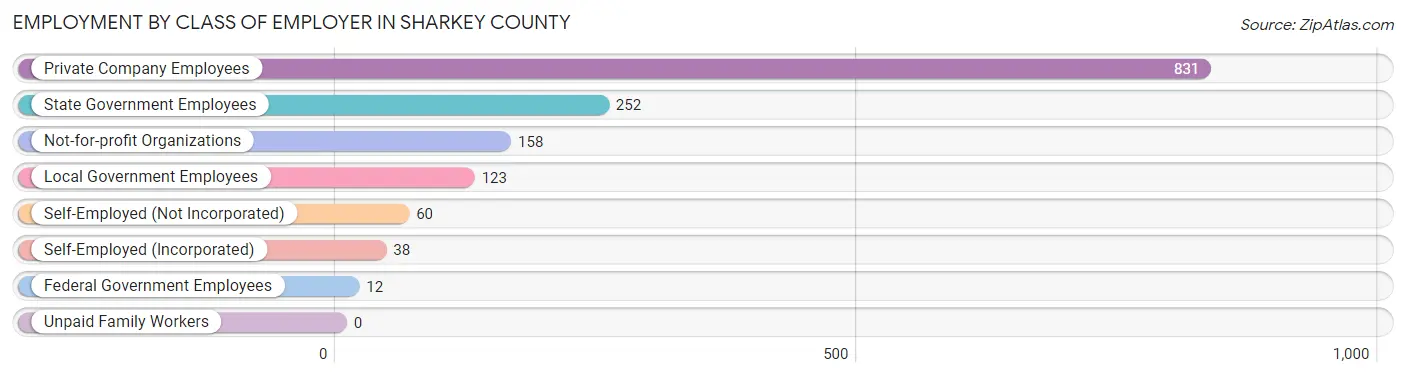
| Employer Class | # Employees | % Employees |
| Private Company Employees | 831 | 56.4% |
| Self-Employed (Incorporated) | 38 | 2.6% |
| Self-Employed (Not Incorporated) | 60 | 4.1% |
| Not-for-profit Organizations | 158 | 10.7% |
| Local Government Employees | 123 | 8.3% |
| State Government Employees | 252 | 17.1% |
| Federal Government Employees | 12 | 0.8% |
| Unpaid Family Workers | 0 | 0.0% |
| Total | 1,474 | 100.0% |
Employment Status by Age in Sharkey County
According to the labor force statistics for Sharkey County, out of the total population over 16 years of age (3,112), 56.1% or 1,746 individuals are in the labor force, with 12.8% or 223 of them unemployed. The age group with the highest labor force participation rate is 20 to 24 years, with 89.4% or 269 individuals in the labor force. Within the labor force, the 16 to 19 years age range has the highest percentage of unemployed individuals, with 72.6% or 114 of them being unemployed.
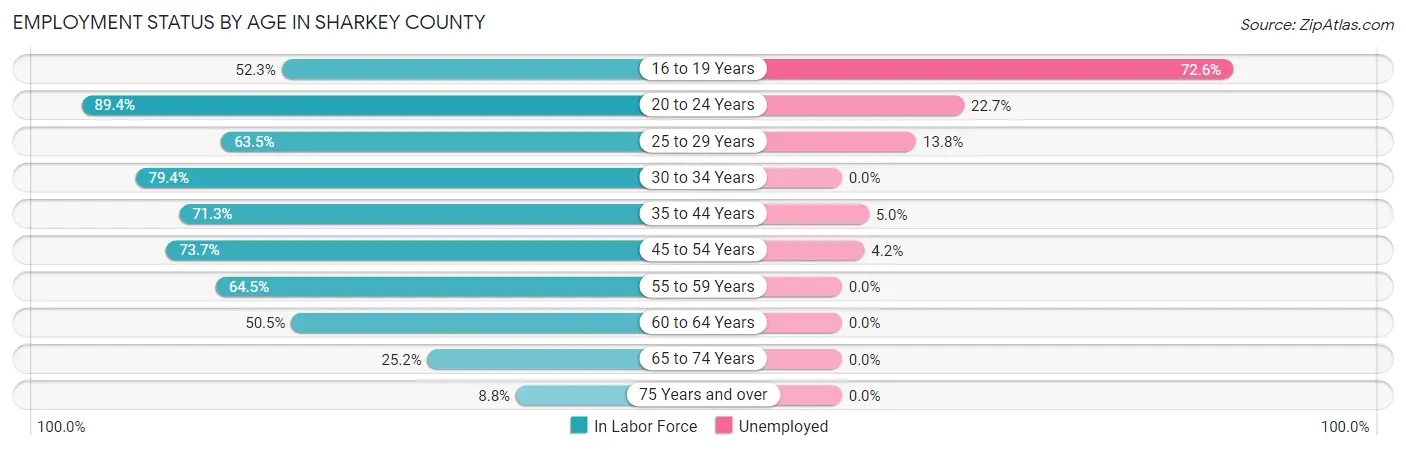
| Age Bracket | In Labor Force | Unemployed |
| 16 to 19 Years | 157 (52.3%) | 114 (72.6%) |
| 20 to 24 Years | 269 (89.4%) | 61 (22.7%) |
| 25 to 29 Years | 181 (63.5%) | 25 (13.8%) |
| 30 to 34 Years | 131 (79.4%) | 0 (0.0%) |
| 35 to 44 Years | 278 (71.3%) | 14 (5.0%) |
| 45 to 54 Years | 238 (73.7%) | 10 (4.2%) |
| 55 to 59 Years | 171 (64.5%) | 0 (0.0%) |
| 60 to 64 Years | 199 (50.5%) | 0 (0.0%) |
| 65 to 74 Years | 96 (25.2%) | 0 (0.0%) |
| 75 Years and over | 27 (8.8%) | 0 (0.0%) |
| Total | 1,746 (56.1%) | 223 (12.8%) |
Employment Status by Educational Attainment in Sharkey County
According to labor force statistics for Sharkey County, 65.8% of individuals (1,199) out of the total population between 25 and 64 years of age (1,822) are in the labor force, with 4.1% or 49 of them being unemployed. The group with the highest labor force participation rate are those with the educational attainment of bachelor's degree or higher, with 89.1% or 228 individuals in the labor force. Within the labor force, individuals with less than high school education have the highest percentage of unemployment, with 10.0% or 9 of them being unemployed.
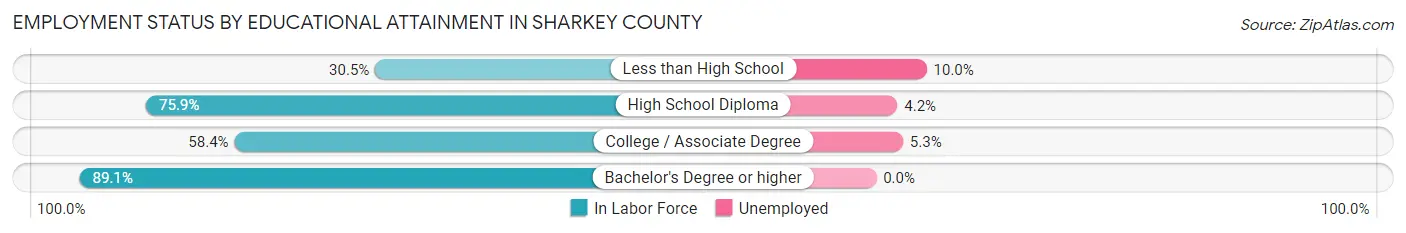
| Educational Attainment | In Labor Force | Unemployed |
| Less than High School | 90 (30.5%) | 30 (10.0%) |
| High School Diploma | 596 (75.9%) | 33 (4.2%) |
| College / Associate Degree | 284 (58.4%) | 26 (5.3%) |
| Bachelor's Degree or higher | 228 (89.1%) | 0 (0.0%) |
| Total | 1,199 (65.8%) | 75 (4.1%) |
Employment Occupations by Sex in Sharkey County
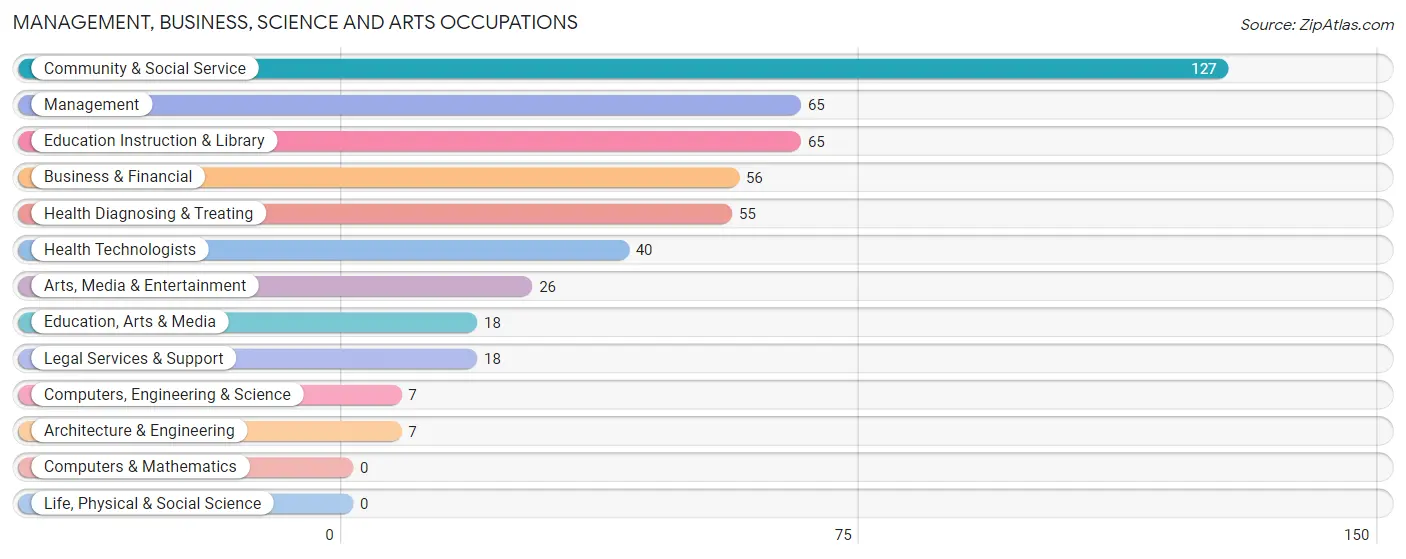
Management, Business, Science and Arts Occupations
The most common Management, Business, Science and Arts occupations in Sharkey County are Community & Social Service (127 | 8.3%), Management (65 | 4.3%), Education Instruction & Library (65 | 4.3%), Business & Financial (56 | 3.7%), and Health Diagnosing & Treating (55 | 3.6%).
Management, Business, Science and Arts Occupations by Sex
Within the Management, Business, Science and Arts occupations in Sharkey County, the most male-oriented occupations are Computers, Engineering & Science (100.0%), Architecture & Engineering (100.0%), and Business & Financial (80.4%), while the most female-oriented occupations are Education Instruction & Library (100.0%), Arts, Media & Entertainment (100.0%), and Health Technologists (92.5%).
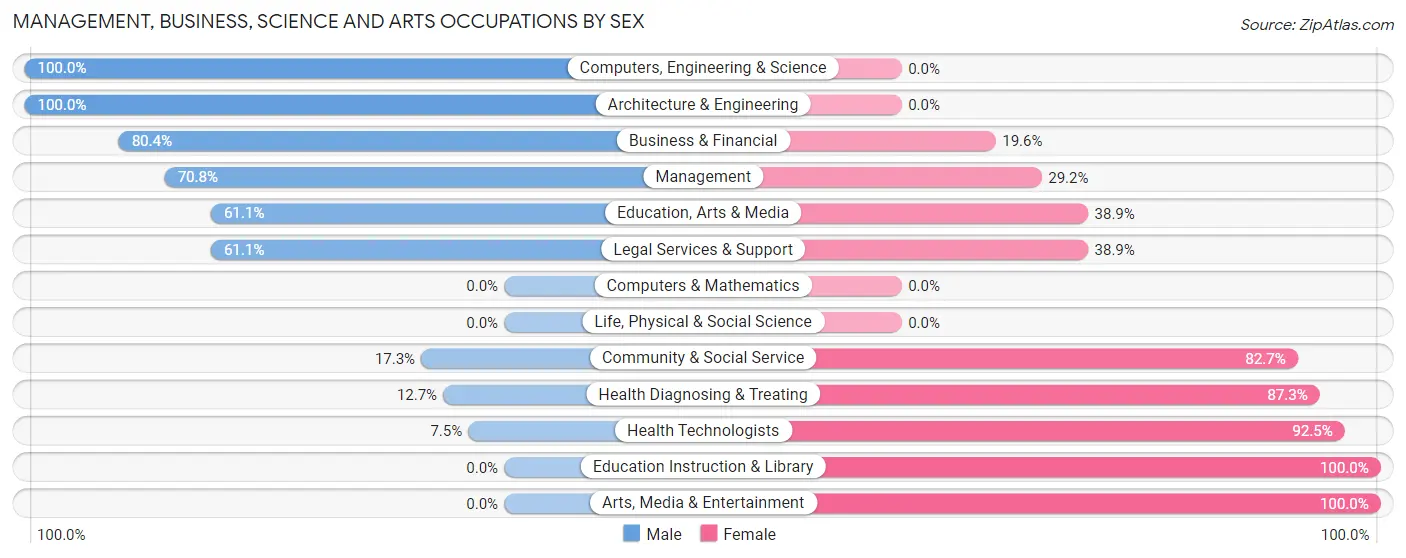
| Occupation | Male | Female |
| Management | 46 (70.8%) | 19 (29.2%) |
| Business & Financial | 45 (80.4%) | 11 (19.6%) |
| Computers, Engineering & Science | 7 (100.0%) | 0 (0.0%) |
| Computers & Mathematics | 0 (0.0%) | 0 (0.0%) |
| Architecture & Engineering | 7 (100.0%) | 0 (0.0%) |
| Life, Physical & Social Science | 0 (0.0%) | 0 (0.0%) |
| Community & Social Service | 22 (17.3%) | 105 (82.7%) |
| Education, Arts & Media | 11 (61.1%) | 7 (38.9%) |
| Legal Services & Support | 11 (61.1%) | 7 (38.9%) |
| Education Instruction & Library | 0 (0.0%) | 65 (100.0%) |
| Arts, Media & Entertainment | 0 (0.0%) | 26 (100.0%) |
| Health Diagnosing & Treating | 7 (12.7%) | 48 (87.3%) |
| Health Technologists | 3 (7.5%) | 37 (92.5%) |
| Total (Category) | 127 (41.0%) | 183 (59.0%) |
| Total (Overall) | 823 (54.0%) | 700 (46.0%) |
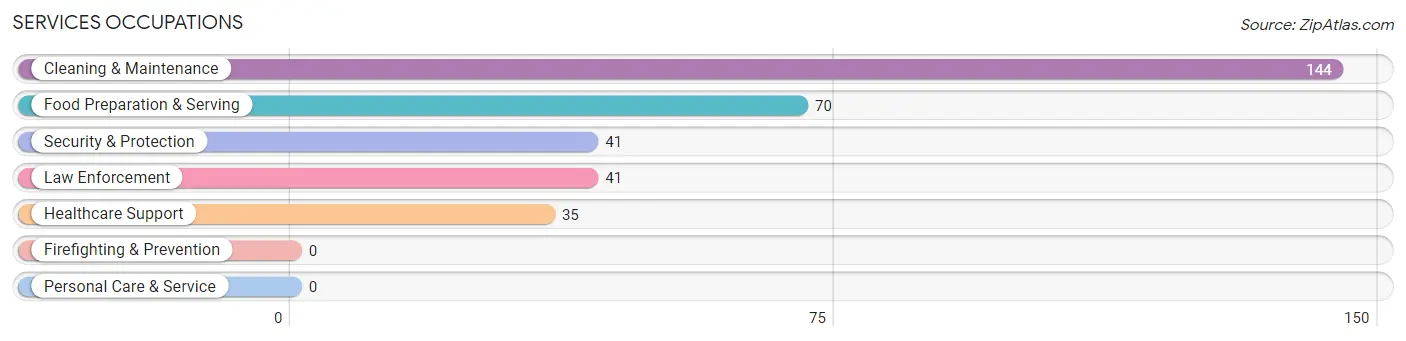
Services Occupations
The most common Services occupations in Sharkey County are Cleaning & Maintenance (144 | 9.5%), Food Preparation & Serving (70 | 4.6%), Security & Protection (41 | 2.7%), Law Enforcement (41 | 2.7%), and Healthcare Support (35 | 2.3%).
Services Occupations by Sex
Within the Services occupations in Sharkey County, the most male-oriented occupations are Security & Protection (100.0%), Law Enforcement (100.0%), and Cleaning & Maintenance (72.9%), while the most female-oriented occupations are Healthcare Support (100.0%), Food Preparation & Serving (82.9%), and Cleaning & Maintenance (27.1%).
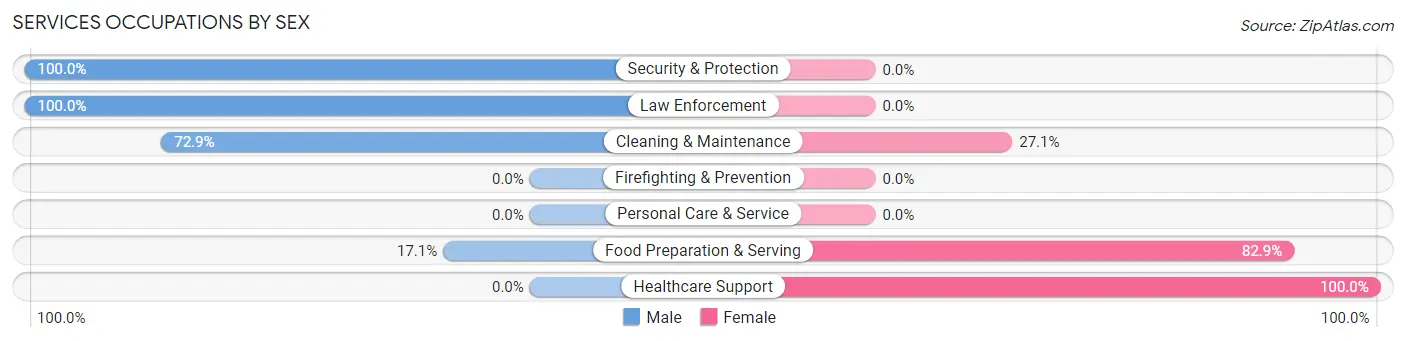
| Occupation | Male | Female |
| Healthcare Support | 0 (0.0%) | 35 (100.0%) |
| Security & Protection | 41 (100.0%) | 0 (0.0%) |
| Firefighting & Prevention | 0 (0.0%) | 0 (0.0%) |
| Law Enforcement | 41 (100.0%) | 0 (0.0%) |
| Food Preparation & Serving | 12 (17.1%) | 58 (82.9%) |
| Cleaning & Maintenance | 105 (72.9%) | 39 (27.1%) |
| Personal Care & Service | 0 (0.0%) | 0 (0.0%) |
| Total (Category) | 158 (54.5%) | 132 (45.5%) |
| Total (Overall) | 823 (54.0%) | 700 (46.0%) |
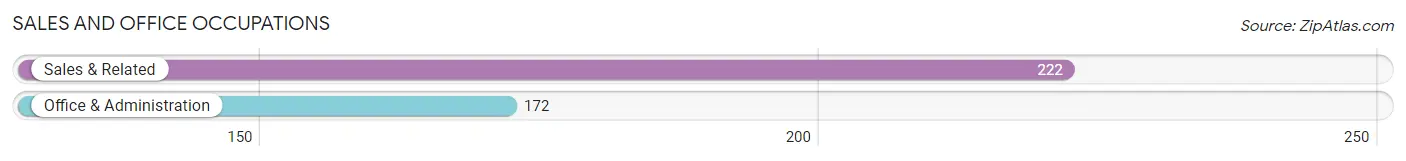
Sales and Office Occupations
The most common Sales and Office occupations in Sharkey County are Sales & Related (222 | 14.6%), and Office & Administration (172 | 11.3%).
Sales and Office Occupations by Sex
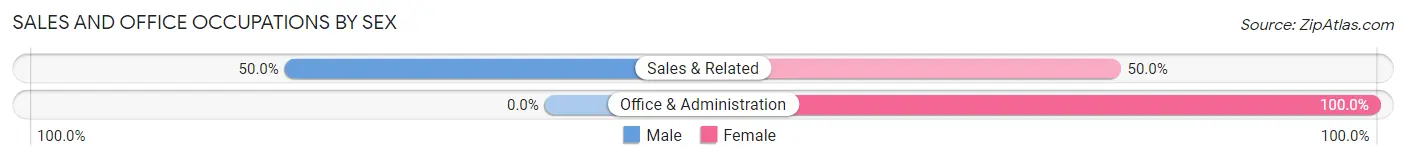
| Occupation | Male | Female |
| Sales & Related | 111 (50.0%) | 111 (50.0%) |
| Office & Administration | 0 (0.0%) | 172 (100.0%) |
| Total (Category) | 111 (28.2%) | 283 (71.8%) |
| Total (Overall) | 823 (54.0%) | 700 (46.0%) |
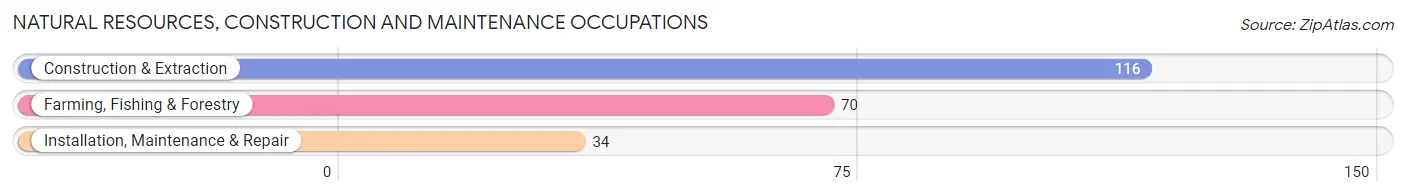
Natural Resources, Construction and Maintenance Occupations
The most common Natural Resources, Construction and Maintenance occupations in Sharkey County are Construction & Extraction (116 | 7.6%), Farming, Fishing & Forestry (70 | 4.6%), and Installation, Maintenance & Repair (34 | 2.2%).
Natural Resources, Construction and Maintenance Occupations by Sex
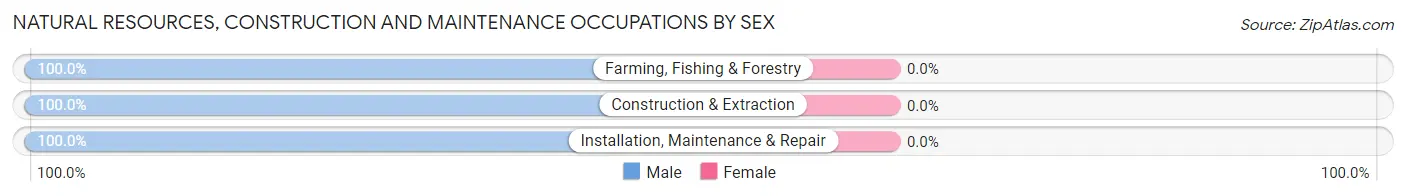
| Occupation | Male | Female |
| Farming, Fishing & Forestry | 70 (100.0%) | 0 (0.0%) |
| Construction & Extraction | 116 (100.0%) | 0 (0.0%) |
| Installation, Maintenance & Repair | 34 (100.0%) | 0 (0.0%) |
| Total (Category) | 220 (100.0%) | 0 (0.0%) |
| Total (Overall) | 823 (54.0%) | 700 (46.0%) |
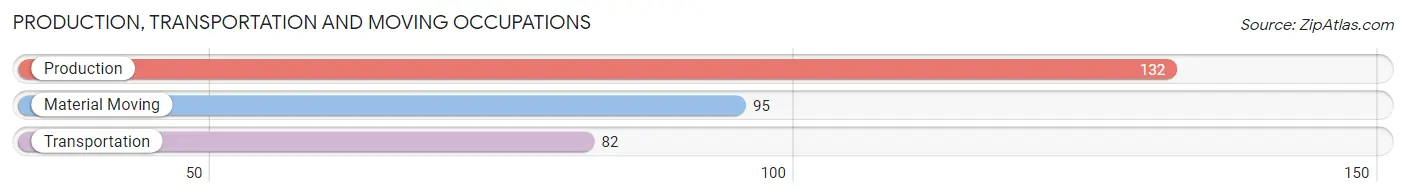
Production, Transportation and Moving Occupations
The most common Production, Transportation and Moving occupations in Sharkey County are Production (132 | 8.7%), Material Moving (95 | 6.2%), and Transportation (82 | 5.4%).
Production, Transportation and Moving Occupations by Sex
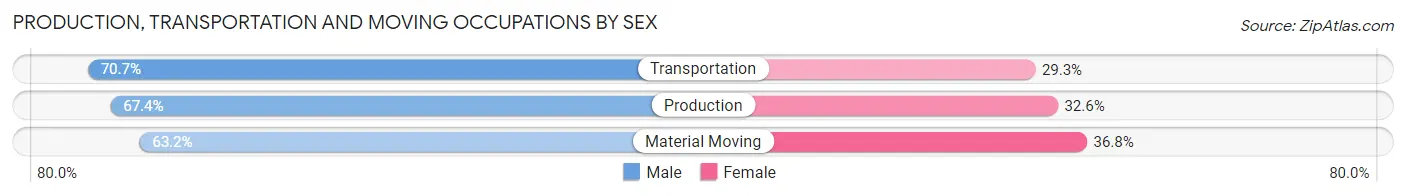
| Occupation | Male | Female |
| Production | 89 (67.4%) | 43 (32.6%) |
| Transportation | 58 (70.7%) | 24 (29.3%) |
| Material Moving | 60 (63.2%) | 35 (36.8%) |
| Total (Category) | 207 (67.0%) | 102 (33.0%) |
| Total (Overall) | 823 (54.0%) | 700 (46.0%) |
Employment Industries by Sex in Sharkey County
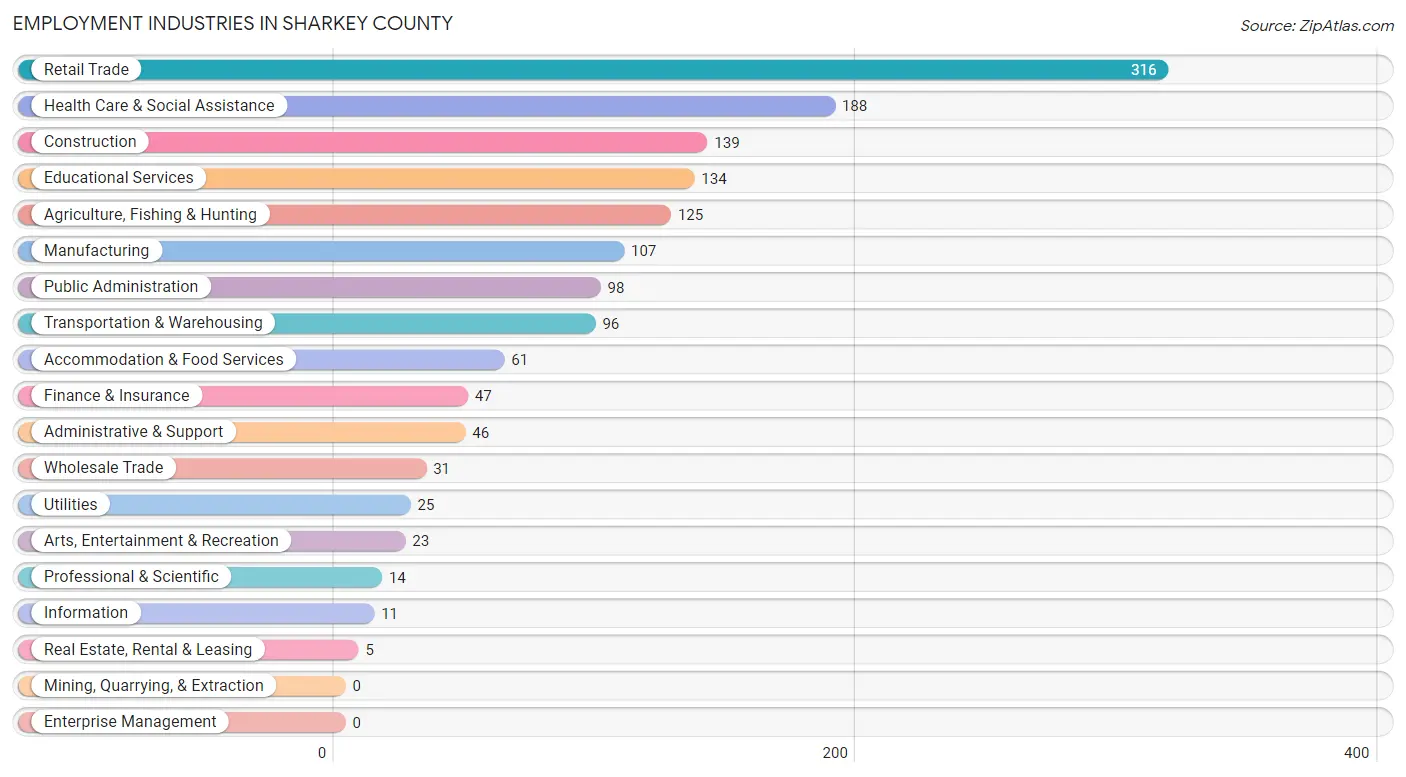
Employment Industries in Sharkey County
The major employment industries in Sharkey County include Retail Trade (316 | 20.7%), Health Care & Social Assistance (188 | 12.3%), Construction (139 | 9.1%), Educational Services (134 | 8.8%), and Agriculture, Fishing & Hunting (125 | 8.2%).
Employment Industries by Sex in Sharkey County
The Sharkey County industries that see more men than women are Construction (100.0%), Wholesale Trade (100.0%), and Administrative & Support (93.5%), whereas the industries that tend to have a higher number of women are Information (100.0%), Real Estate, Rental & Leasing (100.0%), and Arts, Entertainment & Recreation (100.0%).
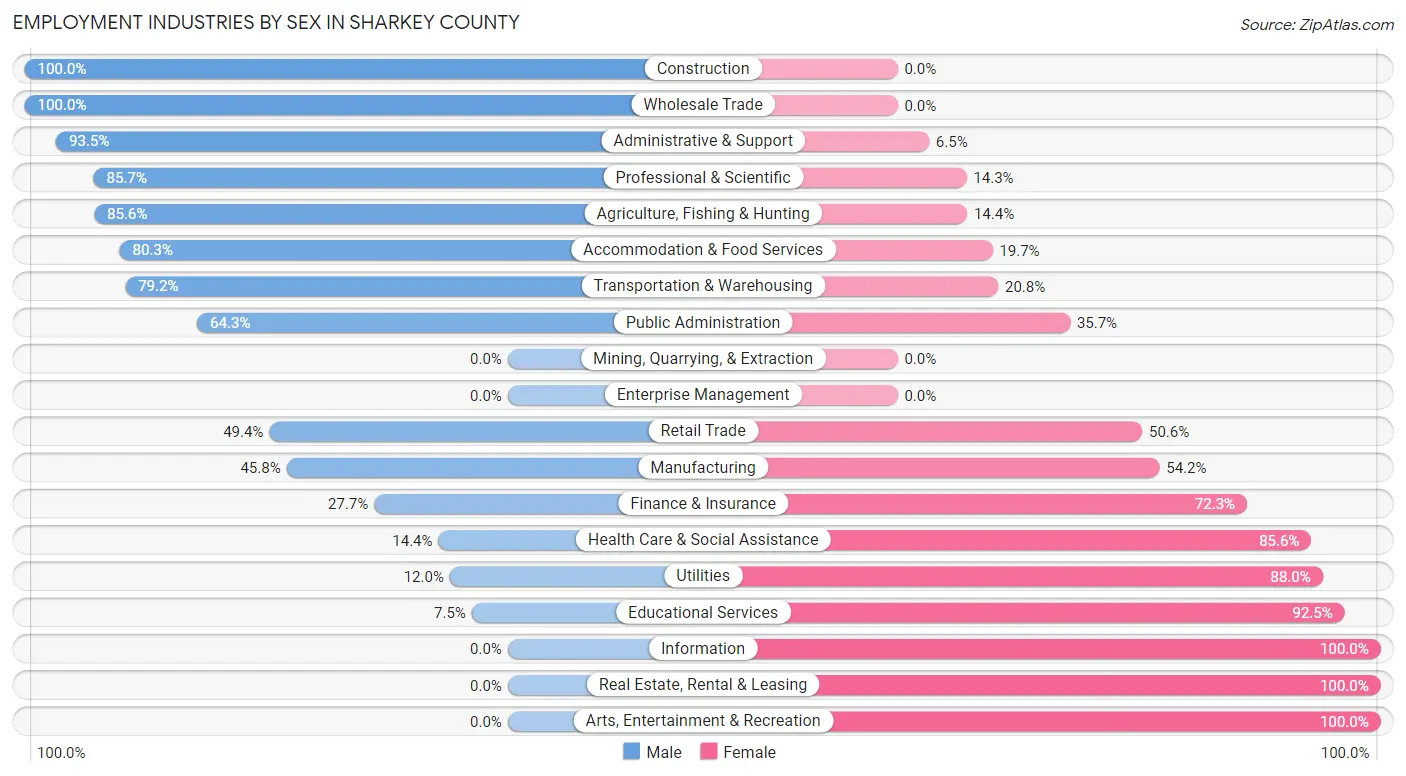
| Industry | Male | Female |
| Agriculture, Fishing & Hunting | 107 (85.6%) | 18 (14.4%) |
| Mining, Quarrying, & Extraction | 0 (0.0%) | 0 (0.0%) |
| Construction | 139 (100.0%) | 0 (0.0%) |
| Manufacturing | 49 (45.8%) | 58 (54.2%) |
| Wholesale Trade | 31 (100.0%) | 0 (0.0%) |
| Retail Trade | 156 (49.4%) | 160 (50.6%) |
| Transportation & Warehousing | 76 (79.2%) | 20 (20.8%) |
| Utilities | 3 (12.0%) | 22 (88.0%) |
| Information | 0 (0.0%) | 11 (100.0%) |
| Finance & Insurance | 13 (27.7%) | 34 (72.3%) |
| Real Estate, Rental & Leasing | 0 (0.0%) | 5 (100.0%) |
| Professional & Scientific | 12 (85.7%) | 2 (14.3%) |
| Enterprise Management | 0 (0.0%) | 0 (0.0%) |
| Administrative & Support | 43 (93.5%) | 3 (6.5%) |
| Educational Services | 10 (7.5%) | 124 (92.5%) |
| Health Care & Social Assistance | 27 (14.4%) | 161 (85.6%) |
| Arts, Entertainment & Recreation | 0 (0.0%) | 23 (100.0%) |
| Accommodation & Food Services | 49 (80.3%) | 12 (19.7%) |
| Public Administration | 63 (64.3%) | 35 (35.7%) |
| Total | 823 (54.0%) | 700 (46.0%) |
Education in Sharkey County
School Enrollment in Sharkey County
The most common levels of schooling among the 1,056 students in Sharkey County are high school (263 | 24.9%), middle school (191 | 18.1%), and elementary school (180 | 17.1%).
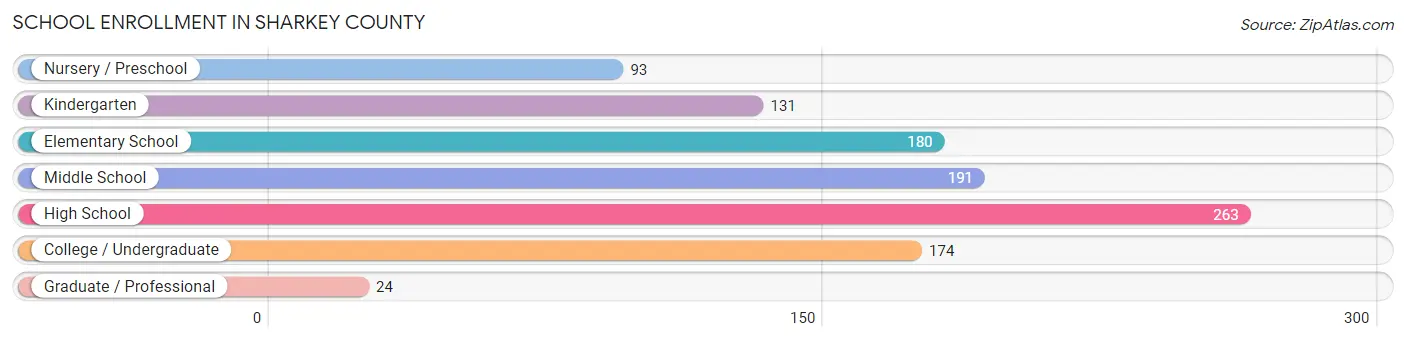
| School Level | # Students | % Students |
| Nursery / Preschool | 93 | 8.8% |
| Kindergarten | 131 | 12.4% |
| Elementary School | 180 | 17.1% |
| Middle School | 191 | 18.1% |
| High School | 263 | 24.9% |
| College / Undergraduate | 174 | 16.5% |
| Graduate / Professional | 24 | 2.3% |
| Total | 1,056 | 100.0% |
School Enrollment by Age by Funding Source in Sharkey County
Out of a total of 1,056 students who are enrolled in schools in Sharkey County, 180 (17.0%) attend a private institution, while the remaining 876 (83.0%) are enrolled in public schools. The age group of 35 years and over has the highest likelihood of being enrolled in private schools, with 8 (38.1% in the age bracket) enrolled. Conversely, the age group of 18 to 19 year olds has the lowest likelihood of being enrolled in a private school, with 103 (100.0% in the age bracket) attending a public institution.
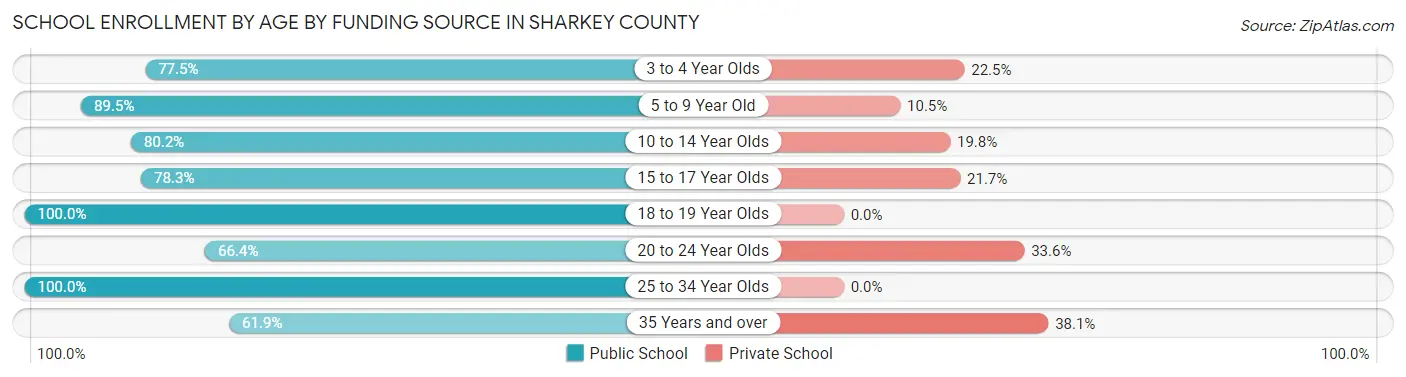
| Age Bracket | Public School | Private School |
| 3 to 4 Year Olds | 69 (77.5%) | 20 (22.5%) |
| 5 to 9 Year Old | 264 (89.5%) | 31 (10.5%) |
| 10 to 14 Year Olds | 166 (80.2%) | 41 (19.8%) |
| 15 to 17 Year Olds | 148 (78.3%) | 41 (21.7%) |
| 18 to 19 Year Olds | 103 (100.0%) | 0 (0.0%) |
| 20 to 24 Year Olds | 75 (66.4%) | 38 (33.6%) |
| 25 to 34 Year Olds | 39 (100.0%) | 0 (0.0%) |
| 35 Years and over | 13 (61.9%) | 8 (38.1%) |
| Total | 876 (83.0%) | 180 (17.0%) |
Educational Attainment by Field of Study in Sharkey County
Bio, nature & agricultural (104 | 23.7%), science & technology (72 | 16.4%), education (70 | 16.0%), arts & humanities (41 | 9.4%), and liberal arts & history (36 | 8.2%) are the most common fields of study among 438 individuals in Sharkey County who have obtained a bachelor's degree or higher.
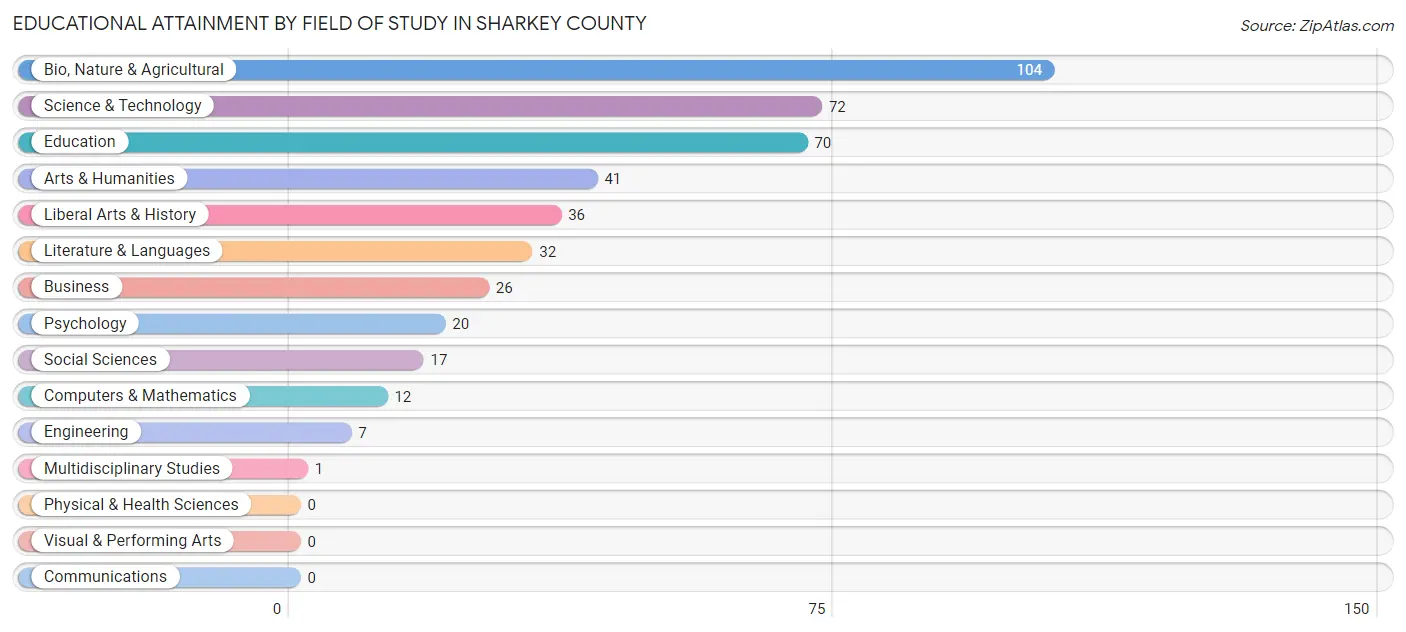
| Field of Study | # Graduates | % Graduates |
| Computers & Mathematics | 12 | 2.7% |
| Bio, Nature & Agricultural | 104 | 23.7% |
| Physical & Health Sciences | 0 | 0.0% |
| Psychology | 20 | 4.6% |
| Social Sciences | 17 | 3.9% |
| Engineering | 7 | 1.6% |
| Multidisciplinary Studies | 1 | 0.2% |
| Science & Technology | 72 | 16.4% |
| Business | 26 | 5.9% |
| Education | 70 | 16.0% |
| Literature & Languages | 32 | 7.3% |
| Liberal Arts & History | 36 | 8.2% |
| Visual & Performing Arts | 0 | 0.0% |
| Communications | 0 | 0.0% |
| Arts & Humanities | 41 | 9.4% |
| Total | 438 | 100.0% |
Transportation & Commute in Sharkey County
Vehicle Availability by Sex in Sharkey County
The most prevalent vehicle ownership categories in Sharkey County are males with 2 vehicles (266, accounting for 33.9%) and females with 2 vehicles (225, making up 38.7%).
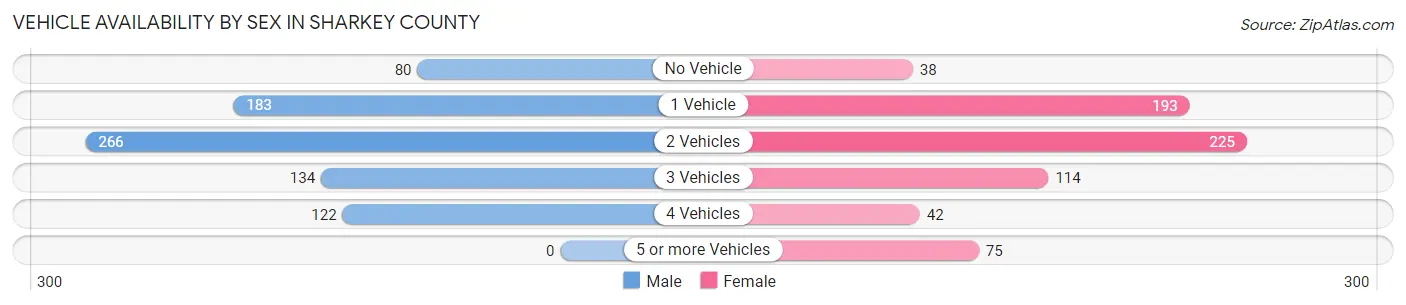
| Vehicles Available | Male | Female |
| No Vehicle | 80 (10.2%) | 38 (5.5%) |
| 1 Vehicle | 183 (23.3%) | 193 (28.1%) |
| 2 Vehicles | 266 (33.9%) | 225 (32.8%) |
| 3 Vehicles | 134 (17.1%) | 114 (16.6%) |
| 4 Vehicles | 122 (15.5%) | 42 (6.1%) |
| 5 or more Vehicles | 0 (0.0%) | 75 (10.9%) |
| Total | 785 (100.0%) | 687 (100.0%) |
Commute Time in Sharkey County
The most frequently occuring commute durations in Sharkey County are 5 to 9 minutes (318 commuters, 21.9%), 10 to 14 minutes (265 commuters, 18.2%), and 45 to 59 minutes (249 commuters, 17.2%).
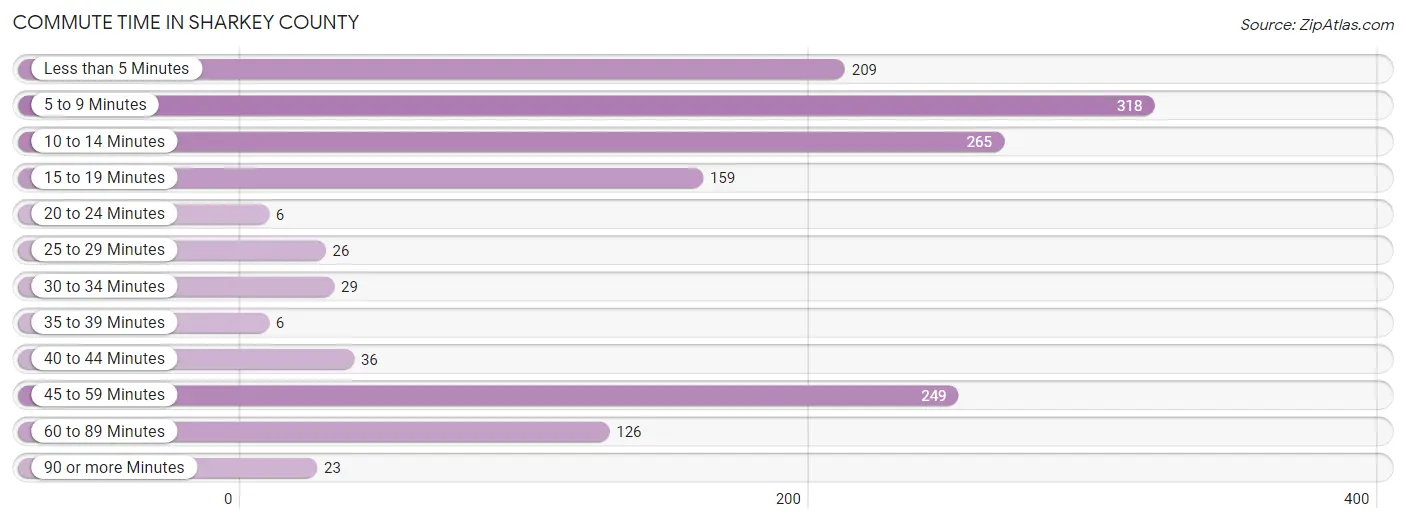
| Commute Time | # Commuters | % Commuters |
| Less than 5 Minutes | 209 | 14.4% |
| 5 to 9 Minutes | 318 | 21.9% |
| 10 to 14 Minutes | 265 | 18.2% |
| 15 to 19 Minutes | 159 | 11.0% |
| 20 to 24 Minutes | 6 | 0.4% |
| 25 to 29 Minutes | 26 | 1.8% |
| 30 to 34 Minutes | 29 | 2.0% |
| 35 to 39 Minutes | 6 | 0.4% |
| 40 to 44 Minutes | 36 | 2.5% |
| 45 to 59 Minutes | 249 | 17.2% |
| 60 to 89 Minutes | 126 | 8.7% |
| 90 or more Minutes | 23 | 1.6% |
Commute Time by Sex in Sharkey County
The most common commute times in Sharkey County are 45 to 59 minutes (152 commuters, 19.8%) for males and 5 to 9 minutes (200 commuters, 29.2%) for females.
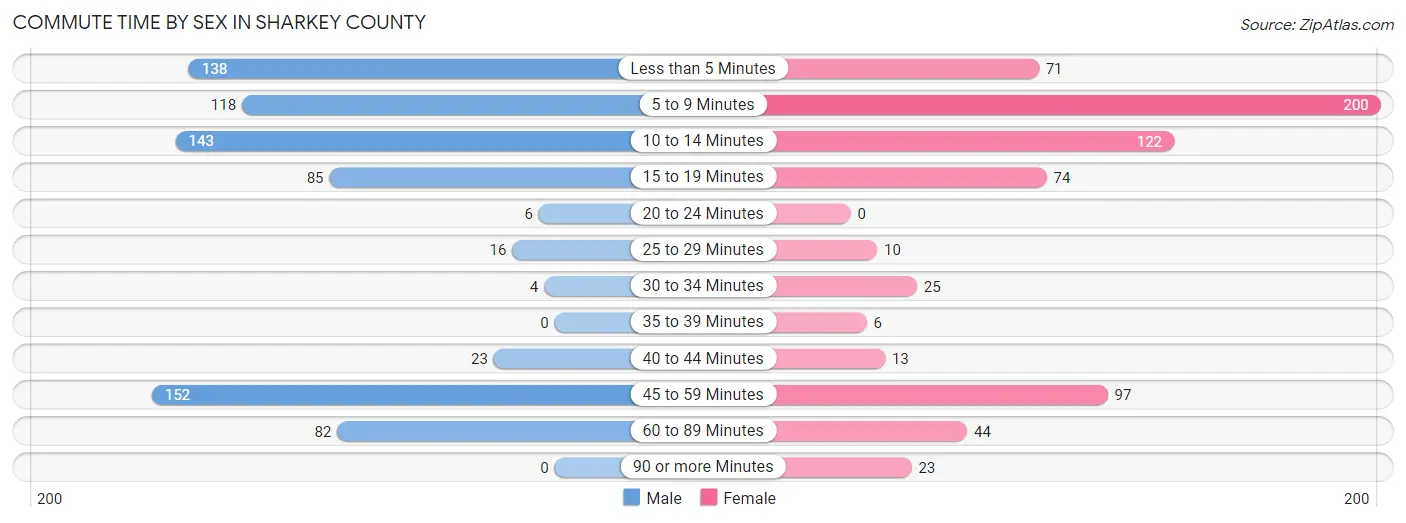
| Commute Time | Male | Female |
| Less than 5 Minutes | 138 (18.0%) | 71 (10.4%) |
| 5 to 9 Minutes | 118 (15.4%) | 200 (29.2%) |
| 10 to 14 Minutes | 143 (18.6%) | 122 (17.8%) |
| 15 to 19 Minutes | 85 (11.1%) | 74 (10.8%) |
| 20 to 24 Minutes | 6 (0.8%) | 0 (0.0%) |
| 25 to 29 Minutes | 16 (2.1%) | 10 (1.5%) |
| 30 to 34 Minutes | 4 (0.5%) | 25 (3.6%) |
| 35 to 39 Minutes | 0 (0.0%) | 6 (0.9%) |
| 40 to 44 Minutes | 23 (3.0%) | 13 (1.9%) |
| 45 to 59 Minutes | 152 (19.8%) | 97 (14.2%) |
| 60 to 89 Minutes | 82 (10.7%) | 44 (6.4%) |
| 90 or more Minutes | 0 (0.0%) | 23 (3.4%) |
Time of Departure to Work by Sex in Sharkey County
The most frequent times of departure to work in Sharkey County are 5:00 AM to 5:29 AM (145, 18.9%) for males and 7:00 AM to 7:29 AM (189, 27.6%) for females.
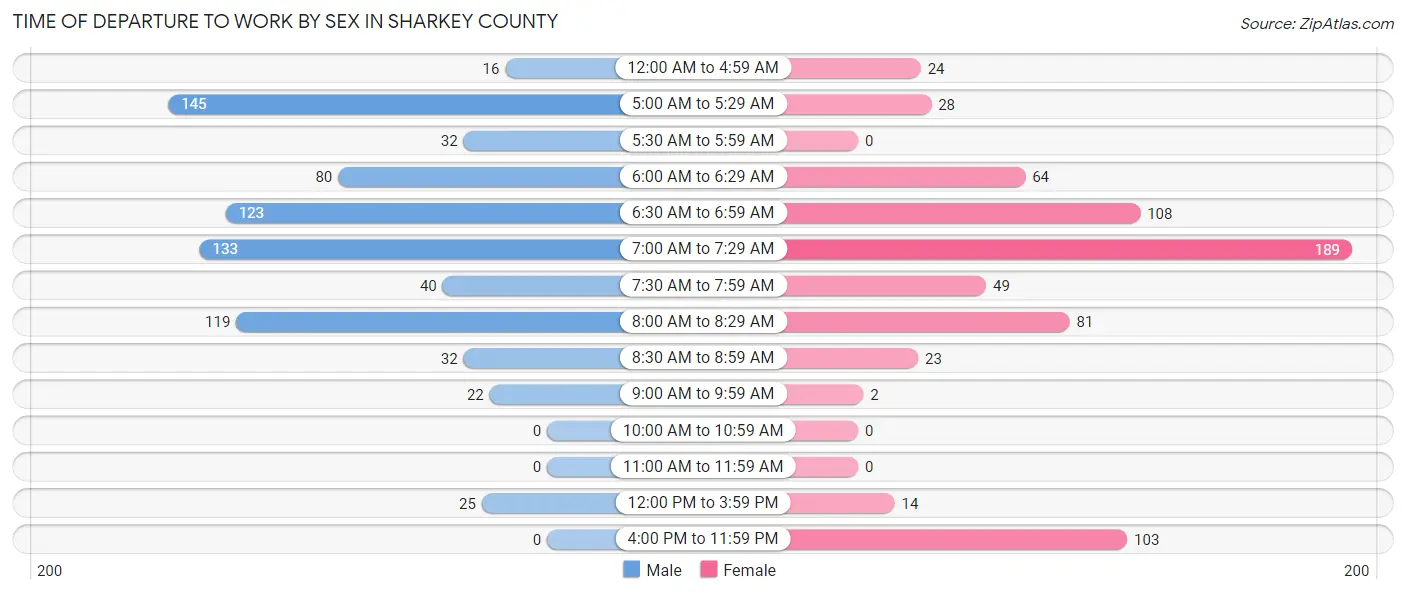
| Time of Departure | Male | Female |
| 12:00 AM to 4:59 AM | 16 (2.1%) | 24 (3.5%) |
| 5:00 AM to 5:29 AM | 145 (18.9%) | 28 (4.1%) |
| 5:30 AM to 5:59 AM | 32 (4.2%) | 0 (0.0%) |
| 6:00 AM to 6:29 AM | 80 (10.4%) | 64 (9.3%) |
| 6:30 AM to 6:59 AM | 123 (16.0%) | 108 (15.8%) |
| 7:00 AM to 7:29 AM | 133 (17.3%) | 189 (27.6%) |
| 7:30 AM to 7:59 AM | 40 (5.2%) | 49 (7.1%) |
| 8:00 AM to 8:29 AM | 119 (15.5%) | 81 (11.8%) |
| 8:30 AM to 8:59 AM | 32 (4.2%) | 23 (3.4%) |
| 9:00 AM to 9:59 AM | 22 (2.9%) | 2 (0.3%) |
| 10:00 AM to 10:59 AM | 0 (0.0%) | 0 (0.0%) |
| 11:00 AM to 11:59 AM | 0 (0.0%) | 0 (0.0%) |
| 12:00 PM to 3:59 PM | 25 (3.3%) | 14 (2.0%) |
| 4:00 PM to 11:59 PM | 0 (0.0%) | 103 (15.0%) |
| Total | 767 (100.0%) | 685 (100.0%) |
Housing Occupancy in Sharkey County
Occupancy by Ownership in Sharkey County
Of the total 1,374 dwellings in Sharkey County, owner-occupied units account for 796 (57.9%), while renter-occupied units make up 578 (42.1%).
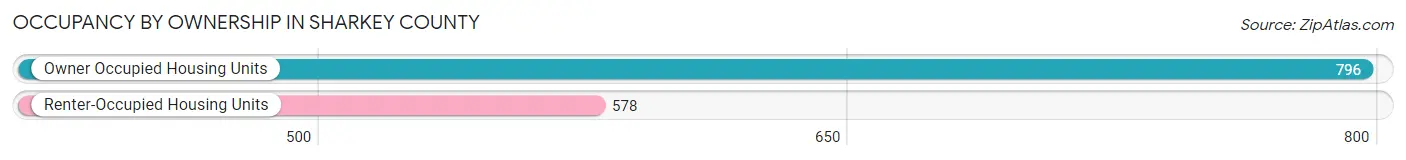
| Occupancy | # Housing Units | % Housing Units |
| Owner Occupied Housing Units | 796 | 57.9% |
| Renter-Occupied Housing Units | 578 | 42.1% |
| Total Occupied Housing Units | 1,374 | 100.0% |
Occupancy by Household Size in Sharkey County
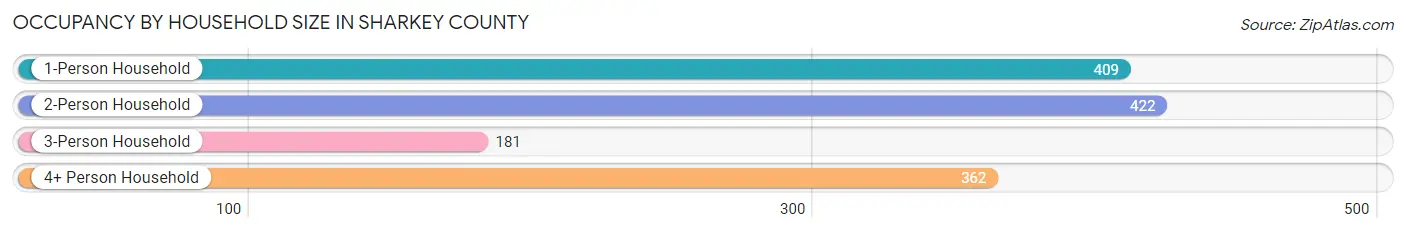
| Household Size | # Housing Units | % Housing Units |
| 1-Person Household | 409 | 29.8% |
| 2-Person Household | 422 | 30.7% |
| 3-Person Household | 181 | 13.2% |
| 4+ Person Household | 362 | 26.4% |
| Total Housing Units | 1,374 | 100.0% |
Occupancy by Ownership by Household Size in Sharkey County
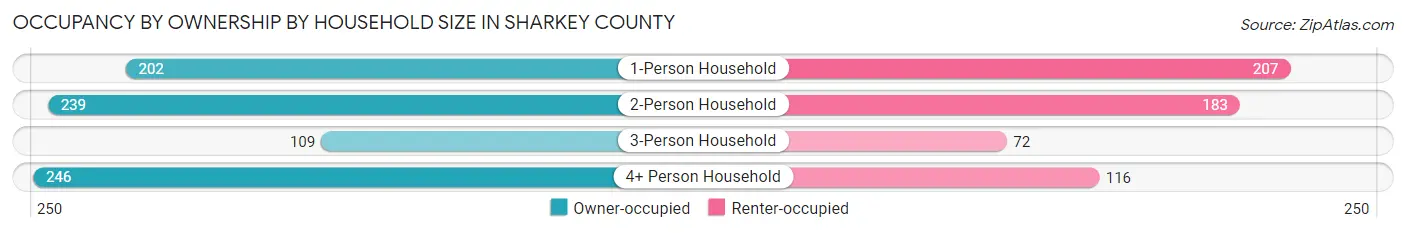
| Household Size | Owner-occupied | Renter-occupied |
| 1-Person Household | 202 (49.4%) | 207 (50.6%) |
| 2-Person Household | 239 (56.6%) | 183 (43.4%) |
| 3-Person Household | 109 (60.2%) | 72 (39.8%) |
| 4+ Person Household | 246 (68.0%) | 116 (32.0%) |
| Total Housing Units | 796 (57.9%) | 578 (42.1%) |
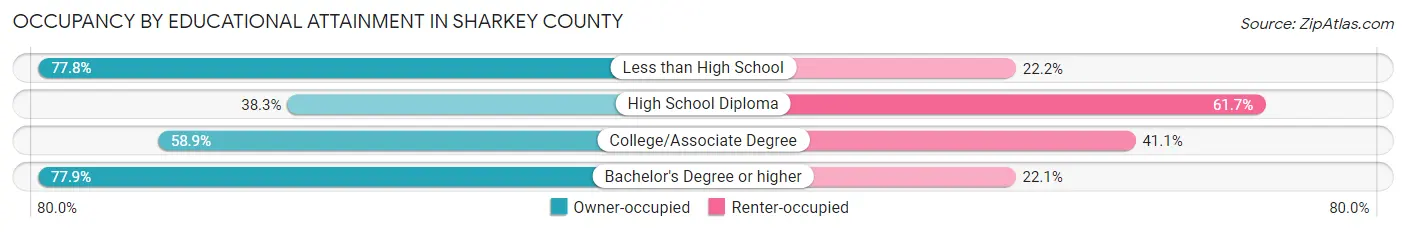
Occupancy by Educational Attainment in Sharkey County
| Household Size | Owner-occupied | Renter-occupied |
| Less than High School | 151 (77.8%) | 43 (22.2%) |
| High School Diploma | 197 (38.3%) | 317 (61.7%) |
| College/Associate Degree | 219 (58.9%) | 153 (41.1%) |
| Bachelor's Degree or higher | 229 (77.9%) | 65 (22.1%) |
Occupancy by Age of Householder in Sharkey County
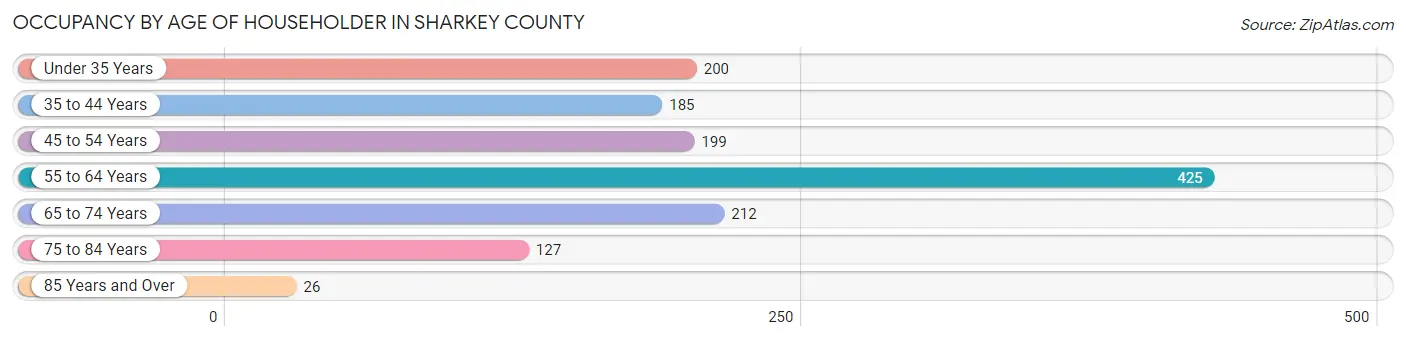
| Age Bracket | # Households | % Households |
| Under 35 Years | 200 | 14.6% |
| 35 to 44 Years | 185 | 13.5% |
| 45 to 54 Years | 199 | 14.5% |
| 55 to 64 Years | 425 | 30.9% |
| 65 to 74 Years | 212 | 15.4% |
| 75 to 84 Years | 127 | 9.2% |
| 85 Years and Over | 26 | 1.9% |
| Total | 1,374 | 100.0% |
Housing Finances in Sharkey County
Median Income by Occupancy in Sharkey County
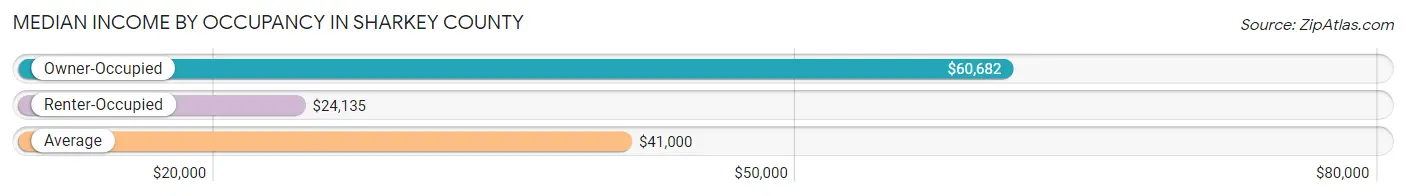
| Occupancy Type | # Households | Median Income |
| Owner-Occupied | 796 (57.9%) | $60,682 |
| Renter-Occupied | 578 (42.1%) | $24,135 |
| Average | 1,374 (100.0%) | $41,000 |
Occupancy by Householder Income Bracket in Sharkey County
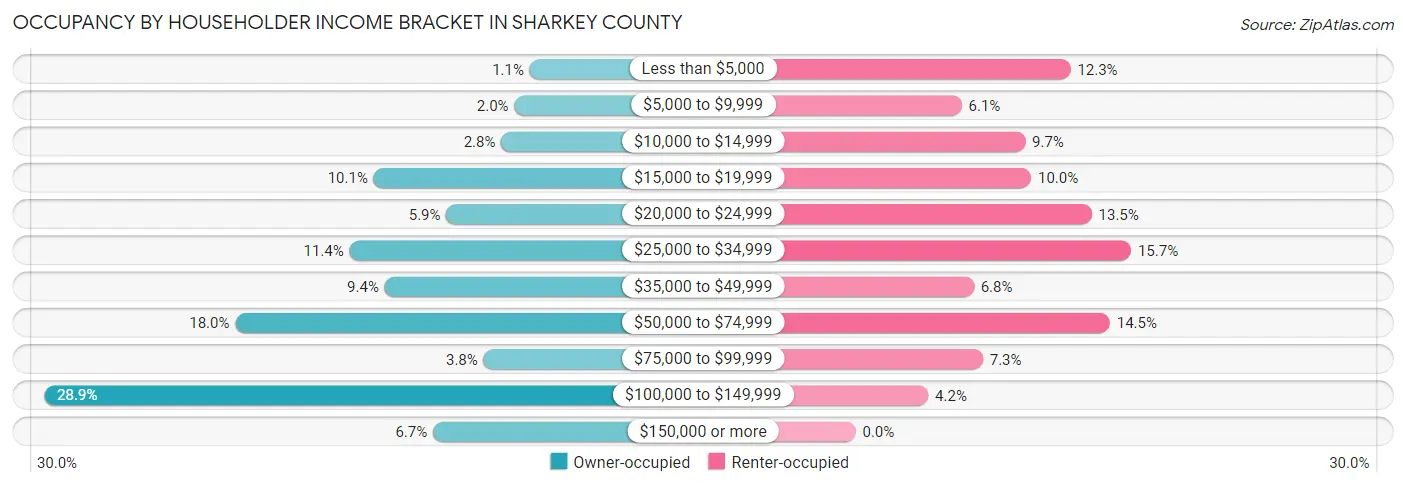
| Income Bracket | Owner-occupied | Renter-occupied |
| Less than $5,000 | 9 (1.1%) | 71 (12.3%) |
| $5,000 to $9,999 | 16 (2.0%) | 35 (6.1%) |
| $10,000 to $14,999 | 22 (2.8%) | 56 (9.7%) |
| $15,000 to $19,999 | 80 (10.1%) | 58 (10.0%) |
| $20,000 to $24,999 | 47 (5.9%) | 78 (13.5%) |
| $25,000 to $34,999 | 91 (11.4%) | 91 (15.7%) |
| $35,000 to $49,999 | 75 (9.4%) | 39 (6.8%) |
| $50,000 to $74,999 | 143 (18.0%) | 84 (14.5%) |
| $75,000 to $99,999 | 30 (3.8%) | 42 (7.3%) |
| $100,000 to $149,999 | 230 (28.9%) | 24 (4.2%) |
| $150,000 or more | 53 (6.7%) | 0 (0.0%) |
| Total | 796 (100.0%) | 578 (100.0%) |
Monthly Housing Cost Tiers in Sharkey County
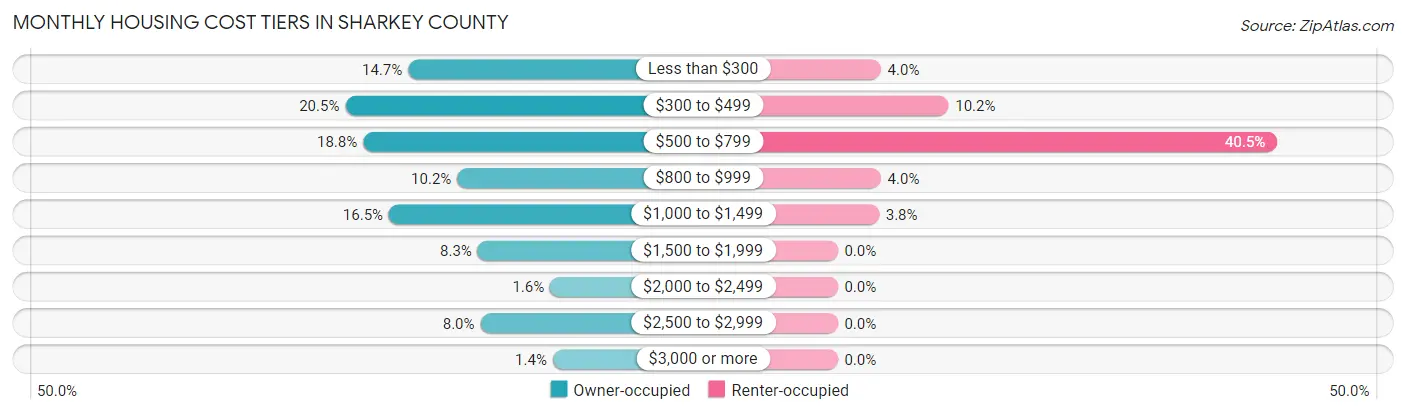
| Monthly Cost | Owner-occupied | Renter-occupied |
| Less than $300 | 117 (14.7%) | 23 (4.0%) |
| $300 to $499 | 163 (20.5%) | 59 (10.2%) |
| $500 to $799 | 150 (18.8%) | 234 (40.5%) |
| $800 to $999 | 81 (10.2%) | 23 (4.0%) |
| $1,000 to $1,499 | 131 (16.5%) | 22 (3.8%) |
| $1,500 to $1,999 | 66 (8.3%) | 0 (0.0%) |
| $2,000 to $2,499 | 13 (1.6%) | 0 (0.0%) |
| $2,500 to $2,999 | 64 (8.0%) | 0 (0.0%) |
| $3,000 or more | 11 (1.4%) | 0 (0.0%) |
| Total | 796 (100.0%) | 578 (100.0%) |
Physical Housing Characteristics in Sharkey County
Housing Structures in Sharkey County
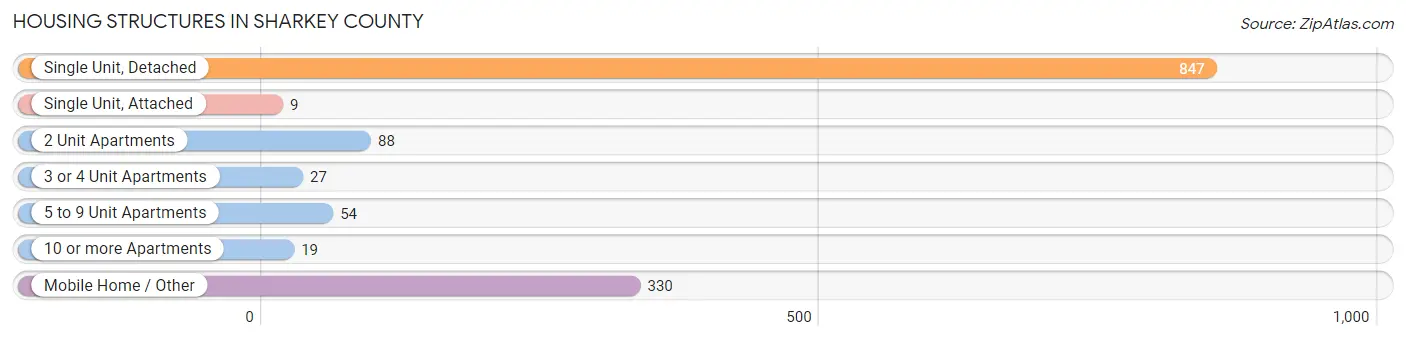
| Structure Type | # Housing Units | % Housing Units |
| Single Unit, Detached | 847 | 61.6% |
| Single Unit, Attached | 9 | 0.7% |
| 2 Unit Apartments | 88 | 6.4% |
| 3 or 4 Unit Apartments | 27 | 2.0% |
| 5 to 9 Unit Apartments | 54 | 3.9% |
| 10 or more Apartments | 19 | 1.4% |
| Mobile Home / Other | 330 | 24.0% |
| Total | 1,374 | 100.0% |
Housing Structures by Occupancy in Sharkey County
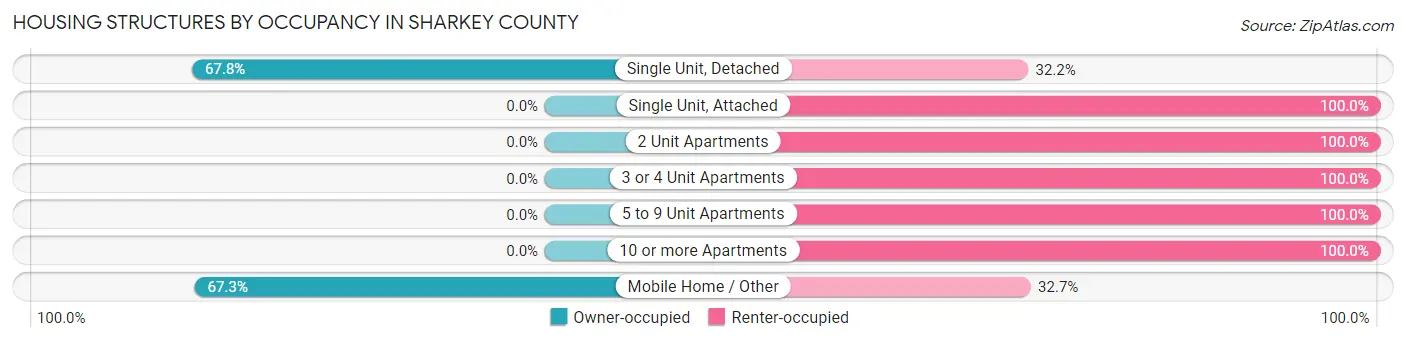
| Structure Type | Owner-occupied | Renter-occupied |
| Single Unit, Detached | 574 (67.8%) | 273 (32.2%) |
| Single Unit, Attached | 0 (0.0%) | 9 (100.0%) |
| 2 Unit Apartments | 0 (0.0%) | 88 (100.0%) |
| 3 or 4 Unit Apartments | 0 (0.0%) | 27 (100.0%) |
| 5 to 9 Unit Apartments | 0 (0.0%) | 54 (100.0%) |
| 10 or more Apartments | 0 (0.0%) | 19 (100.0%) |
| Mobile Home / Other | 222 (67.3%) | 108 (32.7%) |
| Total | 796 (57.9%) | 578 (42.1%) |
Housing Structures by Number of Rooms in Sharkey County
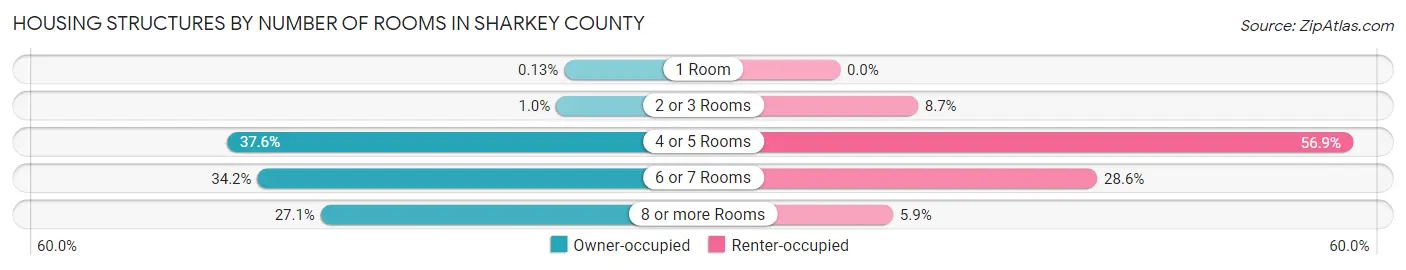
| Number of Rooms | Owner-occupied | Renter-occupied |
| 1 Room | 1 (0.1%) | 0 (0.0%) |
| 2 or 3 Rooms | 8 (1.0%) | 50 (8.6%) |
| 4 or 5 Rooms | 299 (37.6%) | 329 (56.9%) |
| 6 or 7 Rooms | 272 (34.2%) | 165 (28.5%) |
| 8 or more Rooms | 216 (27.1%) | 34 (5.9%) |
| Total | 796 (100.0%) | 578 (100.0%) |
Housing Structure by Heating Type in Sharkey County
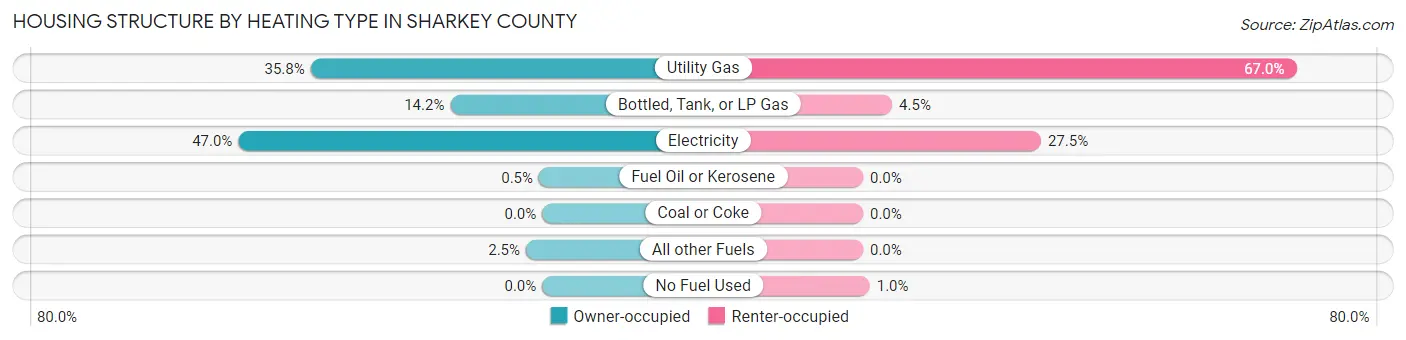
| Heating Type | Owner-occupied | Renter-occupied |
| Utility Gas | 285 (35.8%) | 387 (67.0%) |
| Bottled, Tank, or LP Gas | 113 (14.2%) | 26 (4.5%) |
| Electricity | 374 (47.0%) | 159 (27.5%) |
| Fuel Oil or Kerosene | 4 (0.5%) | 0 (0.0%) |
| Coal or Coke | 0 (0.0%) | 0 (0.0%) |
| All other Fuels | 20 (2.5%) | 0 (0.0%) |
| No Fuel Used | 0 (0.0%) | 6 (1.0%) |
| Total | 796 (100.0%) | 578 (100.0%) |
Household Vehicle Usage in Sharkey County
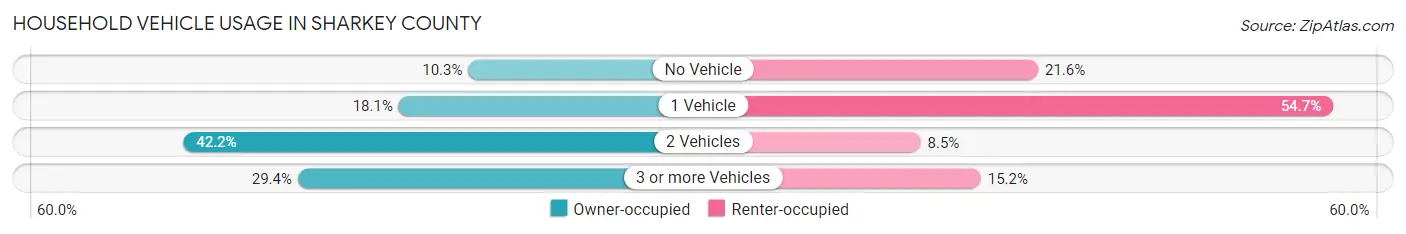
| Vehicles per Household | Owner-occupied | Renter-occupied |
| No Vehicle | 82 (10.3%) | 125 (21.6%) |
| 1 Vehicle | 144 (18.1%) | 316 (54.7%) |
| 2 Vehicles | 336 (42.2%) | 49 (8.5%) |
| 3 or more Vehicles | 234 (29.4%) | 88 (15.2%) |
| Total | 796 (100.0%) | 578 (100.0%) |
Real Estate & Mortgages in Sharkey County
Real Estate and Mortgage Overview in Sharkey County
| Characteristic | Without Mortgage | With Mortgage |
| Housing Units | 419 | 377 |
| Median Property Value | $65,800 | $122,100 |
| Median Household Income | $29,875 | $20 |
| Monthly Housing Costs | $380 | $2 |
| Real Estate Taxes | $652 | $66 |
Property Value by Mortgage Status in Sharkey County
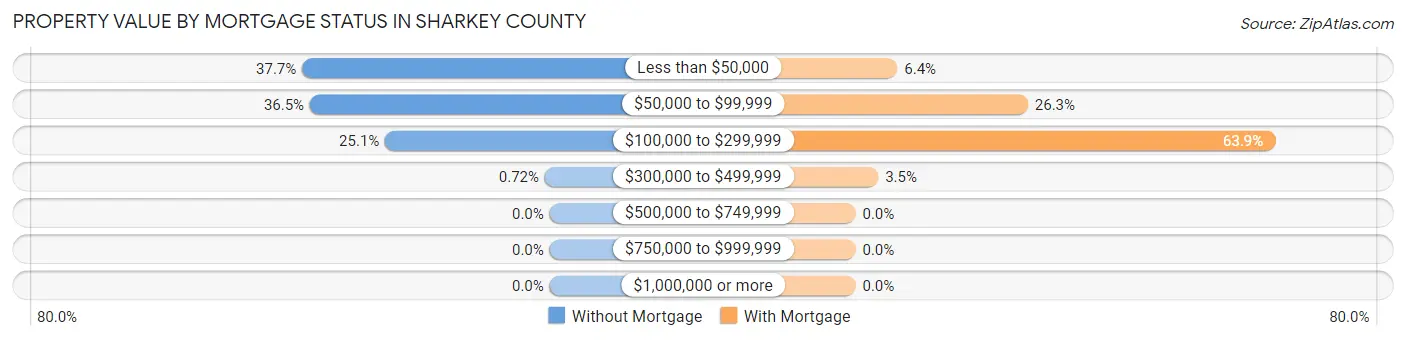
| Property Value | Without Mortgage | With Mortgage |
| Less than $50,000 | 158 (37.7%) | 24 (6.4%) |
| $50,000 to $99,999 | 153 (36.5%) | 99 (26.3%) |
| $100,000 to $299,999 | 105 (25.1%) | 241 (63.9%) |
| $300,000 to $499,999 | 3 (0.7%) | 13 (3.5%) |
| $500,000 to $749,999 | 0 (0.0%) | 0 (0.0%) |
| $750,000 to $999,999 | 0 (0.0%) | 0 (0.0%) |
| $1,000,000 or more | 0 (0.0%) | 0 (0.0%) |
| Total | 419 (100.0%) | 377 (100.0%) |
Household Income by Mortgage Status in Sharkey County
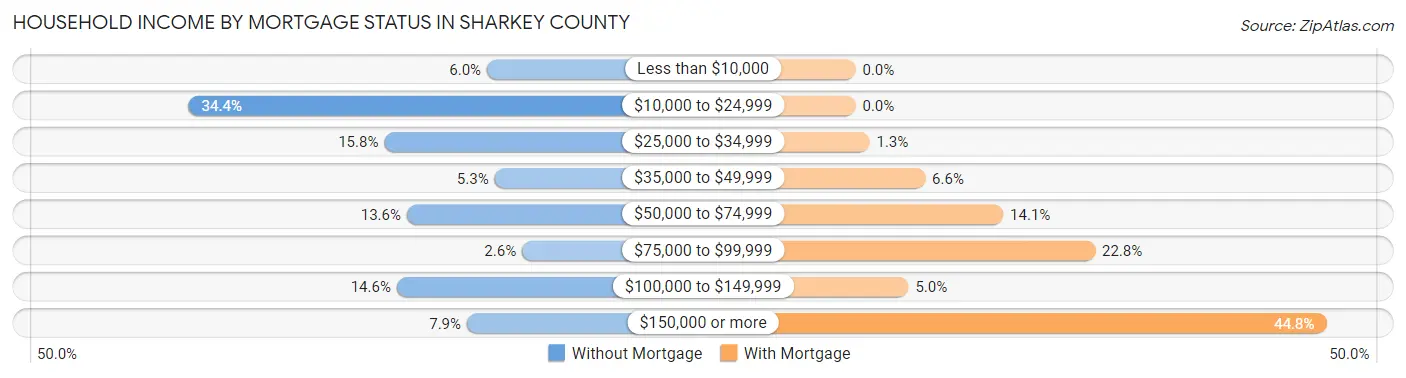
| Household Income | Without Mortgage | With Mortgage |
| Less than $10,000 | 25 (6.0%) | 0 (0.0%) |
| $10,000 to $24,999 | 144 (34.4%) | 0 (0.0%) |
| $25,000 to $34,999 | 66 (15.8%) | 5 (1.3%) |
| $35,000 to $49,999 | 22 (5.2%) | 25 (6.6%) |
| $50,000 to $74,999 | 57 (13.6%) | 53 (14.1%) |
| $75,000 to $99,999 | 11 (2.6%) | 86 (22.8%) |
| $100,000 to $149,999 | 61 (14.6%) | 19 (5.0%) |
| $150,000 or more | 33 (7.9%) | 169 (44.8%) |
| Total | 419 (100.0%) | 377 (100.0%) |
Property Value to Household Income Ratio in Sharkey County
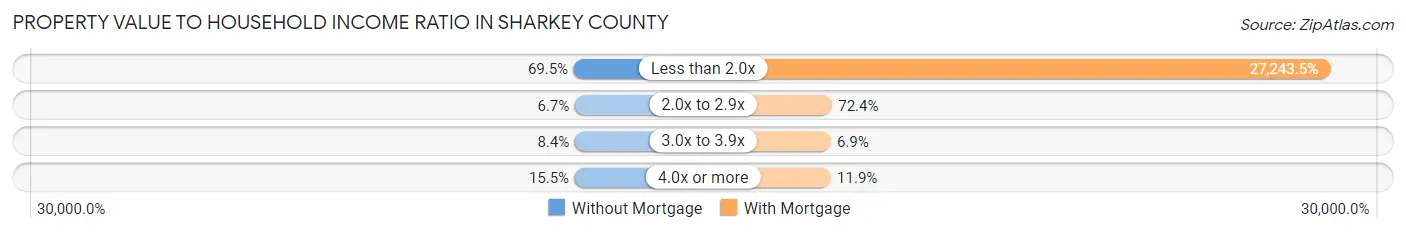
| Value-to-Income Ratio | Without Mortgage | With Mortgage |
| Less than 2.0x | 291 (69.5%) | 102,708 (27,243.5%) |
| 2.0x to 2.9x | 28 (6.7%) | 273 (72.4%) |
| 3.0x to 3.9x | 35 (8.4%) | 26 (6.9%) |
| 4.0x or more | 65 (15.5%) | 45 (11.9%) |
| Total | 419 (100.0%) | 377 (100.0%) |
Real Estate Taxes by Mortgage Status in Sharkey County
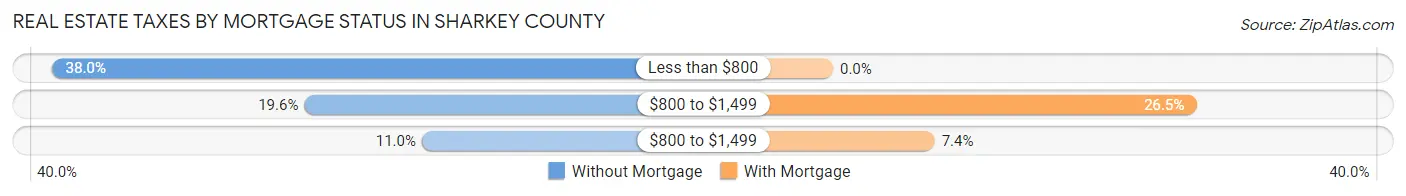
| Property Taxes | Without Mortgage | With Mortgage |
| Less than $800 | 159 (38.0%) | 0 (0.0%) |
| $800 to $1,499 | 82 (19.6%) | 100 (26.5%) |
| $800 to $1,499 | 46 (11.0%) | 28 (7.4%) |
| Total | 419 (100.0%) | 377 (100.0%) |
Health & Disability in Sharkey County
Health Insurance Coverage by Age in Sharkey County
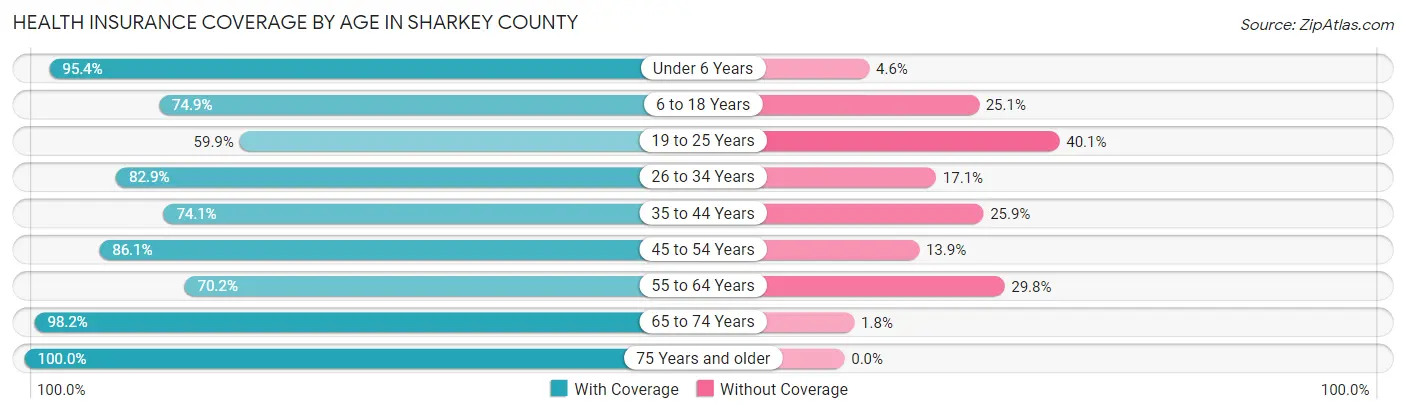
| Age Bracket | With Coverage | Without Coverage |
| Under 6 Years | 310 (95.4%) | 15 (4.6%) |
| 6 to 18 Years | 526 (74.9%) | 176 (25.1%) |
| 19 to 25 Years | 257 (59.9%) | 172 (40.1%) |
| 26 to 34 Years | 301 (82.9%) | 62 (17.1%) |
| 35 to 44 Years | 289 (74.1%) | 101 (25.9%) |
| 45 to 54 Years | 278 (86.1%) | 45 (13.9%) |
| 55 to 64 Years | 461 (70.2%) | 196 (29.8%) |
| 65 to 74 Years | 374 (98.2%) | 7 (1.8%) |
| 75 Years and older | 239 (100.0%) | 0 (0.0%) |
| Total | 3,035 (79.7%) | 774 (20.3%) |
Health Insurance Coverage by Citizenship Status in Sharkey County
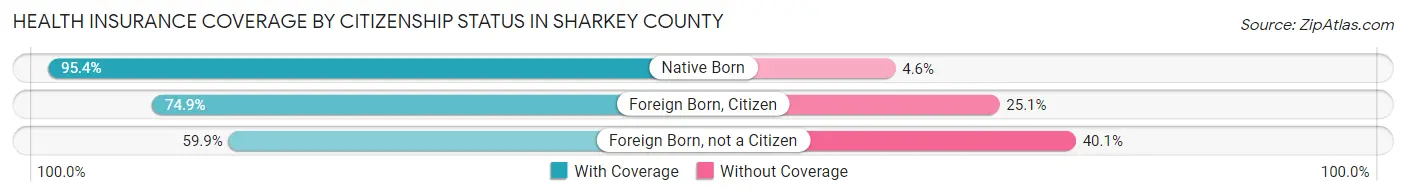
| Citizenship Status | With Coverage | Without Coverage |
| Native Born | 310 (95.4%) | 15 (4.6%) |
| Foreign Born, Citizen | 526 (74.9%) | 176 (25.1%) |
| Foreign Born, not a Citizen | 257 (59.9%) | 172 (40.1%) |
Health Insurance Coverage by Household Income in Sharkey County
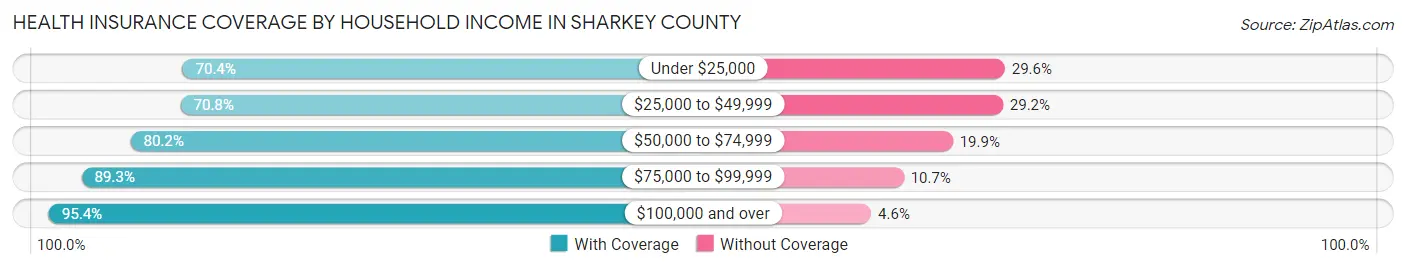
| Household Income | With Coverage | Without Coverage |
| Under $25,000 | 749 (70.4%) | 315 (29.6%) |
| $25,000 to $49,999 | 559 (70.8%) | 231 (29.2%) |
| $50,000 to $74,999 | 658 (80.1%) | 163 (19.9%) |
| $75,000 to $99,999 | 218 (89.3%) | 26 (10.7%) |
| $100,000 and over | 817 (95.4%) | 39 (4.6%) |
Public vs Private Health Insurance Coverage by Age in Sharkey County
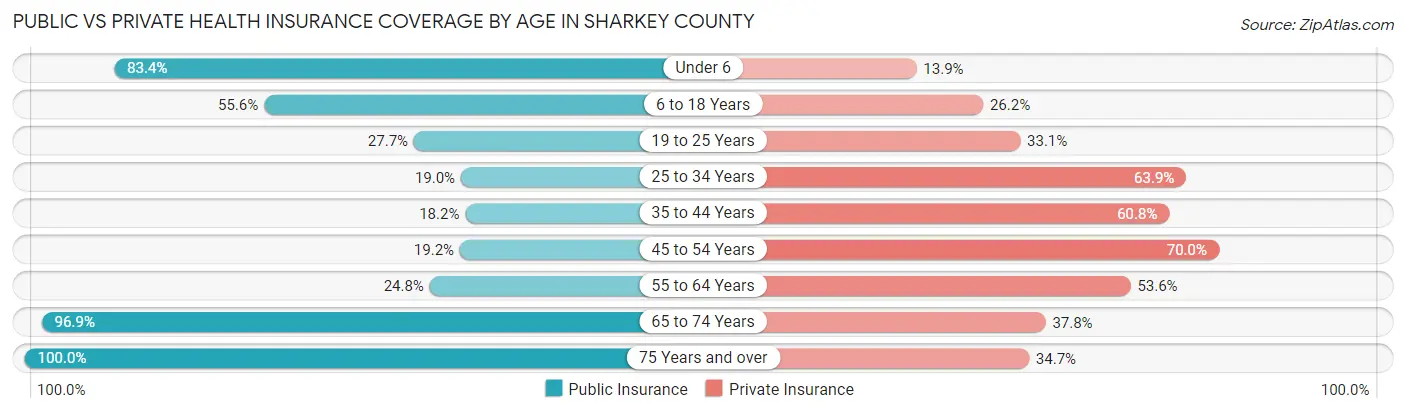
| Age Bracket | Public Insurance | Private Insurance |
| Under 6 | 271 (83.4%) | 45 (13.9%) |
| 6 to 18 Years | 390 (55.6%) | 184 (26.2%) |
| 19 to 25 Years | 119 (27.7%) | 142 (33.1%) |
| 25 to 34 Years | 69 (19.0%) | 232 (63.9%) |
| 35 to 44 Years | 71 (18.2%) | 237 (60.8%) |
| 45 to 54 Years | 62 (19.2%) | 226 (70.0%) |
| 55 to 64 Years | 163 (24.8%) | 352 (53.6%) |
| 65 to 74 Years | 369 (96.9%) | 144 (37.8%) |
| 75 Years and over | 239 (100.0%) | 83 (34.7%) |
| Total | 1,753 (46.0%) | 1,645 (43.2%) |
Disability Status by Sex by Age in Sharkey County
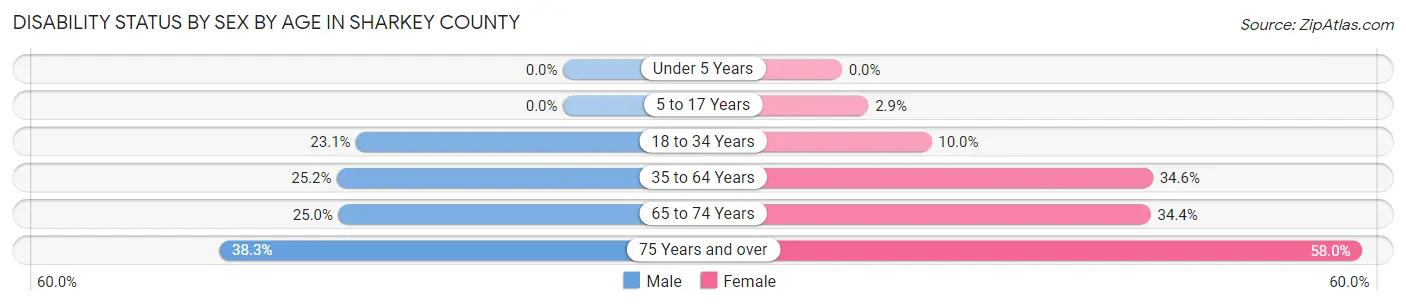
| Age Bracket | Male | Female |
| Under 5 Years | 0 (0.0%) | 0 (0.0%) |
| 5 to 17 Years | 0 (0.0%) | 9 (2.9%) |
| 18 to 34 Years | 130 (23.1%) | 33 (10.0%) |
| 35 to 64 Years | 145 (25.2%) | 275 (34.6%) |
| 65 to 74 Years | 40 (25.0%) | 76 (34.4%) |
| 75 Years and over | 46 (38.3%) | 69 (58.0%) |
Disability Class by Sex by Age in Sharkey County
Disability Class: Hearing Difficulty
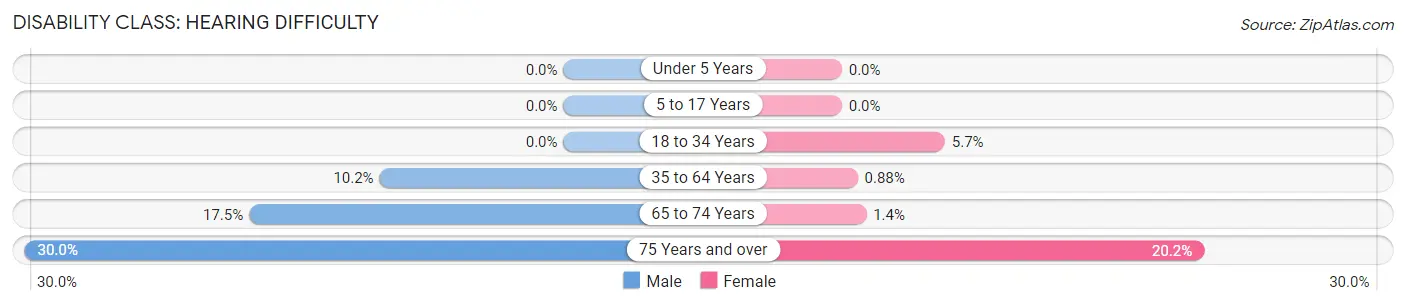
| Age Bracket | Male | Female |
| Under 5 Years | 0 (0.0%) | 0 (0.0%) |
| 5 to 17 Years | 0 (0.0%) | 0 (0.0%) |
| 18 to 34 Years | 0 (0.0%) | 19 (5.7%) |
| 35 to 64 Years | 59 (10.2%) | 7 (0.9%) |
| 65 to 74 Years | 28 (17.5%) | 3 (1.4%) |
| 75 Years and over | 36 (30.0%) | 24 (20.2%) |
Disability Class: Vision Difficulty
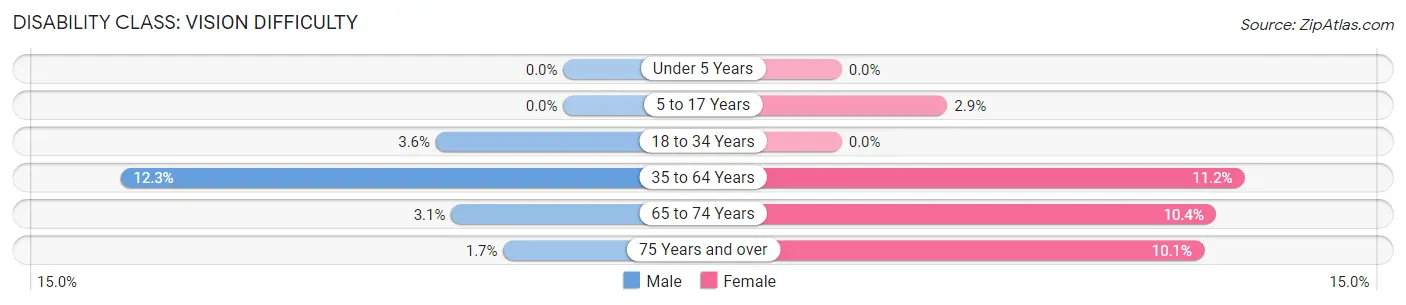
| Age Bracket | Male | Female |
| Under 5 Years | 0 (0.0%) | 0 (0.0%) |
| 5 to 17 Years | 0 (0.0%) | 9 (2.9%) |
| 18 to 34 Years | 20 (3.5%) | 0 (0.0%) |
| 35 to 64 Years | 71 (12.3%) | 89 (11.2%) |
| 65 to 74 Years | 5 (3.1%) | 23 (10.4%) |
| 75 Years and over | 2 (1.7%) | 12 (10.1%) |
Disability Class: Cognitive Difficulty
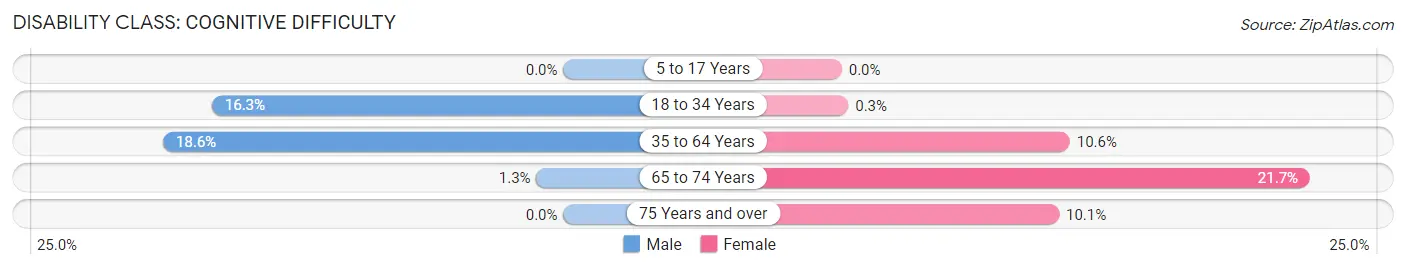
| Age Bracket | Male | Female |
| 5 to 17 Years | 0 (0.0%) | 0 (0.0%) |
| 18 to 34 Years | 92 (16.3%) | 1 (0.3%) |
| 35 to 64 Years | 107 (18.6%) | 84 (10.6%) |
| 65 to 74 Years | 2 (1.3%) | 48 (21.7%) |
| 75 Years and over | 0 (0.0%) | 12 (10.1%) |
Disability Class: Ambulatory Difficulty
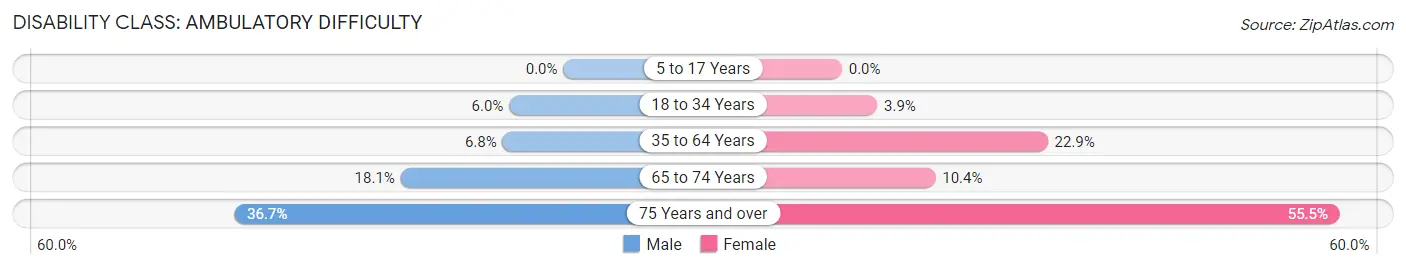
| Age Bracket | Male | Female |
| 5 to 17 Years | 0 (0.0%) | 0 (0.0%) |
| 18 to 34 Years | 34 (6.0%) | 13 (3.9%) |
| 35 to 64 Years | 39 (6.8%) | 182 (22.9%) |
| 65 to 74 Years | 29 (18.1%) | 23 (10.4%) |
| 75 Years and over | 44 (36.7%) | 66 (55.5%) |
Disability Class: Self-Care Difficulty
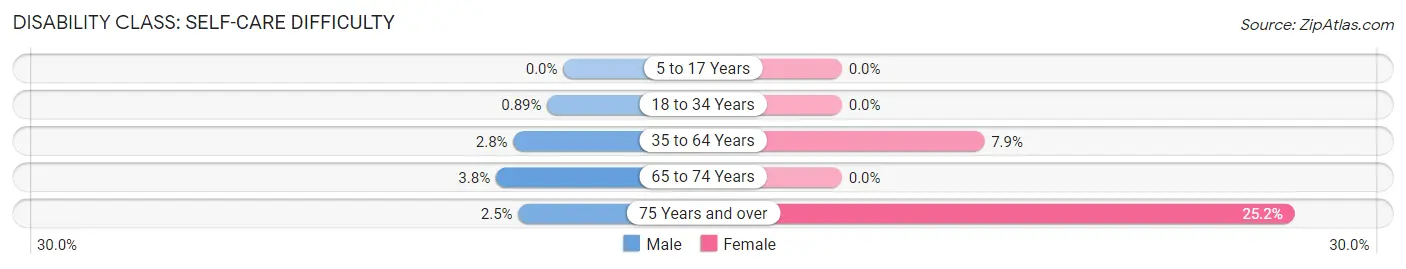
| Age Bracket | Male | Female |
| 5 to 17 Years | 0 (0.0%) | 0 (0.0%) |
| 18 to 34 Years | 5 (0.9%) | 0 (0.0%) |
| 35 to 64 Years | 16 (2.8%) | 63 (7.9%) |
| 65 to 74 Years | 6 (3.7%) | 0 (0.0%) |
| 75 Years and over | 3 (2.5%) | 30 (25.2%) |
Technology Access in Sharkey County
Computing Device Access in Sharkey County
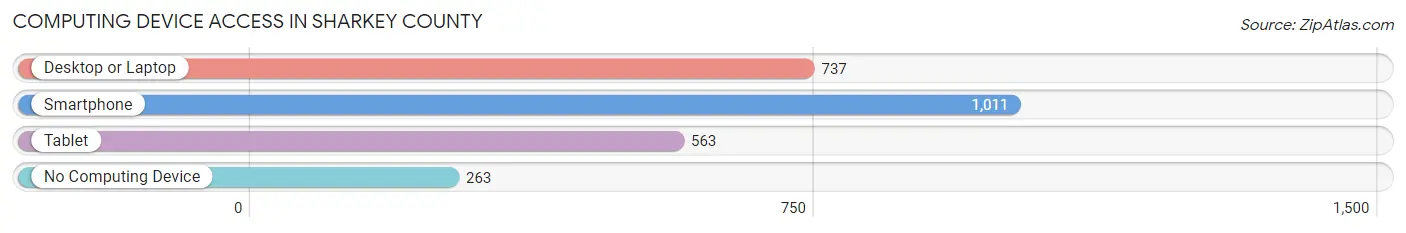
| Device Type | # Households | % Households |
| Desktop or Laptop | 737 | 53.6% |
| Smartphone | 1,011 | 73.6% |
| Tablet | 563 | 41.0% |
| No Computing Device | 263 | 19.1% |
| Total | 1,374 | 100.0% |
Internet Access in Sharkey County
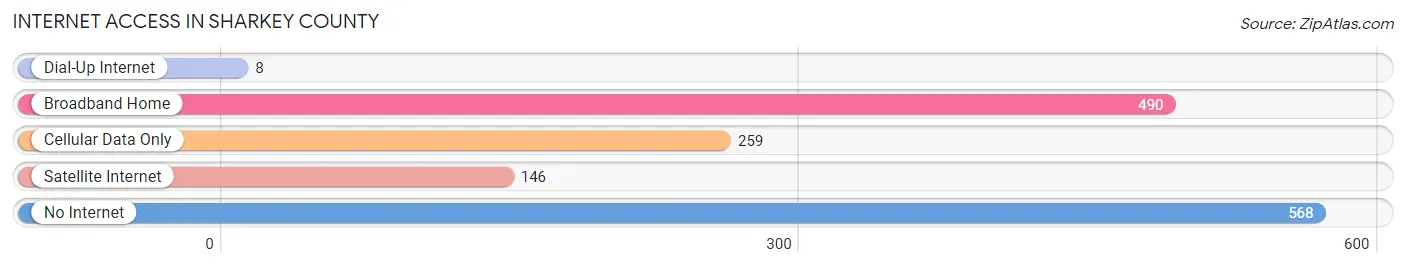
| Internet Type | # Households | % Households |
| Dial-Up Internet | 8 | 0.6% |
| Broadband Home | 490 | 35.7% |
| Cellular Data Only | 259 | 18.9% |
| Satellite Internet | 146 | 10.6% |
| No Internet | 568 | 41.3% |
| Total | 1,374 | 100.0% |
Sharkey County Summary
Sharkey County is located in the Mississippi Delta region of the state of Mississippi. It is bordered by Yazoo County to the north, Humphreys County to the east, Issaquena County to the south, and Washington County to the west. The county seat is Rolling Fork.
History
Sharkey County was established in 1876 from portions of Issaquena and Washington counties. It was named for William L. Sharkey, the first governor of Mississippi after the Civil War. The county was originally part of the Choctaw Nation, and the area was heavily populated by Native Americans until the 1830s.
The county was largely agricultural in the 19th century, with cotton being the main crop. The county was also home to several large plantations, which were worked by African-American slaves. After the Civil War, many of the former slaves stayed in the area and became sharecroppers.
Geography
Sharkey County is located in the Mississippi Delta region of the state. It is bordered by Yazoo County to the north, Humphreys County to the east, Issaquena County to the south, and Washington County to the west. The county has a total area of 545 square miles, of which 543 square miles is land and 2 square miles (0.4%) is water.
The county is mostly flat, with some rolling hills in the northern part of the county. The Yazoo River forms the northern border of the county, and the Sunflower River forms the eastern border. The county is part of the Yazoo-Mississippi Delta, and is mostly covered in farmland.
Economy
The economy of Sharkey County is largely based on agriculture. Cotton is the main crop, and the county is also known for its production of soybeans, corn, and rice. The county is also home to several timber companies, which harvest timber from the county's forests.
The county is also home to several manufacturing companies, including a furniture factory, a paper mill, and a canning factory. The county is also home to several small businesses, including restaurants, stores, and service providers.
Demographics
As of the 2010 census, Sharkey County had a population of 4,916. The racial makeup of the county was 79.2% African American, 19.2% White, 0.3% Native American, 0.2% Asian, 0.1% Pacific Islander, and 0.9% from two or more races. Hispanic or Latino of any race were 0.7% of the population.
The median income for a household in the county was $25,938, and the median income for a family was $31,964. The per capita income for the county was $13,945. About 28.2% of families and 33.2% of the population were below the poverty line, including 45.2% of those under age 18 and 25.2% of those age 65 or over.
Common Questions
What is Per Capita Income in Sharkey County?
Per Capita income in Sharkey County is $22,203.
What is the Median Family Income in Sharkey County?
Median Family Income in Sharkey County is $60,076.
What is the Median Household income in Sharkey County?
Median Household Income in Sharkey County is $41,000.
What is Income or Wage Gap in Sharkey County?
Income or Wage Gap in Sharkey County is 10.4%.
Women in Sharkey County earn 89.6 cents for every dollar earned by a man.
What is Inequality or Gini Index in Sharkey County?
Inequality or Gini Index in Sharkey County is 0.47.
What is the Total Population of Sharkey County?
Total Population of Sharkey County is 3,910.
What is the Total Male Population of Sharkey County?
Total Male Population of Sharkey County is 1,950.
What is the Total Female Population of Sharkey County?
Total Female Population of Sharkey County is 1,960.
What is the Ratio of Males per 100 Females in Sharkey County?
There are 99.49 Males per 100 Females in Sharkey County.
What is the Ratio of Females per 100 Males in Sharkey County?
There are 100.51 Females per 100 Males in Sharkey County.
What is the Median Population Age in Sharkey County?
Median Population Age in Sharkey County is 37.0 Years.
What is the Average Family Size in Sharkey County
Average Family Size in Sharkey County is 3.5 People.
What is the Average Household Size in Sharkey County
Average Household Size in Sharkey County is 2.8 People.
How Large is the Labor Force in Sharkey County?
There are 1,746 People in the Labor Forcein in Sharkey County.
What is the Percentage of People in the Labor Force in Sharkey County?
56.1% of People are in the Labor Force in Sharkey County.
What is the Unemployment Rate in Sharkey County?
Unemployment Rate in Sharkey County is 12.8%.