Prentiss County, MS Map & Demographics
Prentiss County Map
Prentiss County Overview
$27,979
PER CAPITA INCOME
$66,901
AVG FAMILY INCOME
$51,578
AVG HOUSEHOLD INCOME
16.1%
WAGE / INCOME GAP [ % ]
83.9¢/ $1
WAGE / INCOME GAP [ $ ]
0.48
INEQUALITY / GINI INDEX
24,945
TOTAL POPULATION
12,270
MALE POPULATION
12,675
FEMALE POPULATION
96.80
MALES / 100 FEMALES
103.30
FEMALES / 100 MALES
38.0
MEDIAN AGE
3.1
AVG FAMILY SIZE
2.5
AVG HOUSEHOLD SIZE
11,027
LABOR FORCE [ PEOPLE ]
54.9%
PERCENT IN LABOR FORCE
5.0%
UNEMPLOYMENT RATE
Prentiss County Area Codes
Income in Prentiss County
Income Overview in Prentiss County
Per Capita Income in Prentiss County is $27,979, while median incomes of families and households are $66,901 and $51,578 respectively.
| Characteristic | Number | Measure |
| Per Capita Income | 24,945 | $27,979 |
| Median Family Income | 6,366 | $66,901 |
| Mean Family Income | 6,366 | $86,855 |
| Median Household Income | 9,296 | $51,578 |
| Mean Household Income | 9,296 | $71,102 |
| Income Deficit | 6,366 | $0 |
| Wage / Income Gap (%) | 24,945 | 16.09% |
| Wage / Income Gap ($) | 24,945 | 83.91¢ per $1 |
| Gini / Inequality Index | 24,945 | 0.48 |
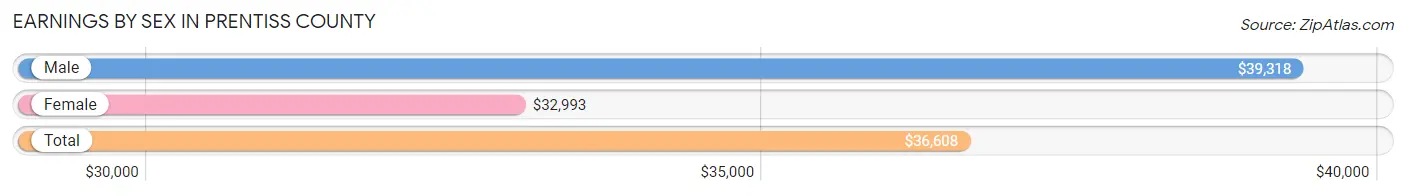
Earnings by Sex in Prentiss County
Average Earnings in Prentiss County are $36,608, $39,318 for men and $32,993 for women, a difference of 16.1%.
| Sex | Number | Average Earnings |
| Male | 6,119 (53.6%) | $39,318 |
| Female | 5,305 (46.4%) | $32,993 |
| Total | 11,424 (100.0%) | $36,608 |
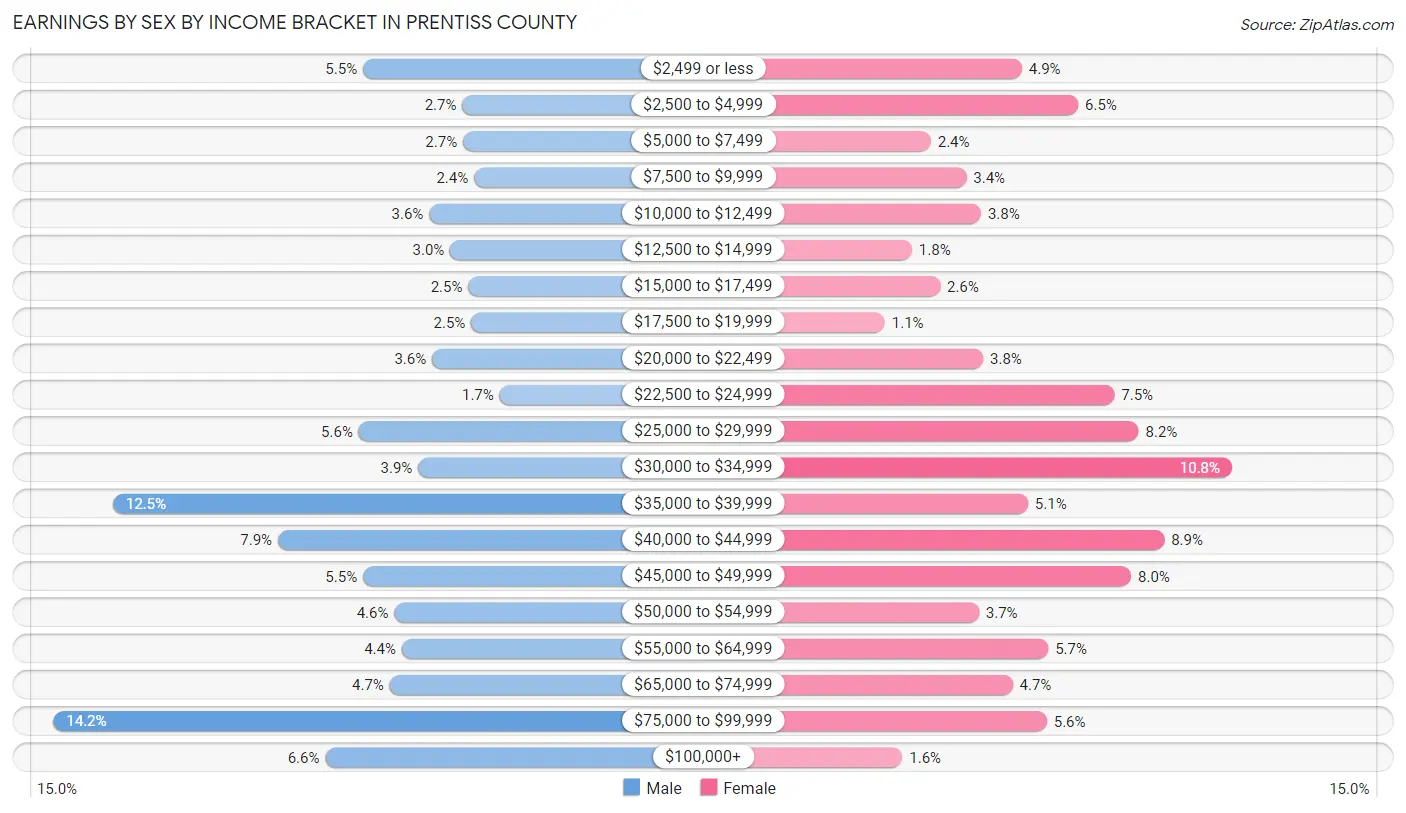
Earnings by Sex by Income Bracket in Prentiss County
The most common earnings brackets in Prentiss County are $75,000 to $99,999 for men (868 | 14.2%) and $30,000 to $34,999 for women (574 | 10.8%).
| Income | Male | Female |
| $2,499 or less | 336 (5.5%) | 261 (4.9%) |
| $2,500 to $4,999 | 165 (2.7%) | 345 (6.5%) |
| $5,000 to $7,499 | 164 (2.7%) | 125 (2.4%) |
| $7,500 to $9,999 | 145 (2.4%) | 178 (3.4%) |
| $10,000 to $12,499 | 222 (3.6%) | 200 (3.8%) |
| $12,500 to $14,999 | 186 (3.0%) | 97 (1.8%) |
| $15,000 to $17,499 | 155 (2.5%) | 139 (2.6%) |
| $17,500 to $19,999 | 150 (2.5%) | 57 (1.1%) |
| $20,000 to $22,499 | 217 (3.5%) | 203 (3.8%) |
| $22,500 to $24,999 | 101 (1.7%) | 399 (7.5%) |
| $25,000 to $29,999 | 343 (5.6%) | 435 (8.2%) |
| $30,000 to $34,999 | 241 (3.9%) | 574 (10.8%) |
| $35,000 to $39,999 | 766 (12.5%) | 270 (5.1%) |
| $40,000 to $44,999 | 482 (7.9%) | 473 (8.9%) |
| $45,000 to $49,999 | 336 (5.5%) | 424 (8.0%) |
| $50,000 to $54,999 | 282 (4.6%) | 197 (3.7%) |
| $55,000 to $64,999 | 269 (4.4%) | 300 (5.7%) |
| $65,000 to $74,999 | 290 (4.7%) | 247 (4.7%) |
| $75,000 to $99,999 | 868 (14.2%) | 298 (5.6%) |
| $100,000+ | 401 (6.6%) | 83 (1.6%) |
| Total | 6,119 (100.0%) | 5,305 (100.0%) |
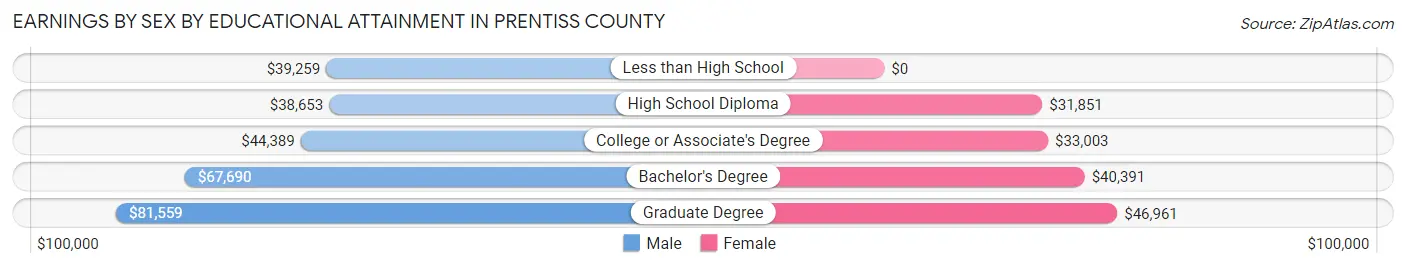
Earnings by Sex by Educational Attainment in Prentiss County
Average earnings in Prentiss County are $42,804 for men and $34,670 for women, a difference of 19.0%. Men with an educational attainment of graduate degree enjoy the highest average annual earnings of $81,559, while those with high school diploma education earn the least with $38,653. Women with an educational attainment of graduate degree earn the most with the average annual earnings of $46,961, while those with high school diploma education have the smallest earnings of $31,851.
| Educational Attainment | Male Income | Female Income |
| Less than High School | $39,259 | $0 |
| High School Diploma | $38,653 | $31,851 |
| College or Associate's Degree | $44,389 | $33,003 |
| Bachelor's Degree | $67,690 | $40,391 |
| Graduate Degree | $81,559 | $46,961 |
| Total | $42,804 | $34,670 |
Family Income in Prentiss County
Family Income Brackets in Prentiss County
According to the Prentiss County family income data, there are 1,178 families falling into the $100,000 to $149,999 income range, which is the most common income bracket and makes up 18.5% of all families. Conversely, the $10,000 to $14,999 income bracket is the least frequent group with only 146 families (2.3%) belonging to this category.
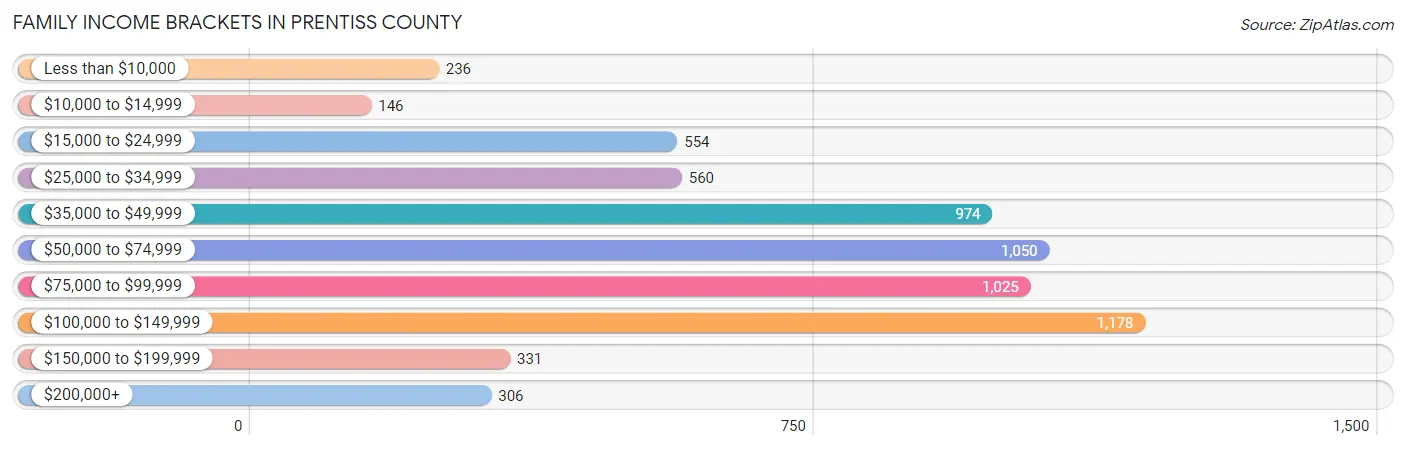
| Income Bracket | # Families | % Families |
| Less than $10,000 | 236 | 3.7% |
| $10,000 to $14,999 | 146 | 2.3% |
| $15,000 to $24,999 | 554 | 8.7% |
| $25,000 to $34,999 | 560 | 8.8% |
| $35,000 to $49,999 | 974 | 15.3% |
| $50,000 to $74,999 | 1,050 | 16.5% |
| $75,000 to $99,999 | 1,025 | 16.1% |
| $100,000 to $149,999 | 1,178 | 18.5% |
| $150,000 to $199,999 | 331 | 5.2% |
| $200,000+ | 306 | 4.8% |
Family Income by Famaliy Size in Prentiss County
7+ person families (72 | 1.1%) account for the highest median family income in Prentiss County with $99,444 per family, while 2-person families (3,037 | 47.7%) have the highest median income of $27,134 per family member.
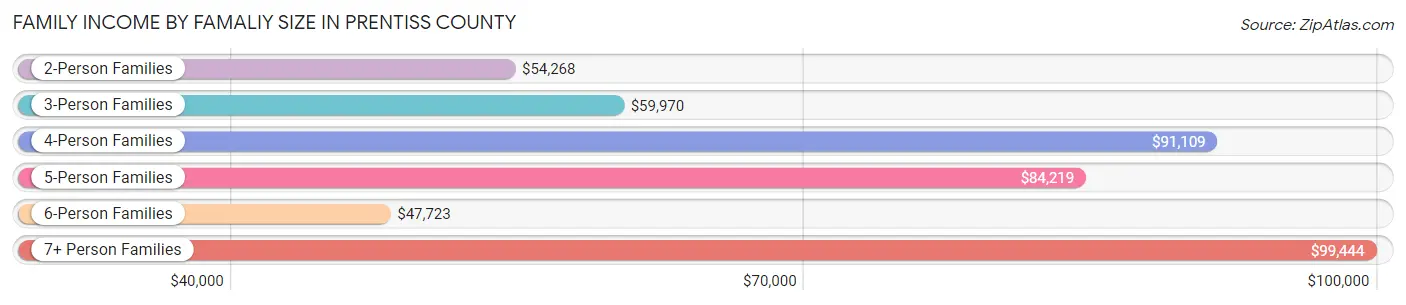
| Income Bracket | # Families | Median Income |
| 2-Person Families | 3,037 (47.7%) | $54,268 |
| 3-Person Families | 1,489 (23.4%) | $59,970 |
| 4-Person Families | 1,185 (18.6%) | $91,109 |
| 5-Person Families | 514 (8.1%) | $84,219 |
| 6-Person Families | 69 (1.1%) | $47,723 |
| 7+ Person Families | 72 (1.1%) | $99,444 |
| Total | 6,366 (100.0%) | $66,901 |
Family Income by Number of Earners in Prentiss County
The median family income in Prentiss County is $66,901, with families comprising 3+ earners (517) having the highest median family income of $100,139, while families with no earners (1,219) have the lowest median family income of $27,829, accounting for 8.1% and 19.2% of families, respectively.
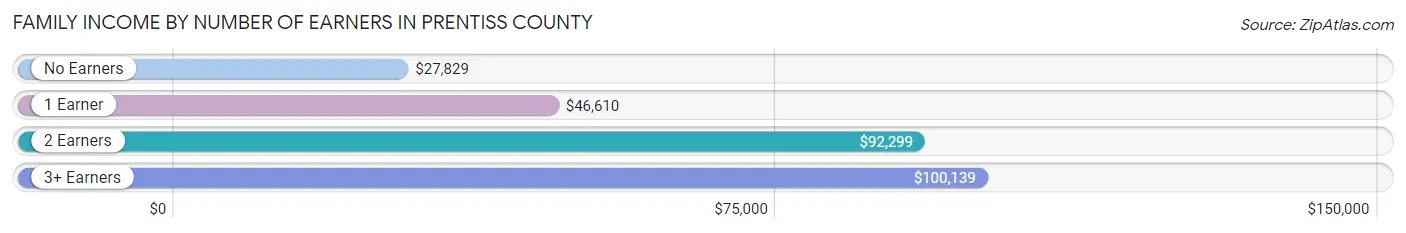
| Number of Earners | # Families | Median Income |
| No Earners | 1,219 (19.2%) | $27,829 |
| 1 Earner | 2,164 (34.0%) | $46,610 |
| 2 Earners | 2,466 (38.7%) | $92,299 |
| 3+ Earners | 517 (8.1%) | $100,139 |
| Total | 6,366 (100.0%) | $66,901 |
Household Income in Prentiss County
Household Income Brackets in Prentiss County
With 1,525 households falling in the category, the $50,000 to $74,999 income range is the most frequent in Prentiss County, accounting for 16.4% of all households. In contrast, only 316 households (3.4%) fall into the $200,000+ income bracket, making it the least populous group.
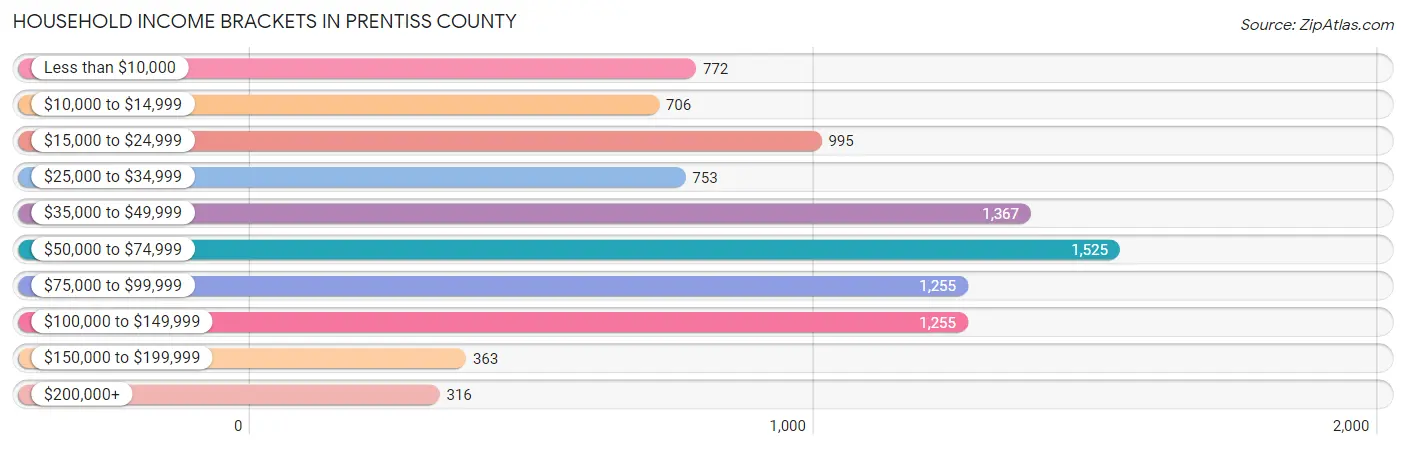
| Income Bracket | # Households | % Households |
| Less than $10,000 | 772 | 8.3% |
| $10,000 to $14,999 | 706 | 7.6% |
| $15,000 to $24,999 | 995 | 10.7% |
| $25,000 to $34,999 | 753 | 8.1% |
| $35,000 to $49,999 | 1,367 | 14.7% |
| $50,000 to $74,999 | 1,525 | 16.4% |
| $75,000 to $99,999 | 1,255 | 13.5% |
| $100,000 to $149,999 | 1,255 | 13.5% |
| $150,000 to $199,999 | 363 | 3.9% |
| $200,000+ | 316 | 3.4% |
Household Income by Householder Age in Prentiss County
The median household income in Prentiss County is $51,578, with the highest median household income of $66,096 found in the 25 to 44 years age bracket for the primary householder. A total of 2,674 households (28.8%) fall into this category. Meanwhile, the 15 to 24 years age bracket for the primary householder has the lowest median household income of $0, with 274 households (2.9%) in this group.
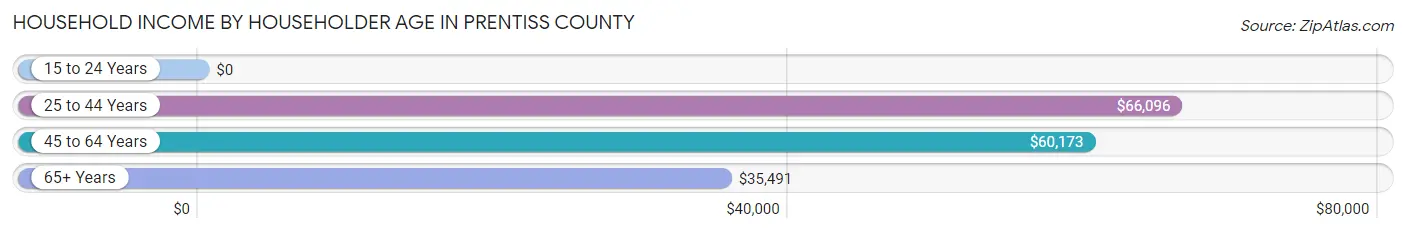
| Income Bracket | # Households | Median Income |
| 15 to 24 Years | 274 (2.9%) | $0 |
| 25 to 44 Years | 2,674 (28.8%) | $66,096 |
| 45 to 64 Years | 3,447 (37.1%) | $60,173 |
| 65+ Years | 2,901 (31.2%) | $35,491 |
| Total | 9,296 (100.0%) | $51,578 |
Poverty in Prentiss County
Income Below Poverty by Sex and Age in Prentiss County
With 13.0% poverty level for males and 19.5% for females among the residents of Prentiss County, 5 year old males and 75 year old and over females are the most vulnerable to poverty, with 116 males (25.7%) and 418 females (38.3%) in their respective age groups living below the poverty level.
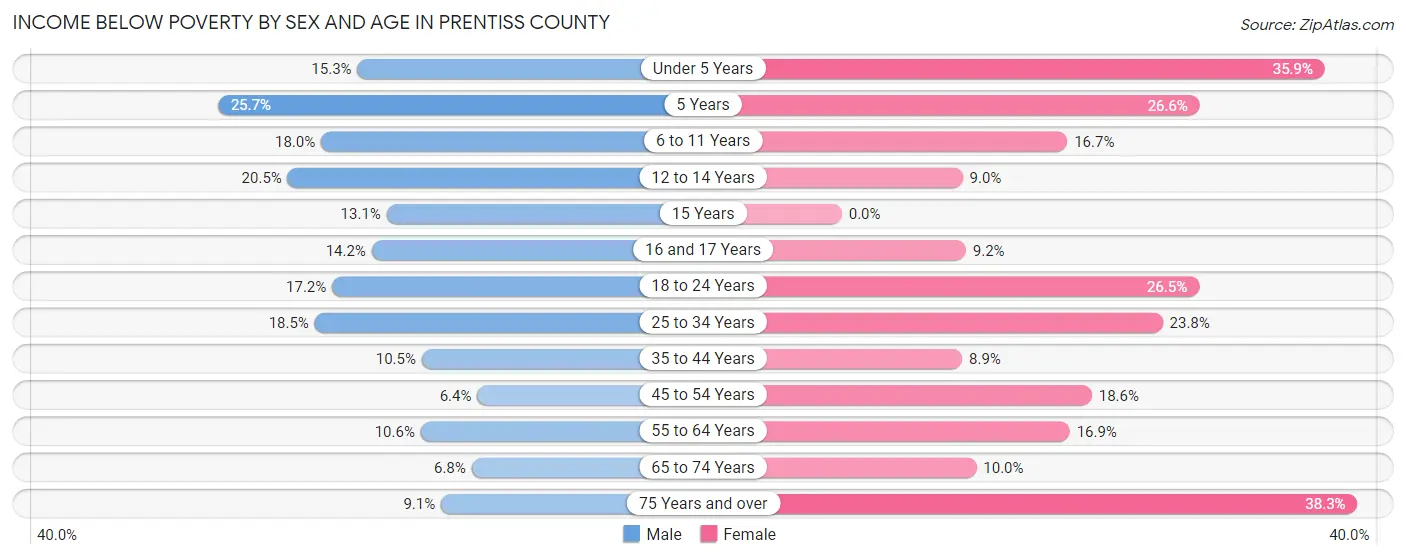
| Age Bracket | Male | Female |
| Under 5 Years | 131 (15.3%) | 227 (35.9%) |
| 5 Years | 116 (25.7%) | 55 (26.6%) |
| 6 to 11 Years | 140 (18.0%) | 152 (16.7%) |
| 12 to 14 Years | 69 (20.5%) | 33 (9.0%) |
| 15 Years | 21 (13.1%) | 0 (0.0%) |
| 16 and 17 Years | 40 (14.2%) | 34 (9.2%) |
| 18 to 24 Years | 182 (17.2%) | 240 (26.5%) |
| 25 to 34 Years | 273 (18.5%) | 383 (23.8%) |
| 35 to 44 Years | 154 (10.5%) | 126 (8.9%) |
| 45 to 54 Years | 93 (6.4%) | 278 (18.6%) |
| 55 to 64 Years | 155 (10.6%) | 269 (16.9%) |
| 65 to 74 Years | 77 (6.8%) | 138 (10.0%) |
| 75 Years and over | 62 (9.1%) | 418 (38.3%) |
| Total | 1,513 (13.0%) | 2,353 (19.5%) |
Income Above Poverty by Sex and Age in Prentiss County
According to the poverty statistics in Prentiss County, males aged 45 to 54 years and females aged 15 years are the age groups that are most secure financially, with 93.6% of males and 100.0% of females in these age groups living above the poverty line.
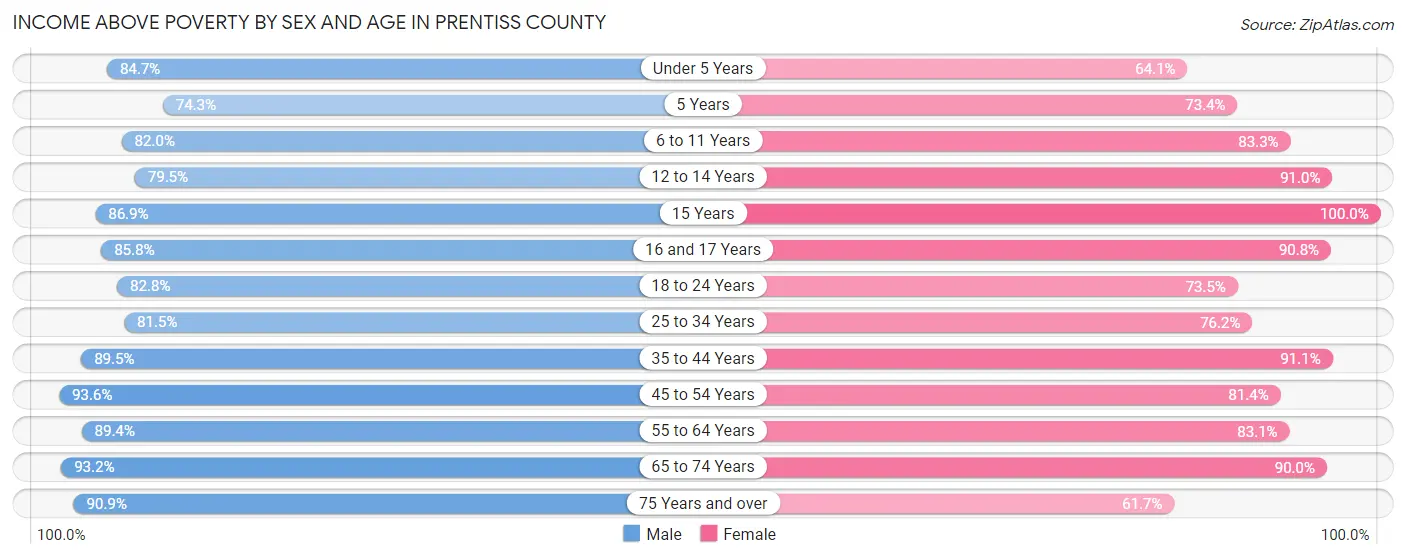
| Age Bracket | Male | Female |
| Under 5 Years | 726 (84.7%) | 406 (64.1%) |
| 5 Years | 336 (74.3%) | 152 (73.4%) |
| 6 to 11 Years | 638 (82.0%) | 756 (83.3%) |
| 12 to 14 Years | 268 (79.5%) | 335 (91.0%) |
| 15 Years | 139 (86.9%) | 117 (100.0%) |
| 16 and 17 Years | 241 (85.8%) | 335 (90.8%) |
| 18 to 24 Years | 878 (82.8%) | 665 (73.5%) |
| 25 to 34 Years | 1,206 (81.5%) | 1,225 (76.2%) |
| 35 to 44 Years | 1,311 (89.5%) | 1,285 (91.1%) |
| 45 to 54 Years | 1,362 (93.6%) | 1,220 (81.4%) |
| 55 to 64 Years | 1,309 (89.4%) | 1,321 (83.1%) |
| 65 to 74 Years | 1,053 (93.2%) | 1,244 (90.0%) |
| 75 Years and over | 621 (90.9%) | 674 (61.7%) |
| Total | 10,088 (87.0%) | 9,735 (80.5%) |
Income Below Poverty Among Married-Couple Families in Prentiss County
The poverty statistics for married-couple families in Prentiss County show that 5.1% or 240 of the total 4,671 families live below the poverty line. Families with 1 or 2 children have the highest poverty rate of 8.0%, comprising of 121 families. On the other hand, families with 5 or more children have the lowest poverty rate of 0.0%, which includes 0 families.
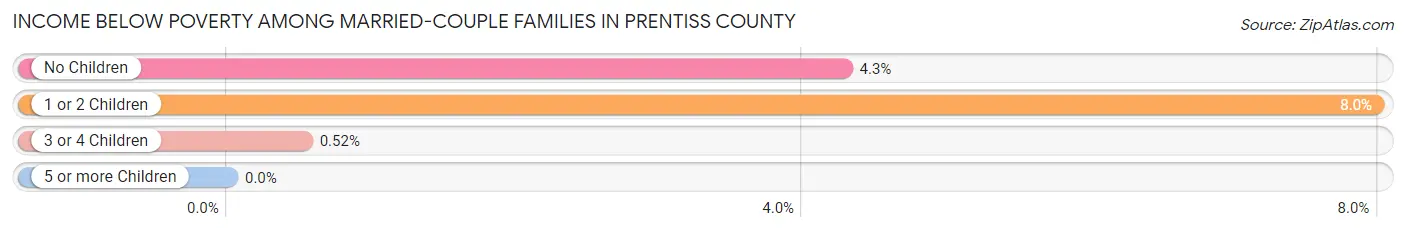
| Children | Above Poverty | Below Poverty |
| No Children | 2,618 (95.7%) | 117 (4.3%) |
| 1 or 2 Children | 1,396 (92.0%) | 121 (8.0%) |
| 3 or 4 Children | 379 (99.5%) | 2 (0.5%) |
| 5 or more Children | 38 (100.0%) | 0 (0.0%) |
| Total | 4,431 (94.9%) | 240 (5.1%) |
Income Below Poverty Among Single-Parent Households in Prentiss County
According to the poverty data in Prentiss County, 7.6% or 39 single-father households and 37.6% or 446 single-mother households are living below the poverty line. Among single-father households, those with 5 or more children have the highest poverty rate, with 32 households (100.0%) experiencing poverty. Likewise, among single-mother households, those with 3 or 4 children have the highest poverty rate, with 59 households (47.6%) falling below the poverty line.
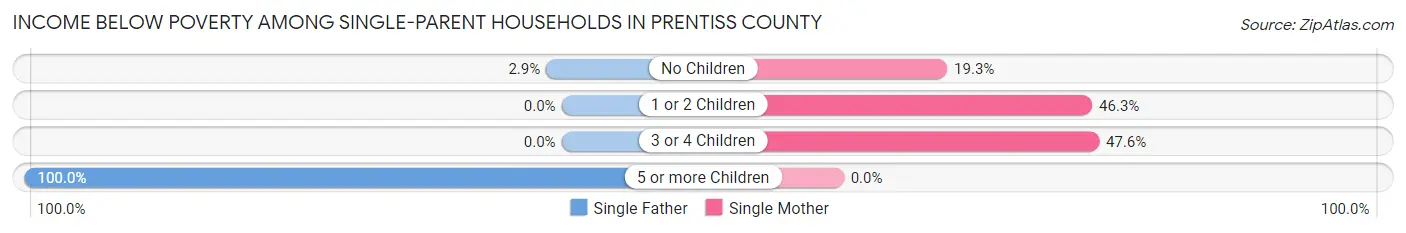
| Children | Single Father | Single Mother |
| No Children | 7 (2.9%) | 70 (19.3%) |
| 1 or 2 Children | 0 (0.0%) | 317 (46.3%) |
| 3 or 4 Children | 0 (0.0%) | 59 (47.6%) |
| 5 or more Children | 32 (100.0%) | 0 (0.0%) |
| Total | 39 (7.6%) | 446 (37.6%) |
Income Below Poverty Among Married-Couple vs Single-Parent Households in Prentiss County
The poverty data for Prentiss County shows that 240 of the married-couple family households (5.1%) and 485 of the single-parent households (28.6%) are living below the poverty level. Within the married-couple family households, those with 1 or 2 children have the highest poverty rate, with 121 households (8.0%) falling below the poverty line. Among the single-parent households, those with 5 or more children have the highest poverty rate, with 32 household (71.1%) living below poverty.
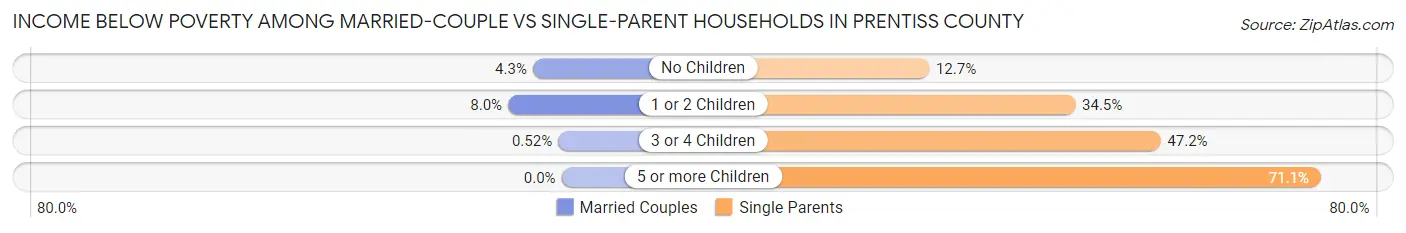
| Children | Married-Couple Families | Single-Parent Households |
| No Children | 117 (4.3%) | 77 (12.7%) |
| 1 or 2 Children | 121 (8.0%) | 317 (34.5%) |
| 3 or 4 Children | 2 (0.5%) | 59 (47.2%) |
| 5 or more Children | 0 (0.0%) | 32 (71.1%) |
| Total | 240 (5.1%) | 485 (28.6%) |
Race in Prentiss County
The most populous races in Prentiss County are White / Caucasian (20,107 | 80.6%), Black / African American (2,669 | 10.7%), and Two or more Races (1,235 | 5.0%).
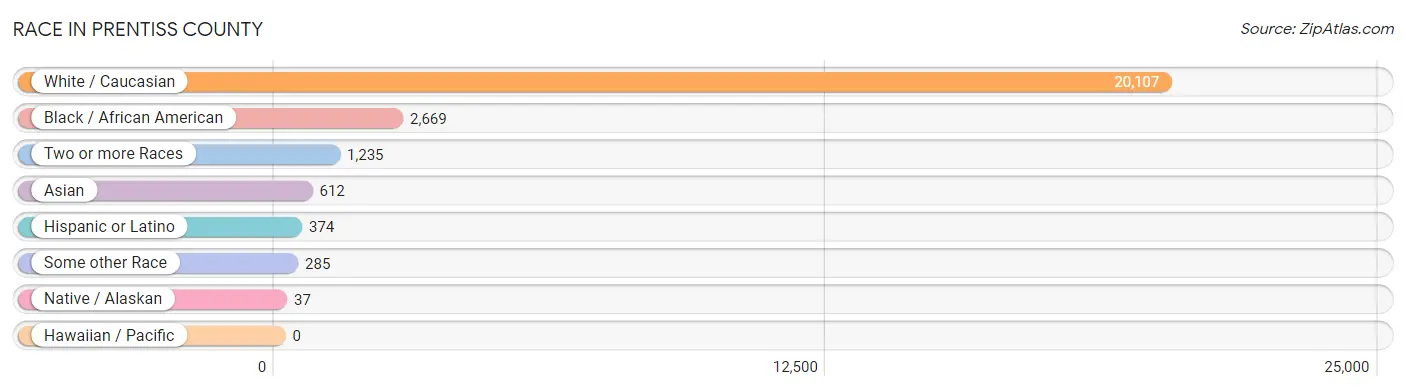
| Race | # Population | % Population |
| Asian | 612 | 2.5% |
| Black / African American | 2,669 | 10.7% |
| Hawaiian / Pacific | 0 | 0.0% |
| Hispanic or Latino | 374 | 1.5% |
| Native / Alaskan | 37 | 0.2% |
| White / Caucasian | 20,107 | 80.6% |
| Two or more Races | 1,235 | 5.0% |
| Some other Race | 285 | 1.1% |
| Total | 24,945 | 100.0% |
Ancestry in Prentiss County
The most populous ancestries reported in Prentiss County are American (3,556 | 14.3%), Irish (2,849 | 11.4%), English (2,124 | 8.5%), German (905 | 3.6%), and European (496 | 2.0%), together accounting for 39.8% of all Prentiss County residents.
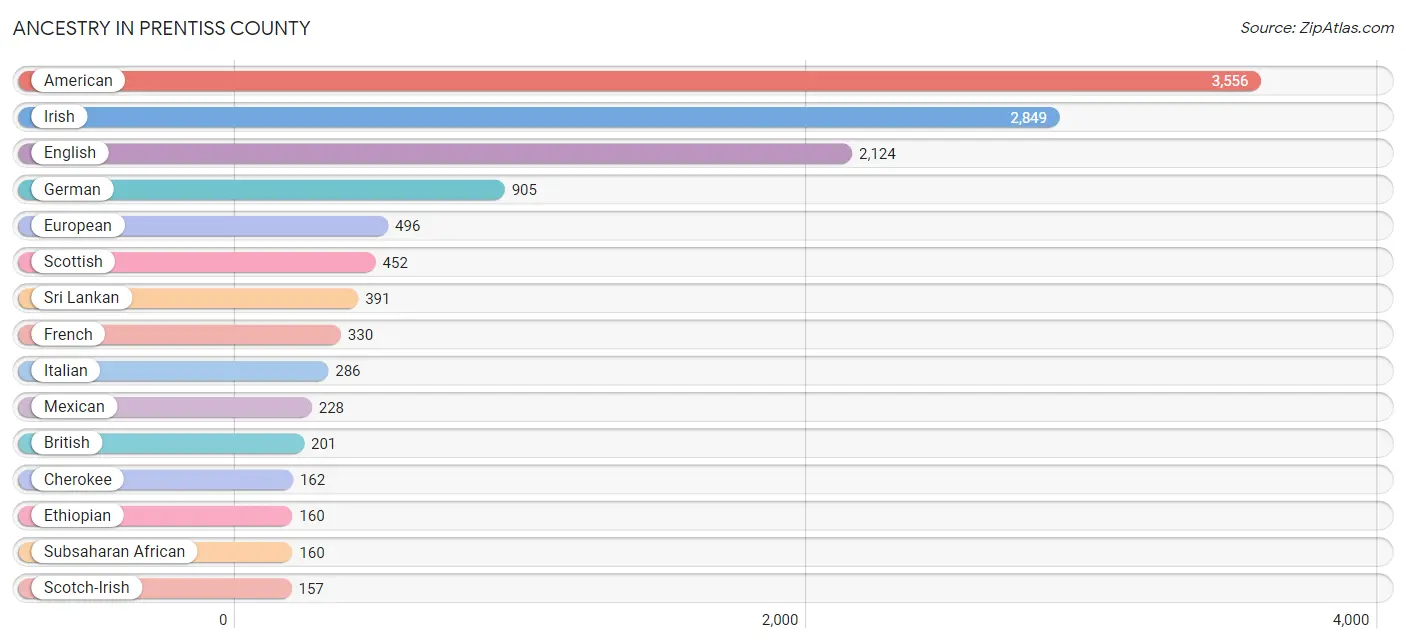
| Ancestry | # Population | % Population |
| American | 3,556 | 14.3% |
| Arab | 31 | 0.1% |
| Bhutanese | 3 | 0.0% |
| British | 201 | 0.8% |
| Burmese | 7 | 0.0% |
| Cajun | 16 | 0.1% |
| Central American | 16 | 0.1% |
| Cherokee | 162 | 0.6% |
| Choctaw | 70 | 0.3% |
| Cuban | 51 | 0.2% |
| Czech | 20 | 0.1% |
| Danish | 14 | 0.1% |
| Dutch | 137 | 0.5% |
| English | 2,124 | 8.5% |
| Ethiopian | 160 | 0.6% |
| European | 496 | 2.0% |
| French | 330 | 1.3% |
| French Canadian | 37 | 0.2% |
| German | 905 | 3.6% |
| Greek | 8 | 0.0% |
| Honduran | 1 | 0.0% |
| Indian (Asian) | 33 | 0.1% |
| Irish | 2,849 | 11.4% |
| Italian | 286 | 1.1% |
| Korean | 146 | 0.6% |
| Lebanese | 31 | 0.1% |
| Mexican | 228 | 0.9% |
| Nicaraguan | 7 | 0.0% |
| Norwegian | 27 | 0.1% |
| Polish | 95 | 0.4% |
| Portuguese | 44 | 0.2% |
| Russian | 10 | 0.0% |
| Salvadoran | 8 | 0.0% |
| Scandinavian | 21 | 0.1% |
| Scotch-Irish | 157 | 0.6% |
| Scottish | 452 | 1.8% |
| Seminole | 32 | 0.1% |
| Slovak | 10 | 0.0% |
| Spaniard | 22 | 0.1% |
| Spanish | 57 | 0.2% |
| Sri Lankan | 391 | 1.6% |
| Subsaharan African | 160 | 0.6% |
| Thai | 60 | 0.2% |
| Welsh | 102 | 0.4% |
| Yugoslavian | 49 | 0.2% | View All 45 Rows |
Immigrants in Prentiss County
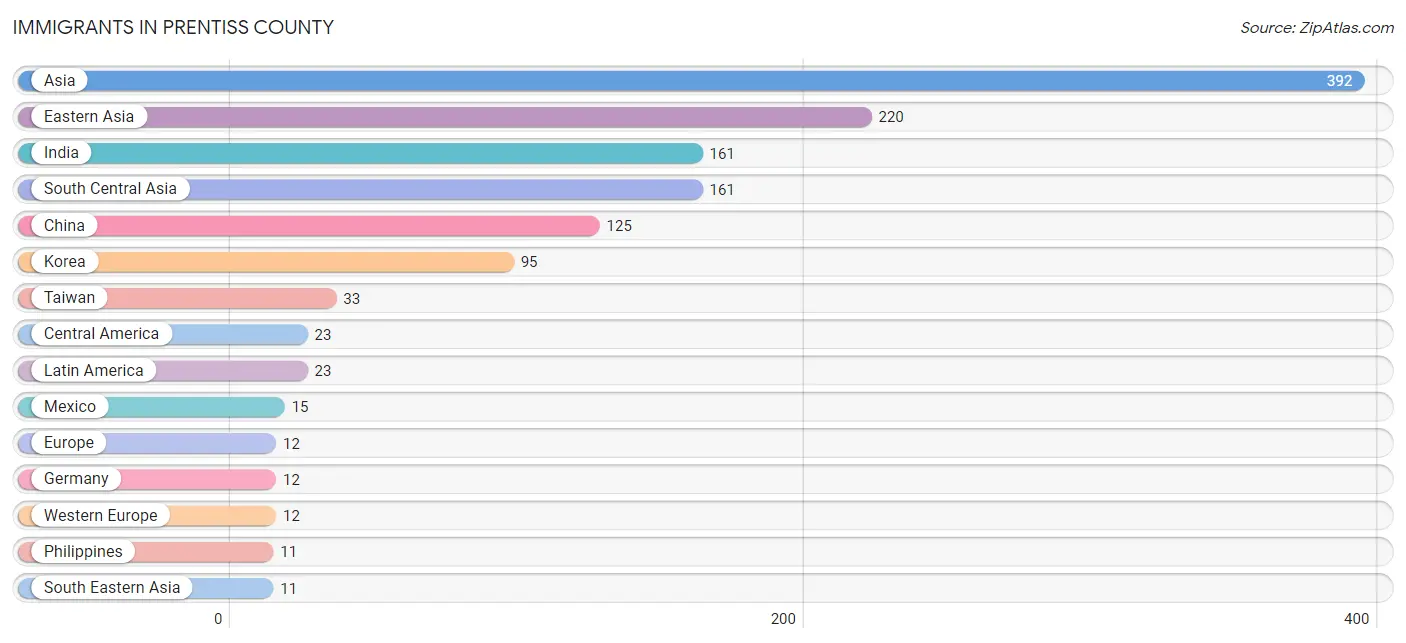
The most numerous immigrant groups reported in Prentiss County came from Asia (392 | 1.6%), Eastern Asia (220 | 0.9%), India (161 | 0.6%), South Central Asia (161 | 0.6%), and China (125 | 0.5%), together accounting for 4.2% of all Prentiss County residents.
| Immigration Origin | # Population | % Population |
| Asia | 392 | 1.6% |
| Central America | 23 | 0.1% |
| China | 125 | 0.5% |
| Eastern Asia | 220 | 0.9% |
| El Salvador | 8 | 0.0% |
| Europe | 12 | 0.1% |
| Germany | 12 | 0.1% |
| India | 161 | 0.6% |
| Korea | 95 | 0.4% |
| Latin America | 23 | 0.1% |
| Mexico | 15 | 0.1% |
| Philippines | 11 | 0.0% |
| South Central Asia | 161 | 0.6% |
| South Eastern Asia | 11 | 0.0% |
| Taiwan | 33 | 0.1% |
| Western Europe | 12 | 0.1% | View All 16 Rows |
Sex and Age in Prentiss County
Sex and Age in Prentiss County
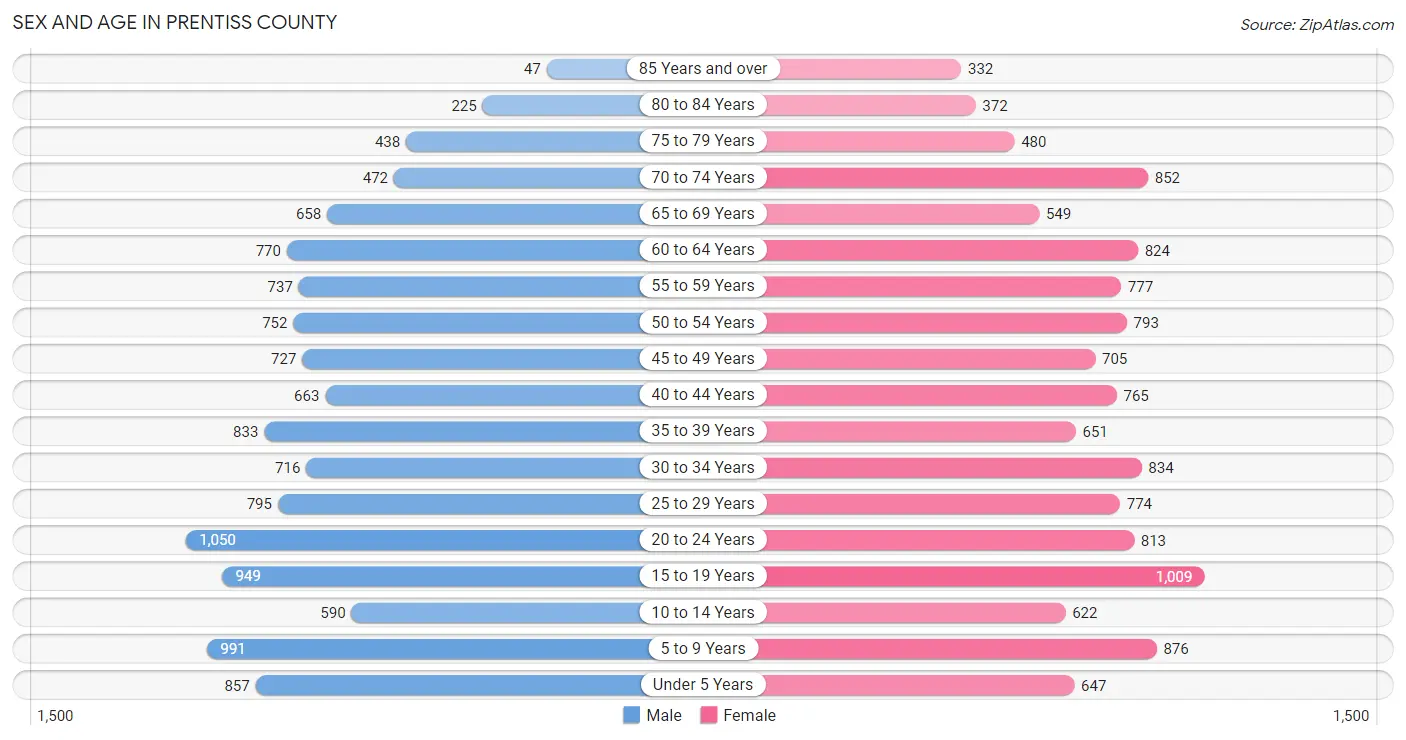
The most populous age groups in Prentiss County are 20 to 24 Years (1,050 | 8.6%) for men and 15 to 19 Years (1,009 | 8.0%) for women.
| Age Bracket | Male | Female |
| Under 5 Years | 857 (7.0%) | 647 (5.1%) |
| 5 to 9 Years | 991 (8.1%) | 876 (6.9%) |
| 10 to 14 Years | 590 (4.8%) | 622 (4.9%) |
| 15 to 19 Years | 949 (7.7%) | 1,009 (8.0%) |
| 20 to 24 Years | 1,050 (8.6%) | 813 (6.4%) |
| 25 to 29 Years | 795 (6.5%) | 774 (6.1%) |
| 30 to 34 Years | 716 (5.8%) | 834 (6.6%) |
| 35 to 39 Years | 833 (6.8%) | 651 (5.1%) |
| 40 to 44 Years | 663 (5.4%) | 765 (6.0%) |
| 45 to 49 Years | 727 (5.9%) | 705 (5.6%) |
| 50 to 54 Years | 752 (6.1%) | 793 (6.3%) |
| 55 to 59 Years | 737 (6.0%) | 777 (6.1%) |
| 60 to 64 Years | 770 (6.3%) | 824 (6.5%) |
| 65 to 69 Years | 658 (5.4%) | 549 (4.3%) |
| 70 to 74 Years | 472 (3.8%) | 852 (6.7%) |
| 75 to 79 Years | 438 (3.6%) | 480 (3.8%) |
| 80 to 84 Years | 225 (1.8%) | 372 (2.9%) |
| 85 Years and over | 47 (0.4%) | 332 (2.6%) |
| Total | 12,270 (100.0%) | 12,675 (100.0%) |
Families and Households in Prentiss County
Median Family Size in Prentiss County
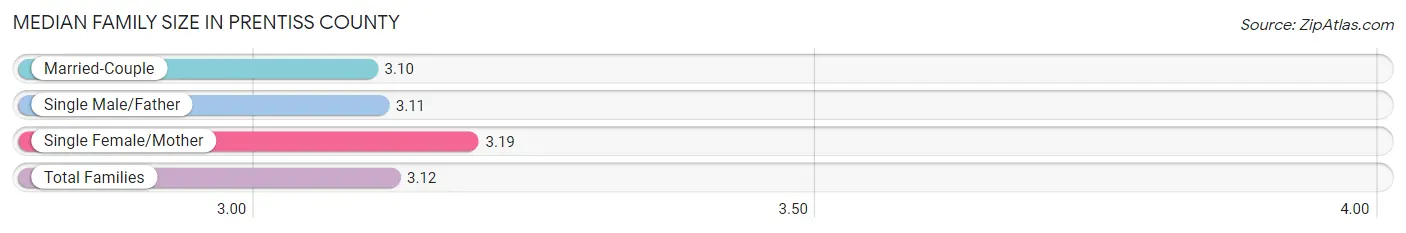
The median family size in Prentiss County is 3.12 persons per family, with single female/mother families (1,185 | 18.6%) accounting for the largest median family size of 3.19 persons per family. On the other hand, married-couple families (4,671 | 73.4%) represent the smallest median family size with 3.10 persons per family.
| Family Type | # Families | Family Size |
| Married-Couple | 4,671 (73.4%) | 3.10 |
| Single Male/Father | 510 (8.0%) | 3.11 |
| Single Female/Mother | 1,185 (18.6%) | 3.19 |
| Total Families | 6,366 (100.0%) | 3.12 |
Median Household Size in Prentiss County
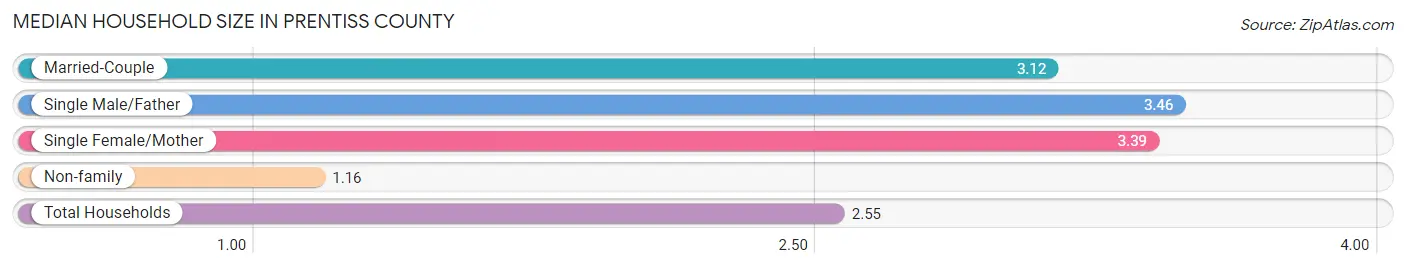
The median household size in Prentiss County is 2.55 persons per household, with single male/father households (510 | 5.5%) accounting for the largest median household size of 3.46 persons per household. non-family households (2,930 | 31.5%) represent the smallest median household size with 1.16 persons per household.
| Household Type | # Households | Household Size |
| Married-Couple | 4,671 (50.2%) | 3.12 |
| Single Male/Father | 510 (5.5%) | 3.46 |
| Single Female/Mother | 1,185 (12.8%) | 3.39 |
| Non-family | 2,930 (31.5%) | 1.16 |
| Total Households | 9,296 (100.0%) | 2.55 |
Household Size by Marriage Status in Prentiss County
Out of a total of 9,296 households in Prentiss County, 6,366 (68.5%) are family households, while 2,930 (31.5%) are nonfamily households. The most numerous type of family households are 2-person households, comprising 2,911, and the most common type of nonfamily households are 1-person households, comprising 2,634.
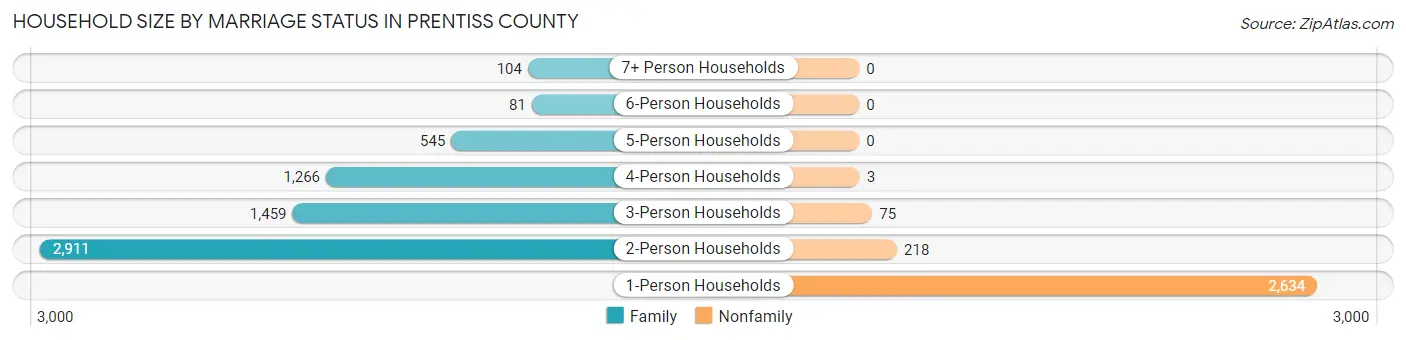
| Household Size | Family Households | Nonfamily Households |
| 1-Person Households | - | 2,634 (28.3%) |
| 2-Person Households | 2,911 (31.3%) | 218 (2.4%) |
| 3-Person Households | 1,459 (15.7%) | 75 (0.8%) |
| 4-Person Households | 1,266 (13.6%) | 3 (0.0%) |
| 5-Person Households | 545 (5.9%) | 0 (0.0%) |
| 6-Person Households | 81 (0.9%) | 0 (0.0%) |
| 7+ Person Households | 104 (1.1%) | 0 (0.0%) |
| Total | 6,366 (68.5%) | 2,930 (31.5%) |
Female Fertility in Prentiss County
Fertility by Age in Prentiss County
Average fertility rate in Prentiss County is 59.0 births per 1,000 women. Women in the age bracket of 20 to 34 years have the highest fertility rate with 118.0 births per 1,000 women. Women in the age bracket of 20 to 34 years acount for 86.7% of all women with births.
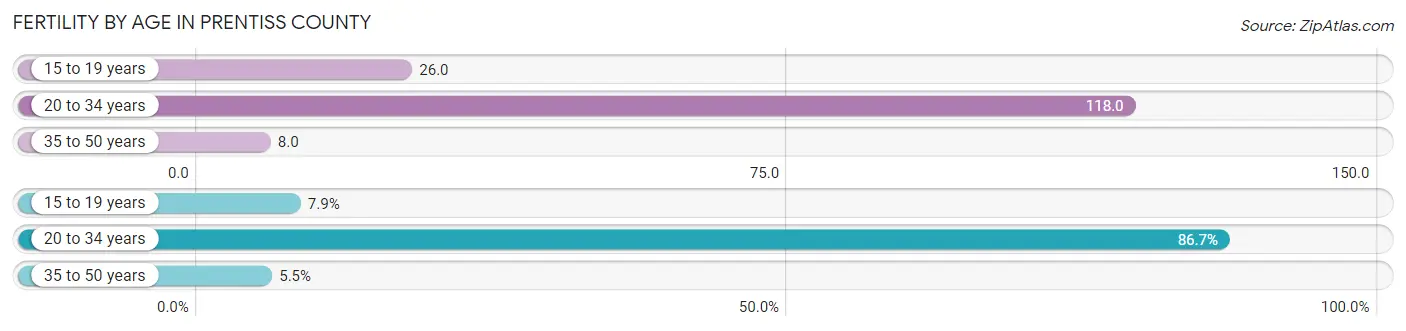
| Age Bracket | Women with Births | Births / 1,000 Women |
| 15 to 19 years | 26 (7.9%) | 26.0 |
| 20 to 34 years | 286 (86.7%) | 118.0 |
| 35 to 50 years | 18 (5.4%) | 8.0 |
| Total | 330 (100.0%) | 59.0 |
Fertility by Age by Marriage Status in Prentiss County
68.5% of women with births (330) in Prentiss County are married. The highest percentage of unmarried women with births falls into 15 to 19 years age bracket with 38.5% of them unmarried at the time of birth, while the lowest percentage of unmarried women with births belong to 35 to 50 years age bracket with 0.0% of them unmarried.
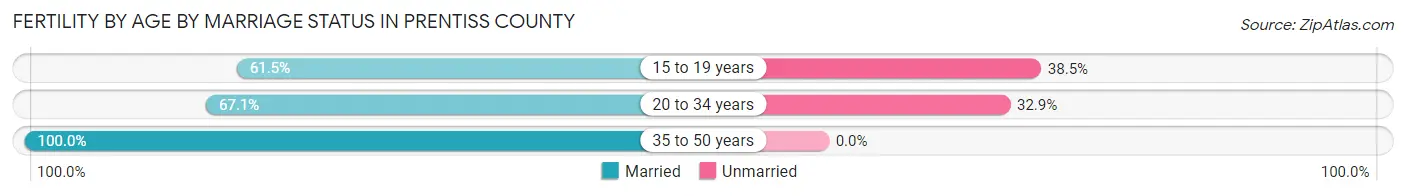
| Age Bracket | Married | Unmarried |
| 15 to 19 years | 16 (61.5%) | 10 (38.5%) |
| 20 to 34 years | 192 (67.1%) | 94 (32.9%) |
| 35 to 50 years | 18 (100.0%) | 0 (0.0%) |
| Total | 226 (68.5%) | 104 (31.5%) |
Fertility by Education in Prentiss County
Average fertility rate in Prentiss County is 59.0 births per 1,000 women. Women with the education attainment of graduate degree have the highest fertility rate of 155.0 births per 1,000 women, while women with the education attainment of less than high school have the lowest fertility at 24.0 births per 1,000 women. Women with the education attainment of high school diploma represent 40.6% of all women with births.
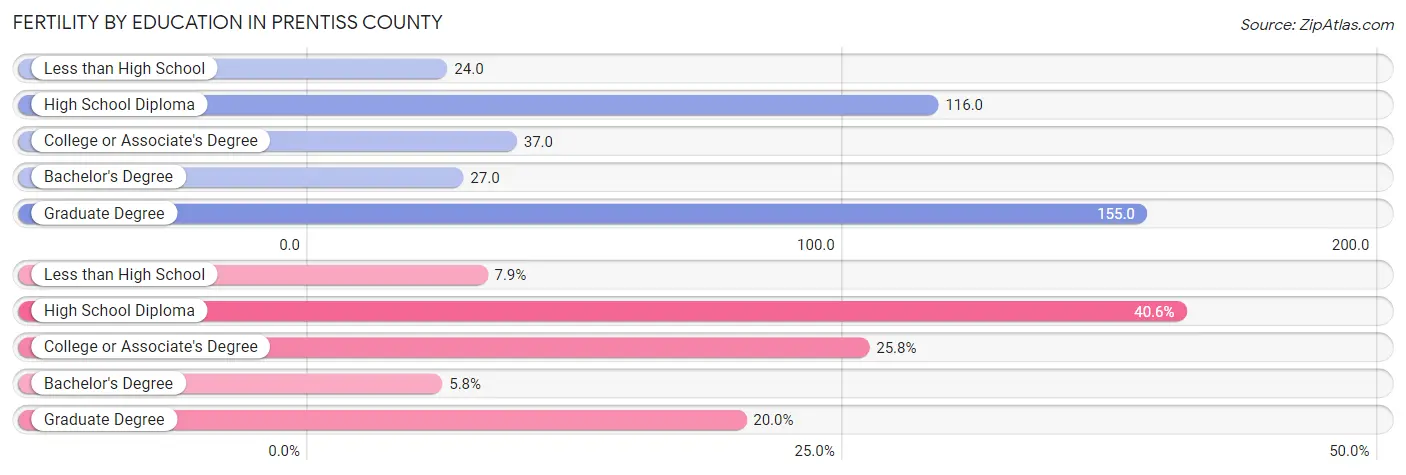
| Educational Attainment | Women with Births | Births / 1,000 Women |
| Less than High School | 26 (7.9%) | 24.0 |
| High School Diploma | 134 (40.6%) | 116.0 |
| College or Associate's Degree | 85 (25.8%) | 37.0 |
| Bachelor's Degree | 19 (5.8%) | 27.0 |
| Graduate Degree | 66 (20.0%) | 155.0 |
| Total | 330 (100.0%) | 59.0 |
Fertility by Education by Marriage Status in Prentiss County
31.5% of women with births in Prentiss County are unmarried. Women with the educational attainment of bachelor's degree are most likely to be married with 100.0% of them married at childbirth, while women with the educational attainment of high school diploma are least likely to be married with 67.2% of them unmarried at childbirth.
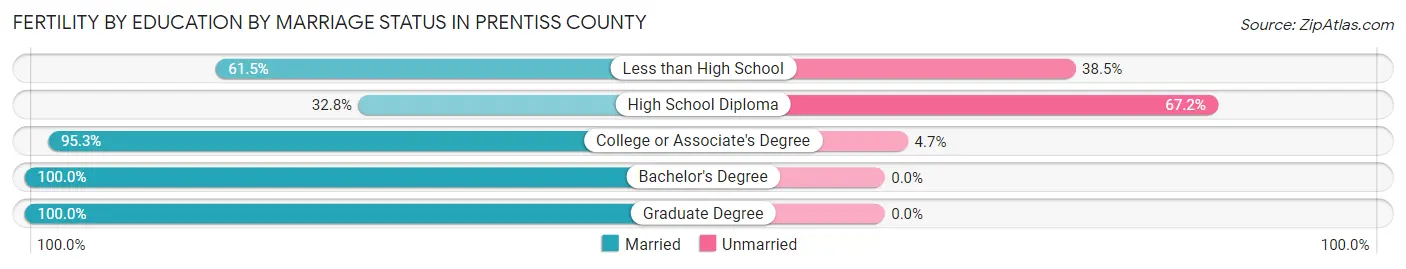
| Educational Attainment | Married | Unmarried |
| Less than High School | 16 (61.5%) | 10 (38.5%) |
| High School Diploma | 44 (32.8%) | 90 (67.2%) |
| College or Associate's Degree | 81 (95.3%) | 4 (4.7%) |
| Bachelor's Degree | 19 (100.0%) | 0 (0.0%) |
| Graduate Degree | 66 (100.0%) | 0 (0.0%) |
| Total | 226 (68.5%) | 104 (31.5%) |
Employment Characteristics in Prentiss County
Employment by Class of Employer in Prentiss County
Among the 10,261 employed individuals in Prentiss County, private company employees (7,250 | 70.7%), state government employees (796 | 7.8%), and self-employed (not incorporated) (646 | 6.3%) make up the most common classes of employment.
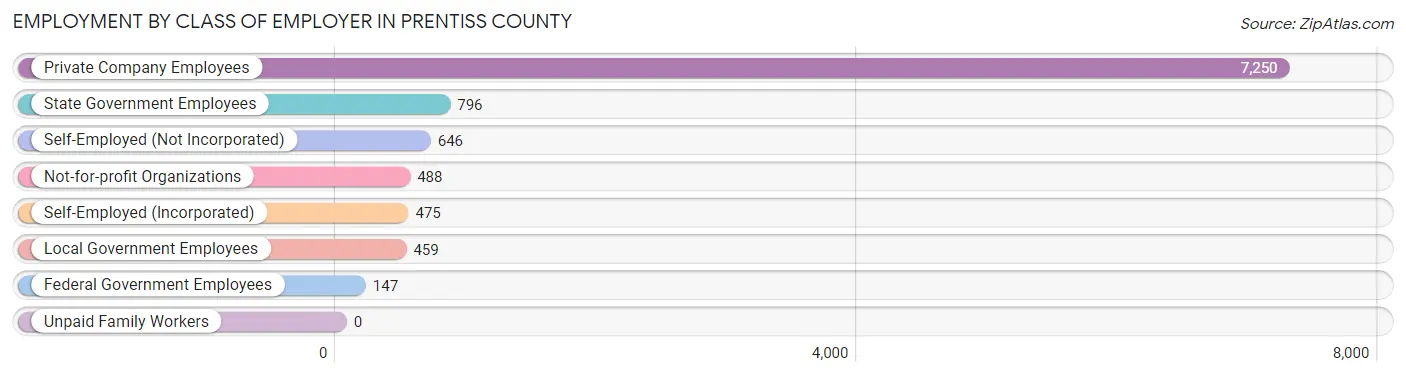
| Employer Class | # Employees | % Employees |
| Private Company Employees | 7,250 | 70.7% |
| Self-Employed (Incorporated) | 475 | 4.6% |
| Self-Employed (Not Incorporated) | 646 | 6.3% |
| Not-for-profit Organizations | 488 | 4.8% |
| Local Government Employees | 459 | 4.5% |
| State Government Employees | 796 | 7.8% |
| Federal Government Employees | 147 | 1.4% |
| Unpaid Family Workers | 0 | 0.0% |
| Total | 10,261 | 100.0% |
Employment Status by Age in Prentiss County
According to the labor force statistics for Prentiss County, out of the total population over 16 years of age (20,085), 54.9% or 11,027 individuals are in the labor force, with 5.0% or 551 of them unemployed. The age group with the highest labor force participation rate is 25 to 29 years, with 85.2% or 1,337 individuals in the labor force. Within the labor force, the 16 to 19 years age range has the highest percentage of unemployed individuals, with 19.4% or 103 of them being unemployed.
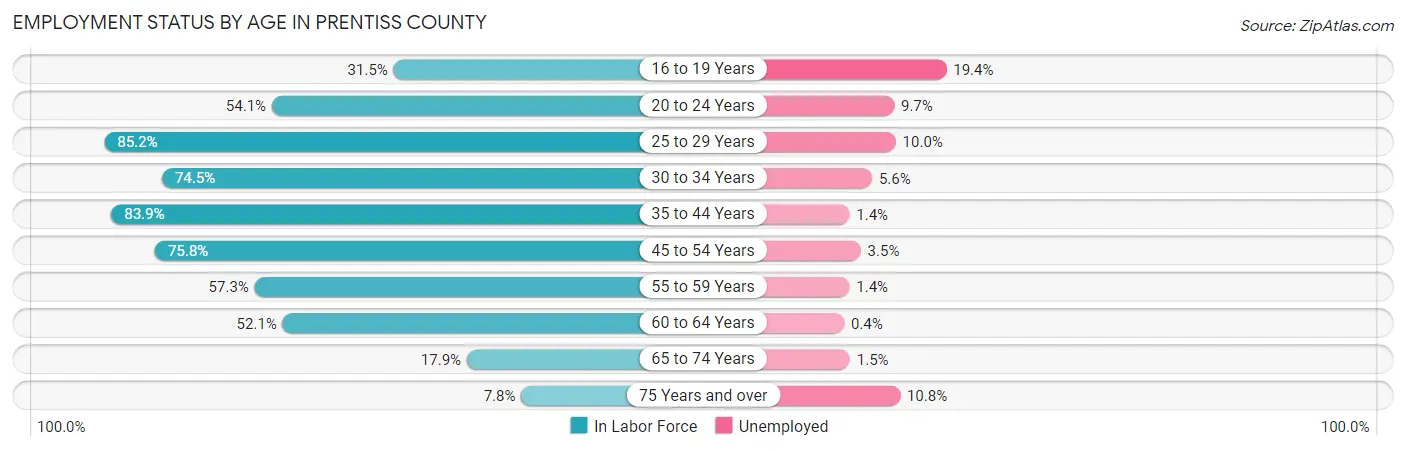
| Age Bracket | In Labor Force | Unemployed |
| 16 to 19 Years | 530 (31.5%) | 103 (19.4%) |
| 20 to 24 Years | 1,008 (54.1%) | 98 (9.7%) |
| 25 to 29 Years | 1,337 (85.2%) | 134 (10.0%) |
| 30 to 34 Years | 1,155 (74.5%) | 65 (5.6%) |
| 35 to 44 Years | 2,443 (83.9%) | 34 (1.4%) |
| 45 to 54 Years | 2,257 (75.8%) | 79 (3.5%) |
| 55 to 59 Years | 868 (57.3%) | 12 (1.4%) |
| 60 to 64 Years | 830 (52.1%) | 3 (0.4%) |
| 65 to 74 Years | 453 (17.9%) | 7 (1.5%) |
| 75 Years and over | 148 (7.8%) | 16 (10.8%) |
| Total | 11,027 (54.9%) | 551 (5.0%) |
Employment Status by Educational Attainment in Prentiss County
According to labor force statistics for Prentiss County, 73.4% of individuals (8,893) out of the total population between 25 and 64 years of age (12,116) are in the labor force, with 3.7% or 329 of them being unemployed. The group with the highest labor force participation rate are those with the educational attainment of bachelor's degree or higher, with 81.6% or 1,987 individuals in the labor force. Within the labor force, individuals with less than high school education have the highest percentage of unemployment, with 23.6% or 217 of them being unemployed.
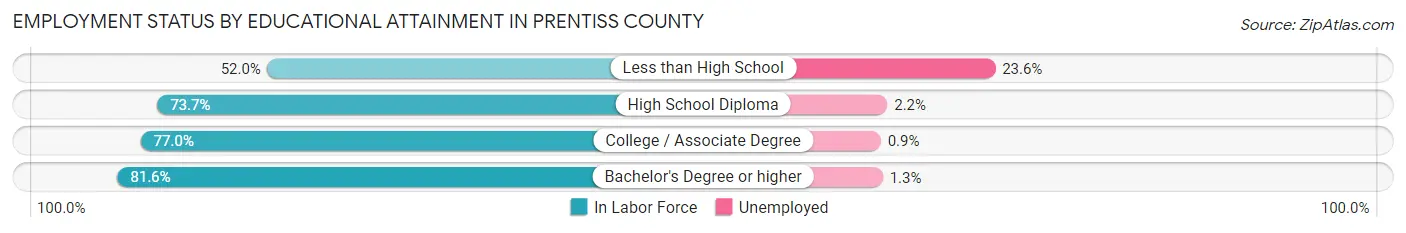
| Educational Attainment | In Labor Force | Unemployed |
| Less than High School | 920 (52.0%) | 417 (23.6%) |
| High School Diploma | 2,504 (73.7%) | 75 (2.2%) |
| College / Associate Degree | 3,476 (77.0%) | 41 (0.9%) |
| Bachelor's Degree or higher | 1,987 (81.6%) | 32 (1.3%) |
| Total | 8,893 (73.4%) | 448 (3.7%) |
Employment Occupations by Sex in Prentiss County
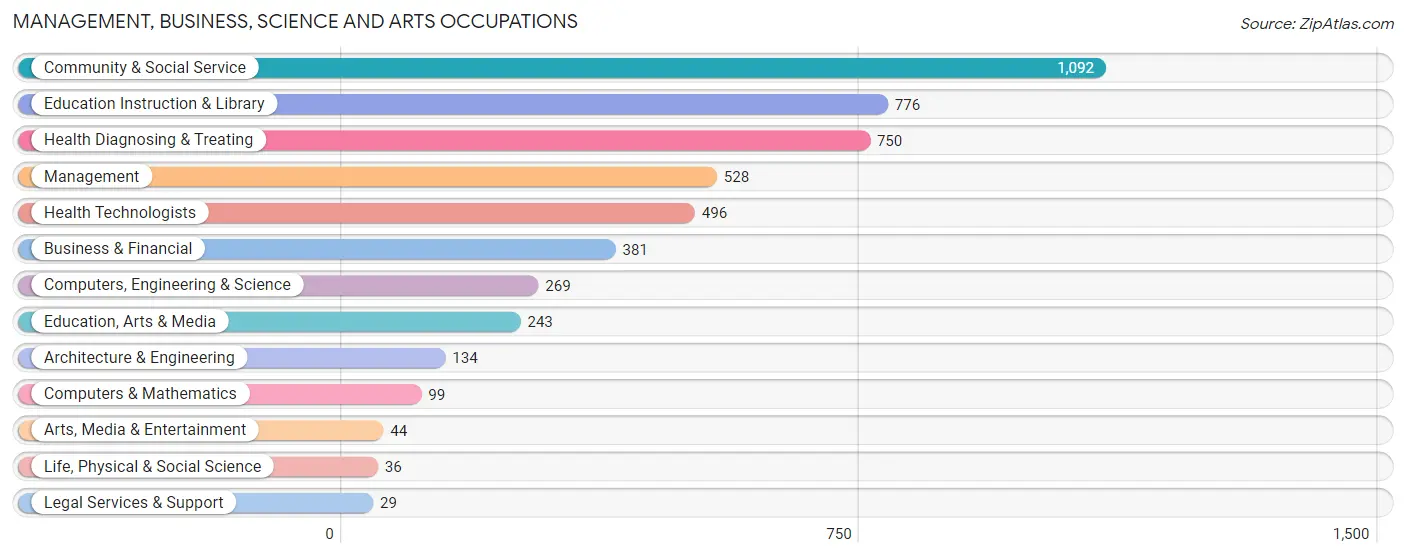
Management, Business, Science and Arts Occupations
The most common Management, Business, Science and Arts occupations in Prentiss County are Community & Social Service (1,092 | 10.4%), Education Instruction & Library (776 | 7.4%), Health Diagnosing & Treating (750 | 7.2%), Management (528 | 5.0%), and Health Technologists (496 | 4.7%).
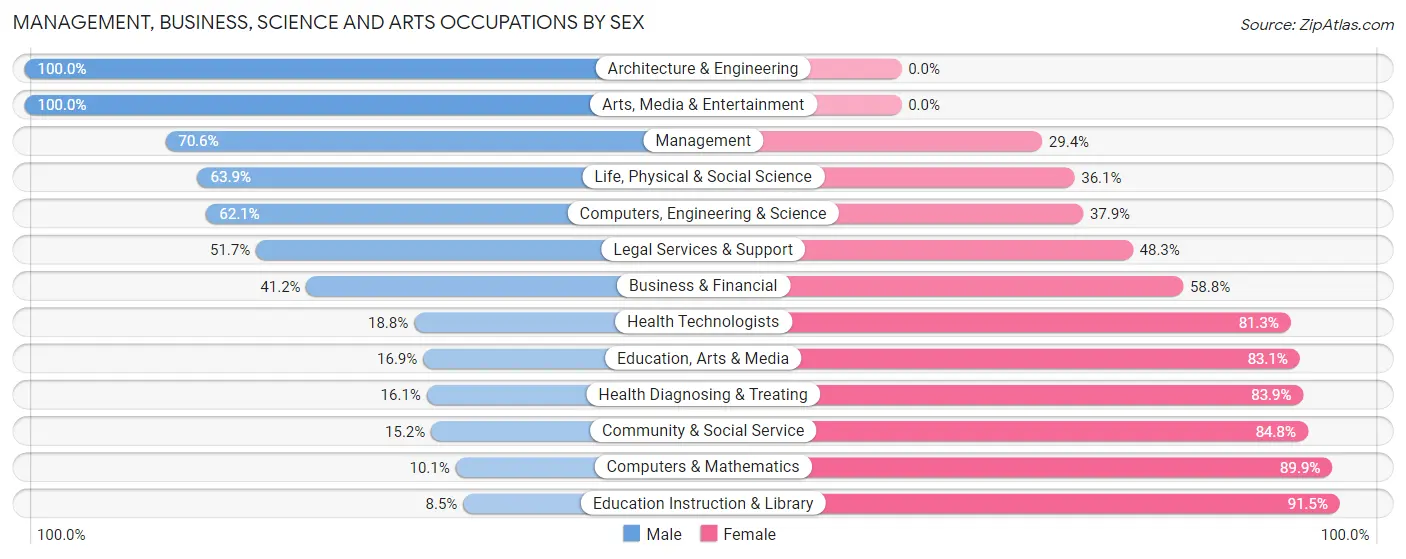
Management, Business, Science and Arts Occupations by Sex
Within the Management, Business, Science and Arts occupations in Prentiss County, the most male-oriented occupations are Architecture & Engineering (100.0%), Arts, Media & Entertainment (100.0%), and Management (70.6%), while the most female-oriented occupations are Education Instruction & Library (91.5%), Computers & Mathematics (89.9%), and Community & Social Service (84.8%).
| Occupation | Male | Female |
| Management | 373 (70.6%) | 155 (29.4%) |
| Business & Financial | 157 (41.2%) | 224 (58.8%) |
| Computers, Engineering & Science | 167 (62.1%) | 102 (37.9%) |
| Computers & Mathematics | 10 (10.1%) | 89 (89.9%) |
| Architecture & Engineering | 134 (100.0%) | 0 (0.0%) |
| Life, Physical & Social Science | 23 (63.9%) | 13 (36.1%) |
| Community & Social Service | 166 (15.2%) | 926 (84.8%) |
| Education, Arts & Media | 41 (16.9%) | 202 (83.1%) |
| Legal Services & Support | 15 (51.7%) | 14 (48.3%) |
| Education Instruction & Library | 66 (8.5%) | 710 (91.5%) |
| Arts, Media & Entertainment | 44 (100.0%) | 0 (0.0%) |
| Health Diagnosing & Treating | 121 (16.1%) | 629 (83.9%) |
| Health Technologists | 93 (18.8%) | 403 (81.2%) |
| Total (Category) | 984 (32.6%) | 2,036 (67.4%) |
| Total (Overall) | 5,588 (53.3%) | 4,889 (46.7%) |
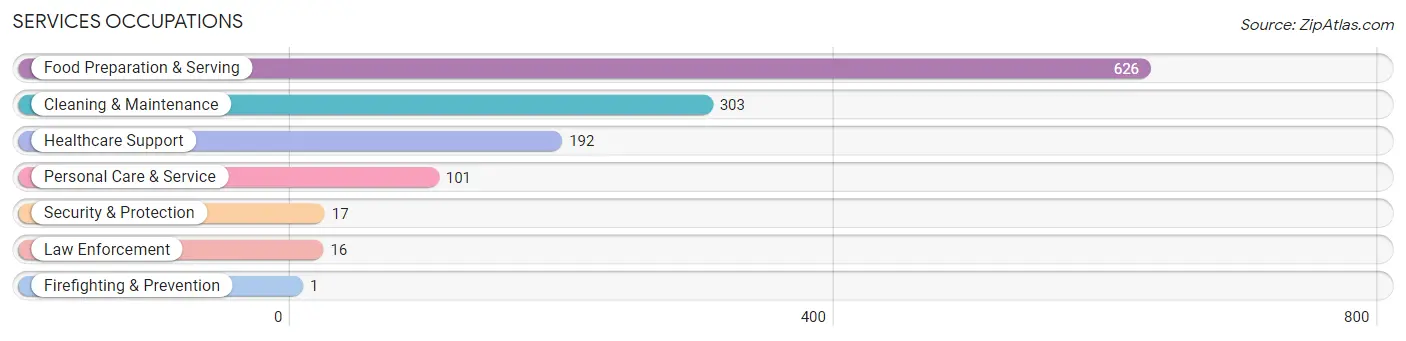
Services Occupations
The most common Services occupations in Prentiss County are Food Preparation & Serving (626 | 6.0%), Cleaning & Maintenance (303 | 2.9%), Healthcare Support (192 | 1.8%), Personal Care & Service (101 | 1.0%), and Security & Protection (17 | 0.2%).
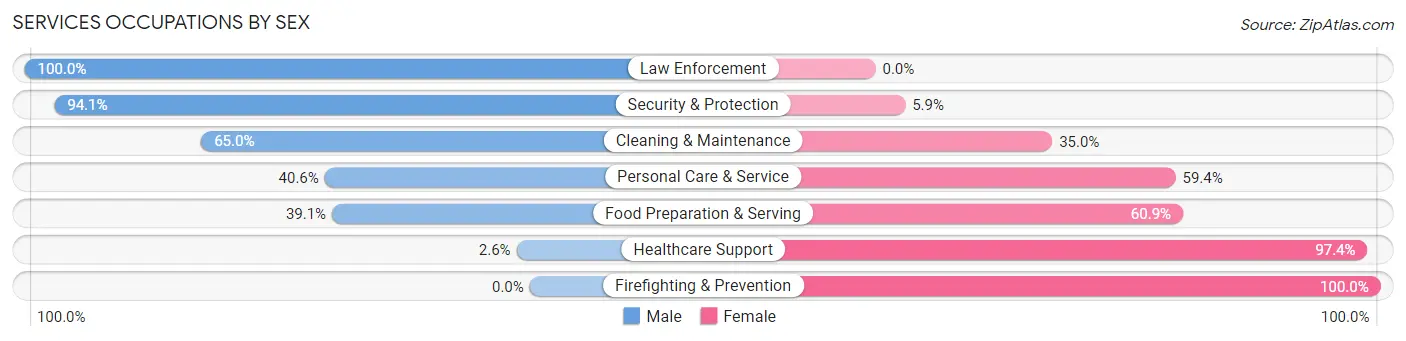
Services Occupations by Sex
Within the Services occupations in Prentiss County, the most male-oriented occupations are Law Enforcement (100.0%), Security & Protection (94.1%), and Cleaning & Maintenance (65.0%), while the most female-oriented occupations are Firefighting & Prevention (100.0%), Healthcare Support (97.4%), and Food Preparation & Serving (60.9%).
| Occupation | Male | Female |
| Healthcare Support | 5 (2.6%) | 187 (97.4%) |
| Security & Protection | 16 (94.1%) | 1 (5.9%) |
| Firefighting & Prevention | 0 (0.0%) | 1 (100.0%) |
| Law Enforcement | 16 (100.0%) | 0 (0.0%) |
| Food Preparation & Serving | 245 (39.1%) | 381 (60.9%) |
| Cleaning & Maintenance | 197 (65.0%) | 106 (35.0%) |
| Personal Care & Service | 41 (40.6%) | 60 (59.4%) |
| Total (Category) | 504 (40.7%) | 735 (59.3%) |
| Total (Overall) | 5,588 (53.3%) | 4,889 (46.7%) |
Sales and Office Occupations
The most common Sales and Office occupations in Prentiss County are Sales & Related (1,187 | 11.3%), and Office & Administration (944 | 9.0%).
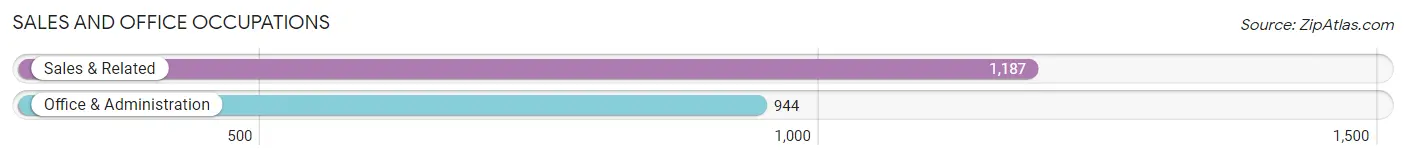
Sales and Office Occupations by Sex
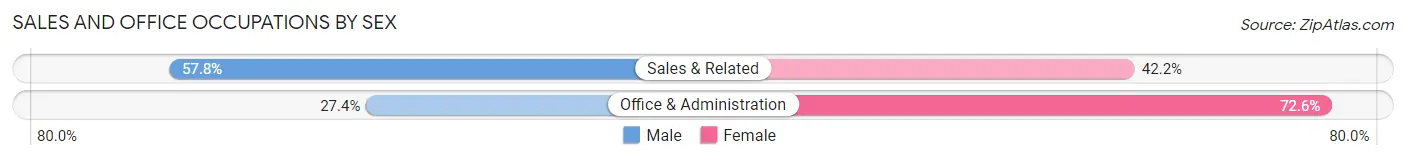
| Occupation | Male | Female |
| Sales & Related | 686 (57.8%) | 501 (42.2%) |
| Office & Administration | 259 (27.4%) | 685 (72.6%) |
| Total (Category) | 945 (44.4%) | 1,186 (55.6%) |
| Total (Overall) | 5,588 (53.3%) | 4,889 (46.7%) |
Natural Resources, Construction and Maintenance Occupations
The most common Natural Resources, Construction and Maintenance occupations in Prentiss County are Construction & Extraction (586 | 5.6%), Installation, Maintenance & Repair (340 | 3.3%), and Farming, Fishing & Forestry (23 | 0.2%).
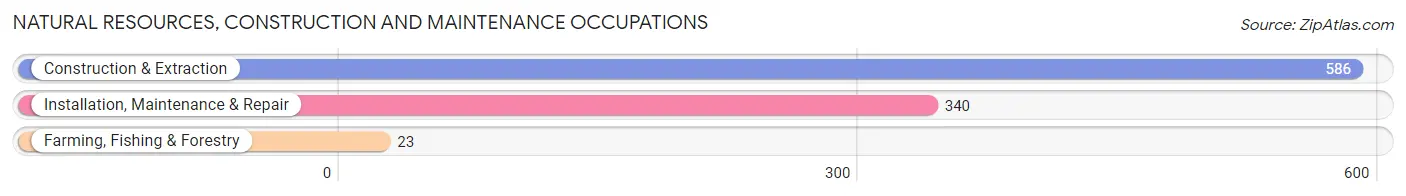
Natural Resources, Construction and Maintenance Occupations by Sex
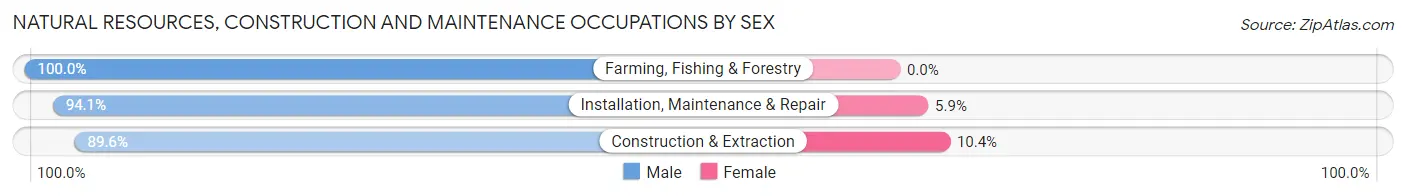
| Occupation | Male | Female |
| Farming, Fishing & Forestry | 23 (100.0%) | 0 (0.0%) |
| Construction & Extraction | 525 (89.6%) | 61 (10.4%) |
| Installation, Maintenance & Repair | 320 (94.1%) | 20 (5.9%) |
| Total (Category) | 868 (91.5%) | 81 (8.5%) |
| Total (Overall) | 5,588 (53.3%) | 4,889 (46.7%) |
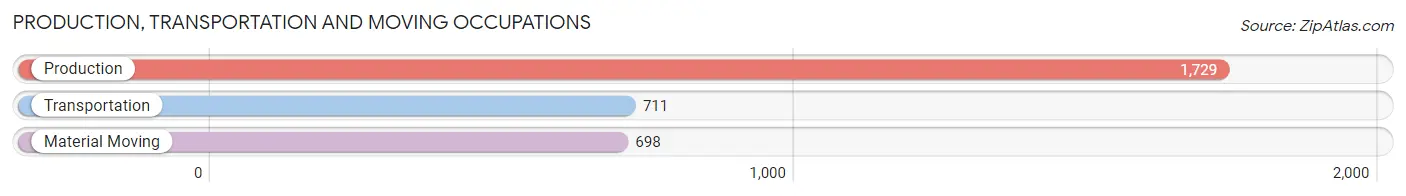
Production, Transportation and Moving Occupations
The most common Production, Transportation and Moving occupations in Prentiss County are Production (1,729 | 16.5%), Transportation (711 | 6.8%), and Material Moving (698 | 6.7%).
Production, Transportation and Moving Occupations by Sex
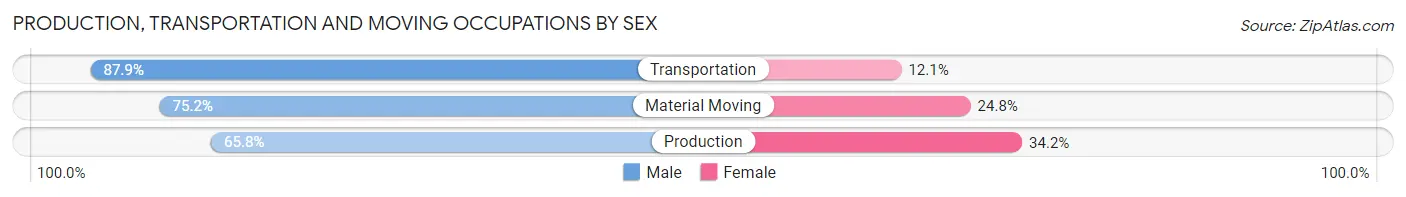
| Occupation | Male | Female |
| Production | 1,137 (65.8%) | 592 (34.2%) |
| Transportation | 625 (87.9%) | 86 (12.1%) |
| Material Moving | 525 (75.2%) | 173 (24.8%) |
| Total (Category) | 2,287 (72.9%) | 851 (27.1%) |
| Total (Overall) | 5,588 (53.3%) | 4,889 (46.7%) |
Employment Industries by Sex in Prentiss County
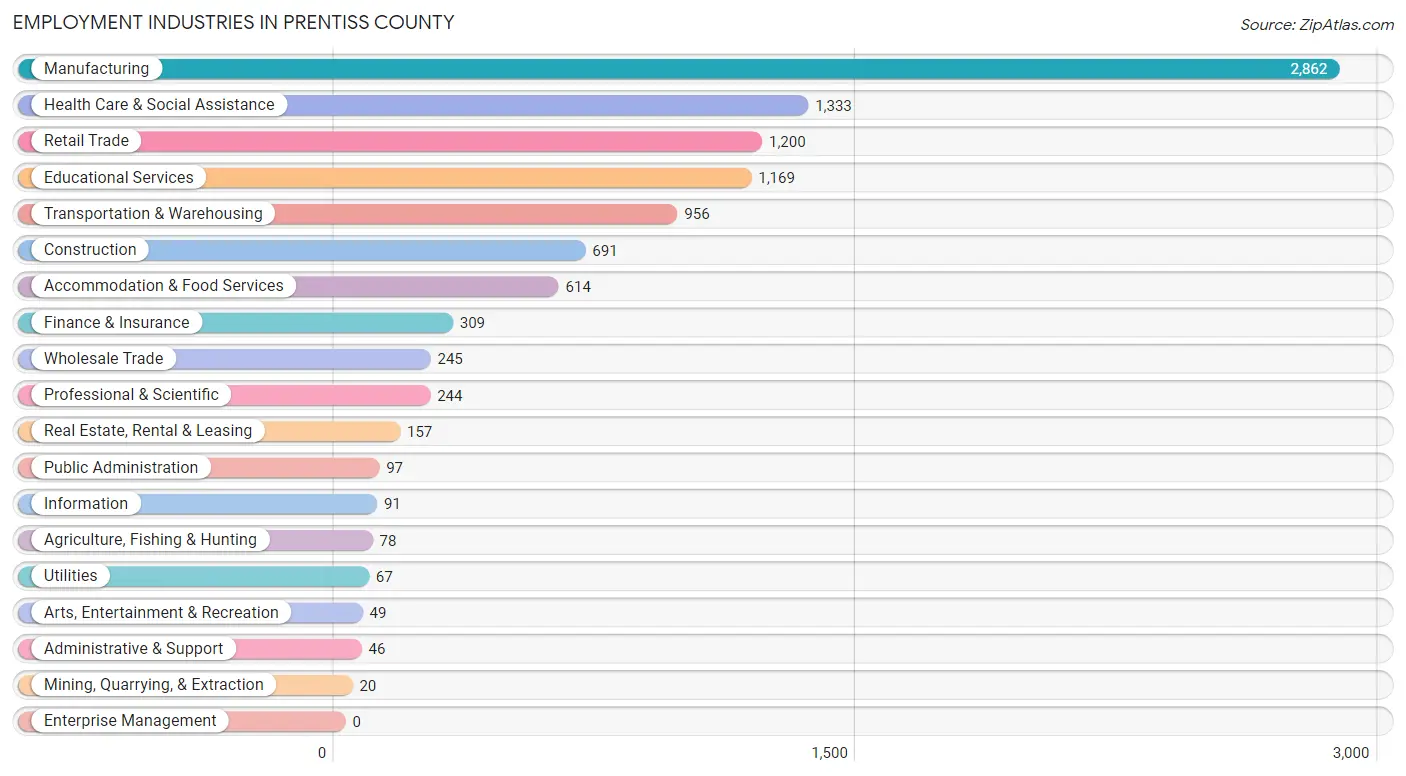
Employment Industries in Prentiss County
The major employment industries in Prentiss County include Manufacturing (2,862 | 27.3%), Health Care & Social Assistance (1,333 | 12.7%), Retail Trade (1,200 | 11.5%), Educational Services (1,169 | 11.2%), and Transportation & Warehousing (956 | 9.1%).
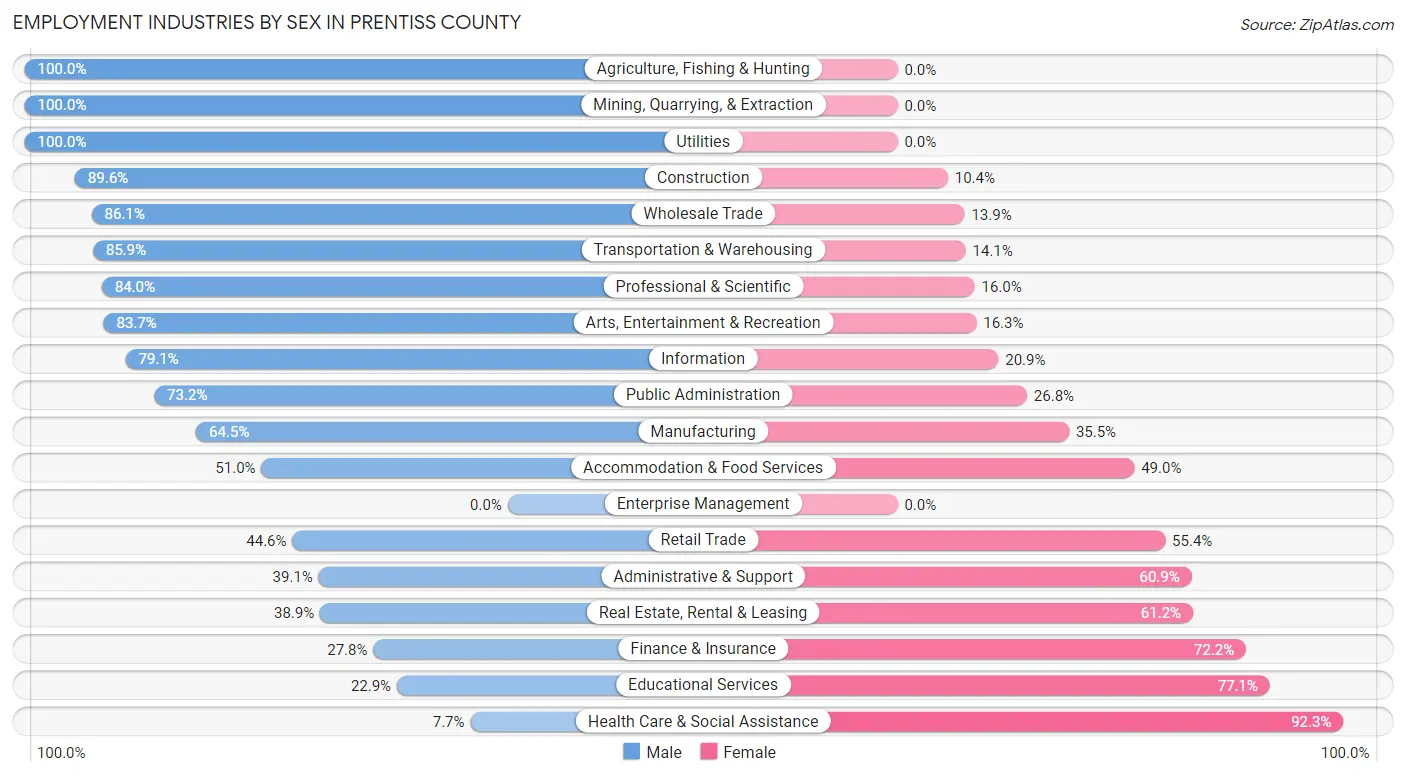
Employment Industries by Sex in Prentiss County
The Prentiss County industries that see more men than women are Agriculture, Fishing & Hunting (100.0%), Mining, Quarrying, & Extraction (100.0%), and Utilities (100.0%), whereas the industries that tend to have a higher number of women are Health Care & Social Assistance (92.3%), Educational Services (77.1%), and Finance & Insurance (72.2%).
| Industry | Male | Female |
| Agriculture, Fishing & Hunting | 78 (100.0%) | 0 (0.0%) |
| Mining, Quarrying, & Extraction | 20 (100.0%) | 0 (0.0%) |
| Construction | 619 (89.6%) | 72 (10.4%) |
| Manufacturing | 1,846 (64.5%) | 1,016 (35.5%) |
| Wholesale Trade | 211 (86.1%) | 34 (13.9%) |
| Retail Trade | 535 (44.6%) | 665 (55.4%) |
| Transportation & Warehousing | 821 (85.9%) | 135 (14.1%) |
| Utilities | 67 (100.0%) | 0 (0.0%) |
| Information | 72 (79.1%) | 19 (20.9%) |
| Finance & Insurance | 86 (27.8%) | 223 (72.2%) |
| Real Estate, Rental & Leasing | 61 (38.9%) | 96 (61.2%) |
| Professional & Scientific | 205 (84.0%) | 39 (16.0%) |
| Enterprise Management | 0 (0.0%) | 0 (0.0%) |
| Administrative & Support | 18 (39.1%) | 28 (60.9%) |
| Educational Services | 268 (22.9%) | 901 (77.1%) |
| Health Care & Social Assistance | 103 (7.7%) | 1,230 (92.3%) |
| Arts, Entertainment & Recreation | 41 (83.7%) | 8 (16.3%) |
| Accommodation & Food Services | 313 (51.0%) | 301 (49.0%) |
| Public Administration | 71 (73.2%) | 26 (26.8%) |
| Total | 5,588 (53.3%) | 4,889 (46.7%) |
Education in Prentiss County
School Enrollment in Prentiss County
The most common levels of schooling among the 6,255 students in Prentiss County are college / undergraduate (2,000 | 32.0%), elementary school (1,226 | 19.6%), and high school (1,166 | 18.6%).
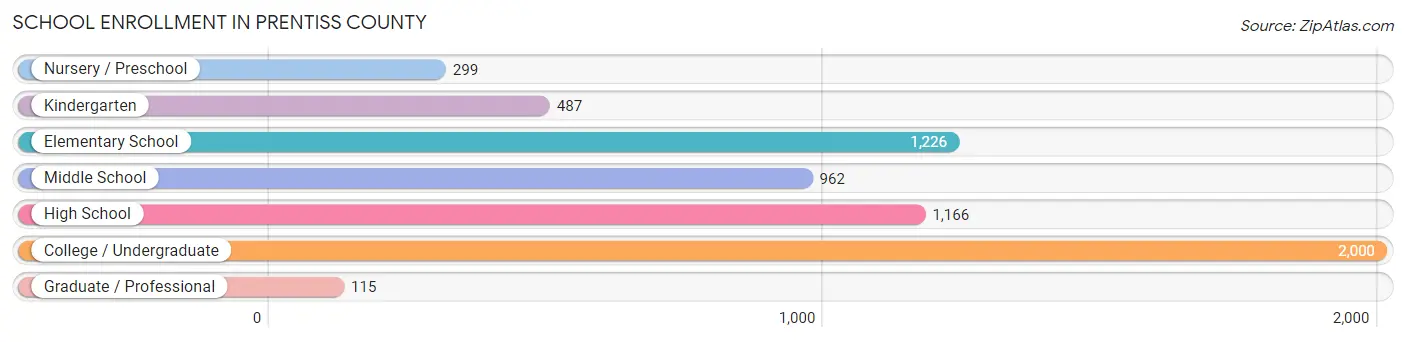
| School Level | # Students | % Students |
| Nursery / Preschool | 299 | 4.8% |
| Kindergarten | 487 | 7.8% |
| Elementary School | 1,226 | 19.6% |
| Middle School | 962 | 15.4% |
| High School | 1,166 | 18.6% |
| College / Undergraduate | 2,000 | 32.0% |
| Graduate / Professional | 115 | 1.8% |
| Total | 6,255 | 100.0% |
School Enrollment by Age by Funding Source in Prentiss County
Out of a total of 6,255 students who are enrolled in schools in Prentiss County, 469 (7.5%) attend a private institution, while the remaining 5,786 (92.5%) are enrolled in public schools. The age group of 20 to 24 year olds has the highest likelihood of being enrolled in private schools, with 139 (16.1% in the age bracket) enrolled. Conversely, the age group of 3 to 4 year olds has the lowest likelihood of being enrolled in a private school, with 232 (100.0% in the age bracket) attending a public institution.
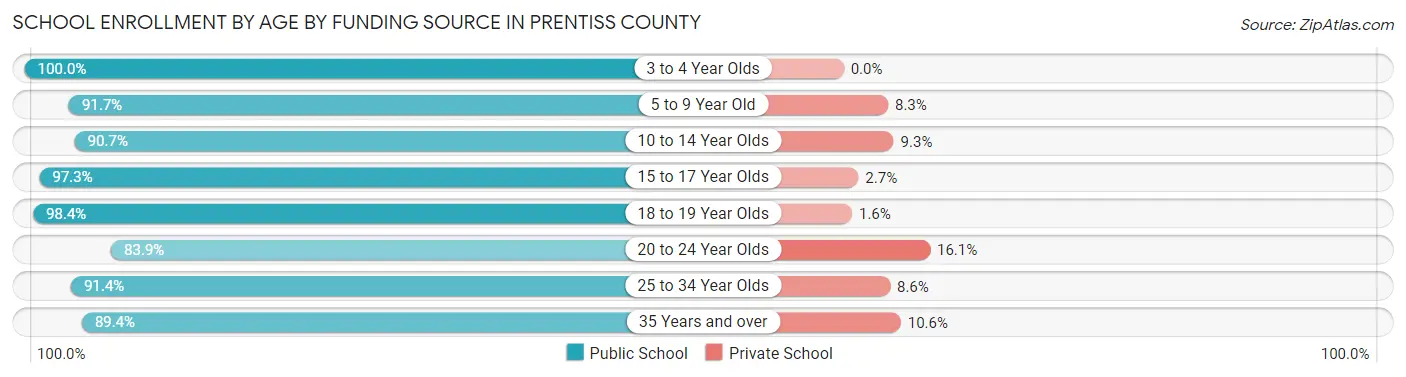
| Age Bracket | Public School | Private School |
| 3 to 4 Year Olds | 232 (100.0%) | 0 (0.0%) |
| 5 to 9 Year Old | 1,489 (91.7%) | 134 (8.3%) |
| 10 to 14 Year Olds | 1,091 (90.7%) | 112 (9.3%) |
| 15 to 17 Year Olds | 888 (97.3%) | 25 (2.7%) |
| 18 to 19 Year Olds | 883 (98.4%) | 14 (1.6%) |
| 20 to 24 Year Olds | 725 (83.9%) | 139 (16.1%) |
| 25 to 34 Year Olds | 349 (91.4%) | 33 (8.6%) |
| 35 Years and over | 126 (89.4%) | 15 (10.6%) |
| Total | 5,786 (92.5%) | 469 (7.5%) |
Educational Attainment by Field of Study in Prentiss County
Education (1,035 | 32.9%), business (500 | 15.9%), arts & humanities (350 | 11.1%), science & technology (333 | 10.6%), and bio, nature & agricultural (216 | 6.9%) are the most common fields of study among 3,142 individuals in Prentiss County who have obtained a bachelor's degree or higher.
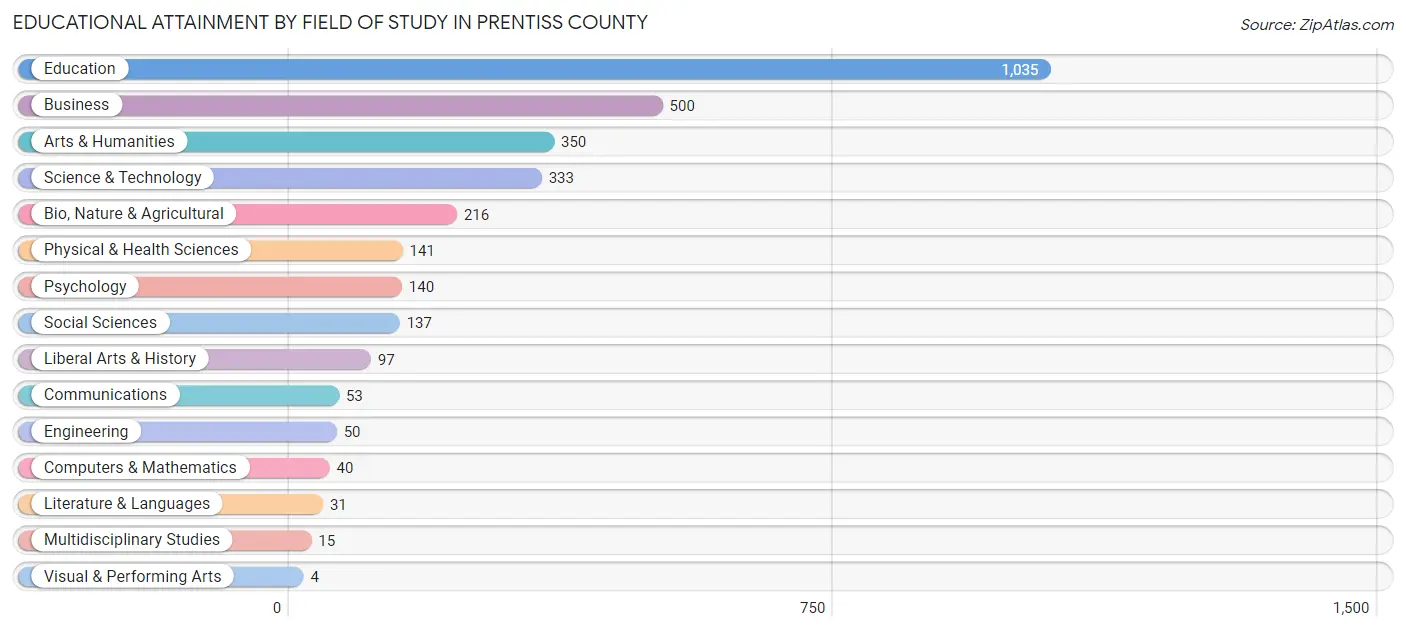
| Field of Study | # Graduates | % Graduates |
| Computers & Mathematics | 40 | 1.3% |
| Bio, Nature & Agricultural | 216 | 6.9% |
| Physical & Health Sciences | 141 | 4.5% |
| Psychology | 140 | 4.5% |
| Social Sciences | 137 | 4.4% |
| Engineering | 50 | 1.6% |
| Multidisciplinary Studies | 15 | 0.5% |
| Science & Technology | 333 | 10.6% |
| Business | 500 | 15.9% |
| Education | 1,035 | 32.9% |
| Literature & Languages | 31 | 1.0% |
| Liberal Arts & History | 97 | 3.1% |
| Visual & Performing Arts | 4 | 0.1% |
| Communications | 53 | 1.7% |
| Arts & Humanities | 350 | 11.1% |
| Total | 3,142 | 100.0% |
Transportation & Commute in Prentiss County
Vehicle Availability by Sex in Prentiss County
The most prevalent vehicle ownership categories in Prentiss County are males with 2 vehicles (2,095, accounting for 38.8%) and females with 2 vehicles (1,790, making up 43.6%).
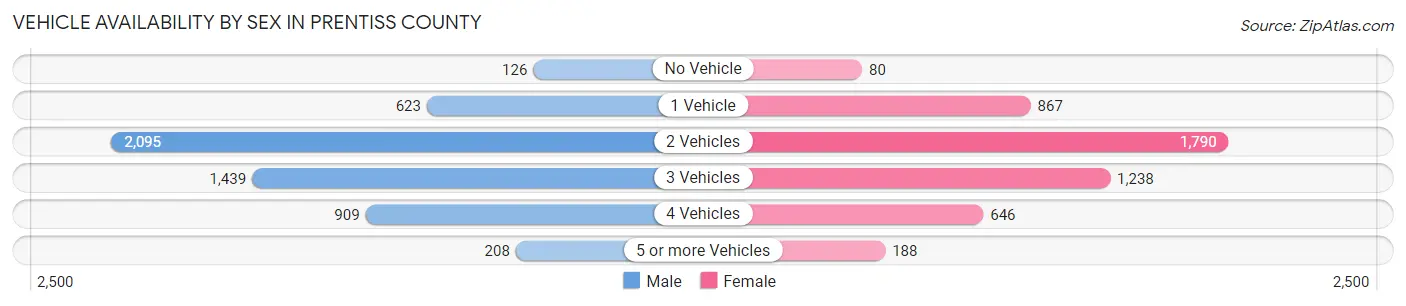
| Vehicles Available | Male | Female |
| No Vehicle | 126 (2.3%) | 80 (1.7%) |
| 1 Vehicle | 623 (11.5%) | 867 (18.0%) |
| 2 Vehicles | 2,095 (38.8%) | 1,790 (37.2%) |
| 3 Vehicles | 1,439 (26.7%) | 1,238 (25.7%) |
| 4 Vehicles | 909 (16.8%) | 646 (13.4%) |
| 5 or more Vehicles | 208 (3.8%) | 188 (3.9%) |
| Total | 5,400 (100.0%) | 4,809 (100.0%) |
Commute Time in Prentiss County
The most frequently occuring commute durations in Prentiss County are 10 to 14 minutes (2,109 commuters, 21.0%), 15 to 19 minutes (1,428 commuters, 14.2%), and 5 to 9 minutes (1,273 commuters, 12.7%).
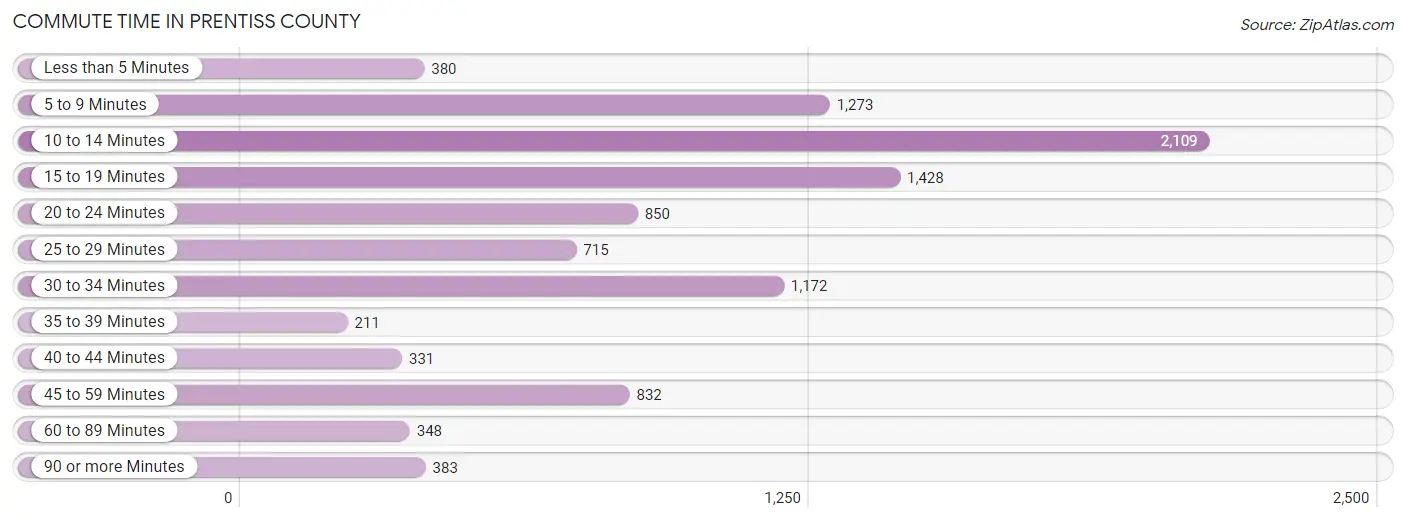
| Commute Time | # Commuters | % Commuters |
| Less than 5 Minutes | 380 | 3.8% |
| 5 to 9 Minutes | 1,273 | 12.7% |
| 10 to 14 Minutes | 2,109 | 21.0% |
| 15 to 19 Minutes | 1,428 | 14.2% |
| 20 to 24 Minutes | 850 | 8.5% |
| 25 to 29 Minutes | 715 | 7.1% |
| 30 to 34 Minutes | 1,172 | 11.7% |
| 35 to 39 Minutes | 211 | 2.1% |
| 40 to 44 Minutes | 331 | 3.3% |
| 45 to 59 Minutes | 832 | 8.3% |
| 60 to 89 Minutes | 348 | 3.5% |
| 90 or more Minutes | 383 | 3.8% |
Commute Time by Sex in Prentiss County
The most common commute times in Prentiss County are 10 to 14 minutes (986 commuters, 18.4%) for males and 10 to 14 minutes (1,123 commuters, 24.1%) for females.
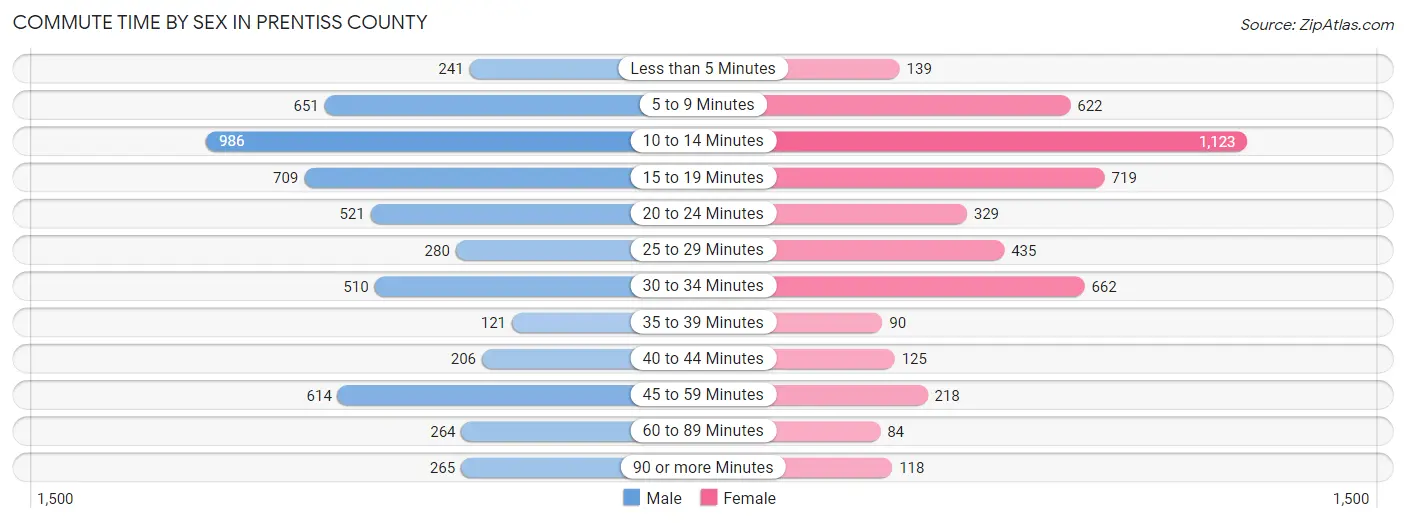
| Commute Time | Male | Female |
| Less than 5 Minutes | 241 (4.5%) | 139 (3.0%) |
| 5 to 9 Minutes | 651 (12.1%) | 622 (13.3%) |
| 10 to 14 Minutes | 986 (18.4%) | 1,123 (24.1%) |
| 15 to 19 Minutes | 709 (13.2%) | 719 (15.4%) |
| 20 to 24 Minutes | 521 (9.7%) | 329 (7.0%) |
| 25 to 29 Minutes | 280 (5.2%) | 435 (9.3%) |
| 30 to 34 Minutes | 510 (9.5%) | 662 (14.2%) |
| 35 to 39 Minutes | 121 (2.2%) | 90 (1.9%) |
| 40 to 44 Minutes | 206 (3.8%) | 125 (2.7%) |
| 45 to 59 Minutes | 614 (11.4%) | 218 (4.7%) |
| 60 to 89 Minutes | 264 (4.9%) | 84 (1.8%) |
| 90 or more Minutes | 265 (4.9%) | 118 (2.5%) |
Time of Departure to Work by Sex in Prentiss County
The most frequent times of departure to work in Prentiss County are 6:30 AM to 6:59 AM (987, 18.4%) for males and 7:00 AM to 7:29 AM (939, 20.1%) for females.
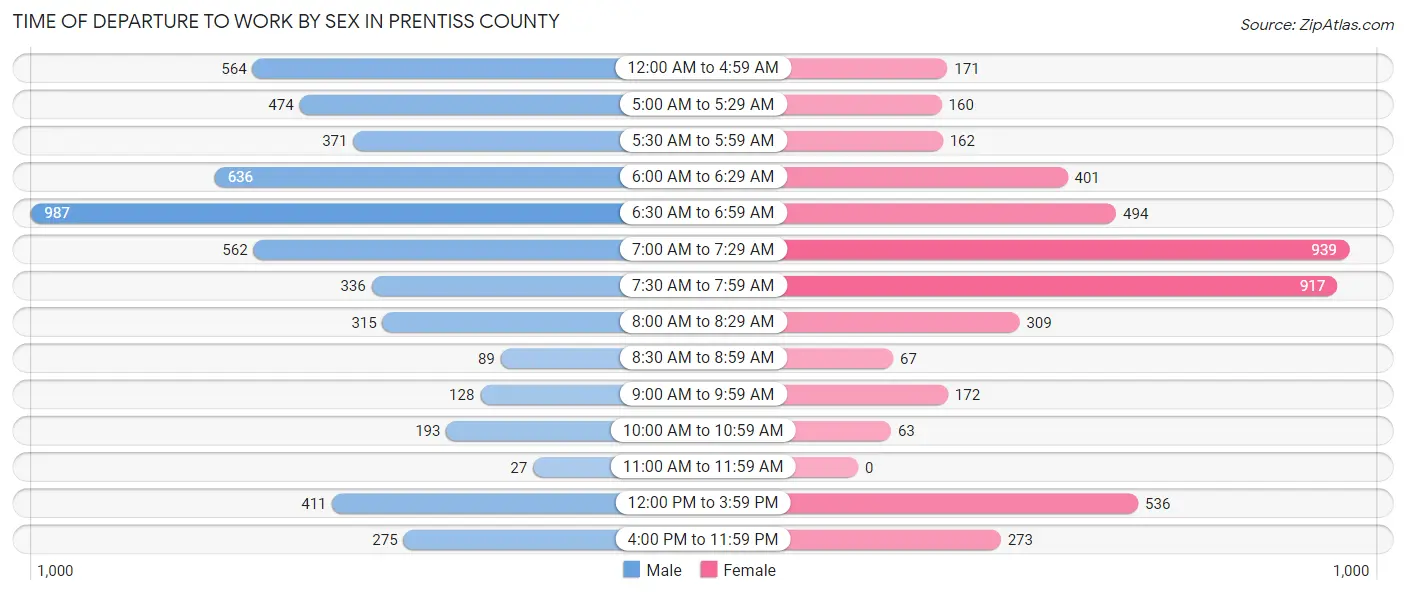
| Time of Departure | Male | Female |
| 12:00 AM to 4:59 AM | 564 (10.5%) | 171 (3.7%) |
| 5:00 AM to 5:29 AM | 474 (8.8%) | 160 (3.4%) |
| 5:30 AM to 5:59 AM | 371 (6.9%) | 162 (3.5%) |
| 6:00 AM to 6:29 AM | 636 (11.8%) | 401 (8.6%) |
| 6:30 AM to 6:59 AM | 987 (18.4%) | 494 (10.6%) |
| 7:00 AM to 7:29 AM | 562 (10.5%) | 939 (20.1%) |
| 7:30 AM to 7:59 AM | 336 (6.3%) | 917 (19.7%) |
| 8:00 AM to 8:29 AM | 315 (5.9%) | 309 (6.6%) |
| 8:30 AM to 8:59 AM | 89 (1.7%) | 67 (1.4%) |
| 9:00 AM to 9:59 AM | 128 (2.4%) | 172 (3.7%) |
| 10:00 AM to 10:59 AM | 193 (3.6%) | 63 (1.3%) |
| 11:00 AM to 11:59 AM | 27 (0.5%) | 0 (0.0%) |
| 12:00 PM to 3:59 PM | 411 (7.7%) | 536 (11.5%) |
| 4:00 PM to 11:59 PM | 275 (5.1%) | 273 (5.9%) |
| Total | 5,368 (100.0%) | 4,664 (100.0%) |
Housing Occupancy in Prentiss County
Occupancy by Ownership in Prentiss County
Of the total 9,296 dwellings in Prentiss County, owner-occupied units account for 7,213 (77.6%), while renter-occupied units make up 2,083 (22.4%).
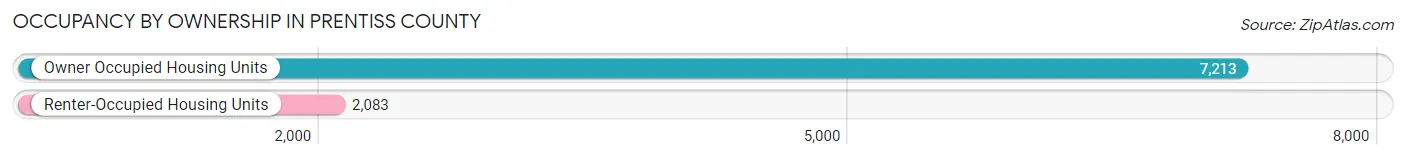
| Occupancy | # Housing Units | % Housing Units |
| Owner Occupied Housing Units | 7,213 | 77.6% |
| Renter-Occupied Housing Units | 2,083 | 22.4% |
| Total Occupied Housing Units | 9,296 | 100.0% |
Occupancy by Household Size in Prentiss County
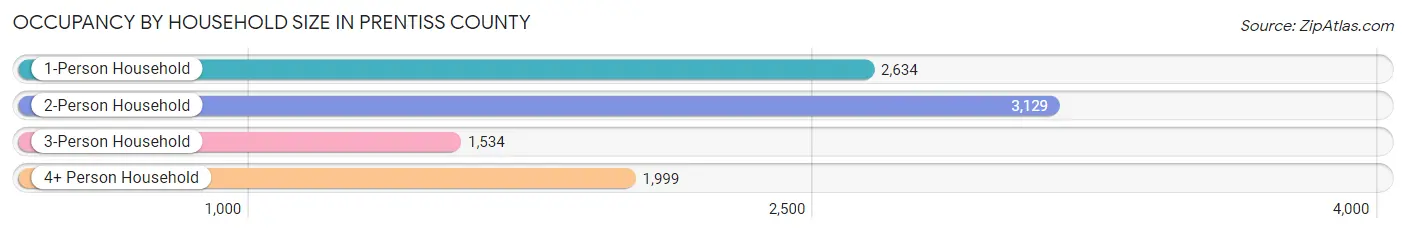
| Household Size | # Housing Units | % Housing Units |
| 1-Person Household | 2,634 | 28.3% |
| 2-Person Household | 3,129 | 33.7% |
| 3-Person Household | 1,534 | 16.5% |
| 4+ Person Household | 1,999 | 21.5% |
| Total Housing Units | 9,296 | 100.0% |
Occupancy by Ownership by Household Size in Prentiss County
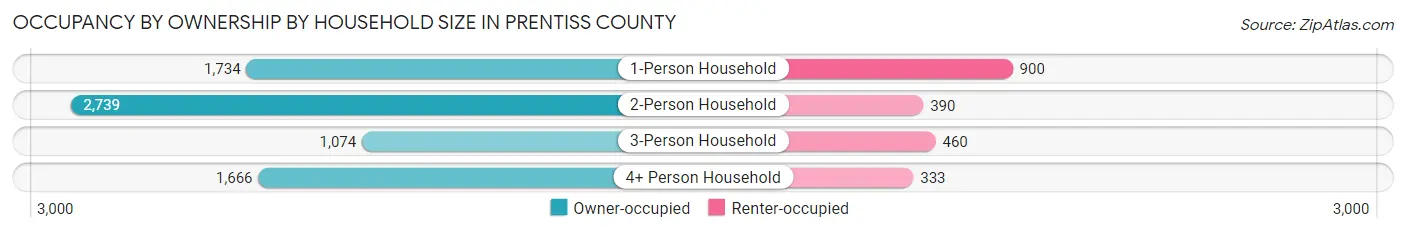
| Household Size | Owner-occupied | Renter-occupied |
| 1-Person Household | 1,734 (65.8%) | 900 (34.2%) |
| 2-Person Household | 2,739 (87.5%) | 390 (12.5%) |
| 3-Person Household | 1,074 (70.0%) | 460 (30.0%) |
| 4+ Person Household | 1,666 (83.3%) | 333 (16.7%) |
| Total Housing Units | 7,213 (77.6%) | 2,083 (22.4%) |
Occupancy by Educational Attainment in Prentiss County
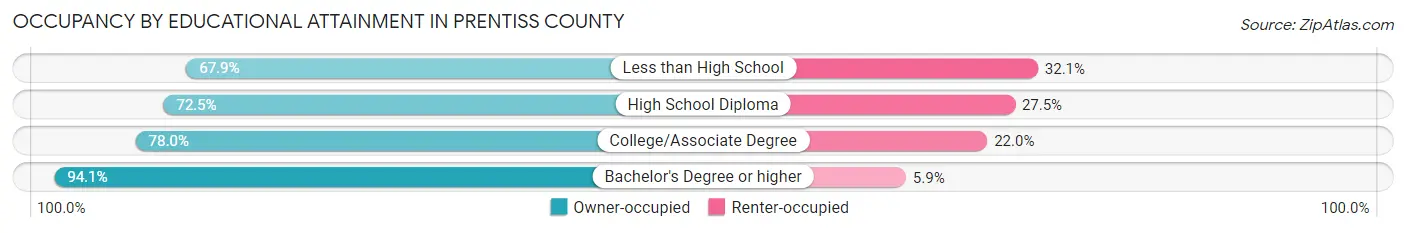
| Household Size | Owner-occupied | Renter-occupied |
| Less than High School | 998 (67.9%) | 471 (32.1%) |
| High School Diploma | 1,992 (72.5%) | 756 (27.5%) |
| College/Associate Degree | 2,692 (78.0%) | 760 (22.0%) |
| Bachelor's Degree or higher | 1,531 (94.1%) | 96 (5.9%) |
Occupancy by Age of Householder in Prentiss County
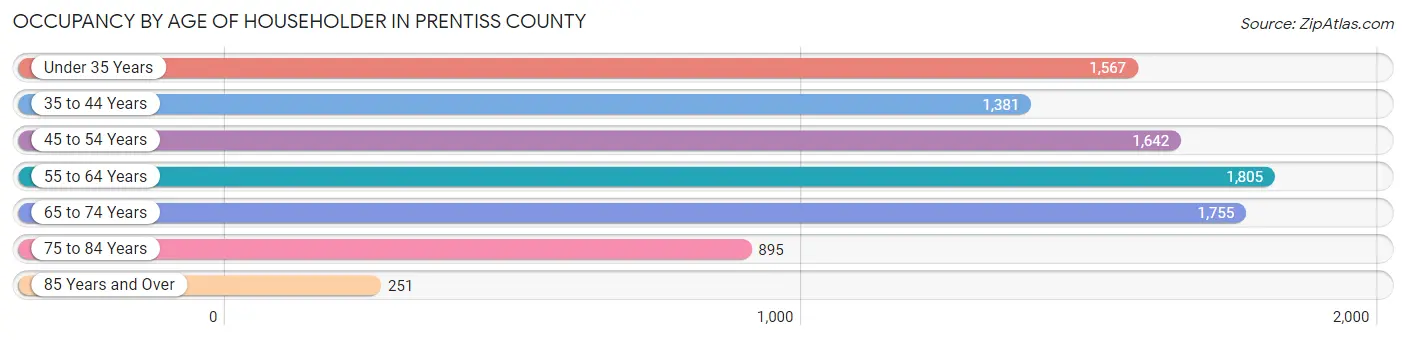
| Age Bracket | # Households | % Households |
| Under 35 Years | 1,567 | 16.9% |
| 35 to 44 Years | 1,381 | 14.9% |
| 45 to 54 Years | 1,642 | 17.7% |
| 55 to 64 Years | 1,805 | 19.4% |
| 65 to 74 Years | 1,755 | 18.9% |
| 75 to 84 Years | 895 | 9.6% |
| 85 Years and Over | 251 | 2.7% |
| Total | 9,296 | 100.0% |
Housing Finances in Prentiss County
Median Income by Occupancy in Prentiss County
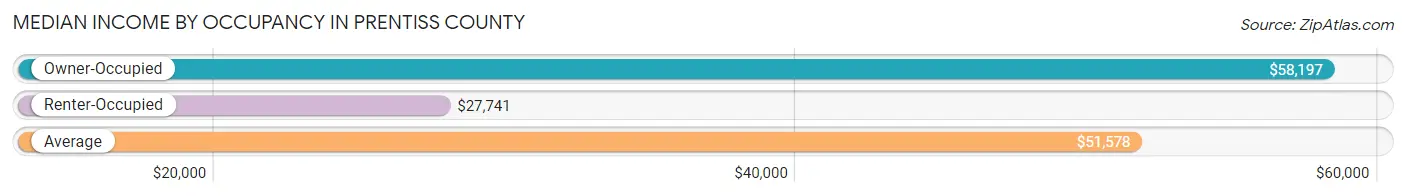
| Occupancy Type | # Households | Median Income |
| Owner-Occupied | 7,213 (77.6%) | $58,197 |
| Renter-Occupied | 2,083 (22.4%) | $27,741 |
| Average | 9,296 (100.0%) | $51,578 |
Occupancy by Householder Income Bracket in Prentiss County
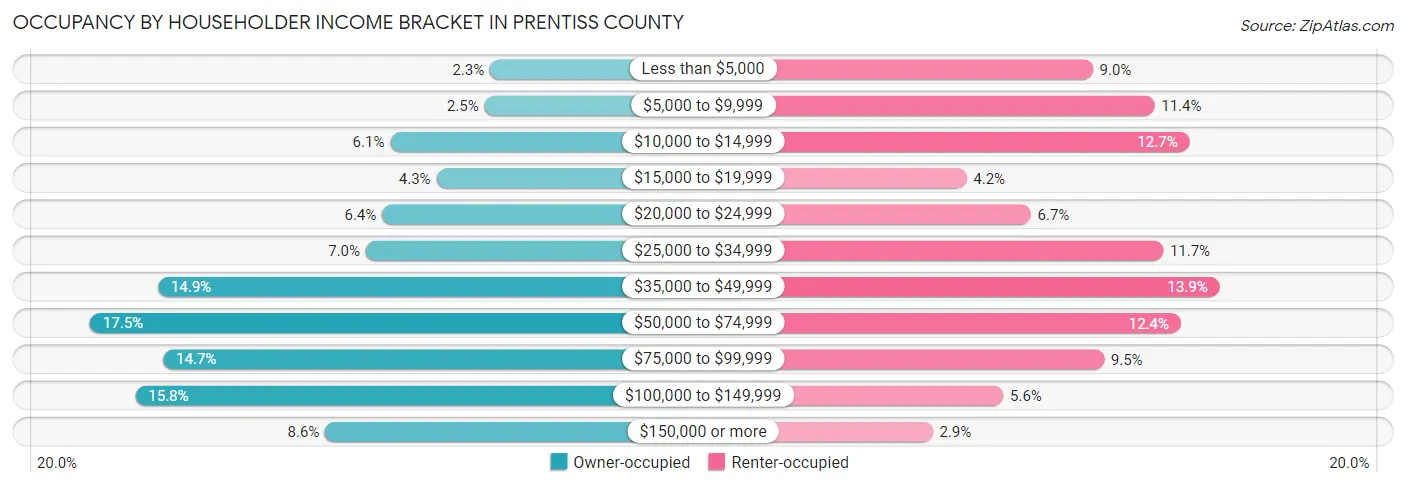
| Income Bracket | Owner-occupied | Renter-occupied |
| Less than $5,000 | 164 (2.3%) | 188 (9.0%) |
| $5,000 to $9,999 | 179 (2.5%) | 237 (11.4%) |
| $10,000 to $14,999 | 438 (6.1%) | 265 (12.7%) |
| $15,000 to $19,999 | 311 (4.3%) | 88 (4.2%) |
| $20,000 to $24,999 | 460 (6.4%) | 139 (6.7%) |
| $25,000 to $34,999 | 505 (7.0%) | 244 (11.7%) |
| $35,000 to $49,999 | 1,076 (14.9%) | 289 (13.9%) |
| $50,000 to $74,999 | 1,263 (17.5%) | 258 (12.4%) |
| $75,000 to $99,999 | 1,062 (14.7%) | 197 (9.5%) |
| $100,000 to $149,999 | 1,138 (15.8%) | 117 (5.6%) |
| $150,000 or more | 617 (8.6%) | 61 (2.9%) |
| Total | 7,213 (100.0%) | 2,083 (100.0%) |
Monthly Housing Cost Tiers in Prentiss County
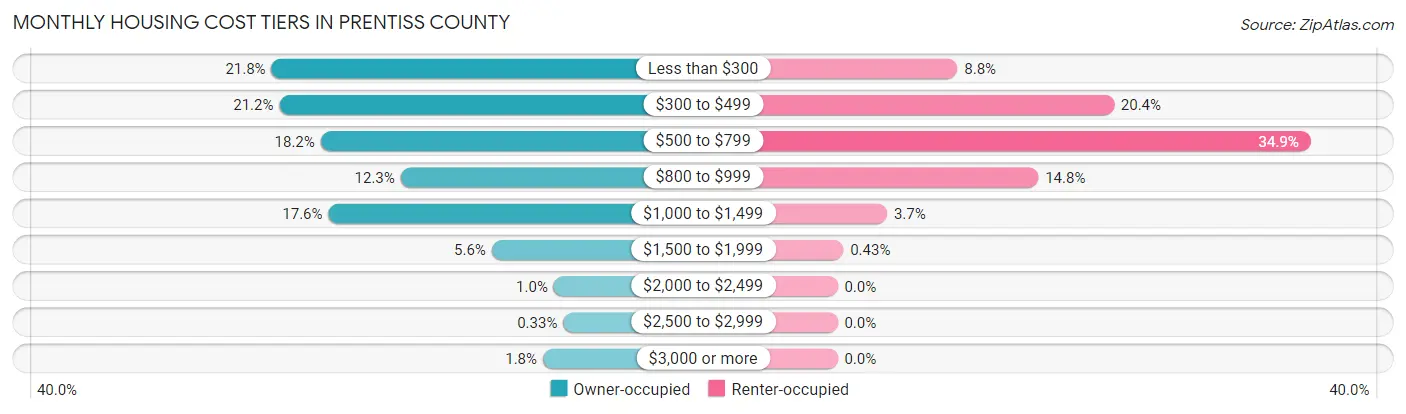
| Monthly Cost | Owner-occupied | Renter-occupied |
| Less than $300 | 1,574 (21.8%) | 184 (8.8%) |
| $300 to $499 | 1,532 (21.2%) | 424 (20.4%) |
| $500 to $799 | 1,313 (18.2%) | 726 (34.8%) |
| $800 to $999 | 888 (12.3%) | 308 (14.8%) |
| $1,000 to $1,499 | 1,272 (17.6%) | 76 (3.6%) |
| $1,500 to $1,999 | 404 (5.6%) | 9 (0.4%) |
| $2,000 to $2,499 | 74 (1.0%) | 0 (0.0%) |
| $2,500 to $2,999 | 24 (0.3%) | 0 (0.0%) |
| $3,000 or more | 132 (1.8%) | 0 (0.0%) |
| Total | 7,213 (100.0%) | 2,083 (100.0%) |
Physical Housing Characteristics in Prentiss County
Housing Structures in Prentiss County
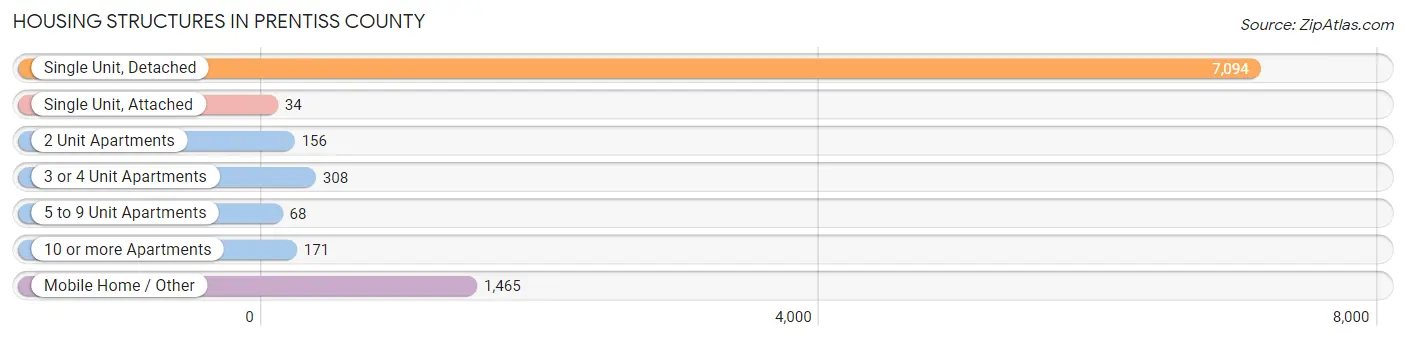
| Structure Type | # Housing Units | % Housing Units |
| Single Unit, Detached | 7,094 | 76.3% |
| Single Unit, Attached | 34 | 0.4% |
| 2 Unit Apartments | 156 | 1.7% |
| 3 or 4 Unit Apartments | 308 | 3.3% |
| 5 to 9 Unit Apartments | 68 | 0.7% |
| 10 or more Apartments | 171 | 1.8% |
| Mobile Home / Other | 1,465 | 15.8% |
| Total | 9,296 | 100.0% |
Housing Structures by Occupancy in Prentiss County
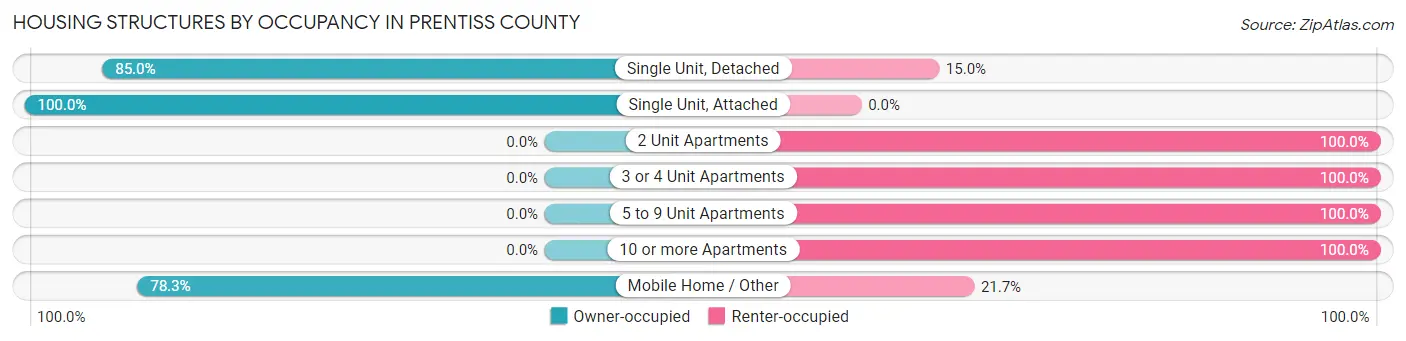
| Structure Type | Owner-occupied | Renter-occupied |
| Single Unit, Detached | 6,032 (85.0%) | 1,062 (15.0%) |
| Single Unit, Attached | 34 (100.0%) | 0 (0.0%) |
| 2 Unit Apartments | 0 (0.0%) | 156 (100.0%) |
| 3 or 4 Unit Apartments | 0 (0.0%) | 308 (100.0%) |
| 5 to 9 Unit Apartments | 0 (0.0%) | 68 (100.0%) |
| 10 or more Apartments | 0 (0.0%) | 171 (100.0%) |
| Mobile Home / Other | 1,147 (78.3%) | 318 (21.7%) |
| Total | 7,213 (77.6%) | 2,083 (22.4%) |
Housing Structures by Number of Rooms in Prentiss County
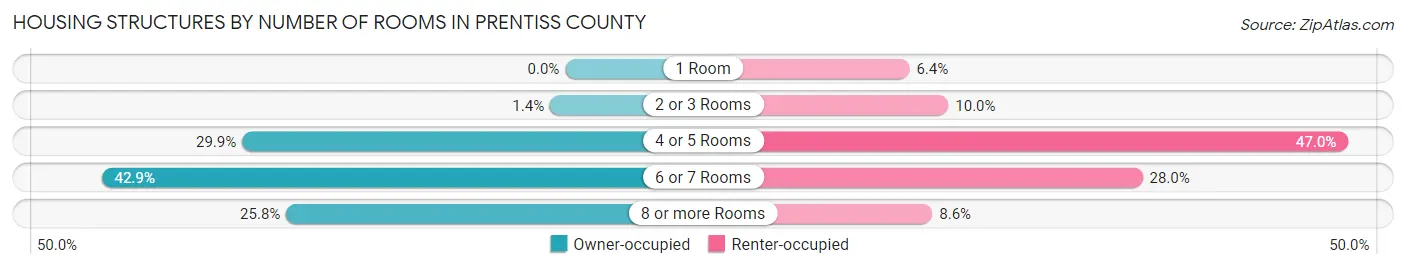
| Number of Rooms | Owner-occupied | Renter-occupied |
| 1 Room | 0 (0.0%) | 134 (6.4%) |
| 2 or 3 Rooms | 102 (1.4%) | 209 (10.0%) |
| 4 or 5 Rooms | 2,156 (29.9%) | 979 (47.0%) |
| 6 or 7 Rooms | 3,093 (42.9%) | 583 (28.0%) |
| 8 or more Rooms | 1,862 (25.8%) | 178 (8.6%) |
| Total | 7,213 (100.0%) | 2,083 (100.0%) |
Housing Structure by Heating Type in Prentiss County
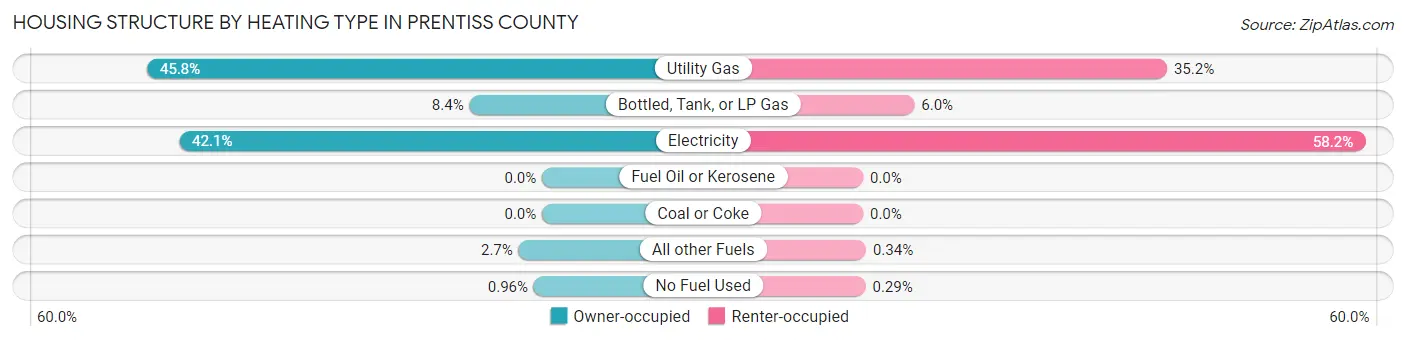
| Heating Type | Owner-occupied | Renter-occupied |
| Utility Gas | 3,305 (45.8%) | 734 (35.2%) |
| Bottled, Tank, or LP Gas | 607 (8.4%) | 124 (5.9%) |
| Electricity | 3,036 (42.1%) | 1,212 (58.2%) |
| Fuel Oil or Kerosene | 0 (0.0%) | 0 (0.0%) |
| Coal or Coke | 0 (0.0%) | 0 (0.0%) |
| All other Fuels | 196 (2.7%) | 7 (0.3%) |
| No Fuel Used | 69 (1.0%) | 6 (0.3%) |
| Total | 7,213 (100.0%) | 2,083 (100.0%) |
Household Vehicle Usage in Prentiss County
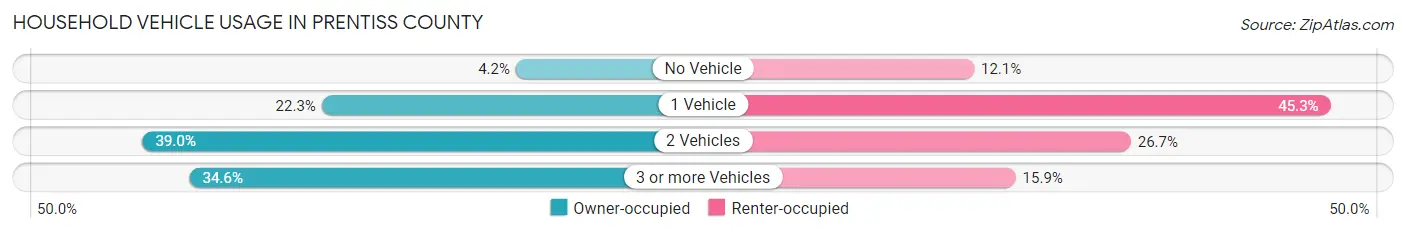
| Vehicles per Household | Owner-occupied | Renter-occupied |
| No Vehicle | 299 (4.2%) | 251 (12.0%) |
| 1 Vehicle | 1,606 (22.3%) | 944 (45.3%) |
| 2 Vehicles | 2,812 (39.0%) | 556 (26.7%) |
| 3 or more Vehicles | 2,496 (34.6%) | 332 (15.9%) |
| Total | 7,213 (100.0%) | 2,083 (100.0%) |
Real Estate & Mortgages in Prentiss County
Real Estate and Mortgage Overview in Prentiss County
| Characteristic | Without Mortgage | With Mortgage |
| Housing Units | 4,010 | 3,203 |
| Median Property Value | $105,600 | $120,800 |
| Median Household Income | $46,071 | $285 |
| Monthly Housing Costs | $342 | $121 |
| Real Estate Taxes | $658 | $589 |
Property Value by Mortgage Status in Prentiss County
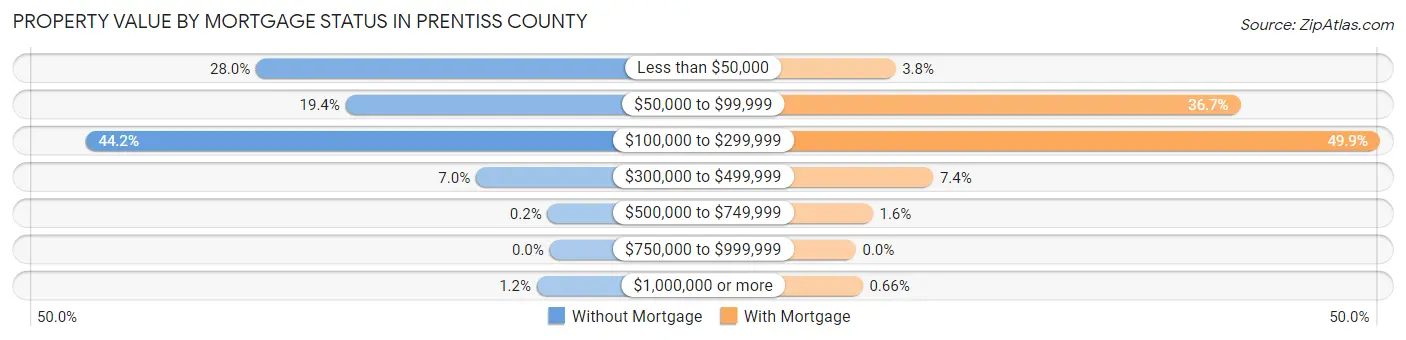
| Property Value | Without Mortgage | With Mortgage |
| Less than $50,000 | 1,121 (28.0%) | 121 (3.8%) |
| $50,000 to $99,999 | 779 (19.4%) | 1,174 (36.6%) |
| $100,000 to $299,999 | 1,772 (44.2%) | 1,599 (49.9%) |
| $300,000 to $499,999 | 281 (7.0%) | 236 (7.4%) |
| $500,000 to $749,999 | 8 (0.2%) | 52 (1.6%) |
| $750,000 to $999,999 | 0 (0.0%) | 0 (0.0%) |
| $1,000,000 or more | 49 (1.2%) | 21 (0.7%) |
| Total | 4,010 (100.0%) | 3,203 (100.0%) |
Household Income by Mortgage Status in Prentiss County
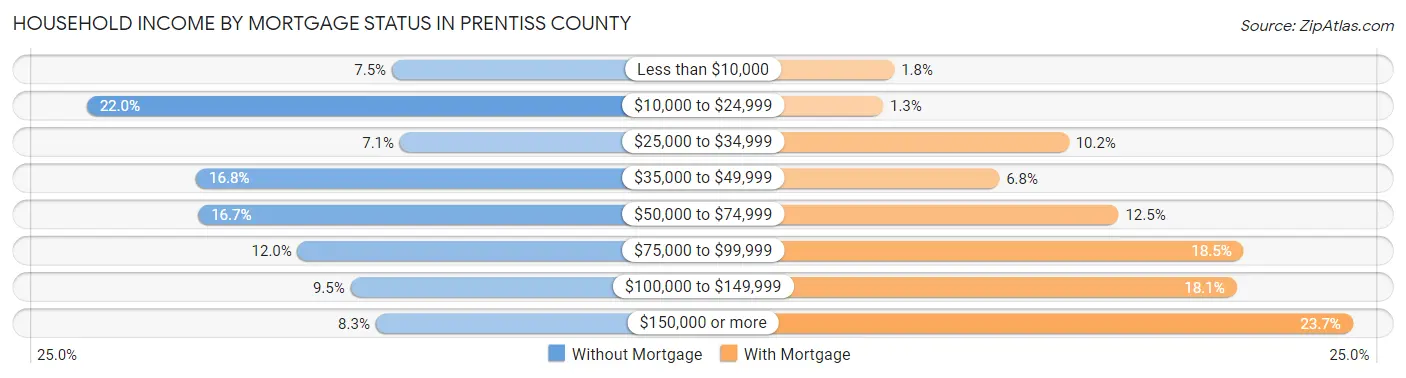
| Household Income | Without Mortgage | With Mortgage |
| Less than $10,000 | 301 (7.5%) | 59 (1.8%) |
| $10,000 to $24,999 | 884 (22.0%) | 42 (1.3%) |
| $25,000 to $34,999 | 286 (7.1%) | 325 (10.2%) |
| $35,000 to $49,999 | 675 (16.8%) | 219 (6.8%) |
| $50,000 to $74,999 | 671 (16.7%) | 401 (12.5%) |
| $75,000 to $99,999 | 481 (12.0%) | 592 (18.5%) |
| $100,000 to $149,999 | 380 (9.5%) | 581 (18.1%) |
| $150,000 or more | 332 (8.3%) | 758 (23.7%) |
| Total | 4,010 (100.0%) | 3,203 (100.0%) |
Property Value to Household Income Ratio in Prentiss County
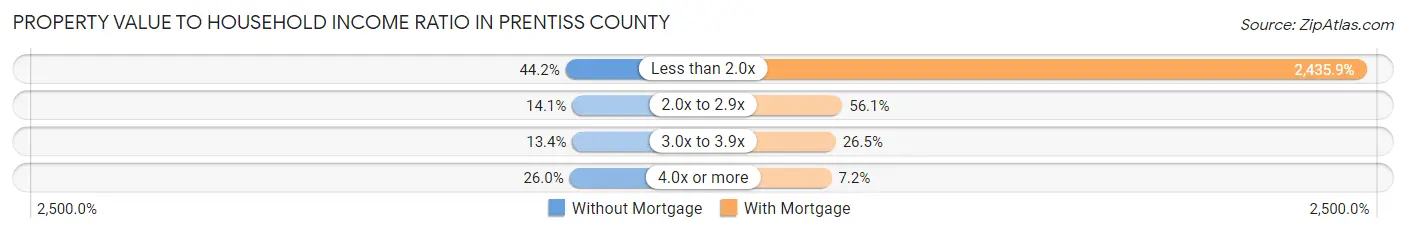
| Value-to-Income Ratio | Without Mortgage | With Mortgage |
| Less than 2.0x | 1,774 (44.2%) | 78,021 (2,435.9%) |
| 2.0x to 2.9x | 564 (14.1%) | 1,796 (56.1%) |
| 3.0x to 3.9x | 536 (13.4%) | 849 (26.5%) |
| 4.0x or more | 1,042 (26.0%) | 230 (7.2%) |
| Total | 4,010 (100.0%) | 3,203 (100.0%) |
Real Estate Taxes by Mortgage Status in Prentiss County
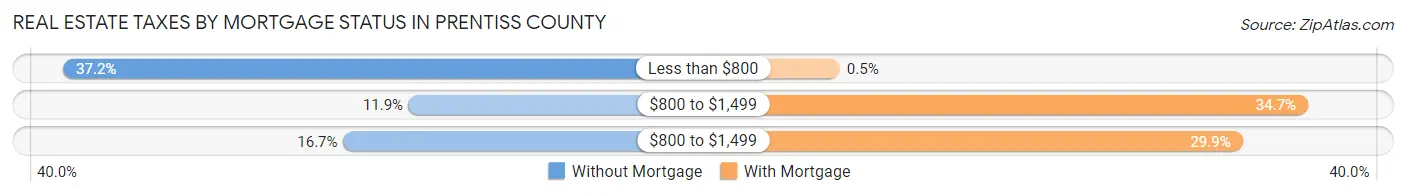
| Property Taxes | Without Mortgage | With Mortgage |
| Less than $800 | 1,491 (37.2%) | 16 (0.5%) |
| $800 to $1,499 | 478 (11.9%) | 1,111 (34.7%) |
| $800 to $1,499 | 670 (16.7%) | 958 (29.9%) |
| Total | 4,010 (100.0%) | 3,203 (100.0%) |
Health & Disability in Prentiss County
Health Insurance Coverage by Age in Prentiss County
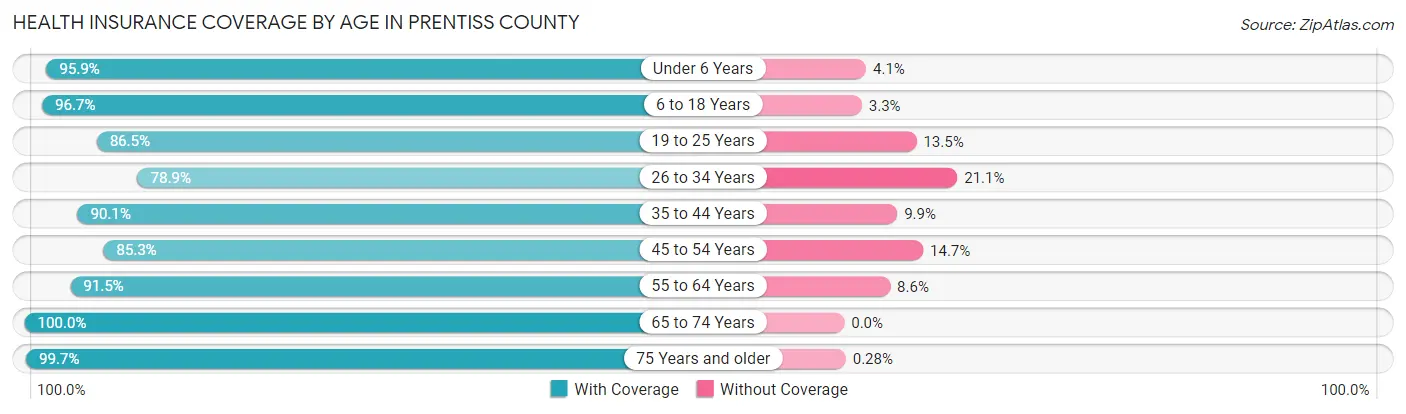
| Age Bracket | With Coverage | Without Coverage |
| Under 6 Years | 2,075 (95.9%) | 88 (4.1%) |
| 6 to 18 Years | 3,702 (96.7%) | 125 (3.3%) |
| 19 to 25 Years | 2,238 (86.5%) | 348 (13.5%) |
| 26 to 34 Years | 2,295 (78.9%) | 613 (21.1%) |
| 35 to 44 Years | 2,592 (90.1%) | 284 (9.9%) |
| 45 to 54 Years | 2,519 (85.3%) | 434 (14.7%) |
| 55 to 64 Years | 2,793 (91.4%) | 261 (8.6%) |
| 65 to 74 Years | 2,512 (100.0%) | 0 (0.0%) |
| 75 Years and older | 1,770 (99.7%) | 5 (0.3%) |
| Total | 22,496 (91.2%) | 2,158 (8.7%) |
Health Insurance Coverage by Citizenship Status in Prentiss County
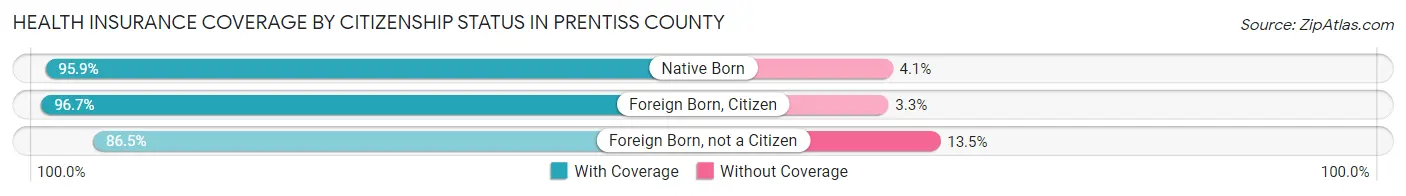
| Citizenship Status | With Coverage | Without Coverage |
| Native Born | 2,075 (95.9%) | 88 (4.1%) |
| Foreign Born, Citizen | 3,702 (96.7%) | 125 (3.3%) |
| Foreign Born, not a Citizen | 2,238 (86.5%) | 348 (13.5%) |
Health Insurance Coverage by Household Income in Prentiss County
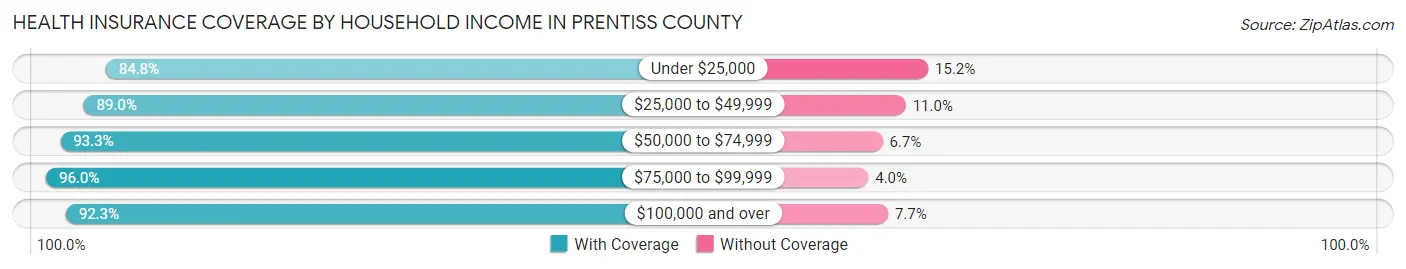
| Household Income | With Coverage | Without Coverage |
| Under $25,000 | 3,400 (84.8%) | 611 (15.2%) |
| $25,000 to $49,999 | 4,504 (89.0%) | 559 (11.0%) |
| $50,000 to $74,999 | 4,205 (93.3%) | 301 (6.7%) |
| $75,000 to $99,999 | 3,596 (96.0%) | 151 (4.0%) |
| $100,000 and over | 5,903 (92.3%) | 494 (7.7%) |
Public vs Private Health Insurance Coverage by Age in Prentiss County
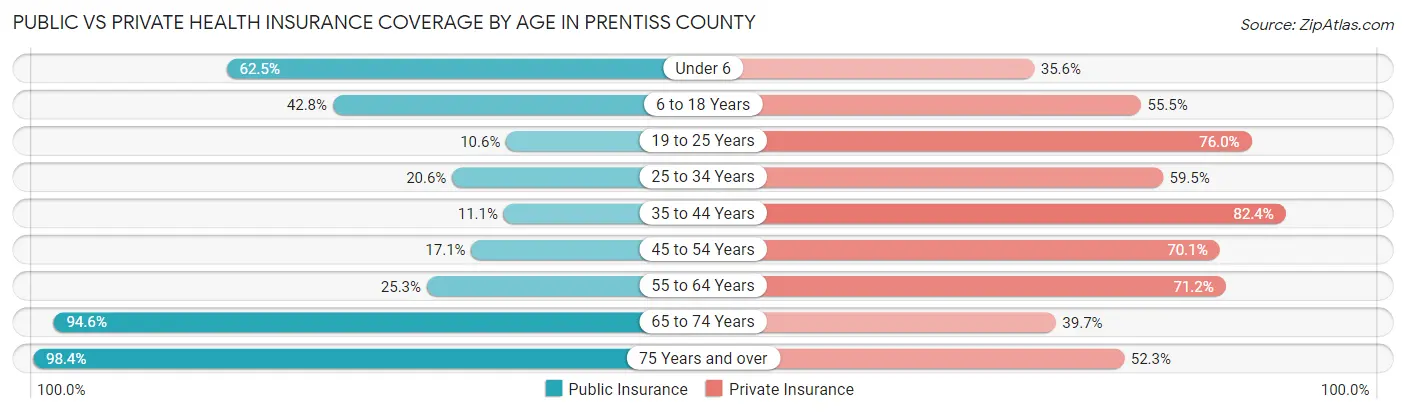
| Age Bracket | Public Insurance | Private Insurance |
| Under 6 | 1,352 (62.5%) | 771 (35.6%) |
| 6 to 18 Years | 1,637 (42.8%) | 2,122 (55.4%) |
| 19 to 25 Years | 274 (10.6%) | 1,966 (76.0%) |
| 25 to 34 Years | 600 (20.6%) | 1,731 (59.5%) |
| 35 to 44 Years | 318 (11.1%) | 2,369 (82.4%) |
| 45 to 54 Years | 504 (17.1%) | 2,070 (70.1%) |
| 55 to 64 Years | 774 (25.3%) | 2,175 (71.2%) |
| 65 to 74 Years | 2,377 (94.6%) | 996 (39.7%) |
| 75 Years and over | 1,747 (98.4%) | 929 (52.3%) |
| Total | 9,583 (38.9%) | 15,129 (61.4%) |
Disability Status by Sex by Age in Prentiss County
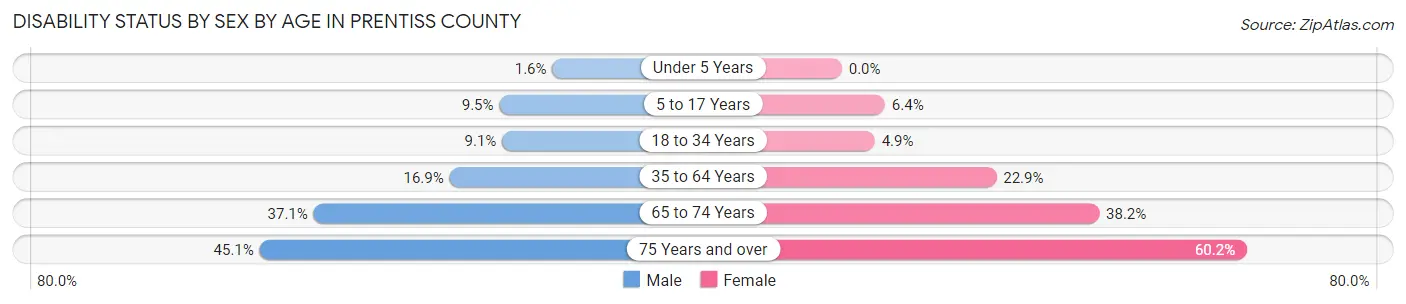
| Age Bracket | Male | Female |
| Under 5 Years | 14 (1.6%) | 0 (0.0%) |
| 5 to 17 Years | 192 (9.5%) | 127 (6.4%) |
| 18 to 34 Years | 275 (9.1%) | 144 (4.9%) |
| 35 to 64 Years | 741 (16.9%) | 1,032 (22.9%) |
| 65 to 74 Years | 419 (37.1%) | 528 (38.2%) |
| 75 Years and over | 308 (45.1%) | 657 (60.2%) |
Disability Class by Sex by Age in Prentiss County
Disability Class: Hearing Difficulty
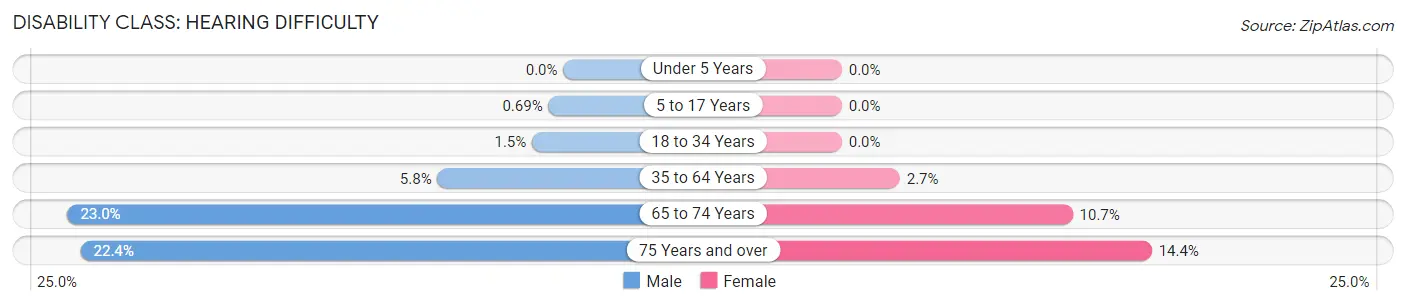
| Age Bracket | Male | Female |
| Under 5 Years | 0 (0.0%) | 0 (0.0%) |
| 5 to 17 Years | 14 (0.7%) | 0 (0.0%) |
| 18 to 34 Years | 44 (1.5%) | 0 (0.0%) |
| 35 to 64 Years | 256 (5.8%) | 121 (2.7%) |
| 65 to 74 Years | 260 (23.0%) | 148 (10.7%) |
| 75 Years and over | 153 (22.4%) | 157 (14.4%) |
Disability Class: Vision Difficulty
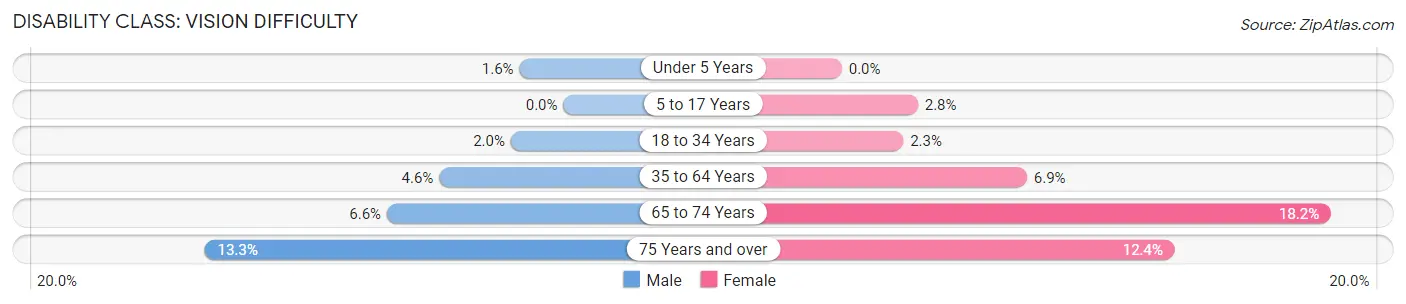
| Age Bracket | Male | Female |
| Under 5 Years | 14 (1.6%) | 0 (0.0%) |
| 5 to 17 Years | 0 (0.0%) | 56 (2.8%) |
| 18 to 34 Years | 59 (1.9%) | 67 (2.3%) |
| 35 to 64 Years | 202 (4.6%) | 309 (6.9%) |
| 65 to 74 Years | 74 (6.6%) | 251 (18.2%) |
| 75 Years and over | 91 (13.3%) | 135 (12.4%) |
Disability Class: Cognitive Difficulty
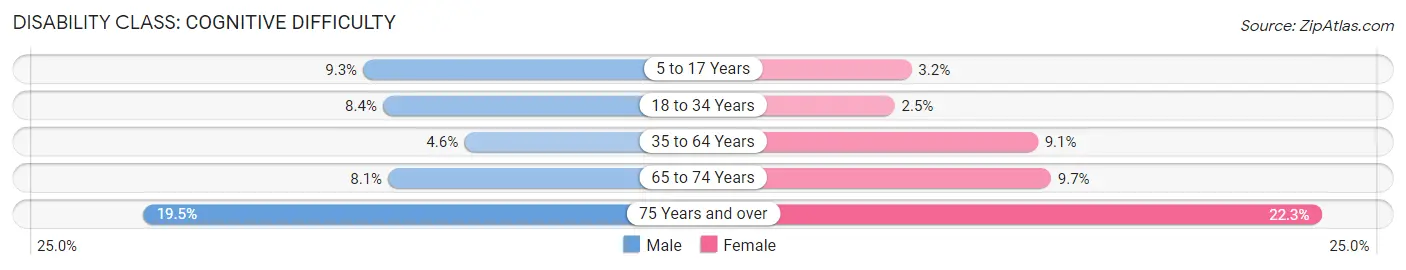
| Age Bracket | Male | Female |
| 5 to 17 Years | 188 (9.3%) | 64 (3.2%) |
| 18 to 34 Years | 254 (8.4%) | 72 (2.5%) |
| 35 to 64 Years | 202 (4.6%) | 409 (9.1%) |
| 65 to 74 Years | 92 (8.1%) | 134 (9.7%) |
| 75 Years and over | 133 (19.5%) | 243 (22.3%) |
Disability Class: Ambulatory Difficulty
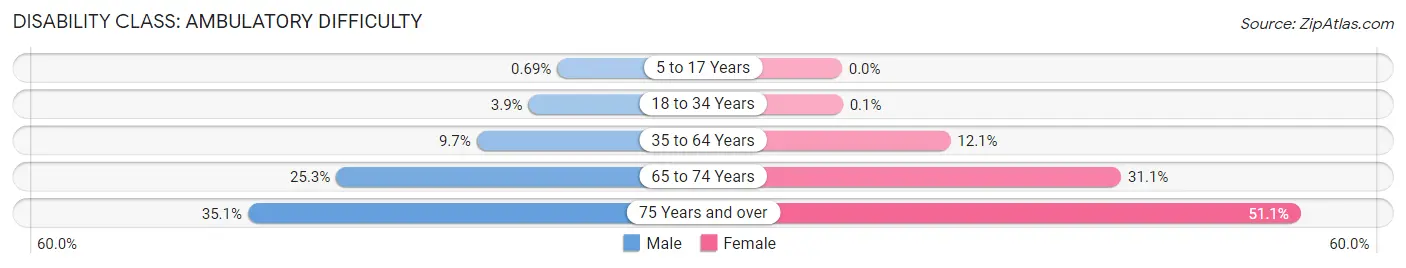
| Age Bracket | Male | Female |
| 5 to 17 Years | 14 (0.7%) | 0 (0.0%) |
| 18 to 34 Years | 118 (3.9%) | 3 (0.1%) |
| 35 to 64 Years | 424 (9.7%) | 544 (12.1%) |
| 65 to 74 Years | 286 (25.3%) | 430 (31.1%) |
| 75 Years and over | 240 (35.1%) | 558 (51.1%) |
Disability Class: Self-Care Difficulty
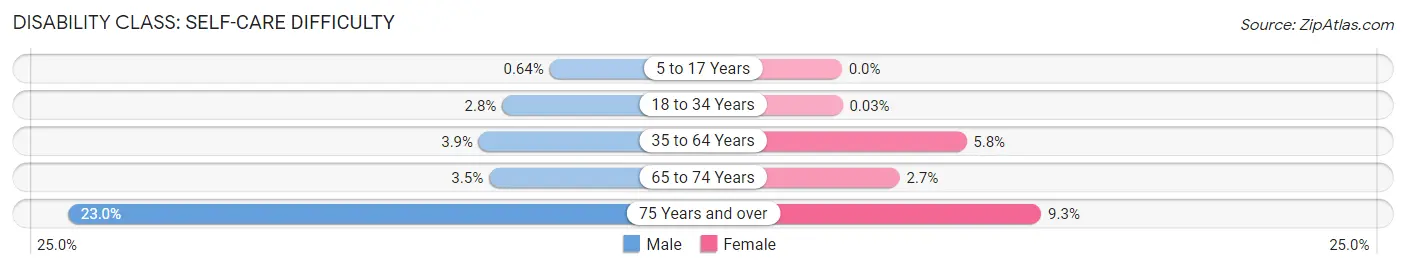
| Age Bracket | Male | Female |
| 5 to 17 Years | 13 (0.6%) | 0 (0.0%) |
| 18 to 34 Years | 86 (2.8%) | 1 (0.0%) |
| 35 to 64 Years | 172 (3.9%) | 260 (5.8%) |
| 65 to 74 Years | 39 (3.5%) | 37 (2.7%) |
| 75 Years and over | 157 (23.0%) | 101 (9.2%) |
Technology Access in Prentiss County
Computing Device Access in Prentiss County
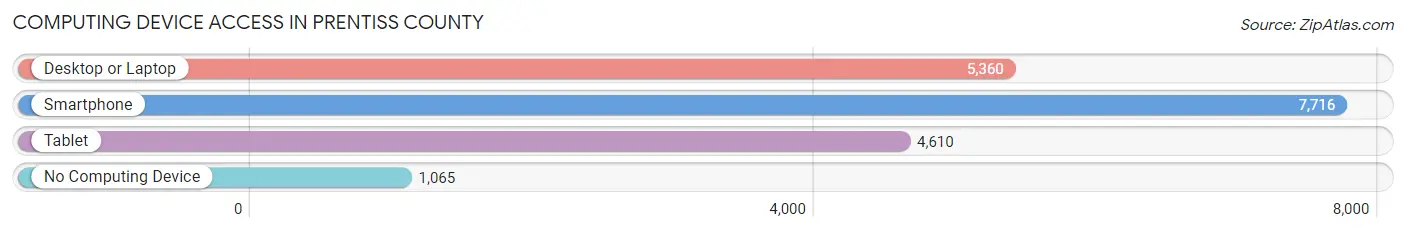
| Device Type | # Households | % Households |
| Desktop or Laptop | 5,360 | 57.7% |
| Smartphone | 7,716 | 83.0% |
| Tablet | 4,610 | 49.6% |
| No Computing Device | 1,065 | 11.5% |
| Total | 9,296 | 100.0% |
Internet Access in Prentiss County
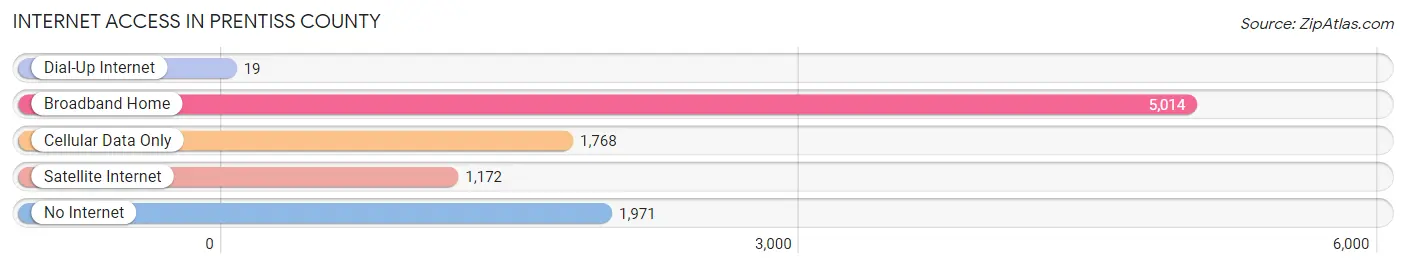
| Internet Type | # Households | % Households |
| Dial-Up Internet | 19 | 0.2% |
| Broadband Home | 5,014 | 53.9% |
| Cellular Data Only | 1,768 | 19.0% |
| Satellite Internet | 1,172 | 12.6% |
| No Internet | 1,971 | 21.2% |
| Total | 9,296 | 100.0% |
Prentiss County Summary
Prentiss County, Mississippi is located in the northeast corner of the state and is bordered by Alcorn County to the north, Tishomingo County to the east, Union County to the south, and Tippah County to the west. The county seat is Booneville, and the county has a total area of 517 square miles. As of the 2010 census, the population was 25,276.
History
Prentiss County was established in 1836 and named for Seargent Smith Prentiss, a prominent lawyer and orator from Natchez. The county was formed from parts of Tishomingo, Tippah, and Alcorn counties. The first county seat was located in the town of Jacinto, but it was moved to Booneville in 1837.
The county was largely agricultural in the 19th century, with cotton being the main crop. The county was also home to several sawmills and gristmills. The first railroad line in the county was built in 1858, connecting Booneville to Corinth.
Geography
Prentiss County is located in the northeast corner of Mississippi and is bordered by Alcorn County to the north, Tishomingo County to the east, Union County to the south, and Tippah County to the west. The county has a total area of 517 square miles, of which 514 square miles is land and 3 square miles is water. The terrain is mostly rolling hills, with the highest point being the summit of Bald Hill, which has an elevation of 590 feet.
The county is drained by the Tippah River, which flows through the western part of the county. Other major waterways include the Big Black River, which forms the northern border of the county, and the Little Tallahatchie River, which flows through the eastern part of the county.
Economy
The economy of Prentiss County is largely based on agriculture. The county is home to several large farms, which produce cotton, soybeans, corn, and other crops. The county is also home to several manufacturing companies, including a furniture factory, a paper mill, and a plastics plant.
The county is also home to several small businesses, including restaurants, retail stores, and service providers. Tourism is also an important part of the economy, with several attractions, including the Natchez Trace Parkway, the Tishomingo State Park, and the Prentiss County Museum.
Demographics
As of the 2010 census, the population of Prentiss County was 25,276. The racial makeup of the county was 79.3% White, 18.3% African American, 0.4% Native American, 0.3% Asian, 0.2% from other races, and 1.5% from two or more races. Hispanic or Latino of any race were 1.2% of the population.
The median income for a household in the county was $33,945, and the median income for a family was $41,945. The per capita income for the county was $17,845. About 17.2% of the population was below the poverty line.
Common Questions
What is Per Capita Income in Prentiss County?
Per Capita income in Prentiss County is $27,979.
What is the Median Family Income in Prentiss County?
Median Family Income in Prentiss County is $66,901.
What is the Median Household income in Prentiss County?
Median Household Income in Prentiss County is $51,578.
What is Income or Wage Gap in Prentiss County?
Income or Wage Gap in Prentiss County is 16.1%.
Women in Prentiss County earn 83.9 cents for every dollar earned by a man.
What is Inequality or Gini Index in Prentiss County?
Inequality or Gini Index in Prentiss County is 0.48.
What is the Total Population of Prentiss County?
Total Population of Prentiss County is 24,945.
What is the Total Male Population of Prentiss County?
Total Male Population of Prentiss County is 12,270.
What is the Total Female Population of Prentiss County?
Total Female Population of Prentiss County is 12,675.
What is the Ratio of Males per 100 Females in Prentiss County?
There are 96.80 Males per 100 Females in Prentiss County.
What is the Ratio of Females per 100 Males in Prentiss County?
There are 103.30 Females per 100 Males in Prentiss County.
What is the Median Population Age in Prentiss County?
Median Population Age in Prentiss County is 38.0 Years.
What is the Average Family Size in Prentiss County
Average Family Size in Prentiss County is 3.1 People.
What is the Average Household Size in Prentiss County
Average Household Size in Prentiss County is 2.5 People.
How Large is the Labor Force in Prentiss County?
There are 11,027 People in the Labor Forcein in Prentiss County.
What is the Percentage of People in the Labor Force in Prentiss County?
54.9% of People are in the Labor Force in Prentiss County.
What is the Unemployment Rate in Prentiss County?
Unemployment Rate in Prentiss County is 5.0%.