Montgomery County, MS Map & Demographics
Montgomery County Map
Montgomery County Overview
$24,126
PER CAPITA INCOME
$44,414
AVG FAMILY INCOME
$36,845
AVG HOUSEHOLD INCOME
26.4%
WAGE / INCOME GAP [ % ]
73.6¢/ $1
WAGE / INCOME GAP [ $ ]
$11,543
FAMILY INCOME DEFICIT
0.52
INEQUALITY / GINI INDEX
9,803
TOTAL POPULATION
4,674
MALE POPULATION
5,129
FEMALE POPULATION
91.13
MALES / 100 FEMALES
109.73
FEMALES / 100 MALES
42.0
MEDIAN AGE
3.3
AVG FAMILY SIZE
2.5
AVG HOUSEHOLD SIZE
3,816
LABOR FORCE [ PEOPLE ]
48.7%
PERCENT IN LABOR FORCE
7.8%
UNEMPLOYMENT RATE
Montgomery County Area Codes
Income in Montgomery County
Income Overview in Montgomery County
Per Capita Income in Montgomery County is $24,126, while median incomes of families and households are $44,414 and $36,845 respectively.
| Characteristic | Number | Measure |
| Per Capita Income | 9,803 | $24,126 |
| Median Family Income | 2,342 | $44,414 |
| Mean Family Income | 2,342 | $70,905 |
| Median Household Income | 3,830 | $36,845 |
| Mean Household Income | 3,830 | $57,329 |
| Income Deficit | 2,342 | $11,543 |
| Wage / Income Gap (%) | 9,803 | 26.36% |
| Wage / Income Gap ($) | 9,803 | 73.64¢ per $1 |
| Gini / Inequality Index | 9,803 | 0.52 |
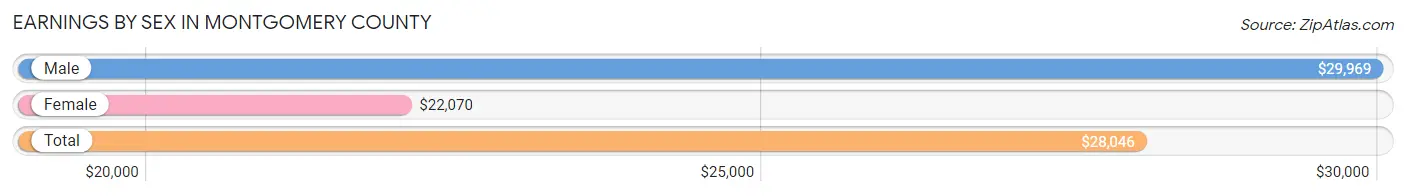
Earnings by Sex in Montgomery County
Average Earnings in Montgomery County are $28,046, $29,969 for men and $22,070 for women, a difference of 26.4%.
| Sex | Number | Average Earnings |
| Male | 1,965 (50.0%) | $29,969 |
| Female | 1,962 (50.0%) | $22,070 |
| Total | 3,927 (100.0%) | $28,046 |
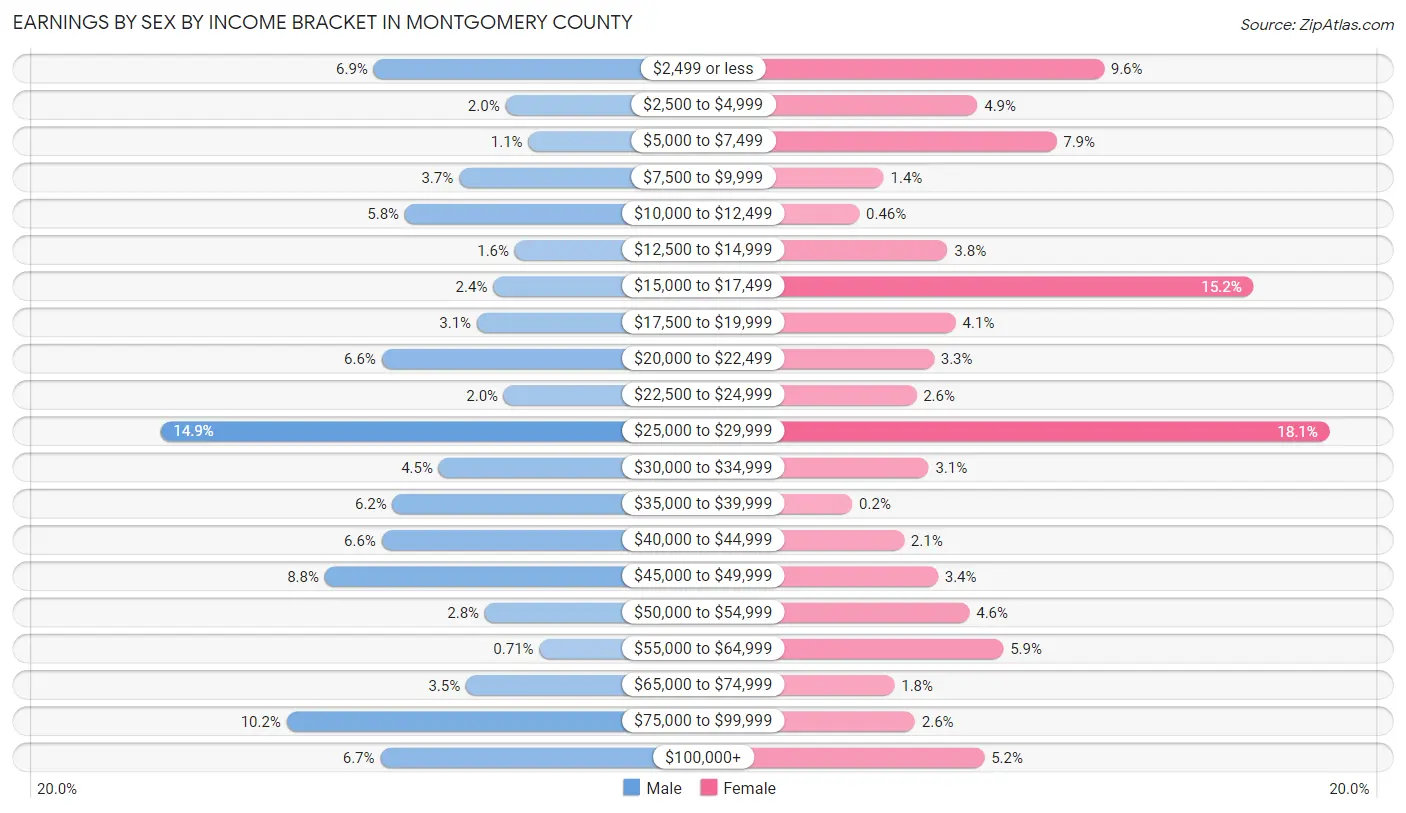
Earnings by Sex by Income Bracket in Montgomery County
The most common earnings brackets in Montgomery County are $25,000 to $29,999 for men (293 | 14.9%) and $25,000 to $29,999 for women (355 | 18.1%).
| Income | Male | Female |
| $2,499 or less | 136 (6.9%) | 189 (9.6%) |
| $2,500 to $4,999 | 39 (2.0%) | 96 (4.9%) |
| $5,000 to $7,499 | 22 (1.1%) | 154 (7.9%) |
| $7,500 to $9,999 | 73 (3.7%) | 27 (1.4%) |
| $10,000 to $12,499 | 113 (5.8%) | 9 (0.5%) |
| $12,500 to $14,999 | 32 (1.6%) | 74 (3.8%) |
| $15,000 to $17,499 | 48 (2.4%) | 299 (15.2%) |
| $17,500 to $19,999 | 60 (3.0%) | 80 (4.1%) |
| $20,000 to $22,499 | 130 (6.6%) | 64 (3.3%) |
| $22,500 to $24,999 | 40 (2.0%) | 51 (2.6%) |
| $25,000 to $29,999 | 293 (14.9%) | 355 (18.1%) |
| $30,000 to $34,999 | 88 (4.5%) | 60 (3.1%) |
| $35,000 to $39,999 | 122 (6.2%) | 4 (0.2%) |
| $40,000 to $44,999 | 130 (6.6%) | 42 (2.1%) |
| $45,000 to $49,999 | 172 (8.7%) | 67 (3.4%) |
| $50,000 to $54,999 | 54 (2.8%) | 90 (4.6%) |
| $55,000 to $64,999 | 14 (0.7%) | 115 (5.9%) |
| $65,000 to $74,999 | 68 (3.5%) | 35 (1.8%) |
| $75,000 to $99,999 | 200 (10.2%) | 50 (2.5%) |
| $100,000+ | 131 (6.7%) | 101 (5.1%) |
| Total | 1,965 (100.0%) | 1,962 (100.0%) |
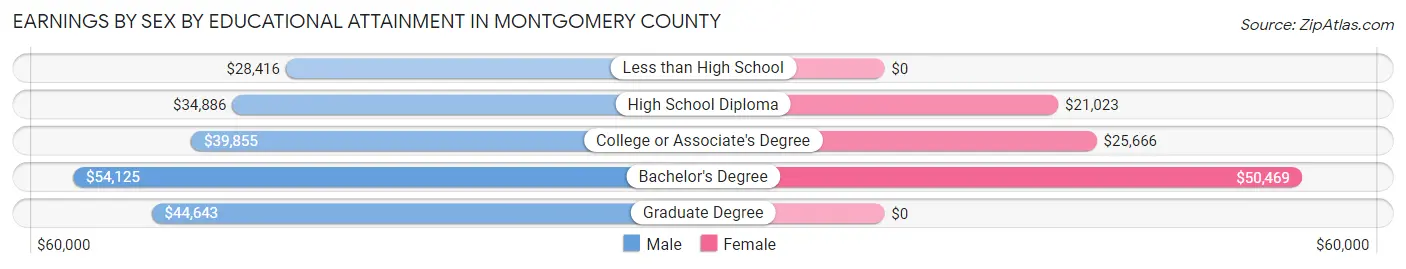
Earnings by Sex by Educational Attainment in Montgomery County
Average earnings in Montgomery County are $34,850 for men and $23,603 for women, a difference of 32.3%. Men with an educational attainment of bachelor's degree enjoy the highest average annual earnings of $54,125, while those with less than high school education earn the least with $28,416. Women with an educational attainment of bachelor's degree earn the most with the average annual earnings of $50,469, while those with high school diploma education have the smallest earnings of $21,023.
| Educational Attainment | Male Income | Female Income |
| Less than High School | $28,416 | $0 |
| High School Diploma | $34,886 | $21,023 |
| College or Associate's Degree | $39,855 | $25,666 |
| Bachelor's Degree | $54,125 | $50,469 |
| Graduate Degree | $44,643 | $0 |
| Total | $34,850 | $23,603 |
Family Income in Montgomery County
Family Income Brackets in Montgomery County
According to the Montgomery County family income data, there are 403 families falling into the $35,000 to $49,999 income range, which is the most common income bracket and makes up 17.2% of all families. Conversely, the $150,000 to $199,999 income bracket is the least frequent group with only 103 families (4.4%) belonging to this category.
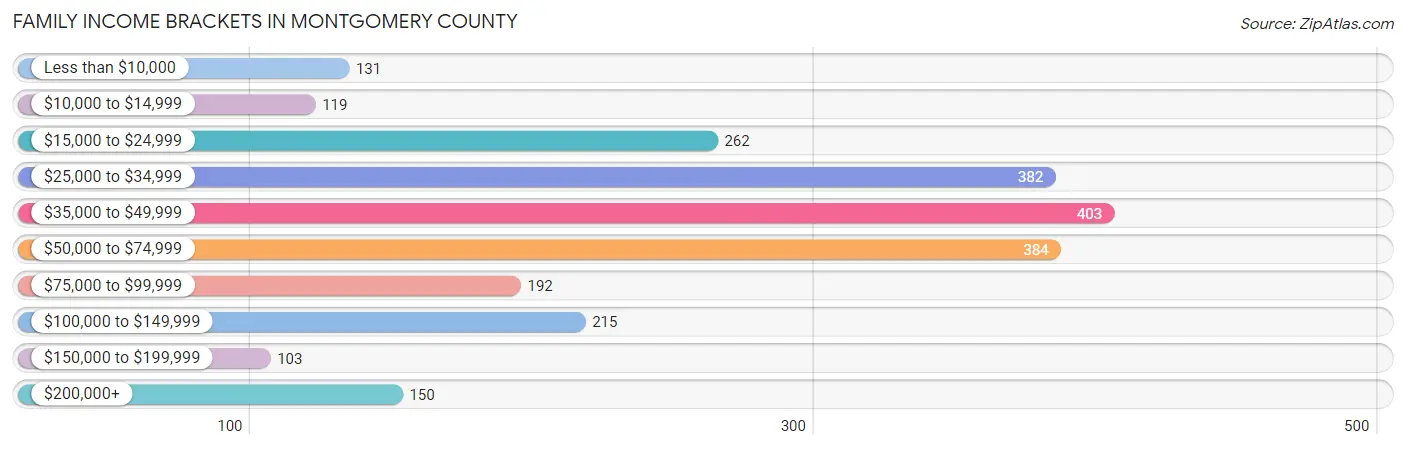
| Income Bracket | # Families | % Families |
| Less than $10,000 | 131 | 5.6% |
| $10,000 to $14,999 | 119 | 5.1% |
| $15,000 to $24,999 | 262 | 11.2% |
| $25,000 to $34,999 | 382 | 16.3% |
| $35,000 to $49,999 | 403 | 17.2% |
| $50,000 to $74,999 | 384 | 16.4% |
| $75,000 to $99,999 | 192 | 8.2% |
| $100,000 to $149,999 | 215 | 9.2% |
| $150,000 to $199,999 | 103 | 4.4% |
| $200,000+ | 150 | 6.4% |
Family Income by Famaliy Size in Montgomery County
4-person families (251 | 10.7%) account for the highest median family income in Montgomery County with $71,338 per family, while 2-person families (1,387 | 59.2%) have the highest median income of $21,332 per family member.
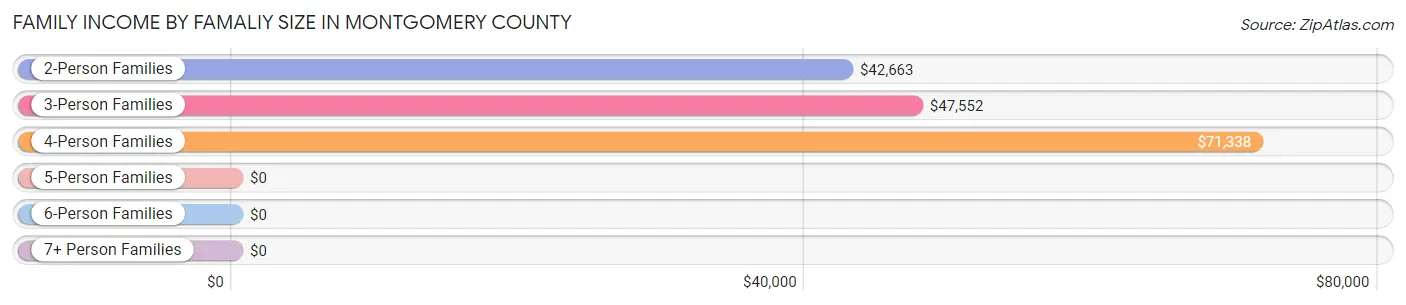
| Income Bracket | # Families | Median Income |
| 2-Person Families | 1,387 (59.2%) | $42,663 |
| 3-Person Families | 518 (22.1%) | $47,552 |
| 4-Person Families | 251 (10.7%) | $71,338 |
| 5-Person Families | 104 (4.4%) | $0 |
| 6-Person Families | 16 (0.7%) | $0 |
| 7+ Person Families | 66 (2.8%) | $0 |
| Total | 2,342 (100.0%) | $44,414 |
Family Income by Number of Earners in Montgomery County
The median family income in Montgomery County is $44,414, with families comprising 3+ earners (152) having the highest median family income of $130,259, while families with 1 earner (797) have the lowest median family income of $28,174, accounting for 6.5% and 34.0% of families, respectively.
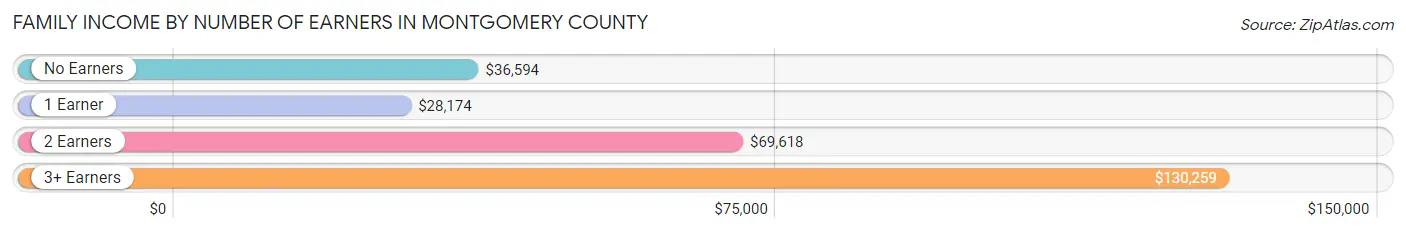
| Number of Earners | # Families | Median Income |
| No Earners | 690 (29.5%) | $36,594 |
| 1 Earner | 797 (34.0%) | $28,174 |
| 2 Earners | 703 (30.0%) | $69,618 |
| 3+ Earners | 152 (6.5%) | $130,259 |
| Total | 2,342 (100.0%) | $44,414 |
Household Income in Montgomery County
Household Income Brackets in Montgomery County
With 682 households falling in the category, the $35,000 to $49,999 income range is the most frequent in Montgomery County, accounting for 17.8% of all households. In contrast, only 142 households (3.7%) fall into the $150,000 to $199,999 income bracket, making it the least populous group.
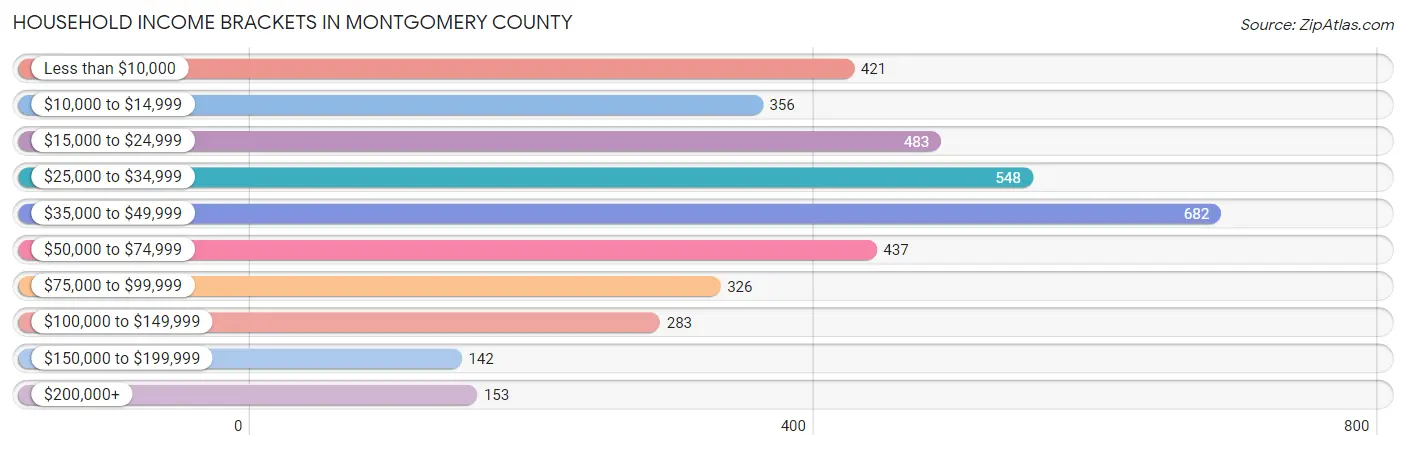
| Income Bracket | # Households | % Households |
| Less than $10,000 | 421 | 11.0% |
| $10,000 to $14,999 | 356 | 9.3% |
| $15,000 to $24,999 | 483 | 12.6% |
| $25,000 to $34,999 | 548 | 14.3% |
| $35,000 to $49,999 | 682 | 17.8% |
| $50,000 to $74,999 | 437 | 11.4% |
| $75,000 to $99,999 | 326 | 8.5% |
| $100,000 to $149,999 | 283 | 7.4% |
| $150,000 to $199,999 | 142 | 3.7% |
| $200,000+ | 153 | 4.0% |
Household Income by Householder Age in Montgomery County
The median household income in Montgomery County is $36,845, with the highest median household income of $43,328 found in the 45 to 64 years age bracket for the primary householder. A total of 1,448 households (37.8%) fall into this category. Meanwhile, the 15 to 24 years age bracket for the primary householder has the lowest median household income of $0, with 12 households (0.3%) in this group.
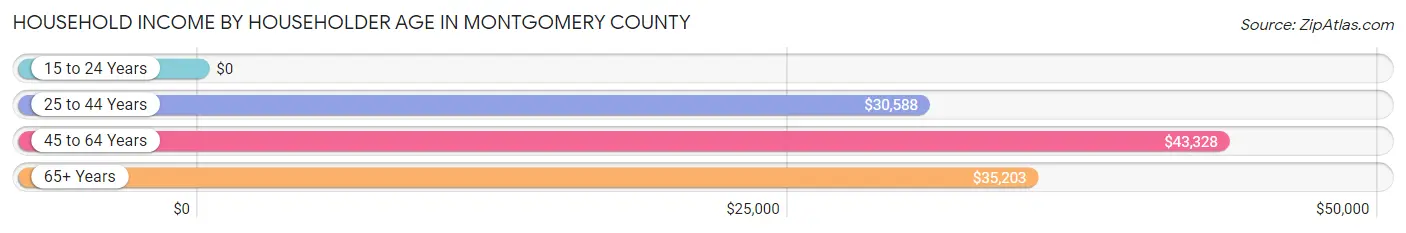
| Income Bracket | # Households | Median Income |
| 15 to 24 Years | 12 (0.3%) | $0 |
| 25 to 44 Years | 916 (23.9%) | $30,588 |
| 45 to 64 Years | 1,448 (37.8%) | $43,328 |
| 65+ Years | 1,454 (38.0%) | $35,203 |
| Total | 3,830 (100.0%) | $36,845 |
Poverty in Montgomery County
Income Below Poverty by Sex and Age in Montgomery County
With 19.0% poverty level for males and 29.0% for females among the residents of Montgomery County, under 5 year old males and 12 to 14 year old females are the most vulnerable to poverty, with 125 males (74.4%) and 126 females (80.8%) in their respective age groups living below the poverty level.
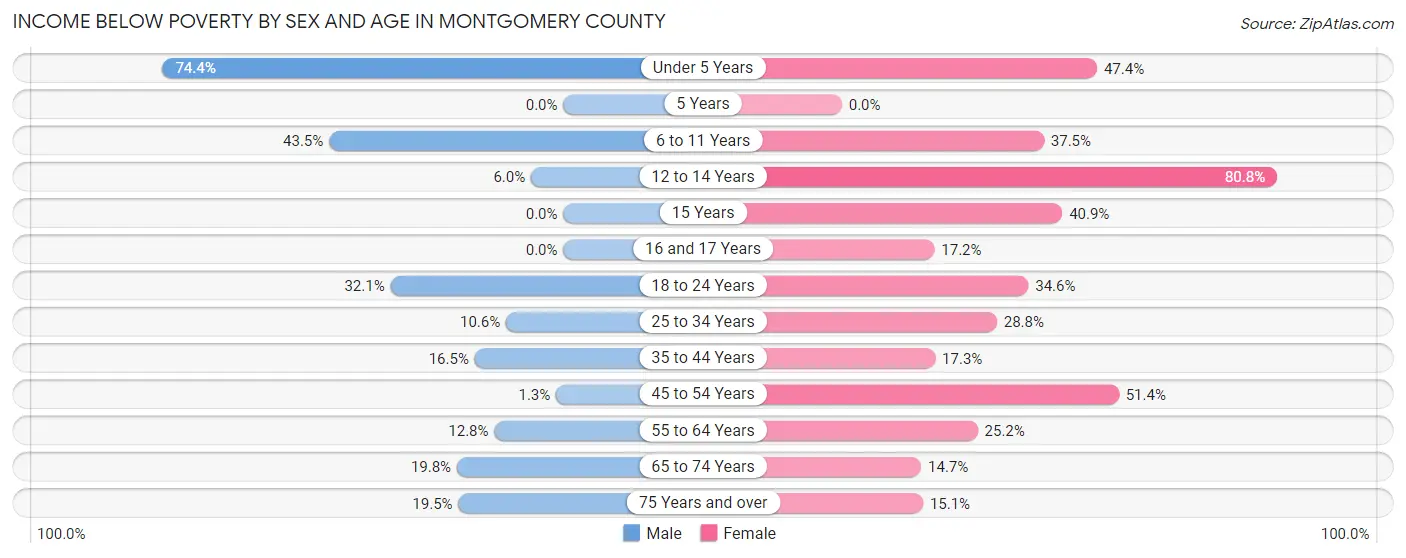
| Age Bracket | Male | Female |
| Under 5 Years | 125 (74.4%) | 108 (47.4%) |
| 5 Years | 0 (0.0%) | 0 (0.0%) |
| 6 to 11 Years | 190 (43.5%) | 159 (37.5%) |
| 12 to 14 Years | 22 (6.0%) | 126 (80.8%) |
| 15 Years | 0 (0.0%) | 9 (40.9%) |
| 16 and 17 Years | 0 (0.0%) | 39 (17.2%) |
| 18 to 24 Years | 112 (32.1%) | 179 (34.6%) |
| 25 to 34 Years | 64 (10.6%) | 103 (28.8%) |
| 35 to 44 Years | 89 (16.5%) | 109 (17.3%) |
| 45 to 54 Years | 6 (1.3%) | 276 (51.4%) |
| 55 to 64 Years | 88 (12.8%) | 183 (25.2%) |
| 65 to 74 Years | 126 (19.8%) | 92 (14.7%) |
| 75 Years and over | 60 (19.5%) | 72 (15.1%) |
| Total | 882 (19.0%) | 1,455 (29.0%) |
Income Above Poverty by Sex and Age in Montgomery County
According to the poverty statistics in Montgomery County, males aged 5 years and females aged 5 years are the age groups that are most secure financially, with 100.0% of males and 100.0% of females in these age groups living above the poverty line.
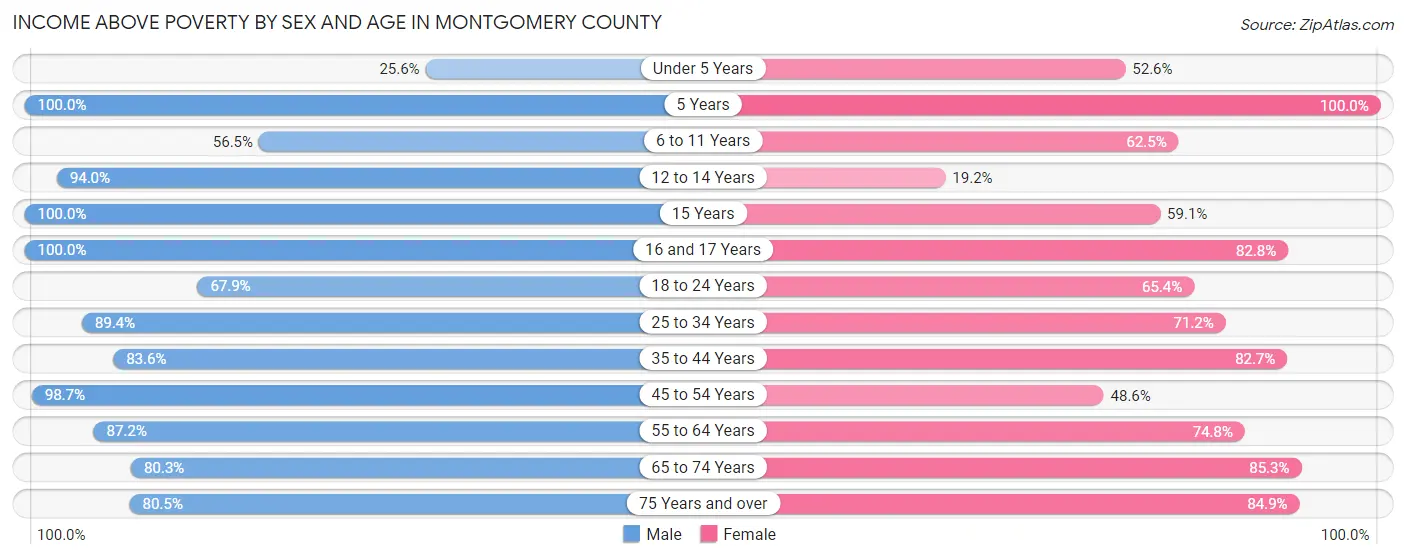
| Age Bracket | Male | Female |
| Under 5 Years | 43 (25.6%) | 120 (52.6%) |
| 5 Years | 30 (100.0%) | 93 (100.0%) |
| 6 to 11 Years | 247 (56.5%) | 265 (62.5%) |
| 12 to 14 Years | 345 (94.0%) | 30 (19.2%) |
| 15 Years | 36 (100.0%) | 13 (59.1%) |
| 16 and 17 Years | 28 (100.0%) | 188 (82.8%) |
| 18 to 24 Years | 237 (67.9%) | 338 (65.4%) |
| 25 to 34 Years | 538 (89.4%) | 255 (71.2%) |
| 35 to 44 Years | 452 (83.6%) | 520 (82.7%) |
| 45 to 54 Years | 443 (98.7%) | 261 (48.6%) |
| 55 to 64 Years | 599 (87.2%) | 543 (74.8%) |
| 65 to 74 Years | 512 (80.2%) | 533 (85.3%) |
| 75 Years and over | 248 (80.5%) | 406 (84.9%) |
| Total | 3,758 (81.0%) | 3,565 (71.0%) |
Income Below Poverty Among Married-Couple Families in Montgomery County
The poverty statistics for married-couple families in Montgomery County show that 6.6% or 85 of the total 1,290 families live below the poverty line. Families with 3 or 4 children have the highest poverty rate of 62.2%, comprising of 28 families. On the other hand, families with 1 or 2 children have the lowest poverty rate of 2.5%, which includes 9 families.
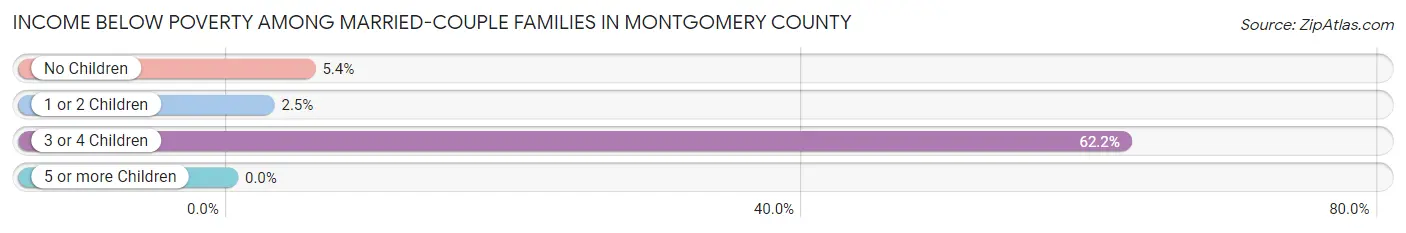
| Children | Above Poverty | Below Poverty |
| No Children | 843 (94.6%) | 48 (5.4%) |
| 1 or 2 Children | 345 (97.5%) | 9 (2.5%) |
| 3 or 4 Children | 17 (37.8%) | 28 (62.2%) |
| 5 or more Children | 0 (0.0%) | 0 (0.0%) |
| Total | 1,205 (93.4%) | 85 (6.6%) |
Income Below Poverty Among Single-Parent Households in Montgomery County
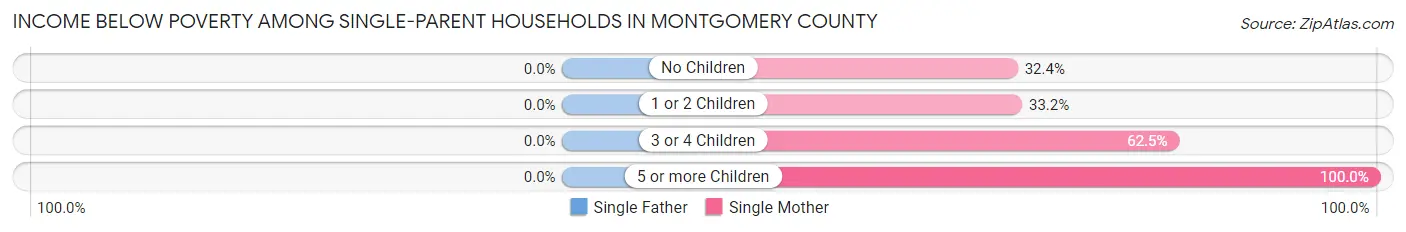
| Children | Single Father | Single Mother |
| No Children | 0 (0.0%) | 154 (32.4%) |
| 1 or 2 Children | 0 (0.0%) | 107 (33.2%) |
| 3 or 4 Children | 0 (0.0%) | 25 (62.5%) |
| 5 or more Children | 0 (0.0%) | 50 (100.0%) |
| Total | 0 (0.0%) | 336 (37.9%) |
Income Below Poverty Among Married-Couple vs Single-Parent Households in Montgomery County
The poverty data for Montgomery County shows that 85 of the married-couple family households (6.6%) and 336 of the single-parent households (31.9%) are living below the poverty level. Within the married-couple family households, those with 3 or 4 children have the highest poverty rate, with 28 households (62.2%) falling below the poverty line. Among the single-parent households, those with 5 or more children have the highest poverty rate, with 50 household (100.0%) living below poverty.
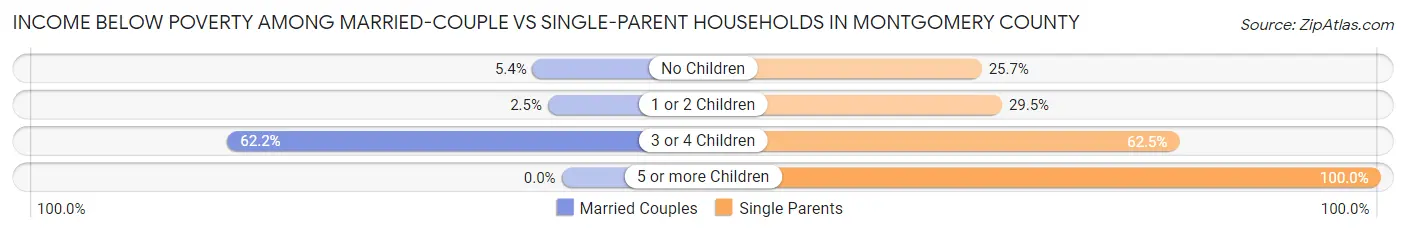
| Children | Married-Couple Families | Single-Parent Households |
| No Children | 48 (5.4%) | 154 (25.7%) |
| 1 or 2 Children | 9 (2.5%) | 107 (29.5%) |
| 3 or 4 Children | 28 (62.2%) | 25 (62.5%) |
| 5 or more Children | 0 (0.0%) | 50 (100.0%) |
| Total | 85 (6.6%) | 336 (31.9%) |
Race in Montgomery County
The most populous races in Montgomery County are White / Caucasian (5,119 | 52.2%), Black / African American (4,513 | 46.0%), and Two or more Races (126 | 1.3%).
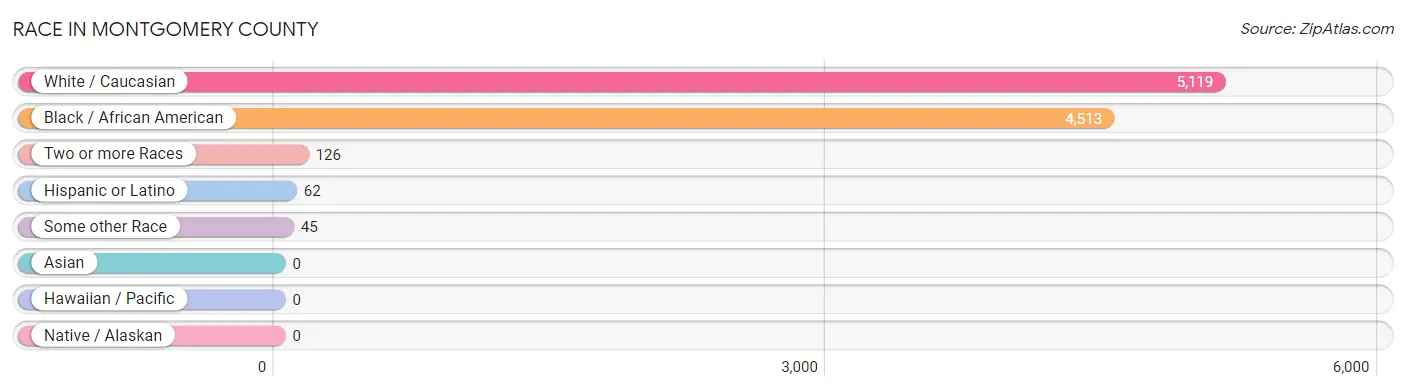
| Race | # Population | % Population |
| Asian | 0 | 0.0% |
| Black / African American | 4,513 | 46.0% |
| Hawaiian / Pacific | 0 | 0.0% |
| Hispanic or Latino | 62 | 0.6% |
| Native / Alaskan | 0 | 0.0% |
| White / Caucasian | 5,119 | 52.2% |
| Two or more Races | 126 | 1.3% |
| Some other Race | 45 | 0.5% |
| Total | 9,803 | 100.0% |
Ancestry in Montgomery County
The most populous ancestries reported in Montgomery County are American (960 | 9.8%), English (912 | 9.3%), Irish (532 | 5.4%), German (131 | 1.3%), and Scottish (92 | 0.9%), together accounting for 26.8% of all Montgomery County residents.
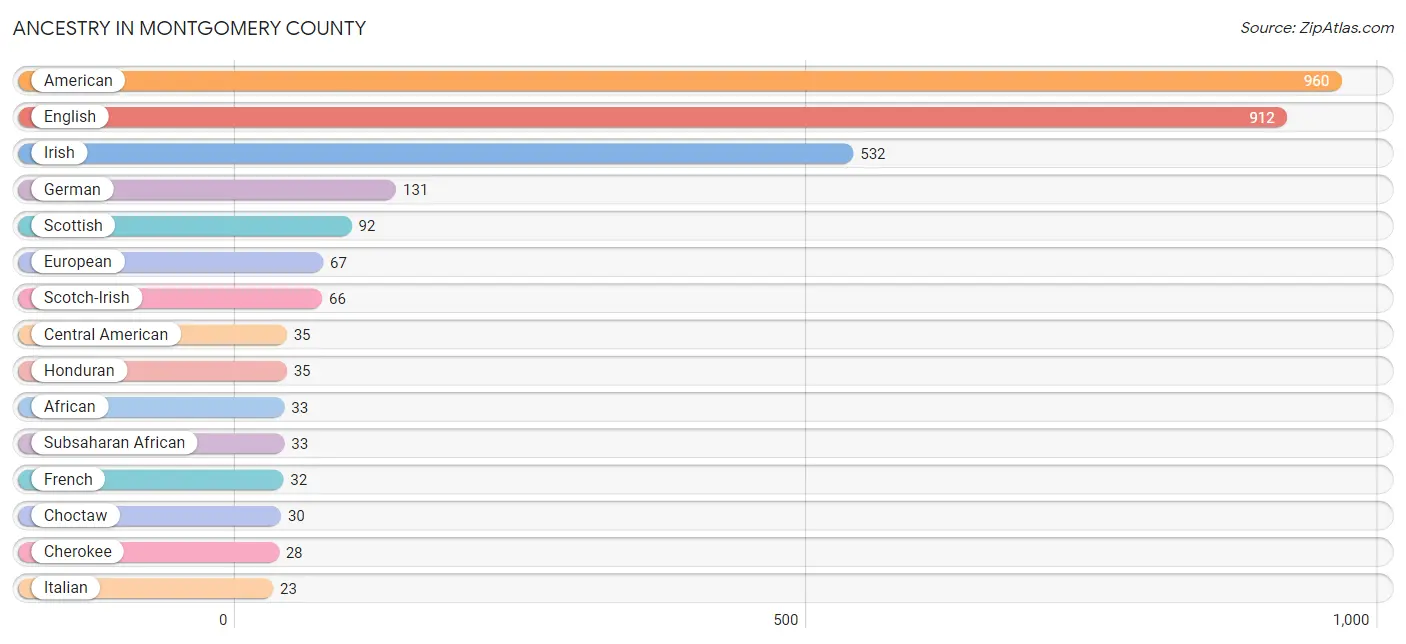
| Ancestry | # Population | % Population |
| African | 33 | 0.3% |
| American | 960 | 9.8% |
| British | 6 | 0.1% |
| Central American | 35 | 0.4% |
| Cherokee | 28 | 0.3% |
| Chickasaw | 2 | 0.0% |
| Choctaw | 30 | 0.3% |
| English | 912 | 9.3% |
| European | 67 | 0.7% |
| French | 32 | 0.3% |
| German | 131 | 1.3% |
| Honduran | 35 | 0.4% |
| Irish | 532 | 5.4% |
| Italian | 23 | 0.2% |
| Mexican | 18 | 0.2% |
| Norwegian | 2 | 0.0% |
| Polish | 2 | 0.0% |
| Puerto Rican | 9 | 0.1% |
| Scandinavian | 9 | 0.1% |
| Scotch-Irish | 66 | 0.7% |
| Scottish | 92 | 0.9% |
| Subsaharan African | 33 | 0.3% | View All 22 Rows |
Immigrants in Montgomery County
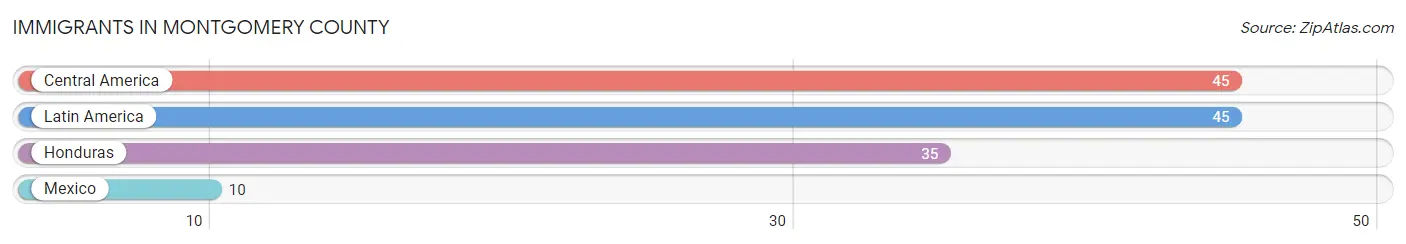
The most numerous immigrant groups reported in Montgomery County came from Central America (45 | 0.5%), Latin America (45 | 0.5%), Honduras (35 | 0.4%), and Mexico (10 | 0.1%), together accounting for 1.4% of all Montgomery County residents.
| Immigration Origin | # Population | % Population |
| Central America | 45 | 0.5% |
| Honduras | 35 | 0.4% |
| Latin America | 45 | 0.5% |
| Mexico | 10 | 0.1% | View All 4 Rows |
Sex and Age in Montgomery County
Sex and Age in Montgomery County
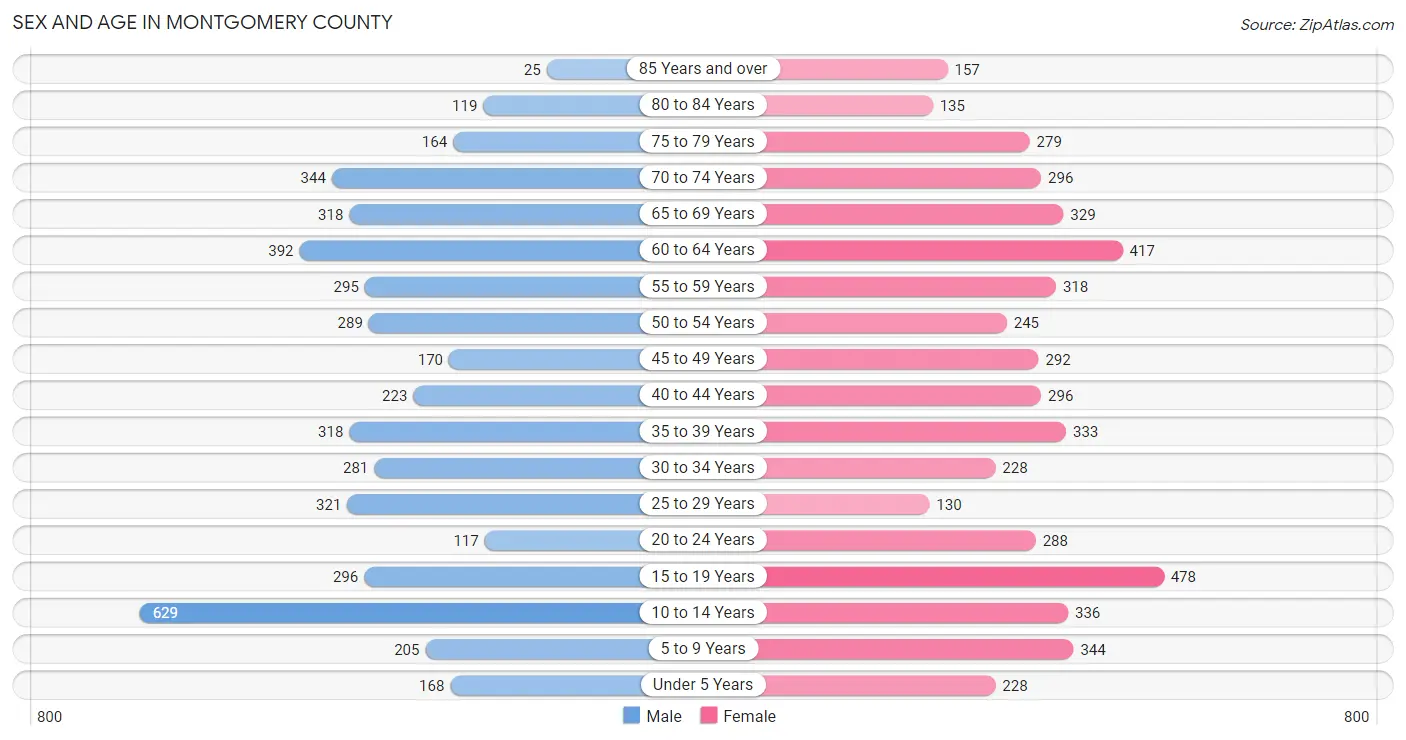
The most populous age groups in Montgomery County are 10 to 14 Years (629 | 13.5%) for men and 15 to 19 Years (478 | 9.3%) for women.
| Age Bracket | Male | Female |
| Under 5 Years | 168 (3.6%) | 228 (4.4%) |
| 5 to 9 Years | 205 (4.4%) | 344 (6.7%) |
| 10 to 14 Years | 629 (13.5%) | 336 (6.6%) |
| 15 to 19 Years | 296 (6.3%) | 478 (9.3%) |
| 20 to 24 Years | 117 (2.5%) | 288 (5.6%) |
| 25 to 29 Years | 321 (6.9%) | 130 (2.5%) |
| 30 to 34 Years | 281 (6.0%) | 228 (4.4%) |
| 35 to 39 Years | 318 (6.8%) | 333 (6.5%) |
| 40 to 44 Years | 223 (4.8%) | 296 (5.8%) |
| 45 to 49 Years | 170 (3.6%) | 292 (5.7%) |
| 50 to 54 Years | 289 (6.2%) | 245 (4.8%) |
| 55 to 59 Years | 295 (6.3%) | 318 (6.2%) |
| 60 to 64 Years | 392 (8.4%) | 417 (8.1%) |
| 65 to 69 Years | 318 (6.8%) | 329 (6.4%) |
| 70 to 74 Years | 344 (7.4%) | 296 (5.8%) |
| 75 to 79 Years | 164 (3.5%) | 279 (5.4%) |
| 80 to 84 Years | 119 (2.5%) | 135 (2.6%) |
| 85 Years and over | 25 (0.5%) | 157 (3.1%) |
| Total | 4,674 (100.0%) | 5,129 (100.0%) |
Families and Households in Montgomery County
Median Family Size in Montgomery County
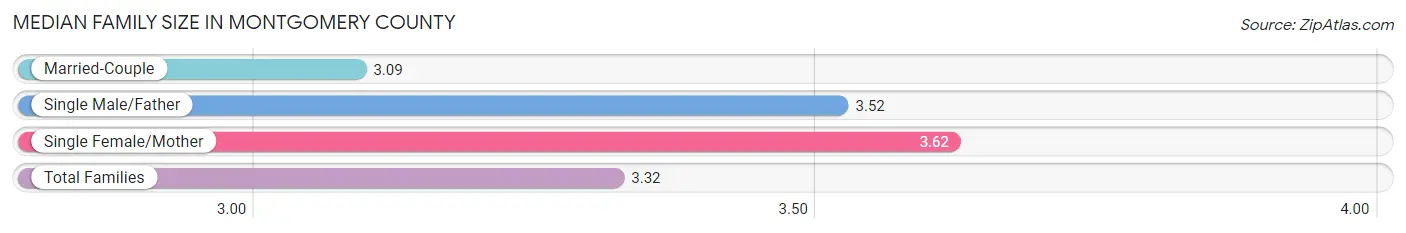
The median family size in Montgomery County is 3.32 persons per family, with single female/mother families (887 | 37.9%) accounting for the largest median family size of 3.62 persons per family. On the other hand, married-couple families (1,290 | 55.1%) represent the smallest median family size with 3.09 persons per family.
| Family Type | # Families | Family Size |
| Married-Couple | 1,290 (55.1%) | 3.09 |
| Single Male/Father | 165 (7.0%) | 3.52 |
| Single Female/Mother | 887 (37.9%) | 3.62 |
| Total Families | 2,342 (100.0%) | 3.32 |
Median Household Size in Montgomery County
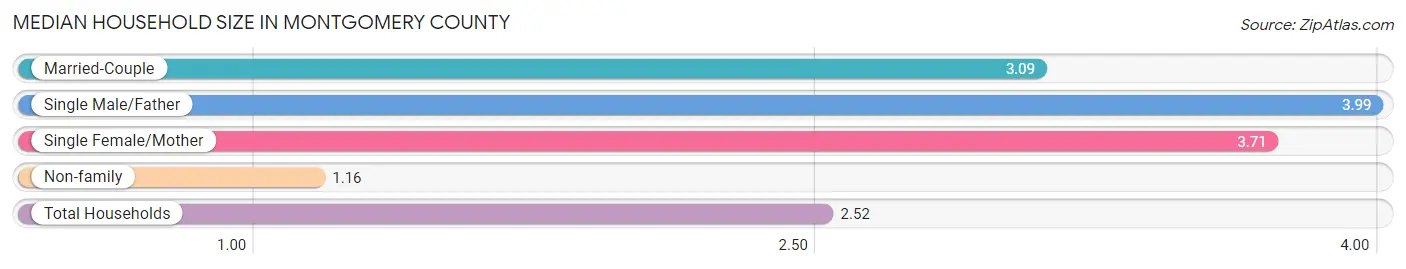
The median household size in Montgomery County is 2.52 persons per household, with single male/father households (165 | 4.3%) accounting for the largest median household size of 3.99 persons per household. non-family households (1,488 | 38.9%) represent the smallest median household size with 1.16 persons per household.
| Household Type | # Households | Household Size |
| Married-Couple | 1,290 (33.7%) | 3.09 |
| Single Male/Father | 165 (4.3%) | 3.99 |
| Single Female/Mother | 887 (23.2%) | 3.71 |
| Non-family | 1,488 (38.9%) | 1.16 |
| Total Households | 3,830 (100.0%) | 2.52 |
Household Size by Marriage Status in Montgomery County
Out of a total of 3,830 households in Montgomery County, 2,342 (61.2%) are family households, while 1,488 (38.9%) are nonfamily households. The most numerous type of family households are 2-person households, comprising 1,319, and the most common type of nonfamily households are 1-person households, comprising 1,333.
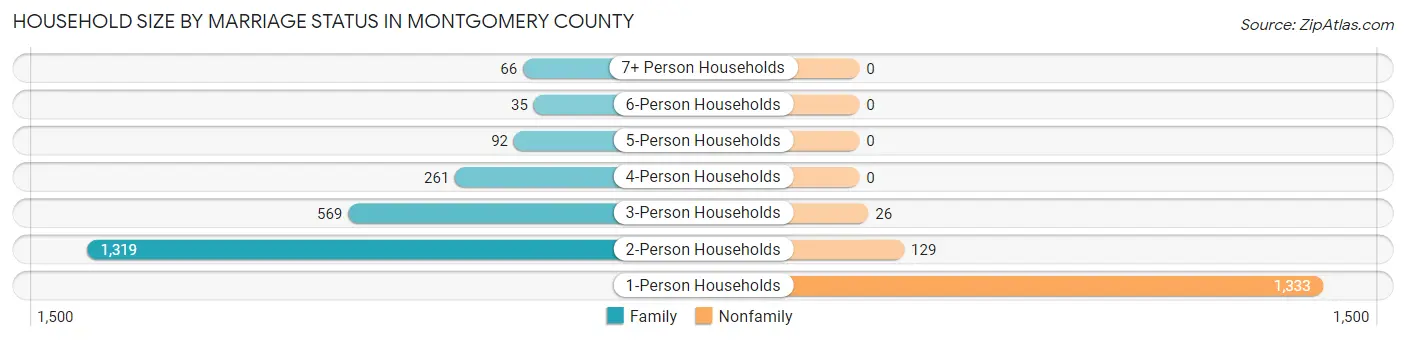
| Household Size | Family Households | Nonfamily Households |
| 1-Person Households | - | 1,333 (34.8%) |
| 2-Person Households | 1,319 (34.4%) | 129 (3.4%) |
| 3-Person Households | 569 (14.9%) | 26 (0.7%) |
| 4-Person Households | 261 (6.8%) | 0 (0.0%) |
| 5-Person Households | 92 (2.4%) | 0 (0.0%) |
| 6-Person Households | 35 (0.9%) | 0 (0.0%) |
| 7+ Person Households | 66 (1.7%) | 0 (0.0%) |
| Total | 2,342 (61.2%) | 1,488 (38.9%) |
Female Fertility in Montgomery County
Fertility by Age in Montgomery County
Average fertility rate in Montgomery County is 70.0 births per 1,000 women. Women in the age bracket of 20 to 34 years have the highest fertility rate with 110.0 births per 1,000 women. Women in the age bracket of 35 to 50 years acount for 51.7% of all women with births.
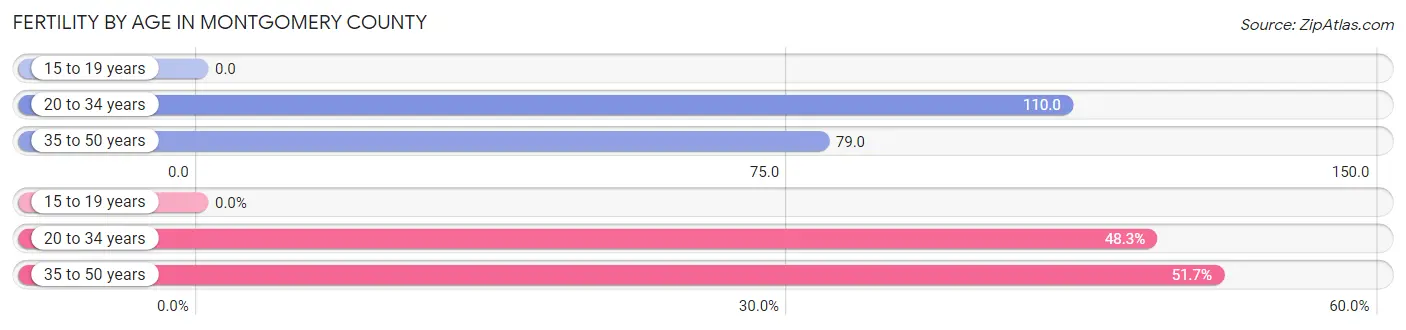
| Age Bracket | Women with Births | Births / 1,000 Women |
| 15 to 19 years | 0 (0.0%) | 0.0 |
| 20 to 34 years | 71 (48.3%) | 110.0 |
| 35 to 50 years | 76 (51.7%) | 79.0 |
| Total | 147 (100.0%) | 70.0 |
Fertility by Age by Marriage Status in Montgomery County
17.7% of women with births (147) in Montgomery County are married. The highest percentage of unmarried women with births falls into 35 to 50 years age bracket with 100.0% of them unmarried at the time of birth, while the lowest percentage of unmarried women with births belong to 20 to 34 years age bracket with 63.4% of them unmarried.
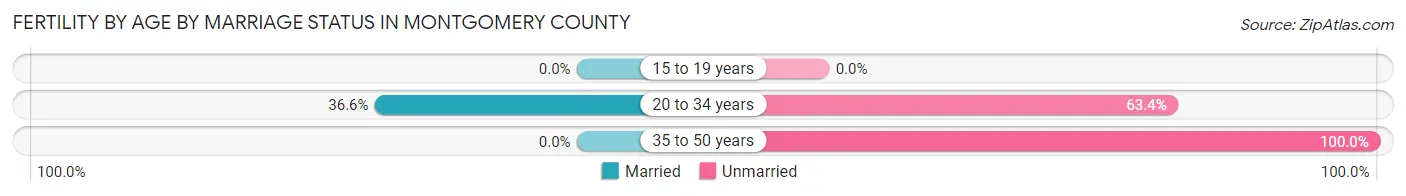
| Age Bracket | Married | Unmarried |
| 15 to 19 years | 0 (0.0%) | 0 (0.0%) |
| 20 to 34 years | 26 (36.6%) | 45 (63.4%) |
| 35 to 50 years | 0 (0.0%) | 76 (100.0%) |
| Total | 26 (17.7%) | 121 (82.3%) |
Fertility by Education in Montgomery County
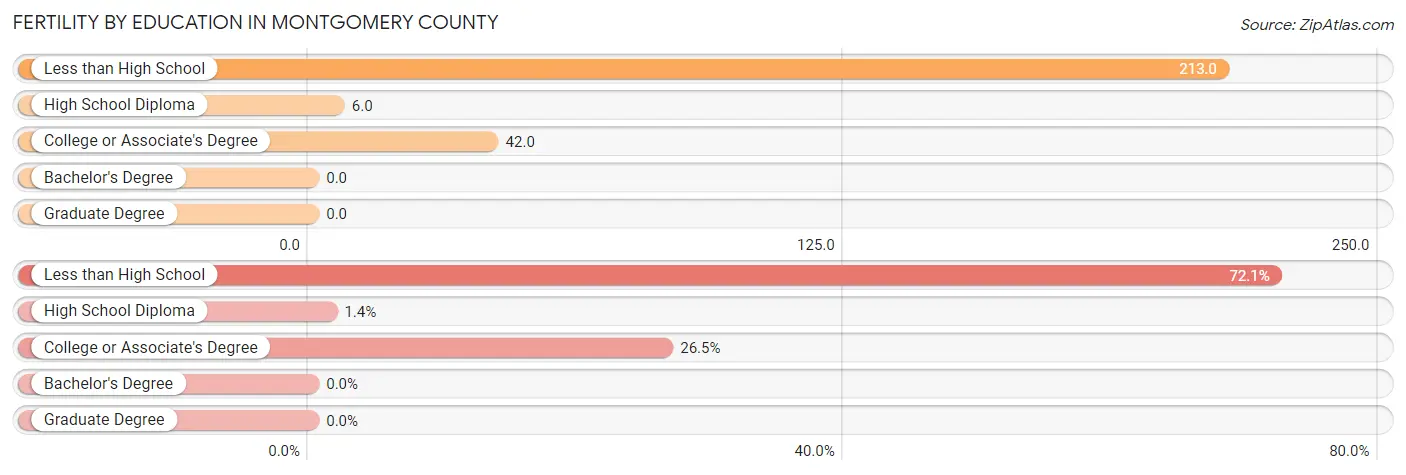
| Educational Attainment | Women with Births | Births / 1,000 Women |
| Less than High School | 106 (72.1%) | 213.0 |
| High School Diploma | 2 (1.4%) | 6.0 |
| College or Associate's Degree | 39 (26.5%) | 42.0 |
| Bachelor's Degree | 0 (0.0%) | 0.0 |
| Graduate Degree | 0 (0.0%) | 0.0 |
| Total | 147 (100.0%) | 70.0 |
Fertility by Education by Marriage Status in Montgomery County
82.3% of women with births in Montgomery County are unmarried. Women with the educational attainment of college or associate's degree are most likely to be married with 66.7% of them married at childbirth, while women with the educational attainment of less than high school are least likely to be married with 100.0% of them unmarried at childbirth.
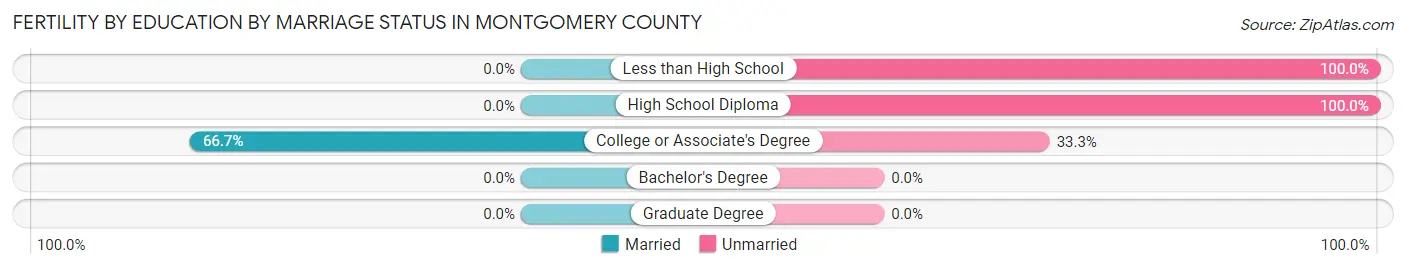
| Educational Attainment | Married | Unmarried |
| Less than High School | 0 (0.0%) | 106 (100.0%) |
| High School Diploma | 0 (0.0%) | 2 (100.0%) |
| College or Associate's Degree | 26 (66.7%) | 13 (33.3%) |
| Bachelor's Degree | 0 (0.0%) | 0 (0.0%) |
| Graduate Degree | 0 (0.0%) | 0 (0.0%) |
| Total | 26 (17.7%) | 121 (82.3%) |
Employment Characteristics in Montgomery County
Employment by Class of Employer in Montgomery County
Among the 3,384 employed individuals in Montgomery County, private company employees (2,200 | 65.0%), state government employees (348 | 10.3%), and not-for-profit organizations (259 | 7.6%) make up the most common classes of employment.
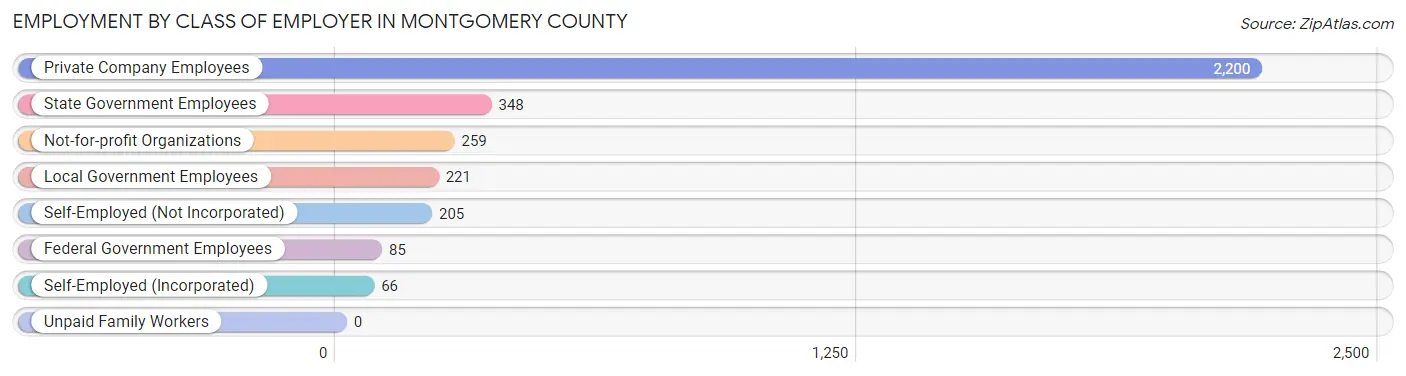
| Employer Class | # Employees | % Employees |
| Private Company Employees | 2,200 | 65.0% |
| Self-Employed (Incorporated) | 66 | 1.9% |
| Self-Employed (Not Incorporated) | 205 | 6.1% |
| Not-for-profit Organizations | 259 | 7.6% |
| Local Government Employees | 221 | 6.5% |
| State Government Employees | 348 | 10.3% |
| Federal Government Employees | 85 | 2.5% |
| Unpaid Family Workers | 0 | 0.0% |
| Total | 3,384 | 100.0% |
Employment Status by Age in Montgomery County
According to the labor force statistics for Montgomery County, out of the total population over 16 years of age (7,835), 48.7% or 3,816 individuals are in the labor force, with 7.8% or 298 of them unemployed. The age group with the highest labor force participation rate is 25 to 29 years, with 75.4% or 340 individuals in the labor force. Within the labor force, the 30 to 34 years age range has the highest percentage of unemployed individuals, with 24.0% or 77 of them being unemployed.
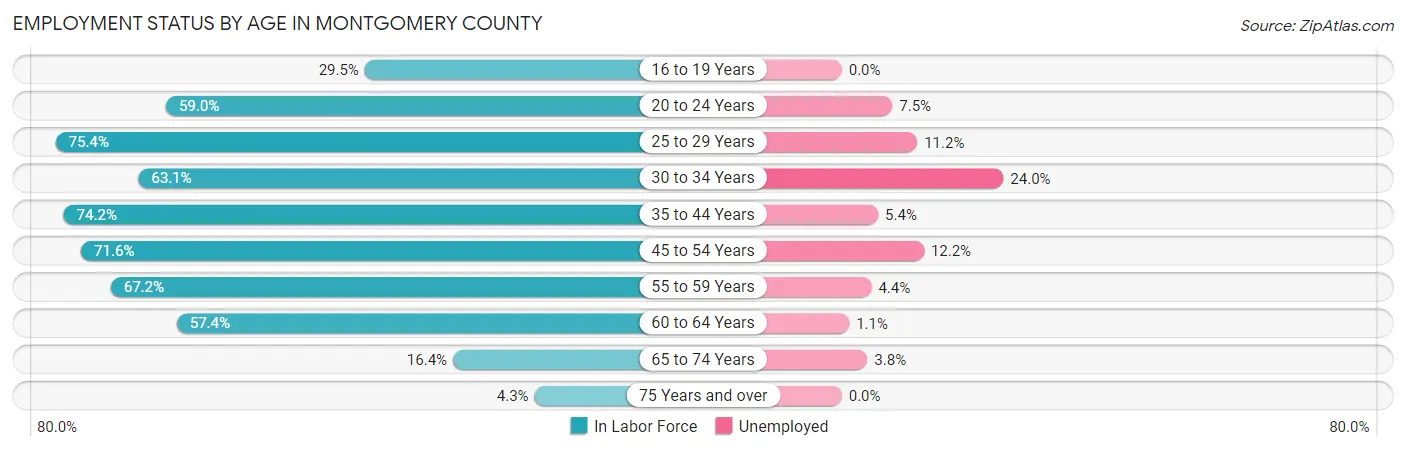
| Age Bracket | In Labor Force | Unemployed |
| 16 to 19 Years | 211 (29.5%) | 0 (0.0%) |
| 20 to 24 Years | 239 (59.0%) | 18 (7.5%) |
| 25 to 29 Years | 340 (75.4%) | 38 (11.2%) |
| 30 to 34 Years | 321 (63.1%) | 77 (24.0%) |
| 35 to 44 Years | 868 (74.2%) | 47 (5.4%) |
| 45 to 54 Years | 713 (71.6%) | 87 (12.2%) |
| 55 to 59 Years | 412 (67.2%) | 18 (4.4%) |
| 60 to 64 Years | 464 (57.4%) | 5 (1.1%) |
| 65 to 74 Years | 211 (16.4%) | 8 (3.8%) |
| 75 Years and over | 38 (4.3%) | 0 (0.0%) |
| Total | 3,816 (48.7%) | 298 (7.8%) |
Employment Status by Educational Attainment in Montgomery County
According to labor force statistics for Montgomery County, 68.6% of individuals (3,120) out of the total population between 25 and 64 years of age (4,548) are in the labor force, with 8.7% or 271 of them being unemployed. The group with the highest labor force participation rate are those with the educational attainment of bachelor's degree or higher, with 90.3% or 699 individuals in the labor force. Within the labor force, individuals with less than high school education have the highest percentage of unemployment, with 16.6% or 91 of them being unemployed.
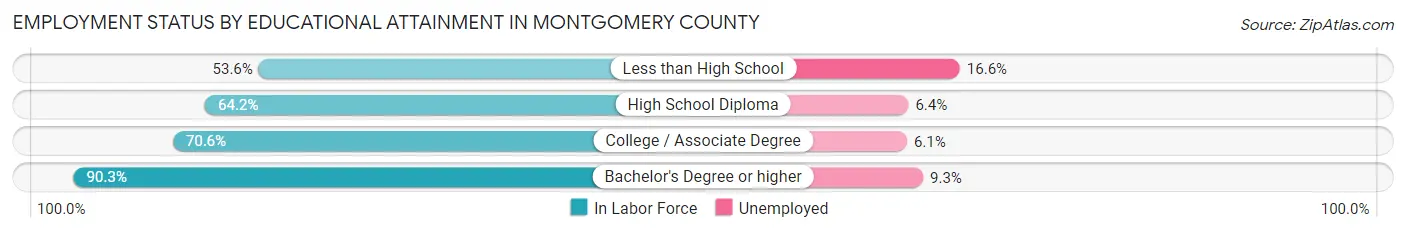
| Educational Attainment | In Labor Force | Unemployed |
| Less than High School | 548 (53.6%) | 170 (16.6%) |
| High School Diploma | 723 (64.2%) | 72 (6.4%) |
| College / Associate Degree | 1,147 (70.6%) | 99 (6.1%) |
| Bachelor's Degree or higher | 699 (90.3%) | 72 (9.3%) |
| Total | 3,120 (68.6%) | 396 (8.7%) |
Employment Occupations by Sex in Montgomery County
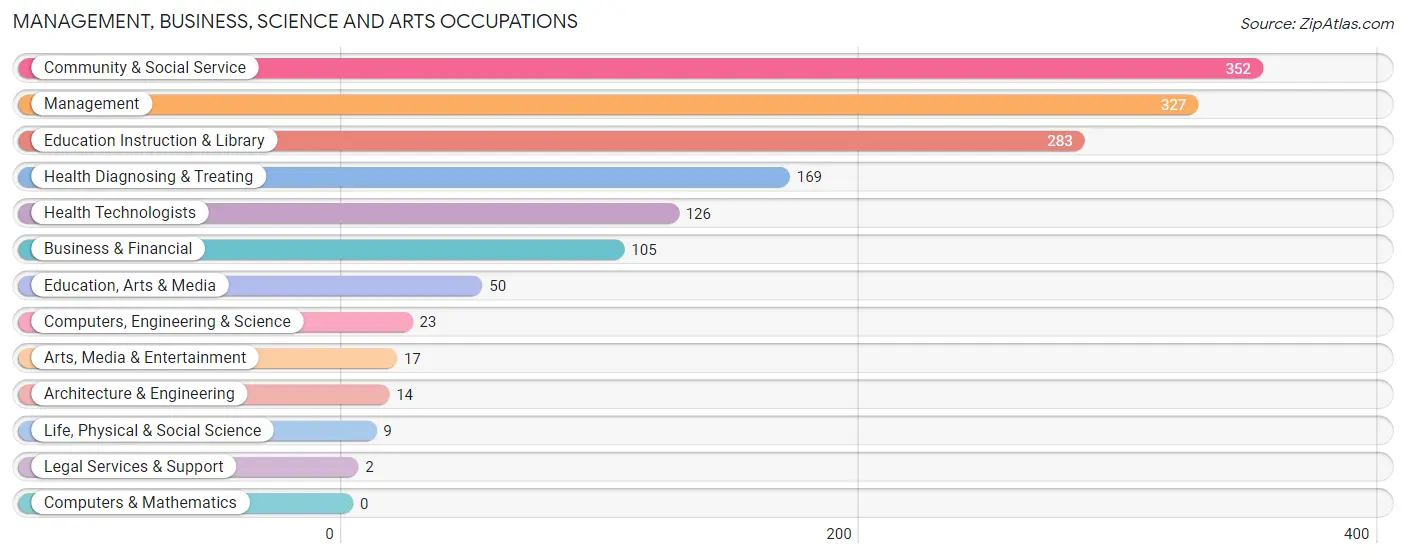
Management, Business, Science and Arts Occupations
The most common Management, Business, Science and Arts occupations in Montgomery County are Community & Social Service (352 | 10.0%), Management (327 | 9.3%), Education Instruction & Library (283 | 8.0%), Health Diagnosing & Treating (169 | 4.8%), and Health Technologists (126 | 3.6%).
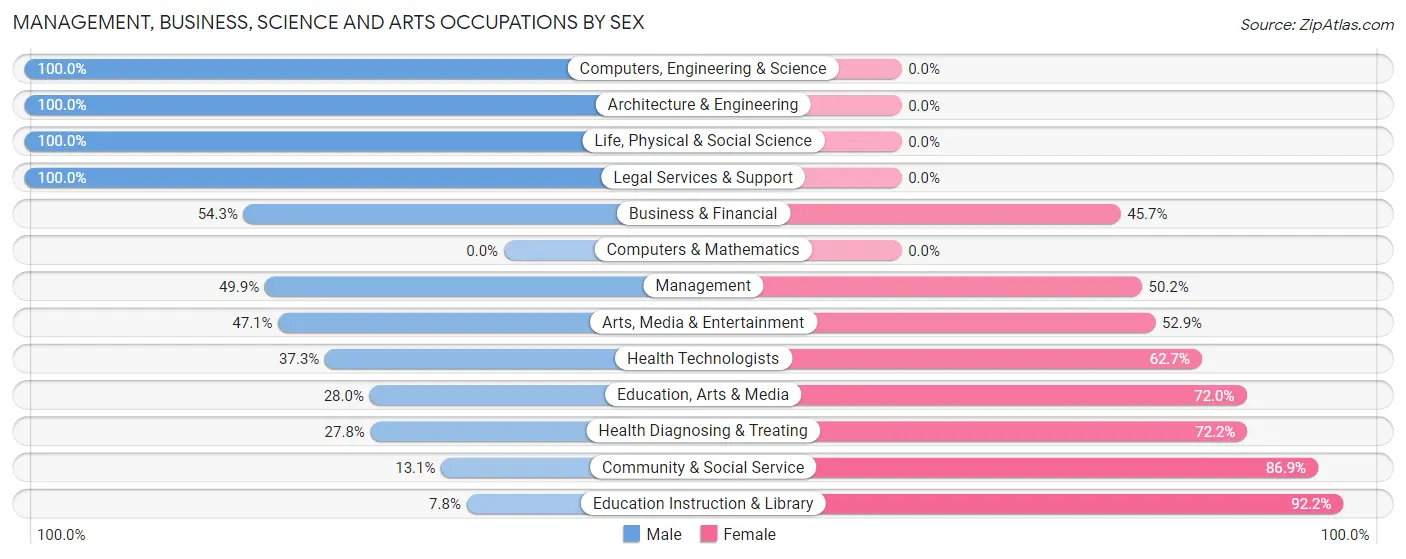
Management, Business, Science and Arts Occupations by Sex
Within the Management, Business, Science and Arts occupations in Montgomery County, the most male-oriented occupations are Computers, Engineering & Science (100.0%), Architecture & Engineering (100.0%), and Life, Physical & Social Science (100.0%), while the most female-oriented occupations are Education Instruction & Library (92.2%), Community & Social Service (86.9%), and Health Diagnosing & Treating (72.2%).
| Occupation | Male | Female |
| Management | 163 (49.8%) | 164 (50.1%) |
| Business & Financial | 57 (54.3%) | 48 (45.7%) |
| Computers, Engineering & Science | 23 (100.0%) | 0 (0.0%) |
| Computers & Mathematics | 0 (0.0%) | 0 (0.0%) |
| Architecture & Engineering | 14 (100.0%) | 0 (0.0%) |
| Life, Physical & Social Science | 9 (100.0%) | 0 (0.0%) |
| Community & Social Service | 46 (13.1%) | 306 (86.9%) |
| Education, Arts & Media | 14 (28.0%) | 36 (72.0%) |
| Legal Services & Support | 2 (100.0%) | 0 (0.0%) |
| Education Instruction & Library | 22 (7.8%) | 261 (92.2%) |
| Arts, Media & Entertainment | 8 (47.1%) | 9 (52.9%) |
| Health Diagnosing & Treating | 47 (27.8%) | 122 (72.2%) |
| Health Technologists | 47 (37.3%) | 79 (62.7%) |
| Total (Category) | 336 (34.4%) | 640 (65.6%) |
| Total (Overall) | 1,694 (48.1%) | 1,825 (51.9%) |
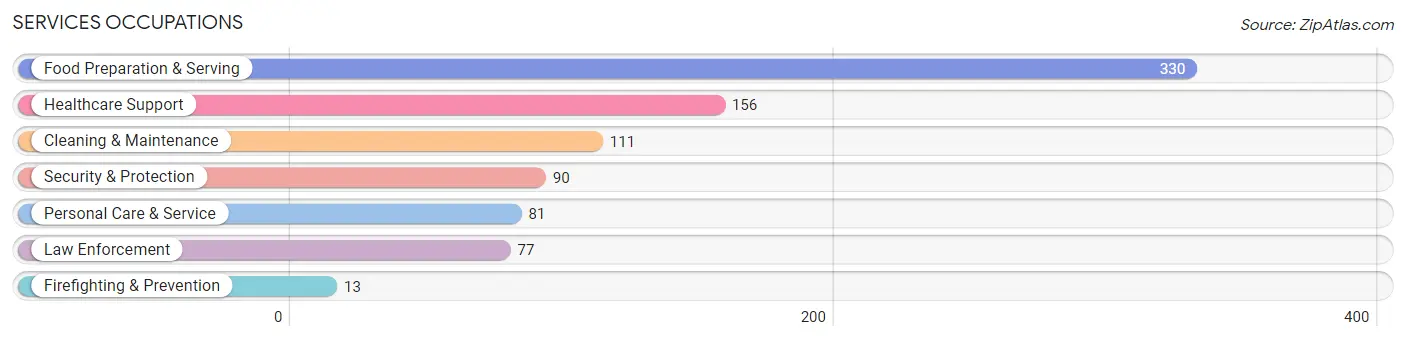
Services Occupations
The most common Services occupations in Montgomery County are Food Preparation & Serving (330 | 9.4%), Healthcare Support (156 | 4.4%), Cleaning & Maintenance (111 | 3.2%), Security & Protection (90 | 2.6%), and Personal Care & Service (81 | 2.3%).
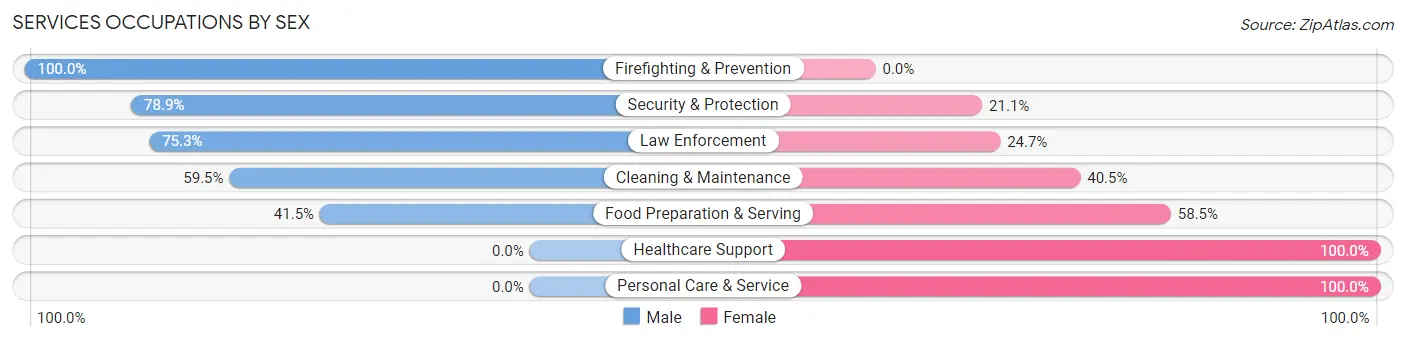
Services Occupations by Sex
Within the Services occupations in Montgomery County, the most male-oriented occupations are Firefighting & Prevention (100.0%), Security & Protection (78.9%), and Law Enforcement (75.3%), while the most female-oriented occupations are Healthcare Support (100.0%), Personal Care & Service (100.0%), and Food Preparation & Serving (58.5%).
| Occupation | Male | Female |
| Healthcare Support | 0 (0.0%) | 156 (100.0%) |
| Security & Protection | 71 (78.9%) | 19 (21.1%) |
| Firefighting & Prevention | 13 (100.0%) | 0 (0.0%) |
| Law Enforcement | 58 (75.3%) | 19 (24.7%) |
| Food Preparation & Serving | 137 (41.5%) | 193 (58.5%) |
| Cleaning & Maintenance | 66 (59.5%) | 45 (40.5%) |
| Personal Care & Service | 0 (0.0%) | 81 (100.0%) |
| Total (Category) | 274 (35.7%) | 494 (64.3%) |
| Total (Overall) | 1,694 (48.1%) | 1,825 (51.9%) |
Sales and Office Occupations
The most common Sales and Office occupations in Montgomery County are Sales & Related (333 | 9.5%), and Office & Administration (315 | 8.9%).
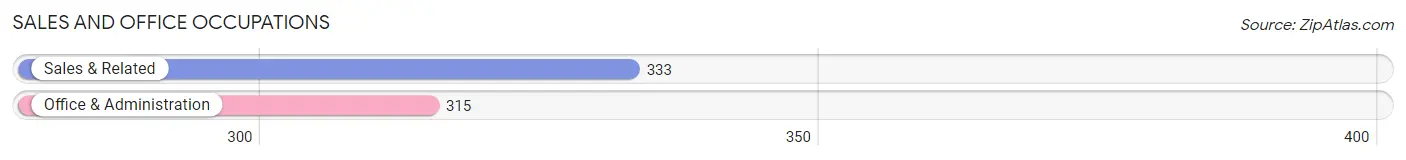
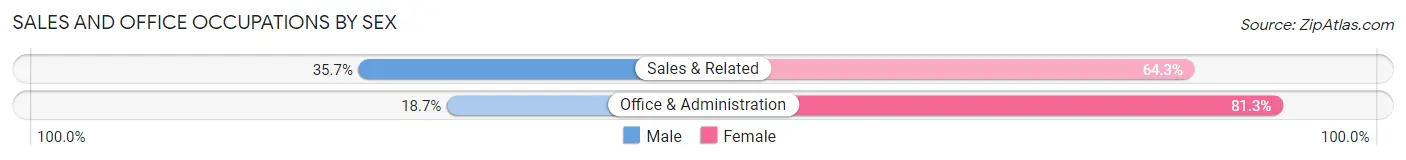
Sales and Office Occupations by Sex
| Occupation | Male | Female |
| Sales & Related | 119 (35.7%) | 214 (64.3%) |
| Office & Administration | 59 (18.7%) | 256 (81.3%) |
| Total (Category) | 178 (27.5%) | 470 (72.5%) |
| Total (Overall) | 1,694 (48.1%) | 1,825 (51.9%) |
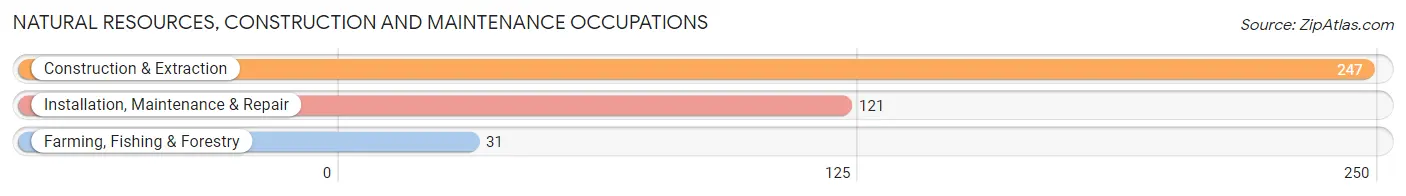
Natural Resources, Construction and Maintenance Occupations
The most common Natural Resources, Construction and Maintenance occupations in Montgomery County are Construction & Extraction (247 | 7.0%), Installation, Maintenance & Repair (121 | 3.4%), and Farming, Fishing & Forestry (31 | 0.9%).
Natural Resources, Construction and Maintenance Occupations by Sex
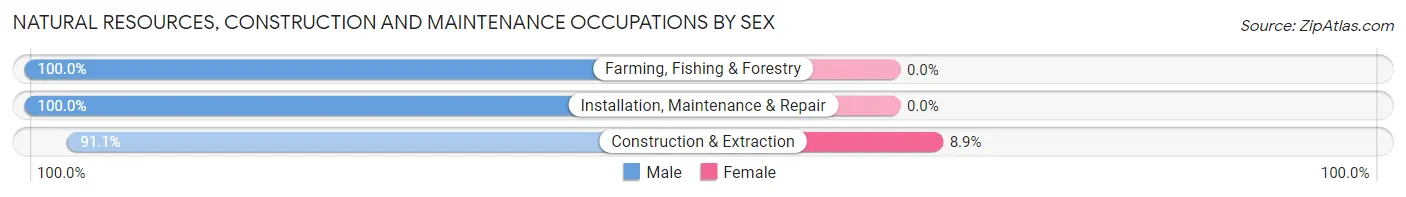
| Occupation | Male | Female |
| Farming, Fishing & Forestry | 31 (100.0%) | 0 (0.0%) |
| Construction & Extraction | 225 (91.1%) | 22 (8.9%) |
| Installation, Maintenance & Repair | 121 (100.0%) | 0 (0.0%) |
| Total (Category) | 377 (94.5%) | 22 (5.5%) |
| Total (Overall) | 1,694 (48.1%) | 1,825 (51.9%) |
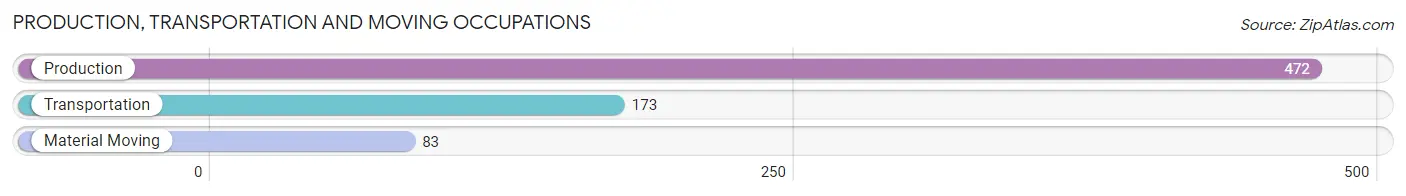
Production, Transportation and Moving Occupations
The most common Production, Transportation and Moving occupations in Montgomery County are Production (472 | 13.4%), Transportation (173 | 4.9%), and Material Moving (83 | 2.4%).
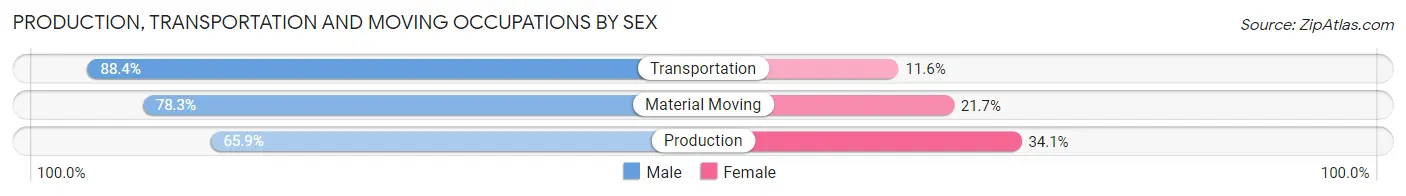
Production, Transportation and Moving Occupations by Sex
| Occupation | Male | Female |
| Production | 311 (65.9%) | 161 (34.1%) |
| Transportation | 153 (88.4%) | 20 (11.6%) |
| Material Moving | 65 (78.3%) | 18 (21.7%) |
| Total (Category) | 529 (72.7%) | 199 (27.3%) |
| Total (Overall) | 1,694 (48.1%) | 1,825 (51.9%) |
Employment Industries by Sex in Montgomery County
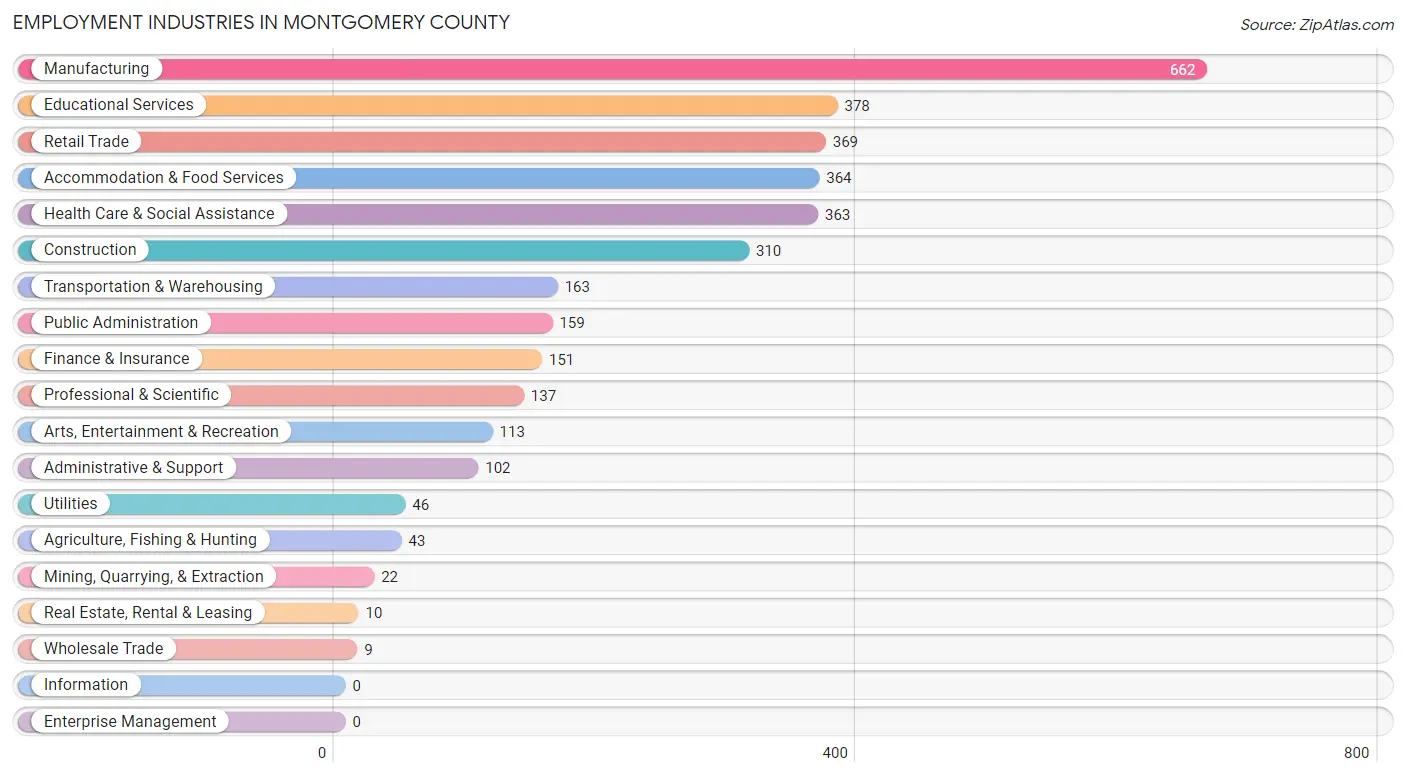
Employment Industries in Montgomery County
The major employment industries in Montgomery County include Manufacturing (662 | 18.8%), Educational Services (378 | 10.7%), Retail Trade (369 | 10.5%), Accommodation & Food Services (364 | 10.3%), and Health Care & Social Assistance (363 | 10.3%).
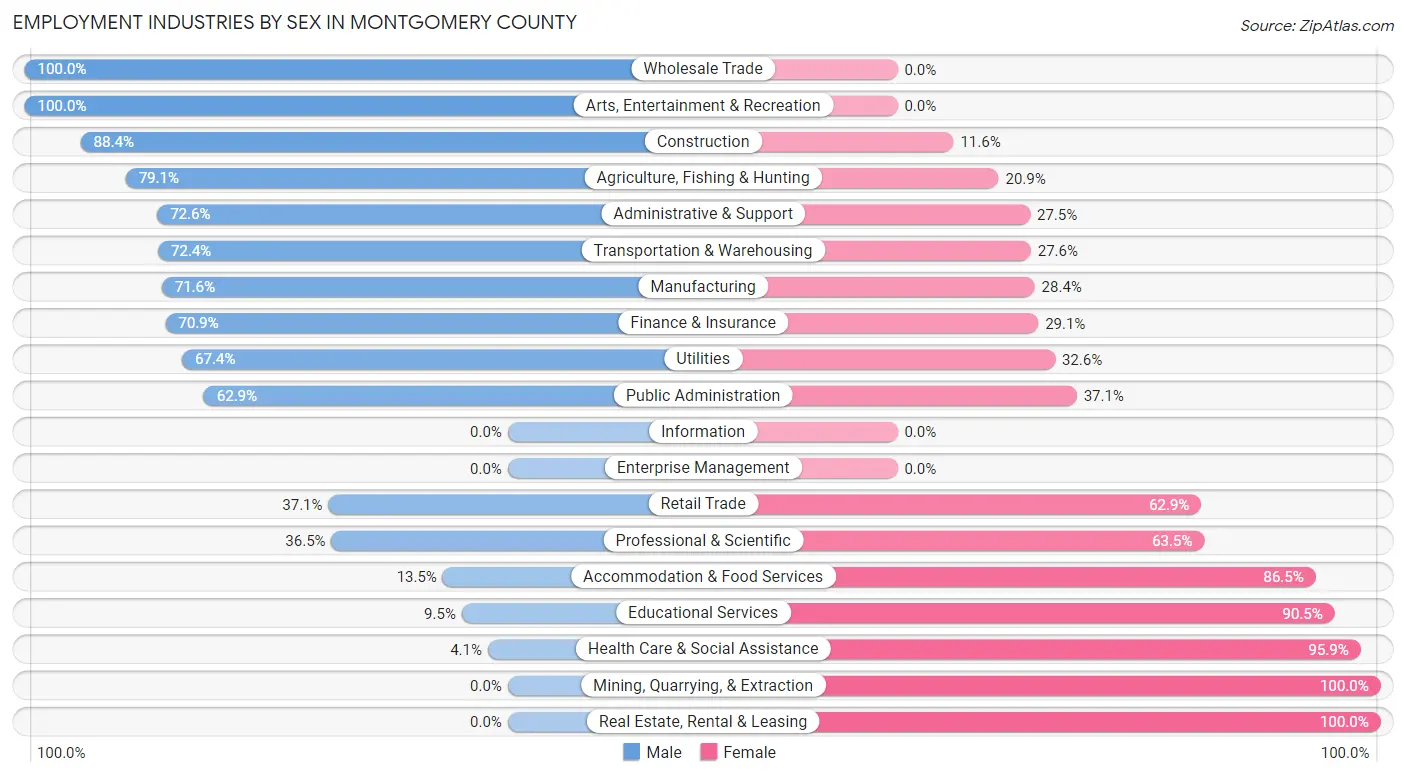
Employment Industries by Sex in Montgomery County
The Montgomery County industries that see more men than women are Wholesale Trade (100.0%), Arts, Entertainment & Recreation (100.0%), and Construction (88.4%), whereas the industries that tend to have a higher number of women are Mining, Quarrying, & Extraction (100.0%), Real Estate, Rental & Leasing (100.0%), and Health Care & Social Assistance (95.9%).
| Industry | Male | Female |
| Agriculture, Fishing & Hunting | 34 (79.1%) | 9 (20.9%) |
| Mining, Quarrying, & Extraction | 0 (0.0%) | 22 (100.0%) |
| Construction | 274 (88.4%) | 36 (11.6%) |
| Manufacturing | 474 (71.6%) | 188 (28.4%) |
| Wholesale Trade | 9 (100.0%) | 0 (0.0%) |
| Retail Trade | 137 (37.1%) | 232 (62.9%) |
| Transportation & Warehousing | 118 (72.4%) | 45 (27.6%) |
| Utilities | 31 (67.4%) | 15 (32.6%) |
| Information | 0 (0.0%) | 0 (0.0%) |
| Finance & Insurance | 107 (70.9%) | 44 (29.1%) |
| Real Estate, Rental & Leasing | 0 (0.0%) | 10 (100.0%) |
| Professional & Scientific | 50 (36.5%) | 87 (63.5%) |
| Enterprise Management | 0 (0.0%) | 0 (0.0%) |
| Administrative & Support | 74 (72.6%) | 28 (27.5%) |
| Educational Services | 36 (9.5%) | 342 (90.5%) |
| Health Care & Social Assistance | 15 (4.1%) | 348 (95.9%) |
| Arts, Entertainment & Recreation | 113 (100.0%) | 0 (0.0%) |
| Accommodation & Food Services | 49 (13.5%) | 315 (86.5%) |
| Public Administration | 100 (62.9%) | 59 (37.1%) |
| Total | 1,694 (48.1%) | 1,825 (51.9%) |
Education in Montgomery County
School Enrollment in Montgomery County
The most common levels of schooling among the 2,315 students in Montgomery County are middle school (624 | 27.0%), elementary school (572 | 24.7%), and college / undergraduate (531 | 22.9%).
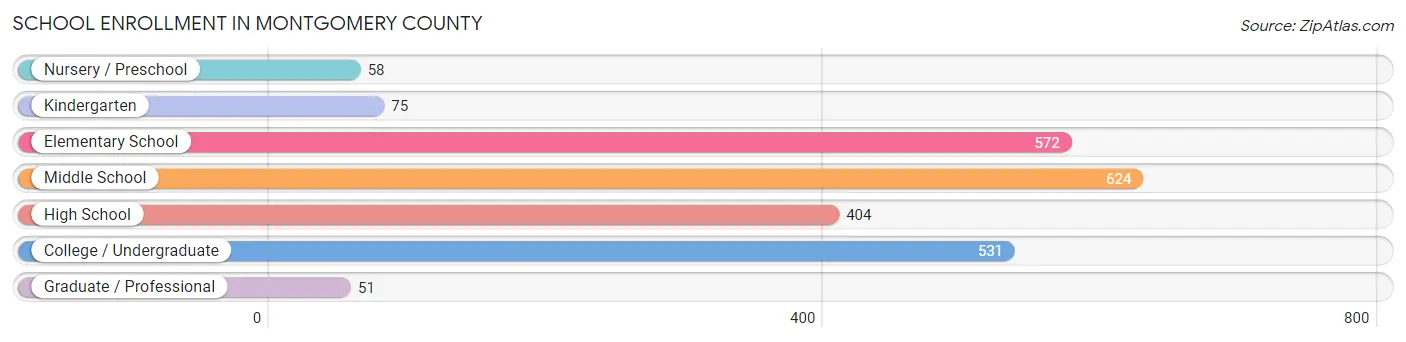
| School Level | # Students | % Students |
| Nursery / Preschool | 58 | 2.5% |
| Kindergarten | 75 | 3.2% |
| Elementary School | 572 | 24.7% |
| Middle School | 624 | 27.0% |
| High School | 404 | 17.4% |
| College / Undergraduate | 531 | 22.9% |
| Graduate / Professional | 51 | 2.2% |
| Total | 2,315 | 100.0% |
School Enrollment by Age by Funding Source in Montgomery County
Out of a total of 2,315 students who are enrolled in schools in Montgomery County, 250 (10.8%) attend a private institution, while the remaining 2,065 (89.2%) are enrolled in public schools. The age group of 35 years and over has the highest likelihood of being enrolled in private schools, with 72 (43.4% in the age bracket) enrolled. Conversely, the age group of 3 to 4 year olds has the lowest likelihood of being enrolled in a private school, with 58 (100.0% in the age bracket) attending a public institution.
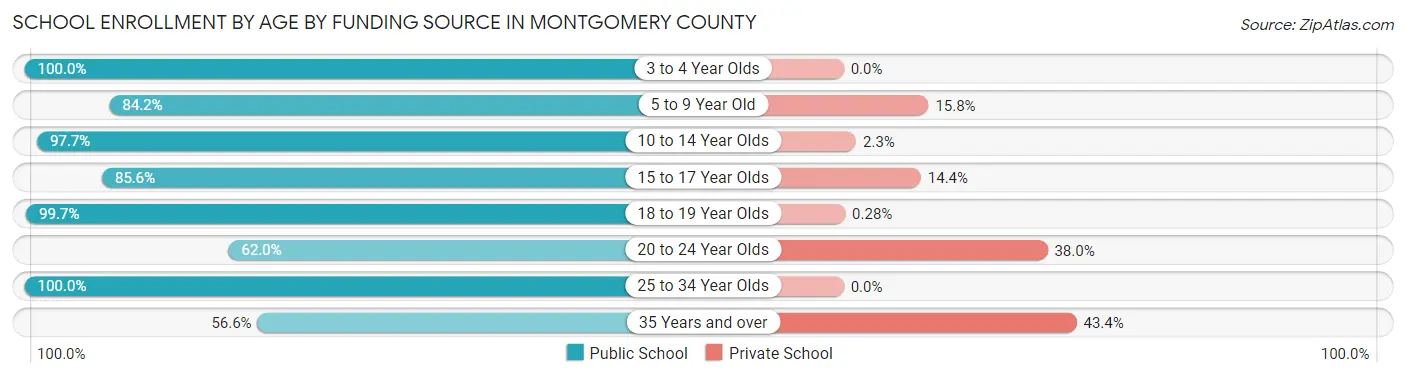
| Age Bracket | Public School | Private School |
| 3 to 4 Year Olds | 58 (100.0%) | 0 (0.0%) |
| 5 to 9 Year Old | 384 (84.2%) | 72 (15.8%) |
| 10 to 14 Year Olds | 802 (97.7%) | 19 (2.3%) |
| 15 to 17 Year Olds | 268 (85.6%) | 45 (14.4%) |
| 18 to 19 Year Olds | 362 (99.7%) | 1 (0.3%) |
| 20 to 24 Year Olds | 67 (62.0%) | 41 (38.0%) |
| 25 to 34 Year Olds | 30 (100.0%) | 0 (0.0%) |
| 35 Years and over | 94 (56.6%) | 72 (43.4%) |
| Total | 2,065 (89.2%) | 250 (10.8%) |
Educational Attainment by Field of Study in Montgomery County
Education (378 | 29.5%), arts & humanities (202 | 15.7%), business (179 | 14.0%), bio, nature & agricultural (176 | 13.7%), and science & technology (132 | 10.3%) are the most common fields of study among 1,283 individuals in Montgomery County who have obtained a bachelor's degree or higher.
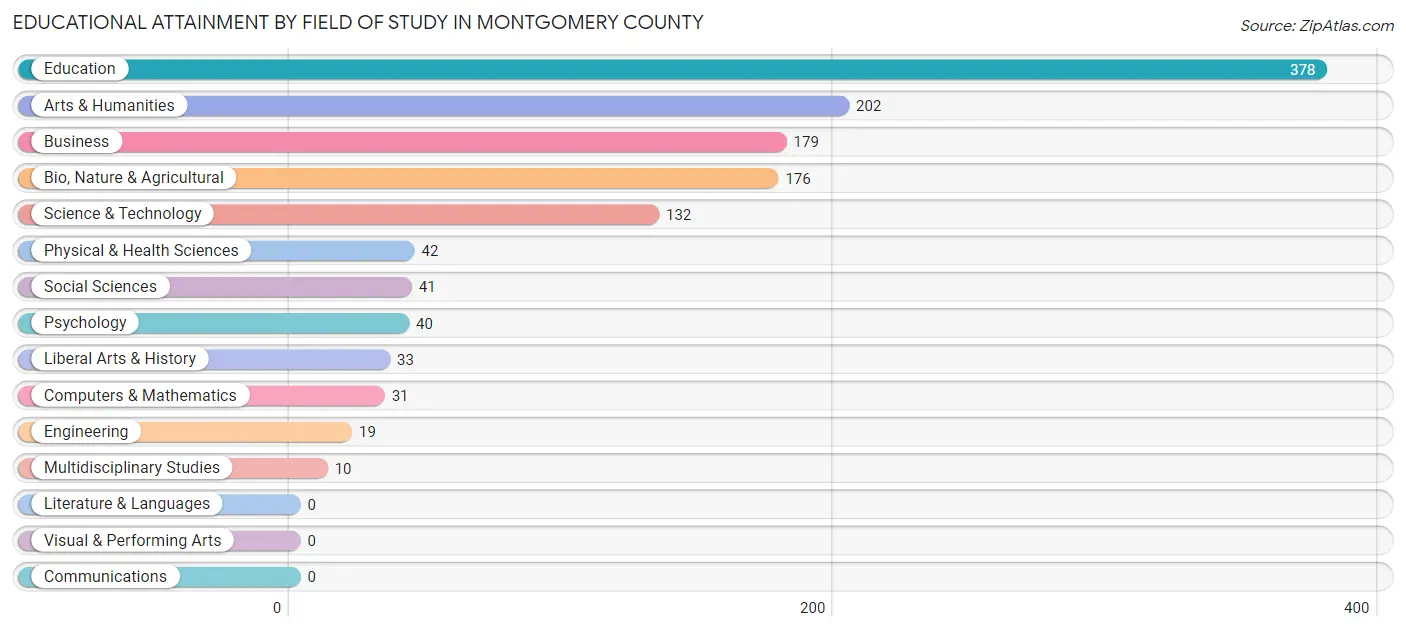
| Field of Study | # Graduates | % Graduates |
| Computers & Mathematics | 31 | 2.4% |
| Bio, Nature & Agricultural | 176 | 13.7% |
| Physical & Health Sciences | 42 | 3.3% |
| Psychology | 40 | 3.1% |
| Social Sciences | 41 | 3.2% |
| Engineering | 19 | 1.5% |
| Multidisciplinary Studies | 10 | 0.8% |
| Science & Technology | 132 | 10.3% |
| Business | 179 | 14.0% |
| Education | 378 | 29.5% |
| Literature & Languages | 0 | 0.0% |
| Liberal Arts & History | 33 | 2.6% |
| Visual & Performing Arts | 0 | 0.0% |
| Communications | 0 | 0.0% |
| Arts & Humanities | 202 | 15.7% |
| Total | 1,283 | 100.0% |
Transportation & Commute in Montgomery County
Vehicle Availability by Sex in Montgomery County
The most prevalent vehicle ownership categories in Montgomery County are males with 2 vehicles (777, accounting for 48.8%) and females with 2 vehicles (542, making up 43.3%).
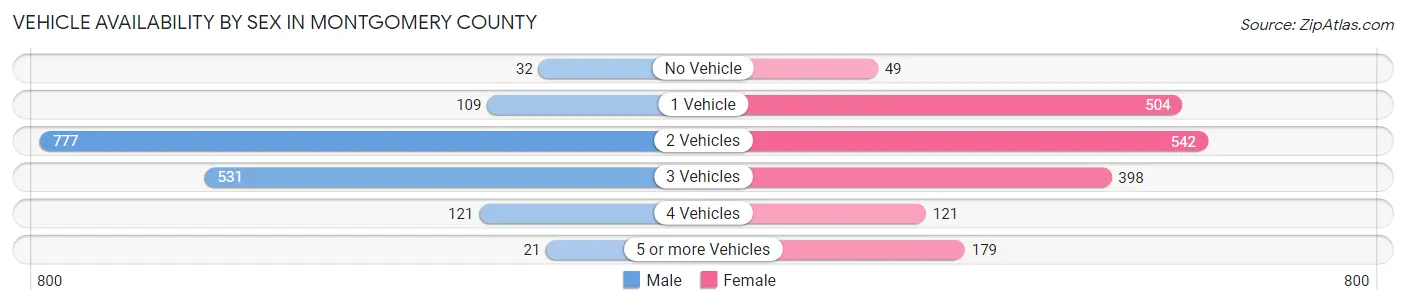
| Vehicles Available | Male | Female |
| No Vehicle | 32 (2.0%) | 49 (2.7%) |
| 1 Vehicle | 109 (6.9%) | 504 (28.1%) |
| 2 Vehicles | 777 (48.8%) | 542 (30.2%) |
| 3 Vehicles | 531 (33.4%) | 398 (22.2%) |
| 4 Vehicles | 121 (7.6%) | 121 (6.8%) |
| 5 or more Vehicles | 21 (1.3%) | 179 (10.0%) |
| Total | 1,591 (100.0%) | 1,793 (100.0%) |
Commute Time in Montgomery County
The most frequently occuring commute durations in Montgomery County are 30 to 34 minutes (572 commuters, 17.2%), 10 to 14 minutes (492 commuters, 14.8%), and 20 to 24 minutes (485 commuters, 14.6%).
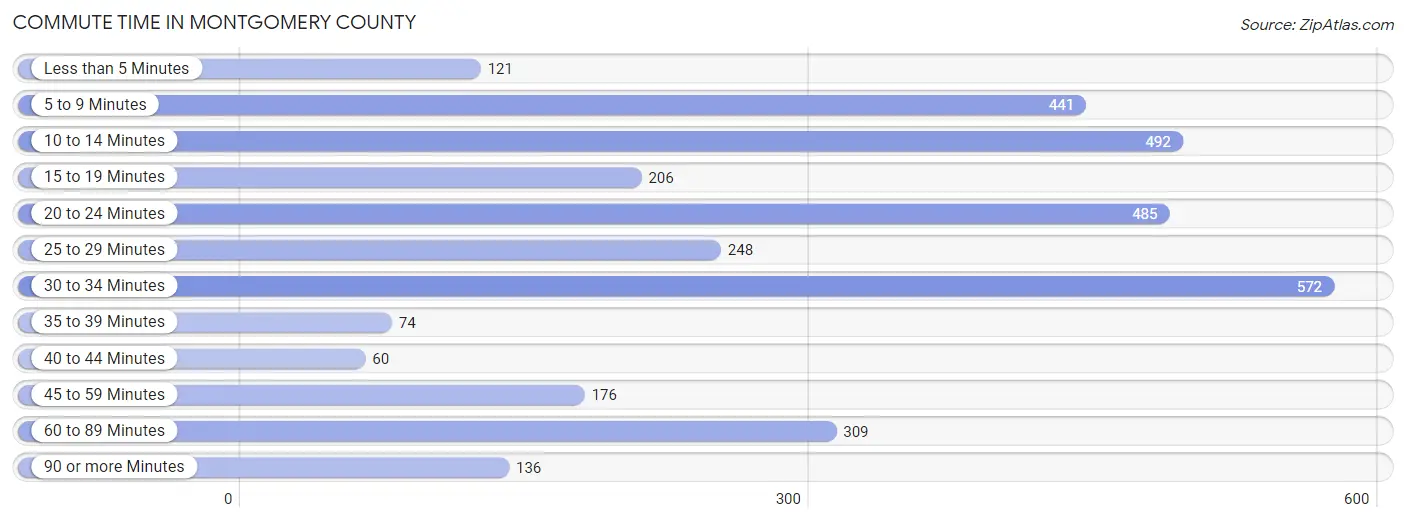
| Commute Time | # Commuters | % Commuters |
| Less than 5 Minutes | 121 | 3.6% |
| 5 to 9 Minutes | 441 | 13.3% |
| 10 to 14 Minutes | 492 | 14.8% |
| 15 to 19 Minutes | 206 | 6.2% |
| 20 to 24 Minutes | 485 | 14.6% |
| 25 to 29 Minutes | 248 | 7.5% |
| 30 to 34 Minutes | 572 | 17.2% |
| 35 to 39 Minutes | 74 | 2.2% |
| 40 to 44 Minutes | 60 | 1.8% |
| 45 to 59 Minutes | 176 | 5.3% |
| 60 to 89 Minutes | 309 | 9.3% |
| 90 or more Minutes | 136 | 4.1% |
Commute Time by Sex in Montgomery County
The most common commute times in Montgomery County are 30 to 34 minutes (361 commuters, 23.3%) for males and 5 to 9 minutes (355 commuters, 20.1%) for females.
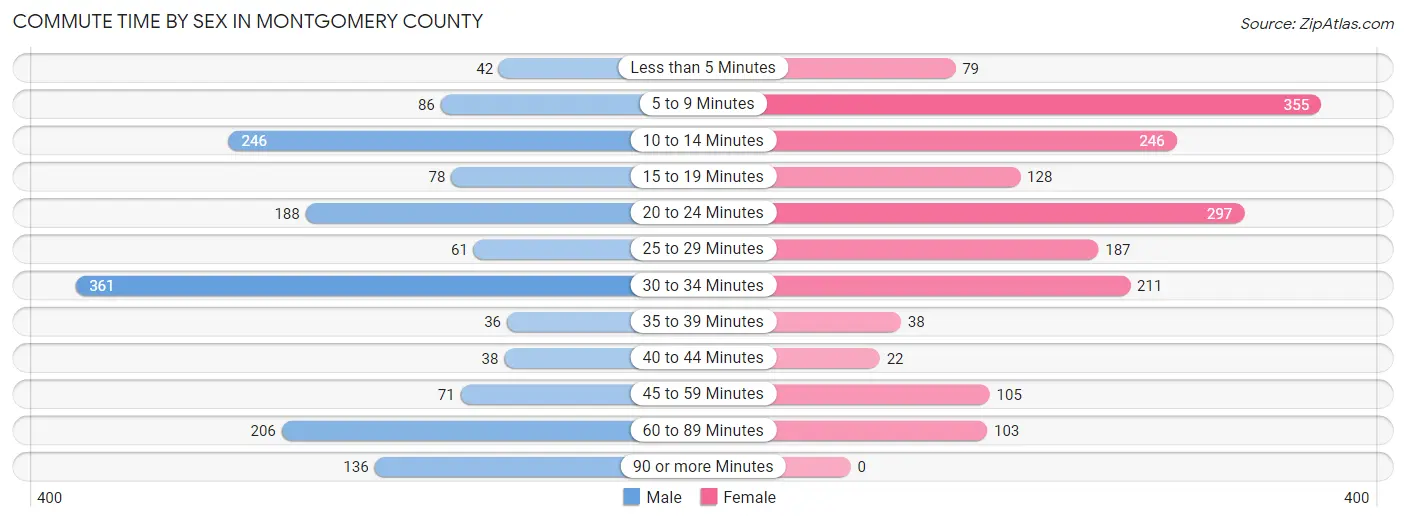
| Commute Time | Male | Female |
| Less than 5 Minutes | 42 (2.7%) | 79 (4.5%) |
| 5 to 9 Minutes | 86 (5.6%) | 355 (20.1%) |
| 10 to 14 Minutes | 246 (15.9%) | 246 (13.9%) |
| 15 to 19 Minutes | 78 (5.0%) | 128 (7.2%) |
| 20 to 24 Minutes | 188 (12.1%) | 297 (16.8%) |
| 25 to 29 Minutes | 61 (3.9%) | 187 (10.6%) |
| 30 to 34 Minutes | 361 (23.3%) | 211 (11.9%) |
| 35 to 39 Minutes | 36 (2.3%) | 38 (2.1%) |
| 40 to 44 Minutes | 38 (2.5%) | 22 (1.2%) |
| 45 to 59 Minutes | 71 (4.6%) | 105 (5.9%) |
| 60 to 89 Minutes | 206 (13.3%) | 103 (5.8%) |
| 90 or more Minutes | 136 (8.8%) | 0 (0.0%) |
Time of Departure to Work by Sex in Montgomery County
The most frequent times of departure to work in Montgomery County are 6:30 AM to 6:59 AM (384, 24.8%) for males and 7:00 AM to 7:29 AM (271, 15.3%) for females.
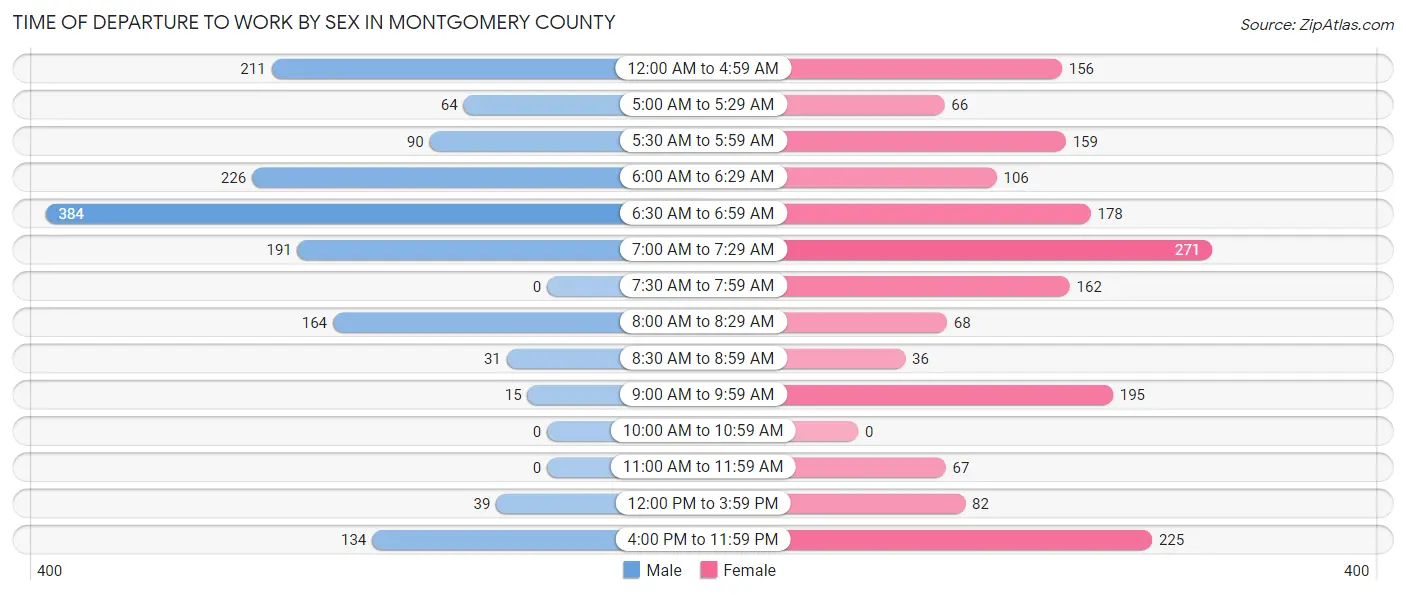
| Time of Departure | Male | Female |
| 12:00 AM to 4:59 AM | 211 (13.6%) | 156 (8.8%) |
| 5:00 AM to 5:29 AM | 64 (4.1%) | 66 (3.7%) |
| 5:30 AM to 5:59 AM | 90 (5.8%) | 159 (9.0%) |
| 6:00 AM to 6:29 AM | 226 (14.6%) | 106 (6.0%) |
| 6:30 AM to 6:59 AM | 384 (24.8%) | 178 (10.1%) |
| 7:00 AM to 7:29 AM | 191 (12.3%) | 271 (15.3%) |
| 7:30 AM to 7:59 AM | 0 (0.0%) | 162 (9.1%) |
| 8:00 AM to 8:29 AM | 164 (10.6%) | 68 (3.8%) |
| 8:30 AM to 8:59 AM | 31 (2.0%) | 36 (2.0%) |
| 9:00 AM to 9:59 AM | 15 (1.0%) | 195 (11.0%) |
| 10:00 AM to 10:59 AM | 0 (0.0%) | 0 (0.0%) |
| 11:00 AM to 11:59 AM | 0 (0.0%) | 67 (3.8%) |
| 12:00 PM to 3:59 PM | 39 (2.5%) | 82 (4.6%) |
| 4:00 PM to 11:59 PM | 134 (8.6%) | 225 (12.7%) |
| Total | 1,549 (100.0%) | 1,771 (100.0%) |
Housing Occupancy in Montgomery County
Occupancy by Ownership in Montgomery County
Of the total 3,830 dwellings in Montgomery County, owner-occupied units account for 2,552 (66.6%), while renter-occupied units make up 1,278 (33.4%).
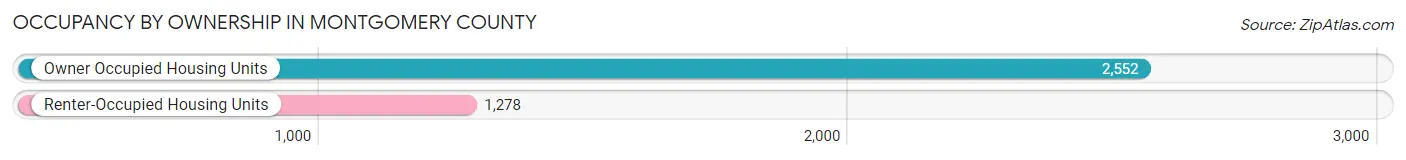
| Occupancy | # Housing Units | % Housing Units |
| Owner Occupied Housing Units | 2,552 | 66.6% |
| Renter-Occupied Housing Units | 1,278 | 33.4% |
| Total Occupied Housing Units | 3,830 | 100.0% |
Occupancy by Household Size in Montgomery County
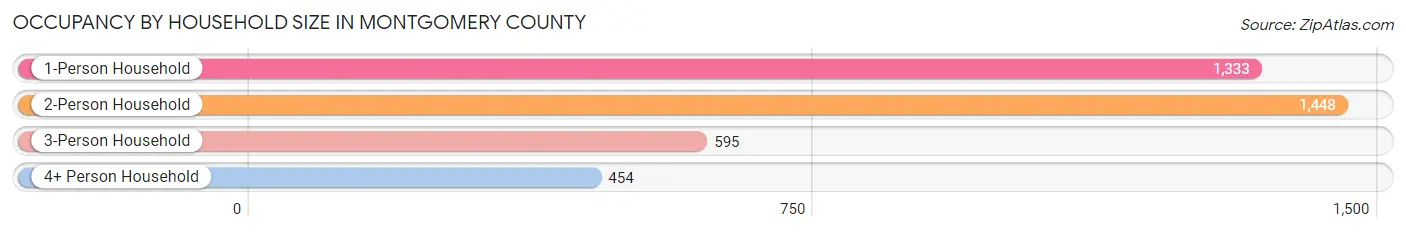
| Household Size | # Housing Units | % Housing Units |
| 1-Person Household | 1,333 | 34.8% |
| 2-Person Household | 1,448 | 37.8% |
| 3-Person Household | 595 | 15.5% |
| 4+ Person Household | 454 | 11.8% |
| Total Housing Units | 3,830 | 100.0% |
Occupancy by Ownership by Household Size in Montgomery County
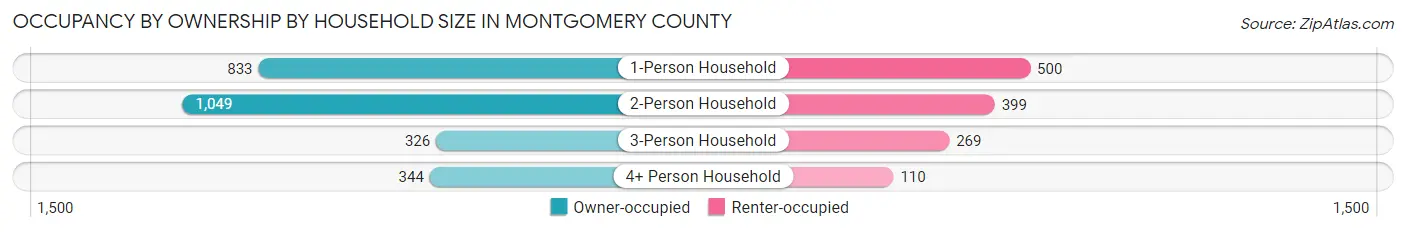
| Household Size | Owner-occupied | Renter-occupied |
| 1-Person Household | 833 (62.5%) | 500 (37.5%) |
| 2-Person Household | 1,049 (72.4%) | 399 (27.6%) |
| 3-Person Household | 326 (54.8%) | 269 (45.2%) |
| 4+ Person Household | 344 (75.8%) | 110 (24.2%) |
| Total Housing Units | 2,552 (66.6%) | 1,278 (33.4%) |
Occupancy by Educational Attainment in Montgomery County
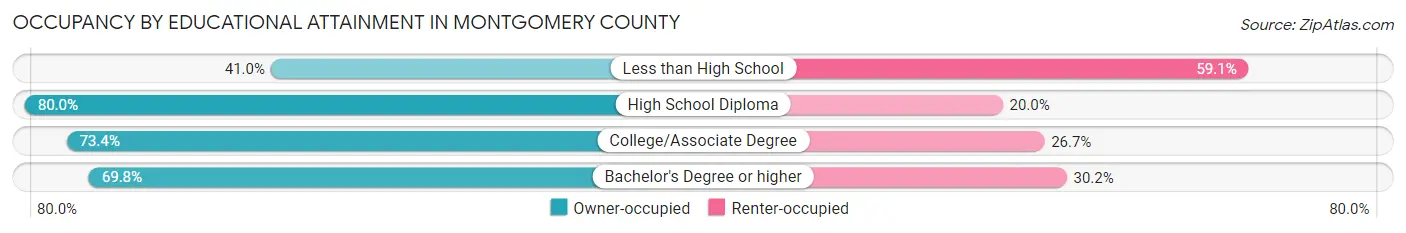
| Household Size | Owner-occupied | Renter-occupied |
| Less than High School | 380 (40.9%) | 548 (59.1%) |
| High School Diploma | 822 (80.0%) | 206 (20.0%) |
| College/Associate Degree | 867 (73.4%) | 315 (26.7%) |
| Bachelor's Degree or higher | 483 (69.8%) | 209 (30.2%) |
Occupancy by Age of Householder in Montgomery County
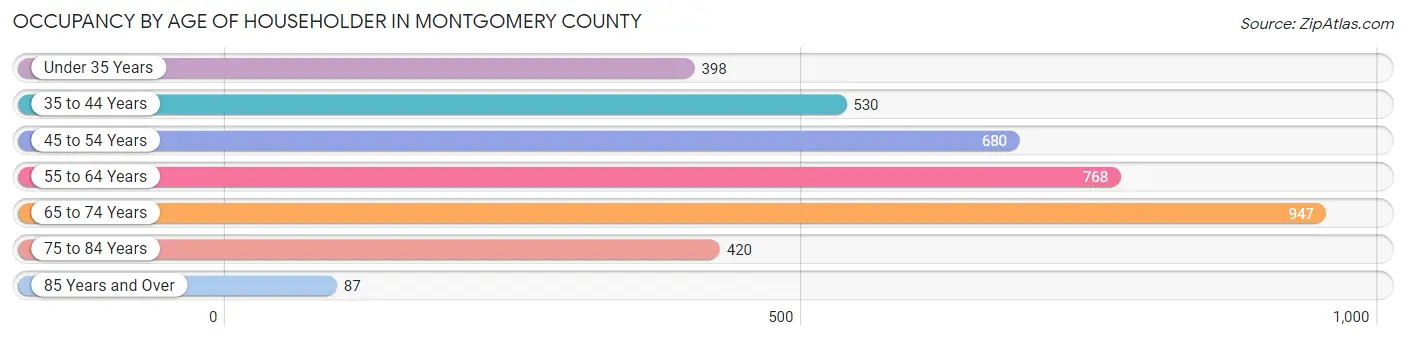
| Age Bracket | # Households | % Households |
| Under 35 Years | 398 | 10.4% |
| 35 to 44 Years | 530 | 13.8% |
| 45 to 54 Years | 680 | 17.7% |
| 55 to 64 Years | 768 | 20.1% |
| 65 to 74 Years | 947 | 24.7% |
| 75 to 84 Years | 420 | 11.0% |
| 85 Years and Over | 87 | 2.3% |
| Total | 3,830 | 100.0% |
Housing Finances in Montgomery County
Median Income by Occupancy in Montgomery County
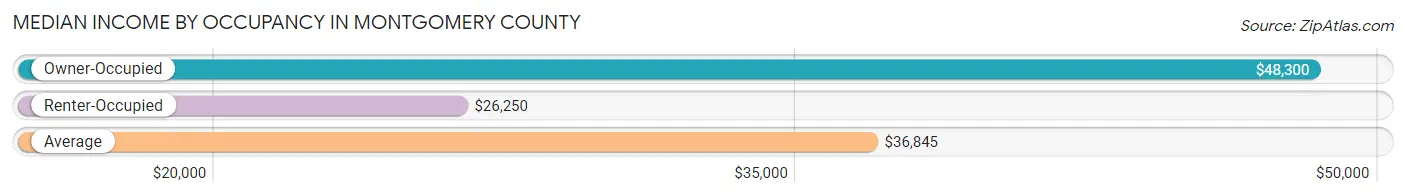
| Occupancy Type | # Households | Median Income |
| Owner-Occupied | 2,552 (66.6%) | $48,300 |
| Renter-Occupied | 1,278 (33.4%) | $26,250 |
| Average | 3,830 (100.0%) | $36,845 |
Occupancy by Householder Income Bracket in Montgomery County
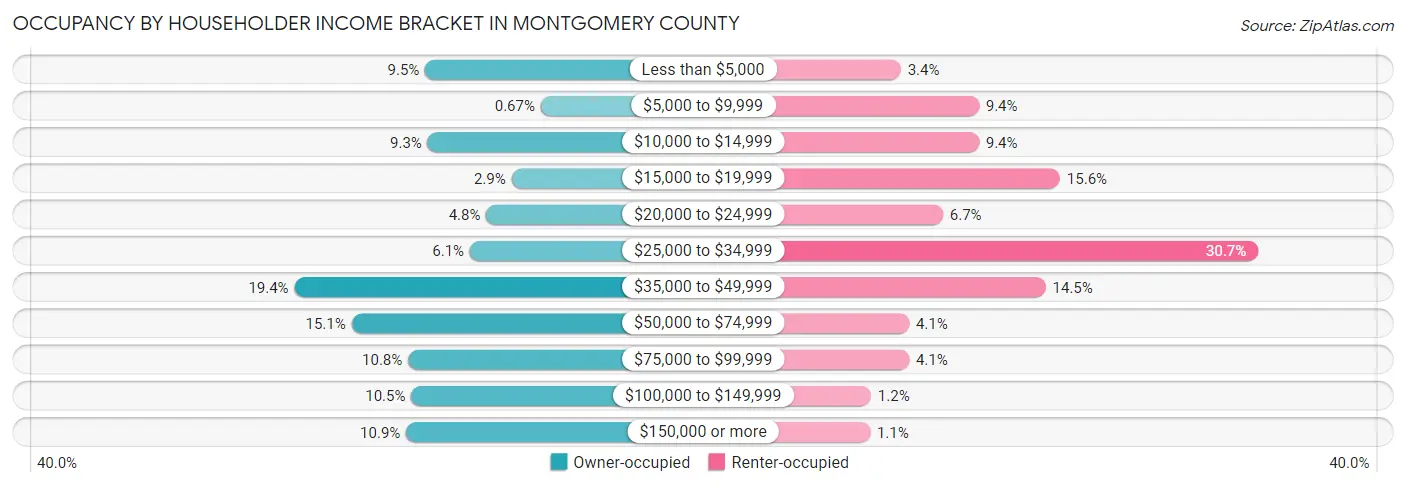
| Income Bracket | Owner-occupied | Renter-occupied |
| Less than $5,000 | 242 (9.5%) | 44 (3.4%) |
| $5,000 to $9,999 | 17 (0.7%) | 120 (9.4%) |
| $10,000 to $14,999 | 237 (9.3%) | 120 (9.4%) |
| $15,000 to $19,999 | 74 (2.9%) | 199 (15.6%) |
| $20,000 to $24,999 | 123 (4.8%) | 85 (6.7%) |
| $25,000 to $34,999 | 155 (6.1%) | 392 (30.7%) |
| $35,000 to $49,999 | 496 (19.4%) | 185 (14.5%) |
| $50,000 to $74,999 | 385 (15.1%) | 52 (4.1%) |
| $75,000 to $99,999 | 275 (10.8%) | 52 (4.1%) |
| $100,000 to $149,999 | 269 (10.5%) | 15 (1.2%) |
| $150,000 or more | 279 (10.9%) | 14 (1.1%) |
| Total | 2,552 (100.0%) | 1,278 (100.0%) |
Monthly Housing Cost Tiers in Montgomery County
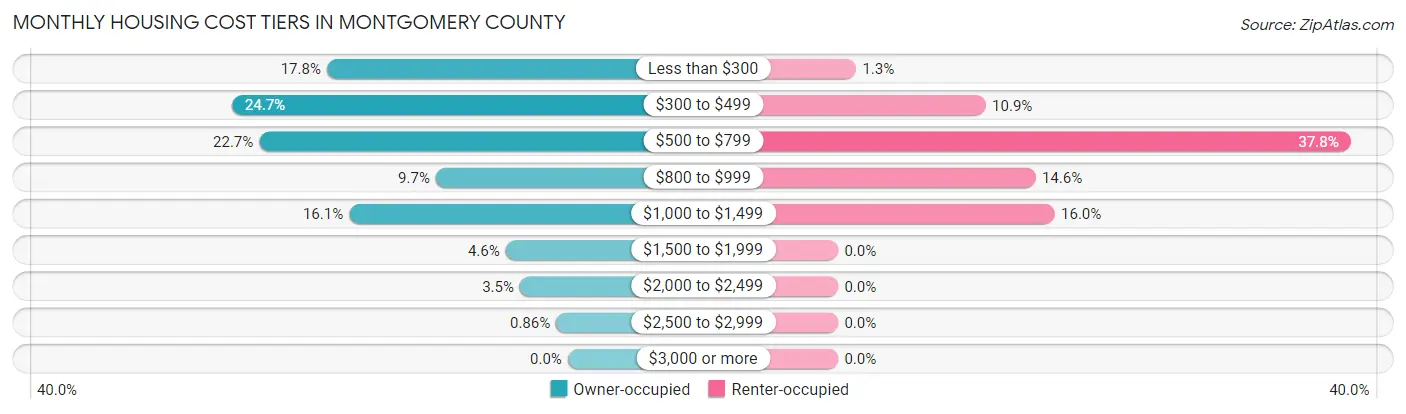
| Monthly Cost | Owner-occupied | Renter-occupied |
| Less than $300 | 453 (17.7%) | 17 (1.3%) |
| $300 to $499 | 631 (24.7%) | 139 (10.9%) |
| $500 to $799 | 580 (22.7%) | 483 (37.8%) |
| $800 to $999 | 248 (9.7%) | 186 (14.5%) |
| $1,000 to $1,499 | 411 (16.1%) | 204 (16.0%) |
| $1,500 to $1,999 | 117 (4.6%) | 0 (0.0%) |
| $2,000 to $2,499 | 90 (3.5%) | 0 (0.0%) |
| $2,500 to $2,999 | 22 (0.9%) | 0 (0.0%) |
| $3,000 or more | 0 (0.0%) | 0 (0.0%) |
| Total | 2,552 (100.0%) | 1,278 (100.0%) |
Physical Housing Characteristics in Montgomery County
Housing Structures in Montgomery County
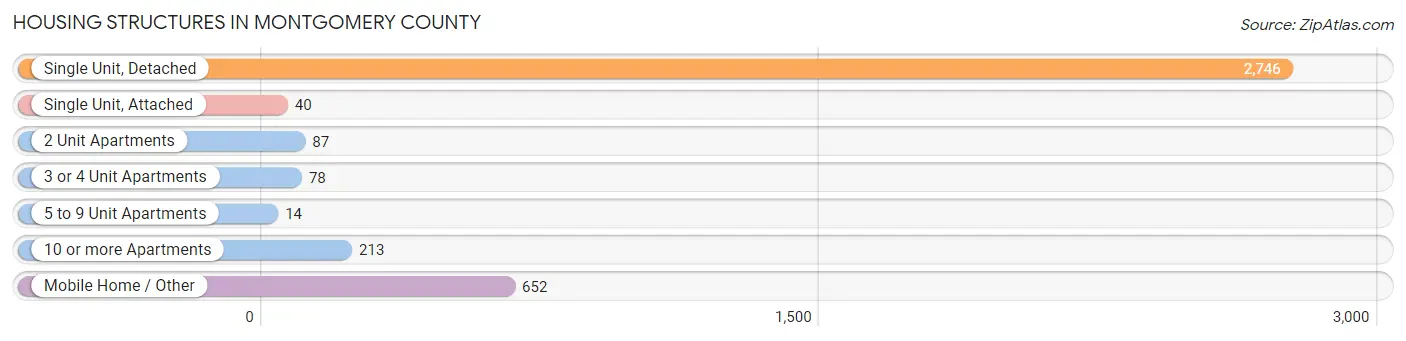
| Structure Type | # Housing Units | % Housing Units |
| Single Unit, Detached | 2,746 | 71.7% |
| Single Unit, Attached | 40 | 1.0% |
| 2 Unit Apartments | 87 | 2.3% |
| 3 or 4 Unit Apartments | 78 | 2.0% |
| 5 to 9 Unit Apartments | 14 | 0.4% |
| 10 or more Apartments | 213 | 5.6% |
| Mobile Home / Other | 652 | 17.0% |
| Total | 3,830 | 100.0% |
Housing Structures by Occupancy in Montgomery County
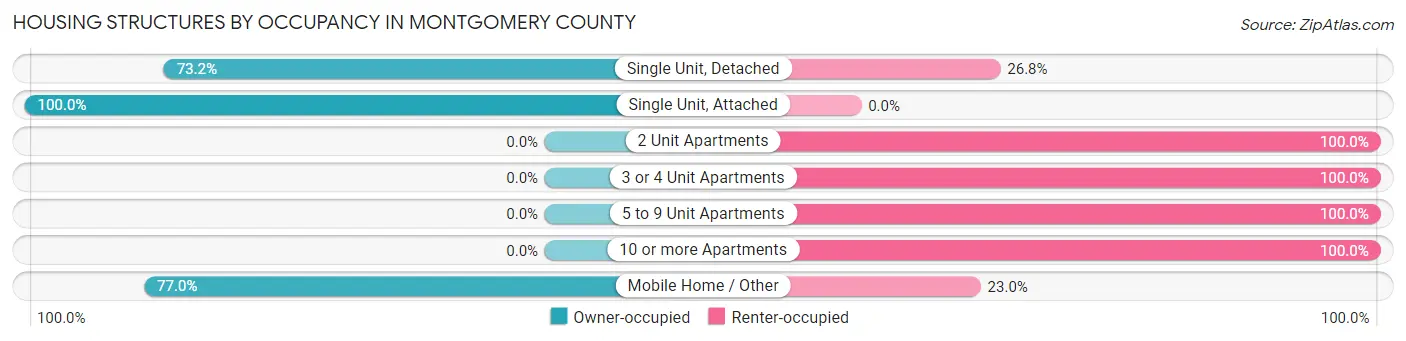
| Structure Type | Owner-occupied | Renter-occupied |
| Single Unit, Detached | 2,010 (73.2%) | 736 (26.8%) |
| Single Unit, Attached | 40 (100.0%) | 0 (0.0%) |
| 2 Unit Apartments | 0 (0.0%) | 87 (100.0%) |
| 3 or 4 Unit Apartments | 0 (0.0%) | 78 (100.0%) |
| 5 to 9 Unit Apartments | 0 (0.0%) | 14 (100.0%) |
| 10 or more Apartments | 0 (0.0%) | 213 (100.0%) |
| Mobile Home / Other | 502 (77.0%) | 150 (23.0%) |
| Total | 2,552 (66.6%) | 1,278 (33.4%) |
Housing Structures by Number of Rooms in Montgomery County
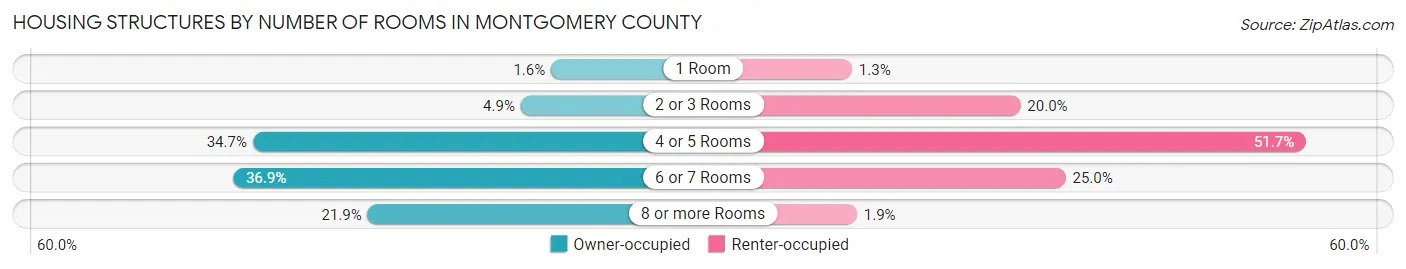
| Number of Rooms | Owner-occupied | Renter-occupied |
| 1 Room | 40 (1.6%) | 17 (1.3%) |
| 2 or 3 Rooms | 126 (4.9%) | 256 (20.0%) |
| 4 or 5 Rooms | 885 (34.7%) | 661 (51.7%) |
| 6 or 7 Rooms | 941 (36.9%) | 320 (25.0%) |
| 8 or more Rooms | 560 (21.9%) | 24 (1.9%) |
| Total | 2,552 (100.0%) | 1,278 (100.0%) |
Housing Structure by Heating Type in Montgomery County
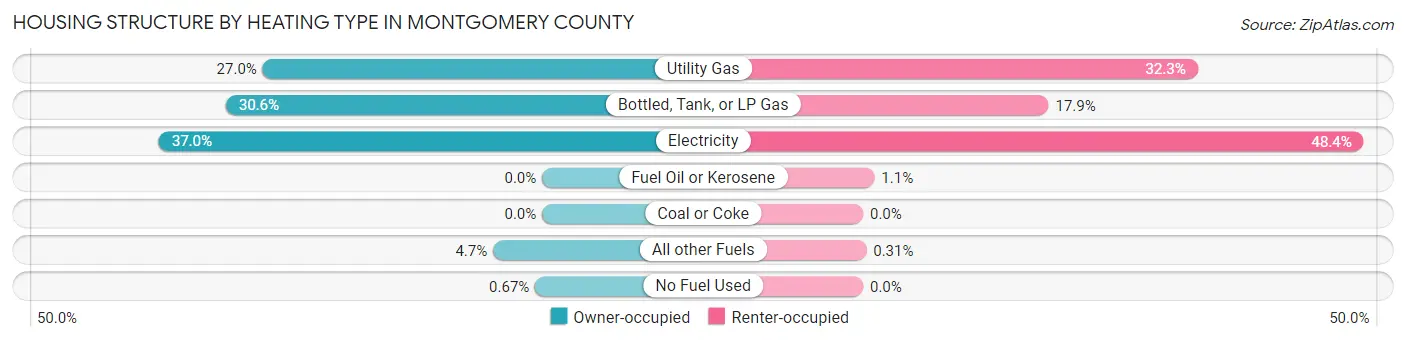
| Heating Type | Owner-occupied | Renter-occupied |
| Utility Gas | 689 (27.0%) | 413 (32.3%) |
| Bottled, Tank, or LP Gas | 780 (30.6%) | 229 (17.9%) |
| Electricity | 945 (37.0%) | 618 (48.4%) |
| Fuel Oil or Kerosene | 0 (0.0%) | 14 (1.1%) |
| Coal or Coke | 0 (0.0%) | 0 (0.0%) |
| All other Fuels | 121 (4.7%) | 4 (0.3%) |
| No Fuel Used | 17 (0.7%) | 0 (0.0%) |
| Total | 2,552 (100.0%) | 1,278 (100.0%) |
Household Vehicle Usage in Montgomery County
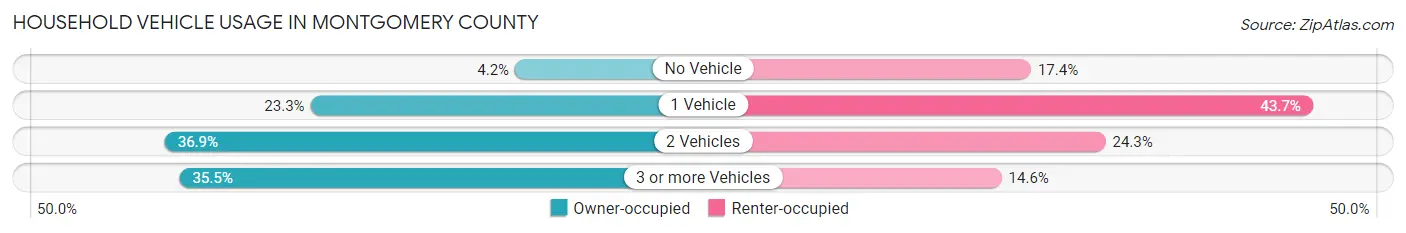
| Vehicles per Household | Owner-occupied | Renter-occupied |
| No Vehicle | 108 (4.2%) | 222 (17.4%) |
| 1 Vehicle | 595 (23.3%) | 558 (43.7%) |
| 2 Vehicles | 942 (36.9%) | 311 (24.3%) |
| 3 or more Vehicles | 907 (35.5%) | 187 (14.6%) |
| Total | 2,552 (100.0%) | 1,278 (100.0%) |
Real Estate & Mortgages in Montgomery County
Real Estate and Mortgage Overview in Montgomery County
| Characteristic | Without Mortgage | With Mortgage |
| Housing Units | 1,601 | 951 |
| Median Property Value | $90,900 | $104,300 |
| Median Household Income | $43,761 | $181 |
| Monthly Housing Costs | $414 | $0 |
| Real Estate Taxes | $625 | $261 |
Property Value by Mortgage Status in Montgomery County
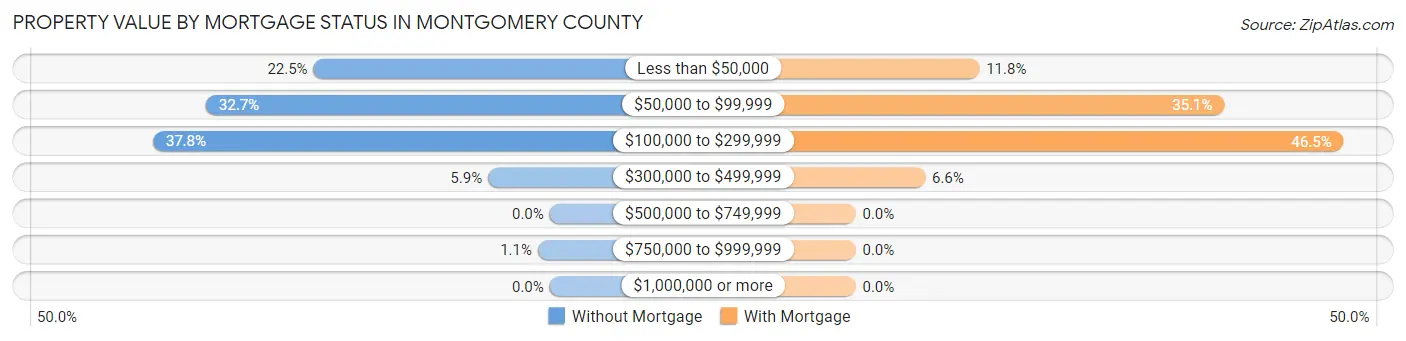
| Property Value | Without Mortgage | With Mortgage |
| Less than $50,000 | 360 (22.5%) | 112 (11.8%) |
| $50,000 to $99,999 | 524 (32.7%) | 334 (35.1%) |
| $100,000 to $299,999 | 605 (37.8%) | 442 (46.5%) |
| $300,000 to $499,999 | 94 (5.9%) | 63 (6.6%) |
| $500,000 to $749,999 | 0 (0.0%) | 0 (0.0%) |
| $750,000 to $999,999 | 18 (1.1%) | 0 (0.0%) |
| $1,000,000 or more | 0 (0.0%) | 0 (0.0%) |
| Total | 1,601 (100.0%) | 951 (100.0%) |
Household Income by Mortgage Status in Montgomery County
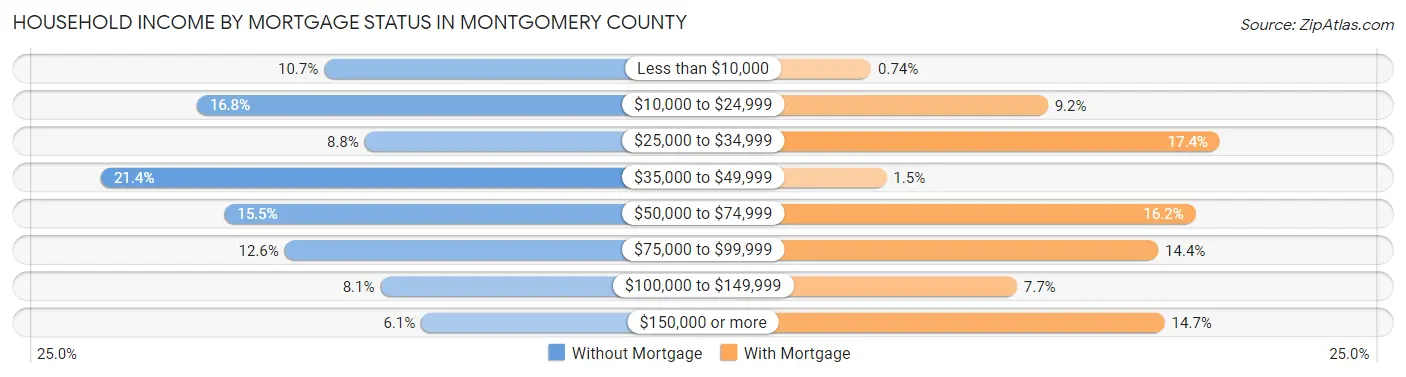
| Household Income | Without Mortgage | With Mortgage |
| Less than $10,000 | 172 (10.7%) | 7 (0.7%) |
| $10,000 to $24,999 | 269 (16.8%) | 87 (9.1%) |
| $25,000 to $34,999 | 141 (8.8%) | 165 (17.3%) |
| $35,000 to $49,999 | 342 (21.4%) | 14 (1.5%) |
| $50,000 to $74,999 | 248 (15.5%) | 154 (16.2%) |
| $75,000 to $99,999 | 202 (12.6%) | 137 (14.4%) |
| $100,000 to $149,999 | 129 (8.1%) | 73 (7.7%) |
| $150,000 or more | 98 (6.1%) | 140 (14.7%) |
| Total | 1,601 (100.0%) | 951 (100.0%) |
Property Value to Household Income Ratio in Montgomery County
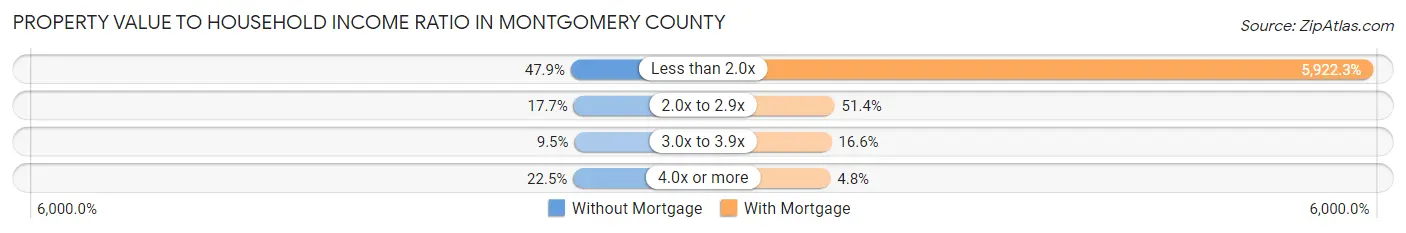
| Value-to-Income Ratio | Without Mortgage | With Mortgage |
| Less than 2.0x | 767 (47.9%) | 56,321 (5,922.3%) |
| 2.0x to 2.9x | 284 (17.7%) | 489 (51.4%) |
| 3.0x to 3.9x | 152 (9.5%) | 158 (16.6%) |
| 4.0x or more | 360 (22.5%) | 46 (4.8%) |
| Total | 1,601 (100.0%) | 951 (100.0%) |
Real Estate Taxes by Mortgage Status in Montgomery County
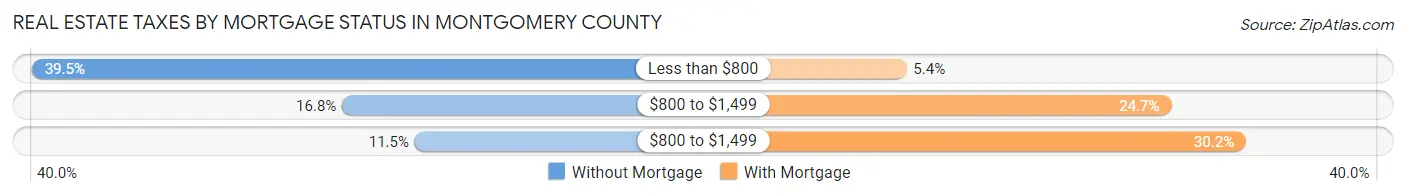
| Property Taxes | Without Mortgage | With Mortgage |
| Less than $800 | 632 (39.5%) | 51 (5.4%) |
| $800 to $1,499 | 269 (16.8%) | 235 (24.7%) |
| $800 to $1,499 | 184 (11.5%) | 287 (30.2%) |
| Total | 1,601 (100.0%) | 951 (100.0%) |
Health & Disability in Montgomery County
Health Insurance Coverage by Age in Montgomery County
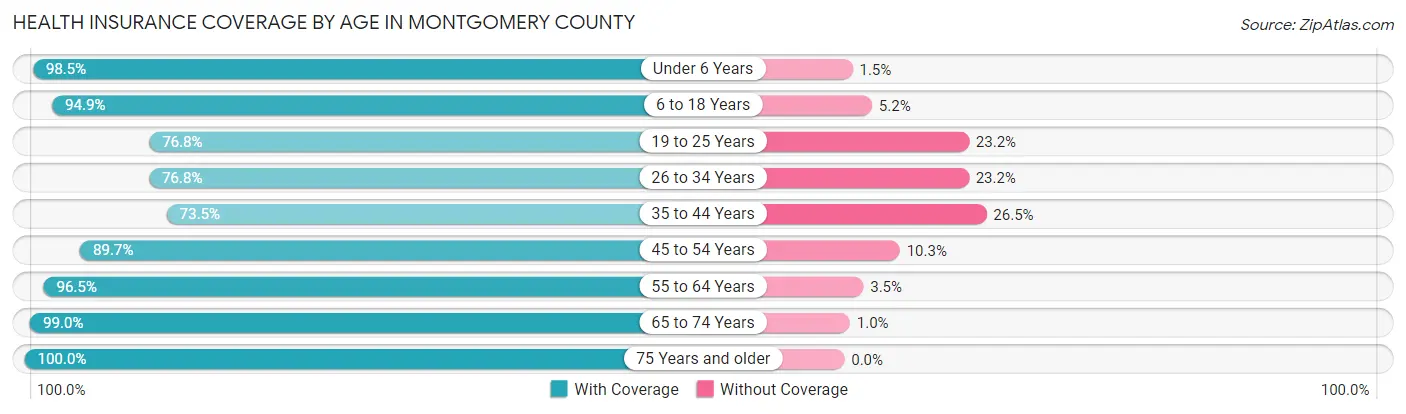
| Age Bracket | With Coverage | Without Coverage |
| Under 6 Years | 511 (98.5%) | 8 (1.5%) |
| 6 to 18 Years | 1,935 (94.9%) | 105 (5.1%) |
| 19 to 25 Years | 535 (76.8%) | 162 (23.2%) |
| 26 to 34 Years | 609 (76.8%) | 184 (23.2%) |
| 35 to 44 Years | 860 (73.5%) | 310 (26.5%) |
| 45 to 54 Years | 884 (89.7%) | 102 (10.3%) |
| 55 to 64 Years | 1,363 (96.5%) | 50 (3.5%) |
| 65 to 74 Years | 1,250 (99.0%) | 13 (1.0%) |
| 75 Years and older | 786 (100.0%) | 0 (0.0%) |
| Total | 8,733 (90.3%) | 934 (9.7%) |
Health Insurance Coverage by Citizenship Status in Montgomery County
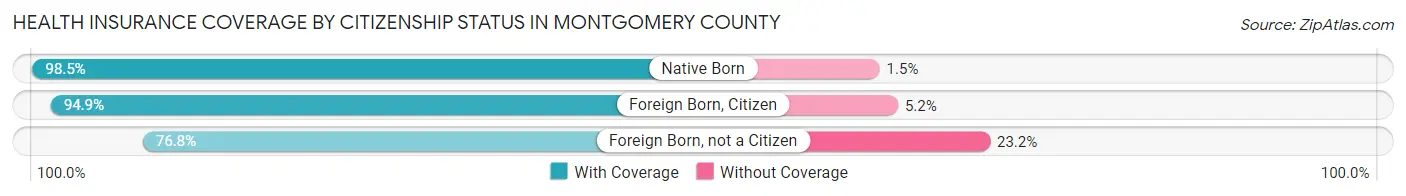
| Citizenship Status | With Coverage | Without Coverage |
| Native Born | 511 (98.5%) | 8 (1.5%) |
| Foreign Born, Citizen | 1,935 (94.9%) | 105 (5.1%) |
| Foreign Born, not a Citizen | 535 (76.8%) | 162 (23.2%) |
Health Insurance Coverage by Household Income in Montgomery County
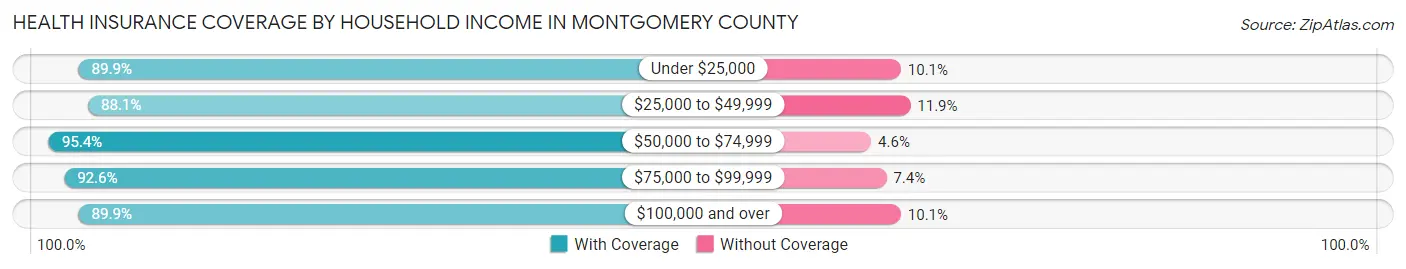
| Household Income | With Coverage | Without Coverage |
| Under $25,000 | 2,270 (89.9%) | 256 (10.1%) |
| $25,000 to $49,999 | 2,582 (88.1%) | 349 (11.9%) |
| $50,000 to $74,999 | 1,299 (95.4%) | 62 (4.6%) |
| $75,000 to $99,999 | 723 (92.6%) | 58 (7.4%) |
| $100,000 and over | 1,855 (89.9%) | 209 (10.1%) |
Public vs Private Health Insurance Coverage by Age in Montgomery County
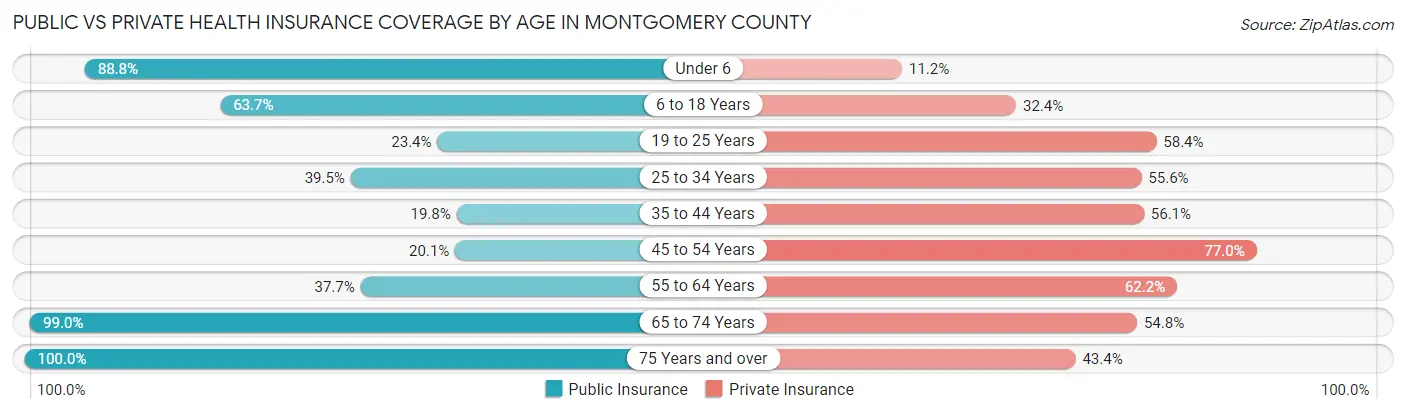
| Age Bracket | Public Insurance | Private Insurance |
| Under 6 | 461 (88.8%) | 58 (11.2%) |
| 6 to 18 Years | 1,299 (63.7%) | 660 (32.4%) |
| 19 to 25 Years | 163 (23.4%) | 407 (58.4%) |
| 25 to 34 Years | 313 (39.5%) | 441 (55.6%) |
| 35 to 44 Years | 232 (19.8%) | 656 (56.1%) |
| 45 to 54 Years | 198 (20.1%) | 759 (77.0%) |
| 55 to 64 Years | 532 (37.7%) | 879 (62.2%) |
| 65 to 74 Years | 1,250 (99.0%) | 692 (54.8%) |
| 75 Years and over | 786 (100.0%) | 341 (43.4%) |
| Total | 5,234 (54.1%) | 4,893 (50.6%) |
Disability Status by Sex by Age in Montgomery County
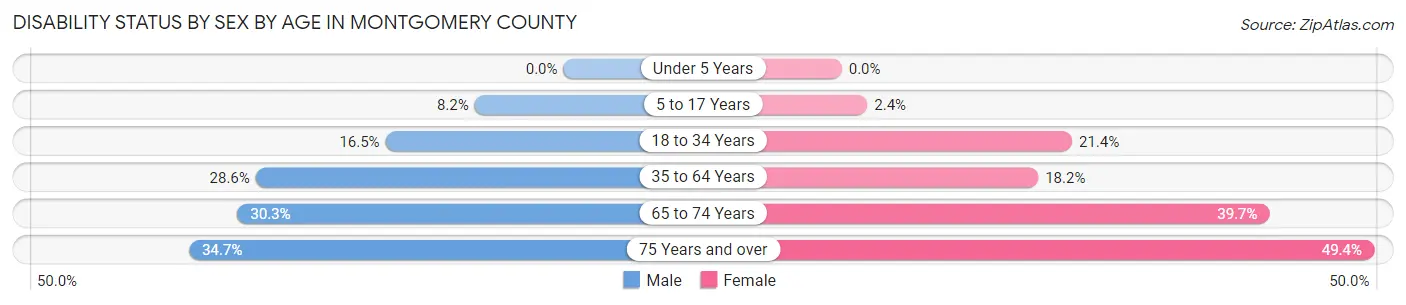
| Age Bracket | Male | Female |
| Under 5 Years | 0 (0.0%) | 0 (0.0%) |
| 5 to 17 Years | 74 (8.2%) | 22 (2.4%) |
| 18 to 34 Years | 157 (16.5%) | 187 (21.4%) |
| 35 to 64 Years | 479 (28.6%) | 345 (18.2%) |
| 65 to 74 Years | 193 (30.2%) | 248 (39.7%) |
| 75 Years and over | 107 (34.7%) | 236 (49.4%) |
Disability Class by Sex by Age in Montgomery County
Disability Class: Hearing Difficulty
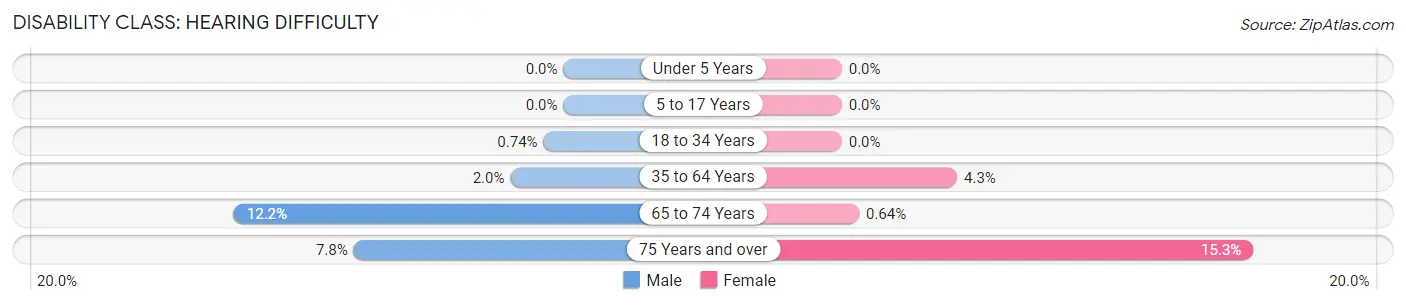
| Age Bracket | Male | Female |
| Under 5 Years | 0 (0.0%) | 0 (0.0%) |
| 5 to 17 Years | 0 (0.0%) | 0 (0.0%) |
| 18 to 34 Years | 7 (0.7%) | 0 (0.0%) |
| 35 to 64 Years | 33 (2.0%) | 81 (4.3%) |
| 65 to 74 Years | 78 (12.2%) | 4 (0.6%) |
| 75 Years and over | 24 (7.8%) | 73 (15.3%) |
Disability Class: Vision Difficulty
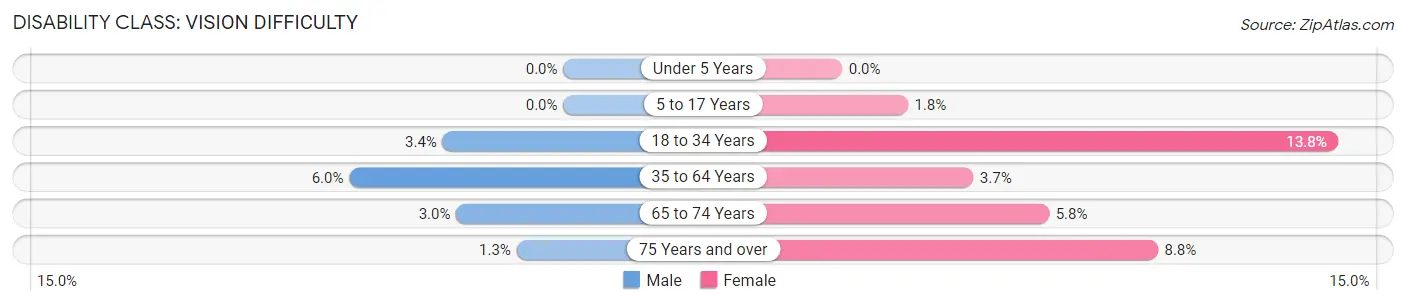
| Age Bracket | Male | Female |
| Under 5 Years | 0 (0.0%) | 0 (0.0%) |
| 5 to 17 Years | 0 (0.0%) | 17 (1.8%) |
| 18 to 34 Years | 32 (3.4%) | 121 (13.8%) |
| 35 to 64 Years | 100 (6.0%) | 69 (3.6%) |
| 65 to 74 Years | 19 (3.0%) | 36 (5.8%) |
| 75 Years and over | 4 (1.3%) | 42 (8.8%) |
Disability Class: Cognitive Difficulty
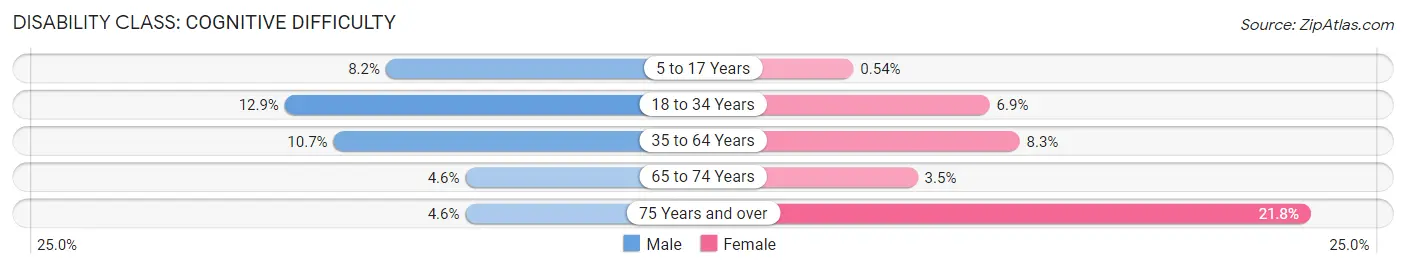
| Age Bracket | Male | Female |
| 5 to 17 Years | 74 (8.2%) | 5 (0.5%) |
| 18 to 34 Years | 123 (12.9%) | 60 (6.9%) |
| 35 to 64 Years | 179 (10.7%) | 156 (8.3%) |
| 65 to 74 Years | 29 (4.5%) | 22 (3.5%) |
| 75 Years and over | 14 (4.5%) | 104 (21.8%) |
Disability Class: Ambulatory Difficulty
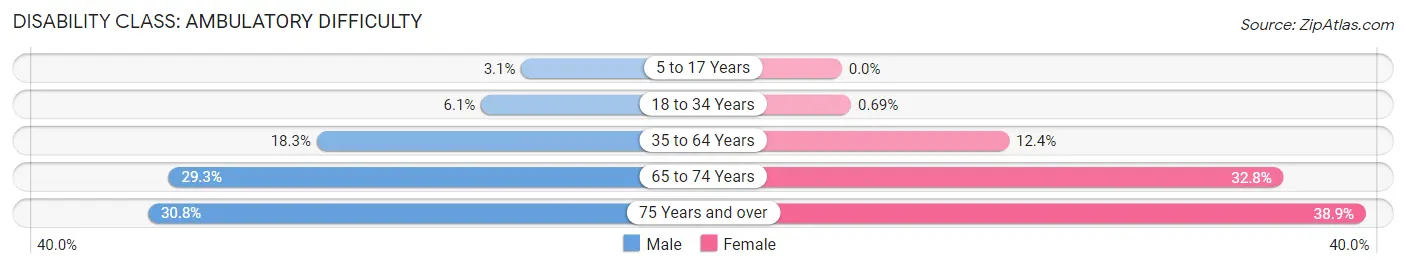
| Age Bracket | Male | Female |
| 5 to 17 Years | 28 (3.1%) | 0 (0.0%) |
| 18 to 34 Years | 58 (6.1%) | 6 (0.7%) |
| 35 to 64 Years | 307 (18.3%) | 235 (12.4%) |
| 65 to 74 Years | 187 (29.3%) | 205 (32.8%) |
| 75 Years and over | 95 (30.8%) | 186 (38.9%) |
Disability Class: Self-Care Difficulty
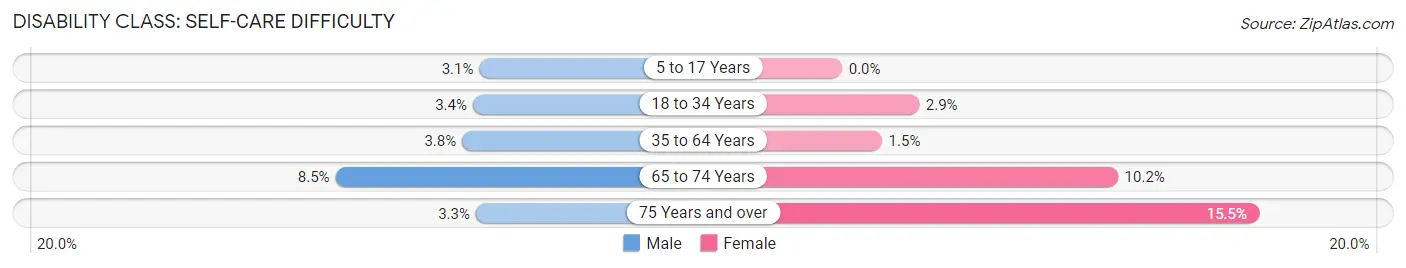
| Age Bracket | Male | Female |
| 5 to 17 Years | 28 (3.1%) | 0 (0.0%) |
| 18 to 34 Years | 32 (3.4%) | 25 (2.9%) |
| 35 to 64 Years | 63 (3.8%) | 28 (1.5%) |
| 65 to 74 Years | 54 (8.5%) | 64 (10.2%) |
| 75 Years and over | 10 (3.3%) | 74 (15.5%) |
Technology Access in Montgomery County
Computing Device Access in Montgomery County
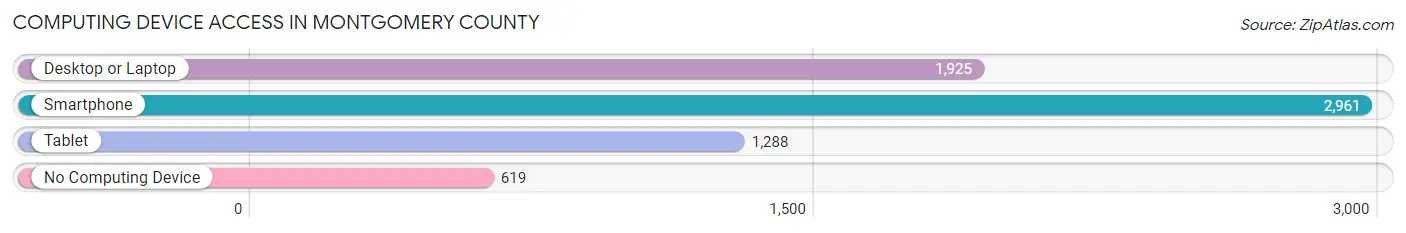
| Device Type | # Households | % Households |
| Desktop or Laptop | 1,925 | 50.3% |
| Smartphone | 2,961 | 77.3% |
| Tablet | 1,288 | 33.6% |
| No Computing Device | 619 | 16.2% |
| Total | 3,830 | 100.0% |
Internet Access in Montgomery County
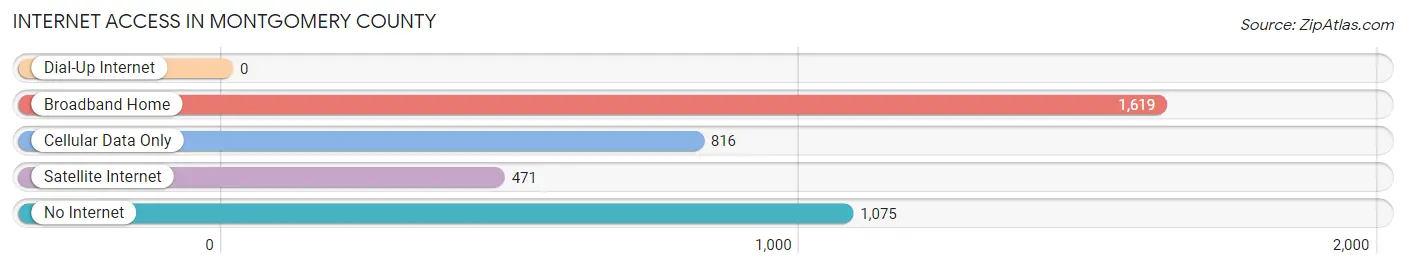
| Internet Type | # Households | % Households |
| Dial-Up Internet | 0 | 0.0% |
| Broadband Home | 1,619 | 42.3% |
| Cellular Data Only | 816 | 21.3% |
| Satellite Internet | 471 | 12.3% |
| No Internet | 1,075 | 28.1% |
| Total | 3,830 | 100.0% |
Montgomery County Summary
Montgomery County, Mississippi is located in the southeastern corner of the state, and is bordered by the states of Alabama and Louisiana. The county seat is Winona, and the county is part of the Delta region of Mississippi. Montgomery County is home to a population of approximately 11,000 people, and is the second smallest county in the state.
History
Montgomery County was established in 1871, and was named after Richard Montgomery, an American Revolutionary War hero. The county was formed from parts of Carroll, Choctaw, and Yalobusha counties. The county was originally part of the Chickasaw Nation, and was later part of the Choctaw Nation. The county was home to several Native American tribes, including the Chickasaw, Choctaw, and Natchez.
The county was home to several plantations prior to the Civil War, and the economy was largely based on cotton production. After the Civil War, the economy shifted to timber production, and the county was home to several sawmills. The county was also home to several small towns, including Winona, Kilmichael, Duck Hill, and Duckport.
Geography
Montgomery County is located in the southeastern corner of the state, and is bordered by the states of Alabama and Louisiana. The county is part of the Delta region of Mississippi, and is located in the Yazoo-Mississippi Delta. The county is home to several rivers, including the Yalobusha, Big Black, and Tallahatchie Rivers. The county is also home to several lakes, including Lake Winona, Lake Kilmichael, and Lake Duckport.
The county is mostly flat, with some rolling hills in the northern part of the county. The county is home to several state parks, including Lake Winona State Park, Kilmichael State Park, and Duckport State Park. The county is also home to several wildlife management areas, including the Montgomery County Wildlife Management Area.
Economy
The economy of Montgomery County is largely based on agriculture, forestry, and manufacturing. The county is home to several large farms, and the main crops grown in the county are cotton, soybeans, corn, and wheat. The county is also home to several timber companies, and the main products produced in the county are lumber and paper products.
The county is also home to several manufacturing companies, including furniture manufacturers, food processing plants, and automotive parts manufacturers. The county is also home to several small businesses, including restaurants, retail stores, and service providers.
Demographics
As of the 2010 census, Montgomery County had a population of 11,000 people. The racial makeup of the county was 75.3% White, 22.2% African American, 0.3% Native American, 0.2% Asian, 0.1% Pacific Islander, 0.7% from other races, and 1.4% from two or more races. Hispanic or Latino of any race were 1.7% of the population.
The median income for a household in the county was $30,938, and the median income for a family was $37,917. The per capita income for the county was $15,845. About 22.2% of families and 25.7% of the population were below the poverty line, including 36.2% of those under age 18 and 18.2% of those age 65 or over.
Common Questions
What is Per Capita Income in Montgomery County?
Per Capita income in Montgomery County is $24,126.
What is the Median Family Income in Montgomery County?
Median Family Income in Montgomery County is $44,414.
What is the Median Household income in Montgomery County?
Median Household Income in Montgomery County is $36,845.
What is Income or Wage Gap in Montgomery County?
Income or Wage Gap in Montgomery County is 26.4%.
Women in Montgomery County earn 73.6 cents for every dollar earned by a man.
What is Family Income Deficit in Montgomery County?
Family Income Deficit in Montgomery County is $11,543.
Families that are below poverty line in Montgomery County earn $11,543 less on average than the poverty threshold level.
What is Inequality or Gini Index in Montgomery County?
Inequality or Gini Index in Montgomery County is 0.52.
What is the Total Population of Montgomery County?
Total Population of Montgomery County is 9,803.
What is the Total Male Population of Montgomery County?
Total Male Population of Montgomery County is 4,674.
What is the Total Female Population of Montgomery County?
Total Female Population of Montgomery County is 5,129.
What is the Ratio of Males per 100 Females in Montgomery County?
There are 91.13 Males per 100 Females in Montgomery County.
What is the Ratio of Females per 100 Males in Montgomery County?
There are 109.73 Females per 100 Males in Montgomery County.
What is the Median Population Age in Montgomery County?
Median Population Age in Montgomery County is 42.0 Years.
What is the Average Family Size in Montgomery County
Average Family Size in Montgomery County is 3.3 People.
What is the Average Household Size in Montgomery County
Average Household Size in Montgomery County is 2.5 People.
How Large is the Labor Force in Montgomery County?
There are 3,816 People in the Labor Forcein in Montgomery County.
What is the Percentage of People in the Labor Force in Montgomery County?
48.7% of People are in the Labor Force in Montgomery County.
What is the Unemployment Rate in Montgomery County?
Unemployment Rate in Montgomery County is 7.8%.