Marion County, MS Map & Demographics
Marion County Map
Marion County Overview
$23,055
PER CAPITA INCOME
$49,144
AVG FAMILY INCOME
$38,399
AVG HOUSEHOLD INCOME
39.0%
WAGE / INCOME GAP [ % ]
61.0¢/ $1
WAGE / INCOME GAP [ $ ]
$10,045
FAMILY INCOME DEFICIT
0.49
INEQUALITY / GINI INDEX
24,362
TOTAL POPULATION
11,794
MALE POPULATION
12,568
FEMALE POPULATION
93.84
MALES / 100 FEMALES
106.56
FEMALES / 100 MALES
40.3
MEDIAN AGE
3.4
AVG FAMILY SIZE
2.6
AVG HOUSEHOLD SIZE
9,933
LABOR FORCE [ PEOPLE ]
51.5%
PERCENT IN LABOR FORCE
9.5%
UNEMPLOYMENT RATE
Marion County Area Codes
Income in Marion County
Income Overview in Marion County
Per Capita Income in Marion County is $23,055, while median incomes of families and households are $49,144 and $38,399 respectively.
| Characteristic | Number | Measure |
| Per Capita Income | 24,362 | $23,055 |
| Median Family Income | 5,782 | $49,144 |
| Mean Family Income | 5,782 | $72,697 |
| Median Household Income | 9,102 | $38,399 |
| Mean Household Income | 9,102 | $58,278 |
| Income Deficit | 5,782 | $10,045 |
| Wage / Income Gap (%) | 24,362 | 38.98% |
| Wage / Income Gap ($) | 24,362 | 61.02¢ per $1 |
| Gini / Inequality Index | 24,362 | 0.49 |
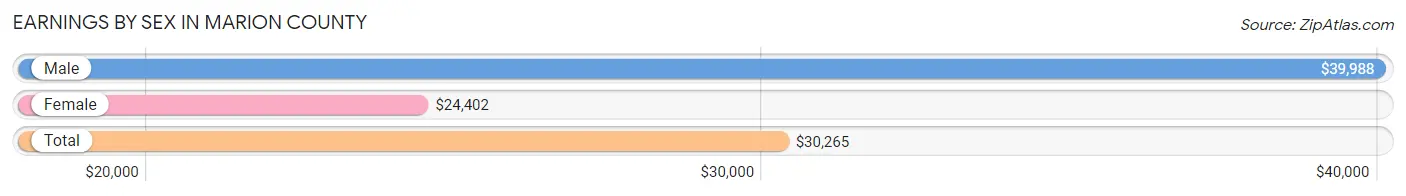
Earnings by Sex in Marion County
Average Earnings in Marion County are $30,265, $39,988 for men and $24,402 for women, a difference of 39.0%.
| Sex | Number | Average Earnings |
| Male | 5,247 (52.1%) | $39,988 |
| Female | 4,819 (47.9%) | $24,402 |
| Total | 10,066 (100.0%) | $30,265 |
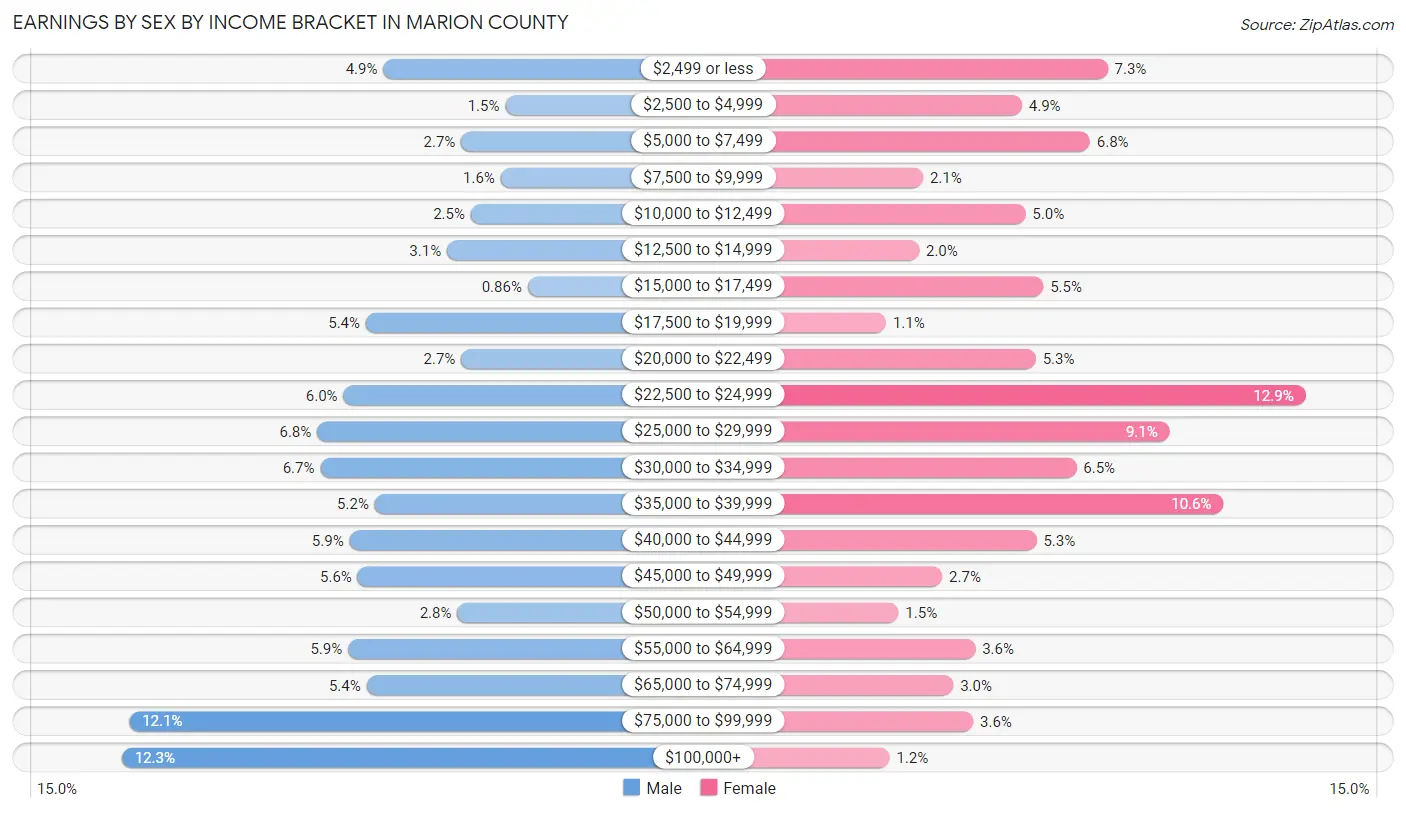
Earnings by Sex by Income Bracket in Marion County
The most common earnings brackets in Marion County are $100,000+ for men (644 | 12.3%) and $22,500 to $24,999 for women (621 | 12.9%).
| Income | Male | Female |
| $2,499 or less | 258 (4.9%) | 353 (7.3%) |
| $2,500 to $4,999 | 78 (1.5%) | 237 (4.9%) |
| $5,000 to $7,499 | 143 (2.7%) | 329 (6.8%) |
| $7,500 to $9,999 | 85 (1.6%) | 103 (2.1%) |
| $10,000 to $12,499 | 129 (2.5%) | 242 (5.0%) |
| $12,500 to $14,999 | 164 (3.1%) | 98 (2.0%) |
| $15,000 to $17,499 | 45 (0.9%) | 266 (5.5%) |
| $17,500 to $19,999 | 284 (5.4%) | 53 (1.1%) |
| $20,000 to $22,499 | 143 (2.7%) | 256 (5.3%) |
| $22,500 to $24,999 | 317 (6.0%) | 621 (12.9%) |
| $25,000 to $29,999 | 356 (6.8%) | 437 (9.1%) |
| $30,000 to $34,999 | 351 (6.7%) | 311 (6.5%) |
| $35,000 to $39,999 | 271 (5.2%) | 510 (10.6%) |
| $40,000 to $44,999 | 308 (5.9%) | 257 (5.3%) |
| $45,000 to $49,999 | 296 (5.6%) | 129 (2.7%) |
| $50,000 to $54,999 | 149 (2.8%) | 70 (1.5%) |
| $55,000 to $64,999 | 310 (5.9%) | 174 (3.6%) |
| $65,000 to $74,999 | 283 (5.4%) | 144 (3.0%) |
| $75,000 to $99,999 | 633 (12.1%) | 171 (3.5%) |
| $100,000+ | 644 (12.3%) | 58 (1.2%) |
| Total | 5,247 (100.0%) | 4,819 (100.0%) |
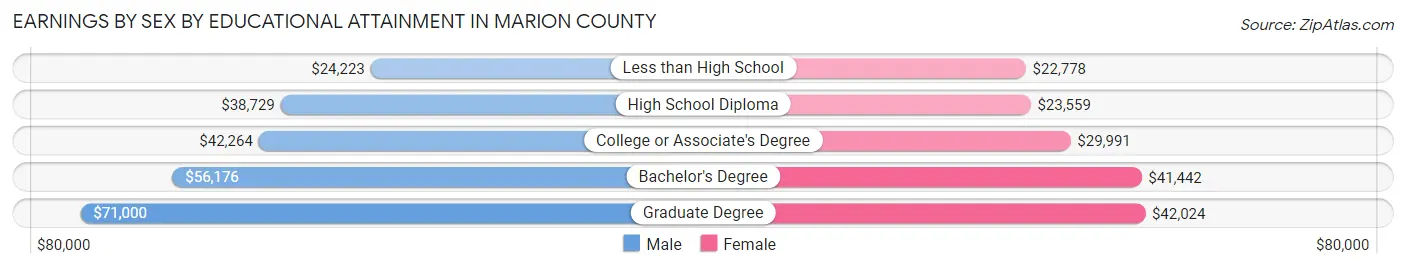
Earnings by Sex by Educational Attainment in Marion County
Average earnings in Marion County are $41,468 for men and $26,796 for women, a difference of 35.4%. Men with an educational attainment of graduate degree enjoy the highest average annual earnings of $71,000, while those with less than high school education earn the least with $24,223. Women with an educational attainment of graduate degree earn the most with the average annual earnings of $42,024, while those with less than high school education have the smallest earnings of $22,778.
| Educational Attainment | Male Income | Female Income |
| Less than High School | $24,223 | $22,778 |
| High School Diploma | $38,729 | $23,559 |
| College or Associate's Degree | $42,264 | $29,991 |
| Bachelor's Degree | $56,176 | $41,442 |
| Graduate Degree | $71,000 | $42,024 |
| Total | $41,468 | $26,796 |
Family Income in Marion County
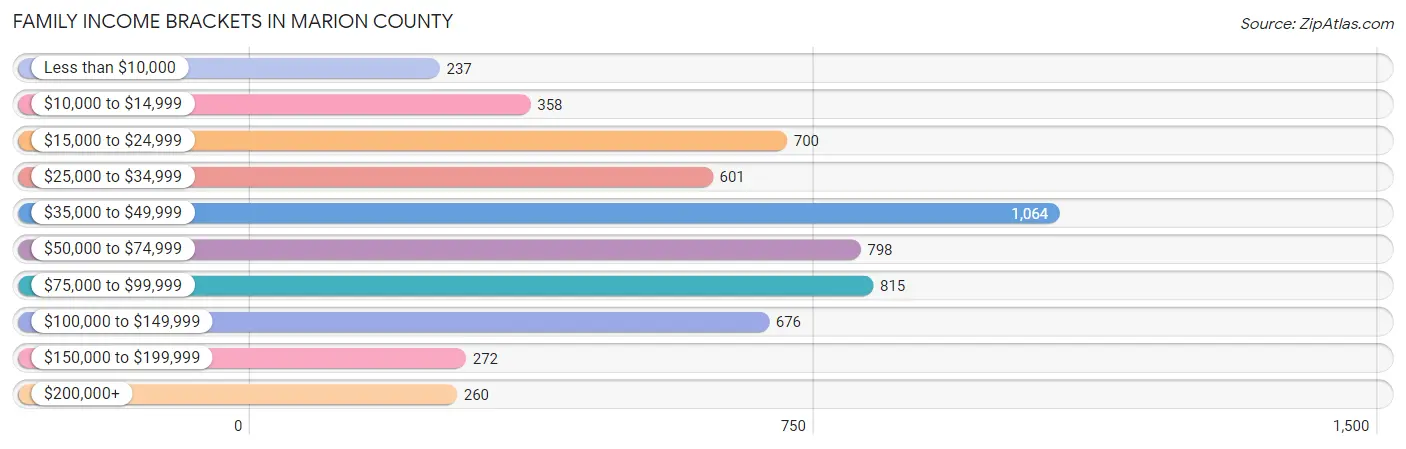
Family Income Brackets in Marion County
According to the Marion County family income data, there are 1,064 families falling into the $35,000 to $49,999 income range, which is the most common income bracket and makes up 18.4% of all families. Conversely, the less than $10,000 income bracket is the least frequent group with only 237 families (4.1%) belonging to this category.
| Income Bracket | # Families | % Families |
| Less than $10,000 | 237 | 4.1% |
| $10,000 to $14,999 | 358 | 6.2% |
| $15,000 to $24,999 | 700 | 12.1% |
| $25,000 to $34,999 | 601 | 10.4% |
| $35,000 to $49,999 | 1,064 | 18.4% |
| $50,000 to $74,999 | 798 | 13.8% |
| $75,000 to $99,999 | 815 | 14.1% |
| $100,000 to $149,999 | 676 | 11.7% |
| $150,000 to $199,999 | 272 | 4.7% |
| $200,000+ | 260 | 4.5% |
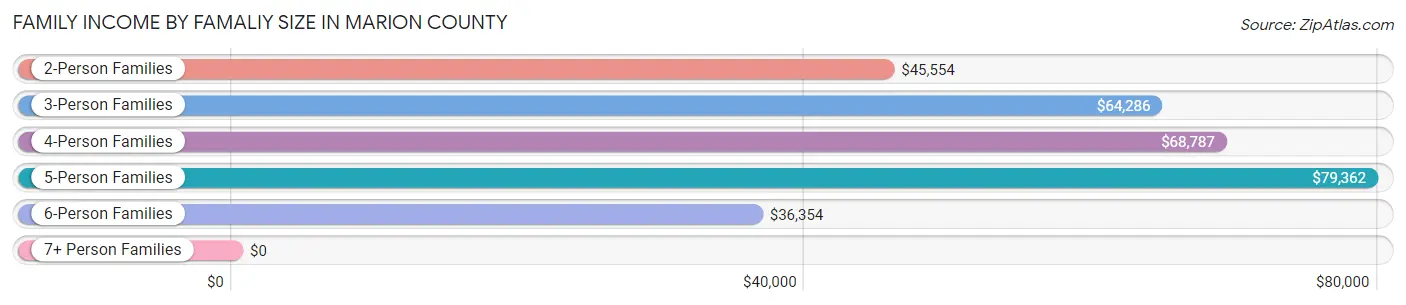
Family Income by Famaliy Size in Marion County
5-person families (249 | 4.3%) account for the highest median family income in Marion County with $79,362 per family, while 2-person families (3,171 | 54.8%) have the highest median income of $22,777 per family member.
| Income Bracket | # Families | Median Income |
| 2-Person Families | 3,171 (54.8%) | $45,554 |
| 3-Person Families | 1,246 (21.5%) | $64,286 |
| 4-Person Families | 899 (15.5%) | $68,787 |
| 5-Person Families | 249 (4.3%) | $79,362 |
| 6-Person Families | 139 (2.4%) | $36,354 |
| 7+ Person Families | 78 (1.3%) | $0 |
| Total | 5,782 (100.0%) | $49,144 |
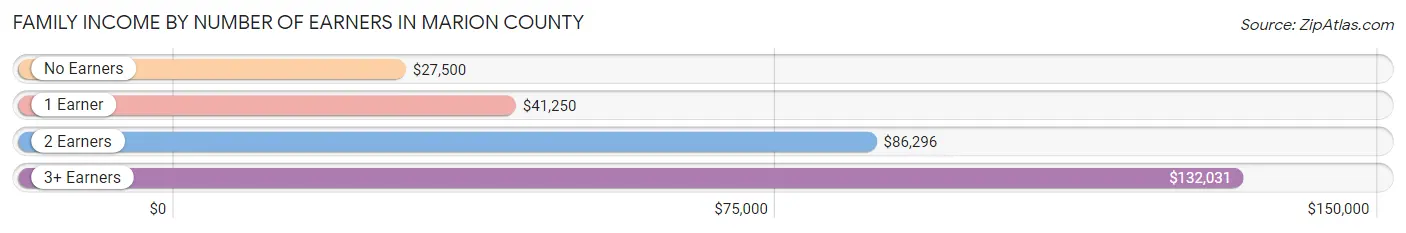
Family Income by Number of Earners in Marion County
The median family income in Marion County is $49,144, with families comprising 3+ earners (393) having the highest median family income of $132,031, while families with no earners (1,138) have the lowest median family income of $27,500, accounting for 6.8% and 19.7% of families, respectively.
| Number of Earners | # Families | Median Income |
| No Earners | 1,138 (19.7%) | $27,500 |
| 1 Earner | 2,747 (47.5%) | $41,250 |
| 2 Earners | 1,504 (26.0%) | $86,296 |
| 3+ Earners | 393 (6.8%) | $132,031 |
| Total | 5,782 (100.0%) | $49,144 |
Household Income in Marion County
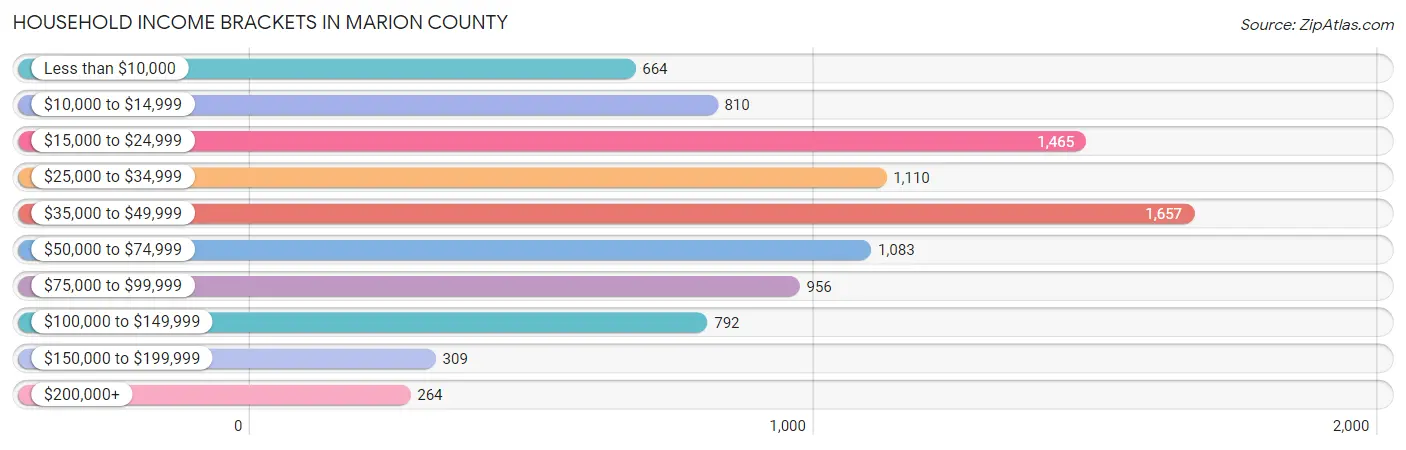
Household Income Brackets in Marion County
With 1,657 households falling in the category, the $35,000 to $49,999 income range is the most frequent in Marion County, accounting for 18.2% of all households. In contrast, only 264 households (2.9%) fall into the $200,000+ income bracket, making it the least populous group.
| Income Bracket | # Households | % Households |
| Less than $10,000 | 664 | 7.3% |
| $10,000 to $14,999 | 810 | 8.9% |
| $15,000 to $24,999 | 1,465 | 16.1% |
| $25,000 to $34,999 | 1,110 | 12.2% |
| $35,000 to $49,999 | 1,657 | 18.2% |
| $50,000 to $74,999 | 1,083 | 11.9% |
| $75,000 to $99,999 | 956 | 10.5% |
| $100,000 to $149,999 | 792 | 8.7% |
| $150,000 to $199,999 | 309 | 3.4% |
| $200,000+ | 264 | 2.9% |
Household Income by Householder Age in Marion County
The median household income in Marion County is $38,399, with the highest median household income of $45,726 found in the 45 to 64 years age bracket for the primary householder. A total of 3,340 households (36.7%) fall into this category. Meanwhile, the 65+ years age bracket for the primary householder has the lowest median household income of $34,143, with 2,887 households (31.7%) in this group.
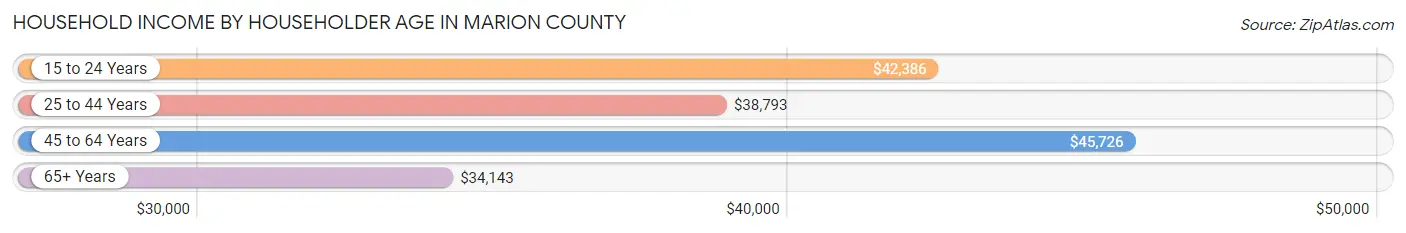
| Income Bracket | # Households | Median Income |
| 15 to 24 Years | 219 (2.4%) | $42,386 |
| 25 to 44 Years | 2,656 (29.2%) | $38,793 |
| 45 to 64 Years | 3,340 (36.7%) | $45,726 |
| 65+ Years | 2,887 (31.7%) | $34,143 |
| Total | 9,102 (100.0%) | $38,399 |
Poverty in Marion County
Income Below Poverty by Sex and Age in Marion County
With 20.2% poverty level for males and 25.3% for females among the residents of Marion County, 12 to 14 year old males and 16 and 17 year old females are the most vulnerable to poverty, with 176 males (38.3%) and 142 females (50.7%) in their respective age groups living below the poverty level.
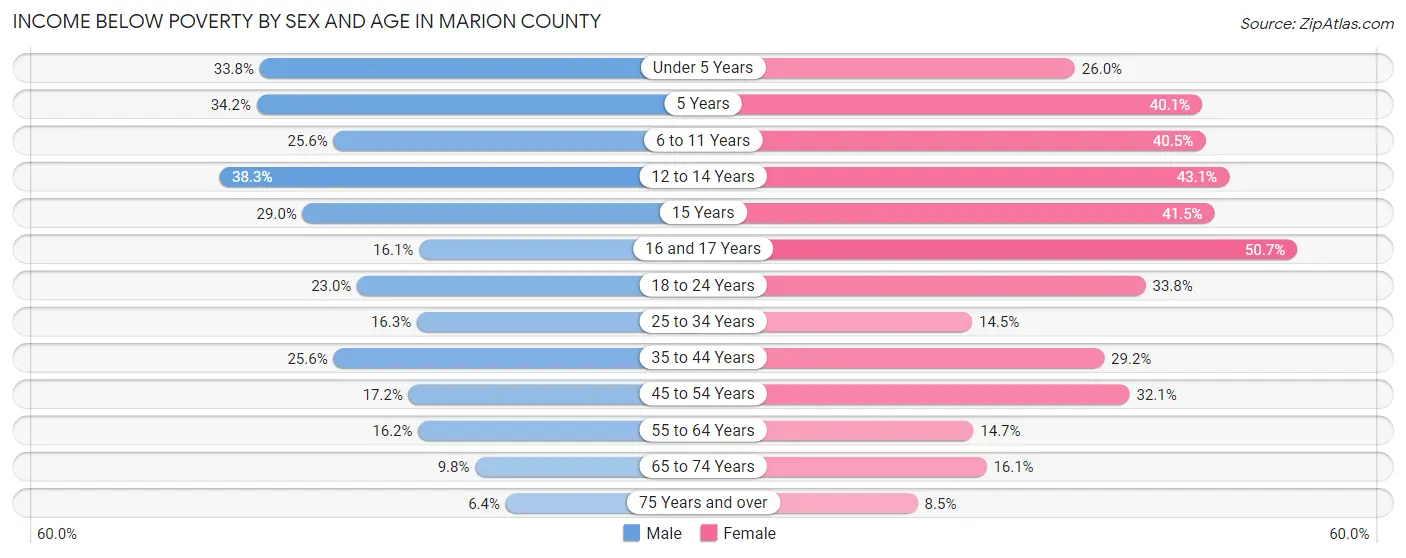
| Age Bracket | Male | Female |
| Under 5 Years | 281 (33.8%) | 128 (26.0%) |
| 5 Years | 14 (34.2%) | 77 (40.1%) |
| 6 to 11 Years | 269 (25.6%) | 432 (40.5%) |
| 12 to 14 Years | 176 (38.3%) | 172 (43.1%) |
| 15 Years | 27 (29.0%) | 127 (41.5%) |
| 16 and 17 Years | 53 (16.1%) | 142 (50.7%) |
| 18 to 24 Years | 200 (23.0%) | 363 (33.8%) |
| 25 to 34 Years | 205 (16.3%) | 211 (14.5%) |
| 35 to 44 Years | 413 (25.6%) | 407 (29.2%) |
| 45 to 54 Years | 233 (17.2%) | 467 (32.1%) |
| 55 to 64 Years | 246 (16.2%) | 242 (14.6%) |
| 65 to 74 Years | 130 (9.8%) | 225 (16.1%) |
| 75 Years and over | 38 (6.4%) | 84 (8.5%) |
| Total | 2,285 (20.2%) | 3,077 (25.3%) |
Income Above Poverty by Sex and Age in Marion County
According to the poverty statistics in Marion County, males aged 75 years and over and females aged 75 years and over are the age groups that are most secure financially, with 93.6% of males and 91.5% of females in these age groups living above the poverty line.
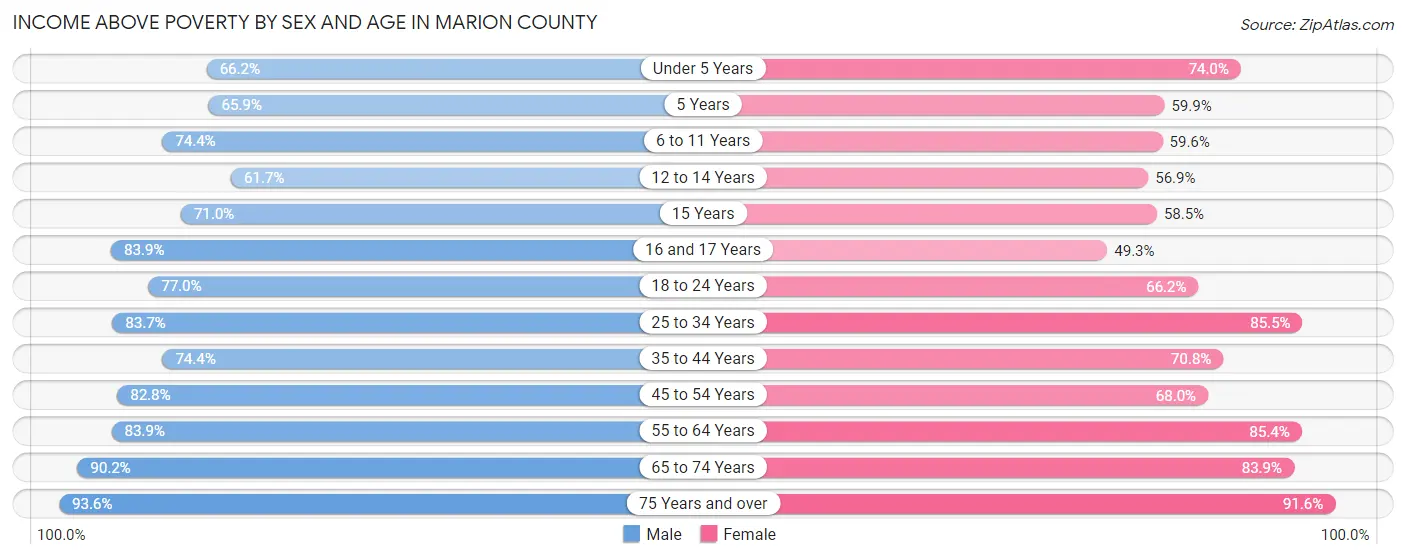
| Age Bracket | Male | Female |
| Under 5 Years | 550 (66.2%) | 365 (74.0%) |
| 5 Years | 27 (65.8%) | 115 (59.9%) |
| 6 to 11 Years | 782 (74.4%) | 636 (59.6%) |
| 12 to 14 Years | 283 (61.7%) | 227 (56.9%) |
| 15 Years | 66 (71.0%) | 179 (58.5%) |
| 16 and 17 Years | 277 (83.9%) | 138 (49.3%) |
| 18 to 24 Years | 671 (77.0%) | 710 (66.2%) |
| 25 to 34 Years | 1,053 (83.7%) | 1,243 (85.5%) |
| 35 to 44 Years | 1,200 (74.4%) | 986 (70.8%) |
| 45 to 54 Years | 1,120 (82.8%) | 990 (67.9%) |
| 55 to 64 Years | 1,277 (83.9%) | 1,410 (85.4%) |
| 65 to 74 Years | 1,195 (90.2%) | 1,172 (83.9%) |
| 75 Years and over | 555 (93.6%) | 910 (91.5%) |
| Total | 9,056 (79.8%) | 9,081 (74.7%) |
Income Below Poverty Among Married-Couple Families in Marion County
The poverty statistics for married-couple families in Marion County show that 12.0% or 506 of the total 4,232 families live below the poverty line. Families with 3 or 4 children have the highest poverty rate of 42.5%, comprising of 71 families. On the other hand, families with no children have the lowest poverty rate of 7.3%, which includes 223 families.
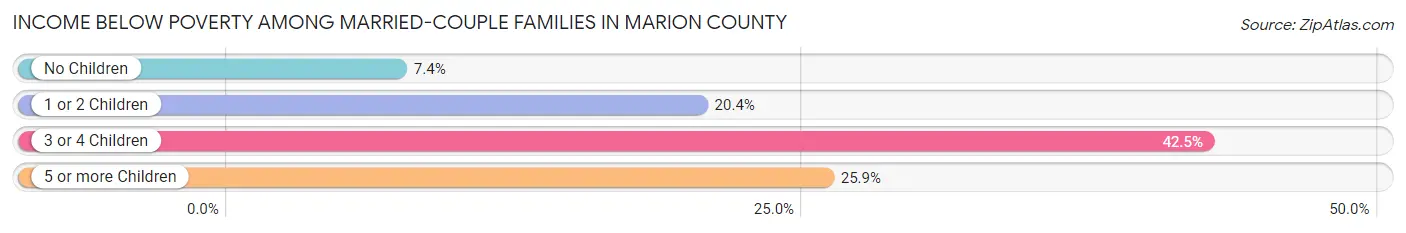
| Children | Above Poverty | Below Poverty |
| No Children | 2,812 (92.6%) | 223 (7.3%) |
| 1 or 2 Children | 798 (79.6%) | 205 (20.4%) |
| 3 or 4 Children | 96 (57.5%) | 71 (42.5%) |
| 5 or more Children | 20 (74.1%) | 7 (25.9%) |
| Total | 3,726 (88.0%) | 506 (12.0%) |
Income Below Poverty Among Single-Parent Households in Marion County
According to the poverty data in Marion County, 63.8% or 220 single-father households and 27.2% or 328 single-mother households are living below the poverty line. Among single-father households, those with 3 or 4 children have the highest poverty rate, with 33 households (100.0%) experiencing poverty. Likewise, among single-mother households, those with 5 or more children have the highest poverty rate, with 15 households (100.0%) falling below the poverty line.
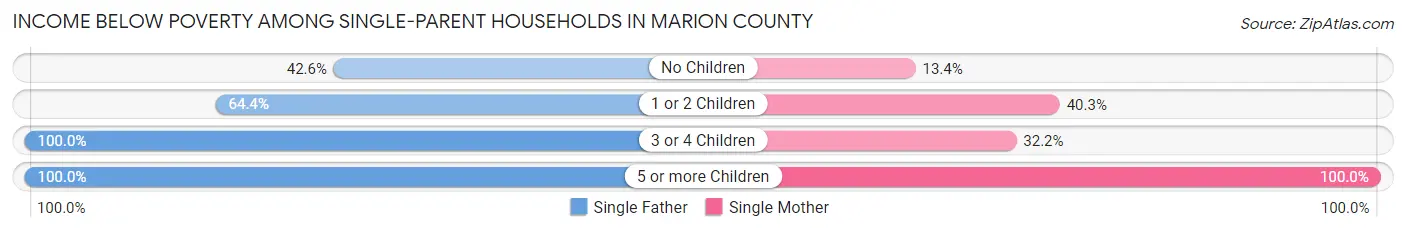
| Children | Single Father | Single Mother |
| No Children | 46 (42.6%) | 77 (13.4%) |
| 1 or 2 Children | 114 (64.4%) | 190 (40.3%) |
| 3 or 4 Children | 33 (100.0%) | 46 (32.2%) |
| 5 or more Children | 27 (100.0%) | 15 (100.0%) |
| Total | 220 (63.8%) | 328 (27.2%) |
Income Below Poverty Among Married-Couple vs Single-Parent Households in Marion County
The poverty data for Marion County shows that 506 of the married-couple family households (12.0%) and 548 of the single-parent households (35.3%) are living below the poverty level. Within the married-couple family households, those with 3 or 4 children have the highest poverty rate, with 71 households (42.5%) falling below the poverty line. Among the single-parent households, those with 5 or more children have the highest poverty rate, with 42 household (100.0%) living below poverty.
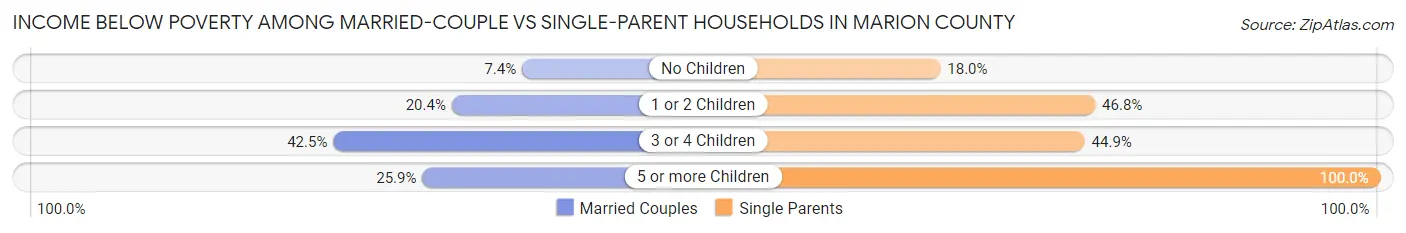
| Children | Married-Couple Families | Single-Parent Households |
| No Children | 223 (7.3%) | 123 (18.0%) |
| 1 or 2 Children | 205 (20.4%) | 304 (46.8%) |
| 3 or 4 Children | 71 (42.5%) | 79 (44.9%) |
| 5 or more Children | 7 (25.9%) | 42 (100.0%) |
| Total | 506 (12.0%) | 548 (35.3%) |
Race in Marion County
The most populous races in Marion County are White / Caucasian (15,581 | 64.0%), Black / African American (7,934 | 32.6%), and Two or more Races (473 | 1.9%).
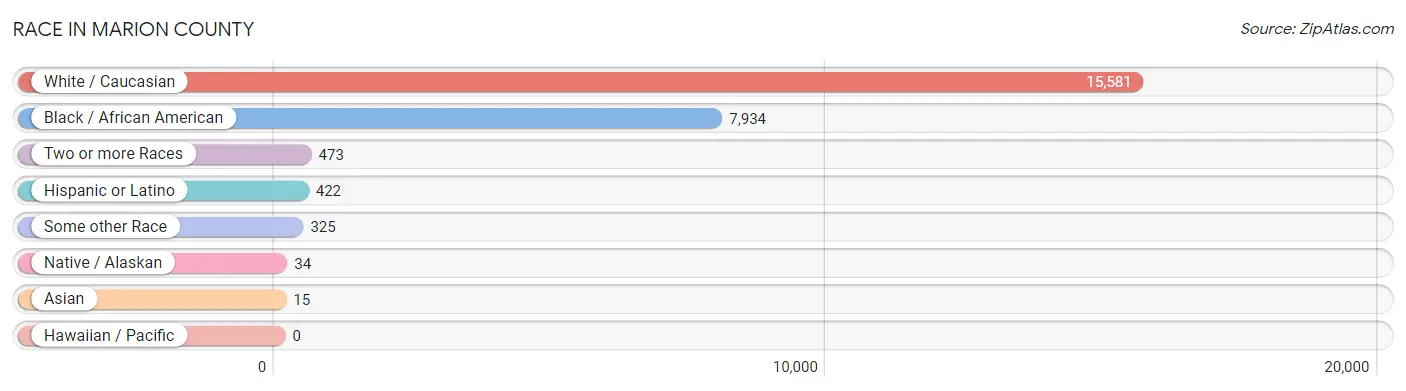
| Race | # Population | % Population |
| Asian | 15 | 0.1% |
| Black / African American | 7,934 | 32.6% |
| Hawaiian / Pacific | 0 | 0.0% |
| Hispanic or Latino | 422 | 1.7% |
| Native / Alaskan | 34 | 0.1% |
| White / Caucasian | 15,581 | 64.0% |
| Two or more Races | 473 | 1.9% |
| Some other Race | 325 | 1.3% |
| Total | 24,362 | 100.0% |
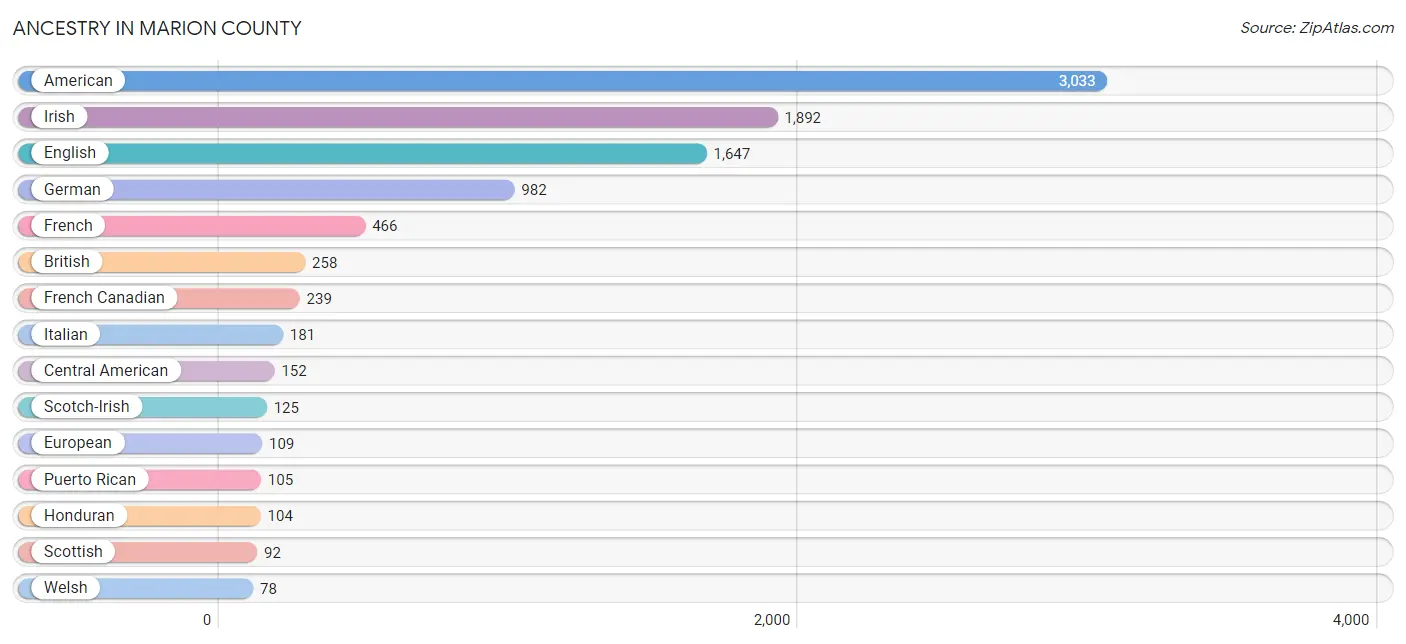
Ancestry in Marion County
The most populous ancestries reported in Marion County are American (3,033 | 12.4%), Irish (1,892 | 7.8%), English (1,647 | 6.8%), German (982 | 4.0%), and French (466 | 1.9%), together accounting for 32.9% of all Marion County residents.
| Ancestry | # Population | % Population |
| American | 3,033 | 12.4% |
| Arab | 8 | 0.0% |
| Belgian | 13 | 0.1% |
| Blackfeet | 9 | 0.0% |
| Brazilian | 18 | 0.1% |
| British | 258 | 1.1% |
| Cajun | 6 | 0.0% |
| Canadian | 9 | 0.0% |
| Central American | 152 | 0.6% |
| Cherokee | 1 | 0.0% |
| Creek | 34 | 0.1% |
| Cuban | 19 | 0.1% |
| Dutch | 11 | 0.1% |
| English | 1,647 | 6.8% |
| European | 109 | 0.4% |
| French | 466 | 1.9% |
| French Canadian | 239 | 1.0% |
| German | 982 | 4.0% |
| Guatemalan | 48 | 0.2% |
| Honduran | 104 | 0.4% |
| Hungarian | 8 | 0.0% |
| Indian (Asian) | 6 | 0.0% |
| Irish | 1,892 | 7.8% |
| Italian | 181 | 0.7% |
| Jamaican | 61 | 0.3% |
| Korean | 9 | 0.0% |
| Mexican | 53 | 0.2% |
| Norwegian | 18 | 0.1% |
| Puerto Rican | 105 | 0.4% |
| Scandinavian | 8 | 0.0% |
| Scotch-Irish | 125 | 0.5% |
| Scottish | 92 | 0.4% |
| Slovak | 8 | 0.0% |
| Spaniard | 24 | 0.1% |
| Spanish | 25 | 0.1% |
| Swedish | 20 | 0.1% |
| Swiss | 9 | 0.0% |
| Welsh | 78 | 0.3% | View All 38 Rows |
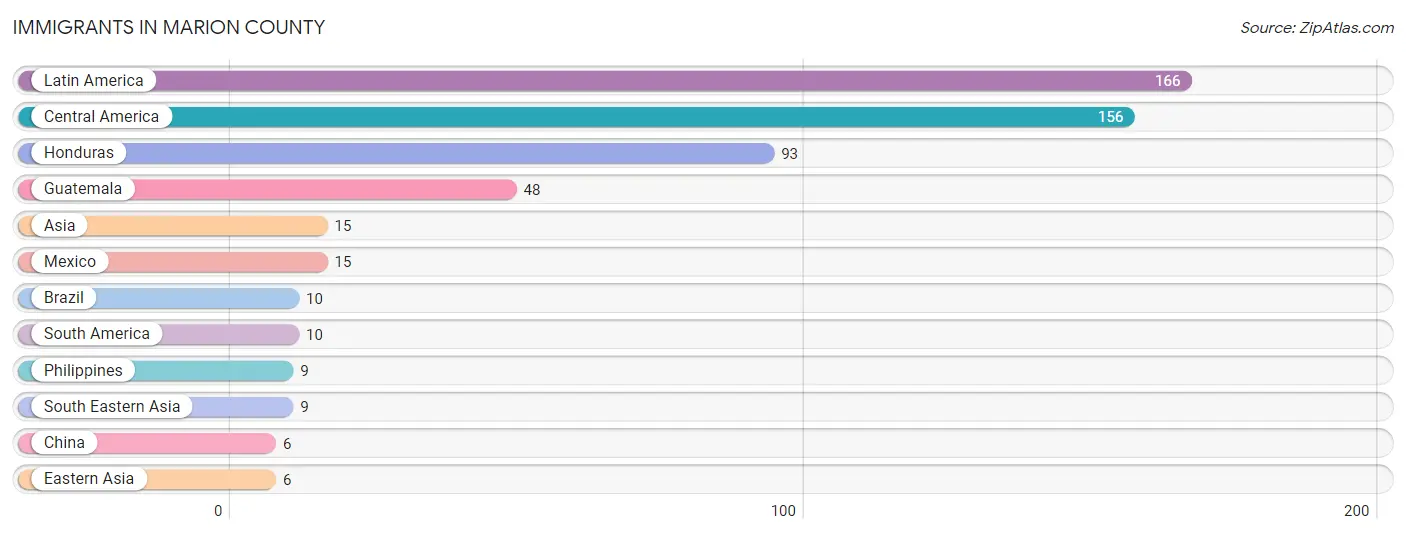
Immigrants in Marion County
The most numerous immigrant groups reported in Marion County came from Latin America (166 | 0.7%), Central America (156 | 0.6%), Honduras (93 | 0.4%), Guatemala (48 | 0.2%), and Asia (15 | 0.1%), together accounting for 2.0% of all Marion County residents.
| Immigration Origin | # Population | % Population |
| Asia | 15 | 0.1% |
| Brazil | 10 | 0.0% |
| Central America | 156 | 0.6% |
| China | 6 | 0.0% |
| Eastern Asia | 6 | 0.0% |
| Guatemala | 48 | 0.2% |
| Honduras | 93 | 0.4% |
| Latin America | 166 | 0.7% |
| Mexico | 15 | 0.1% |
| Philippines | 9 | 0.0% |
| South America | 10 | 0.0% |
| South Eastern Asia | 9 | 0.0% | View All 12 Rows |
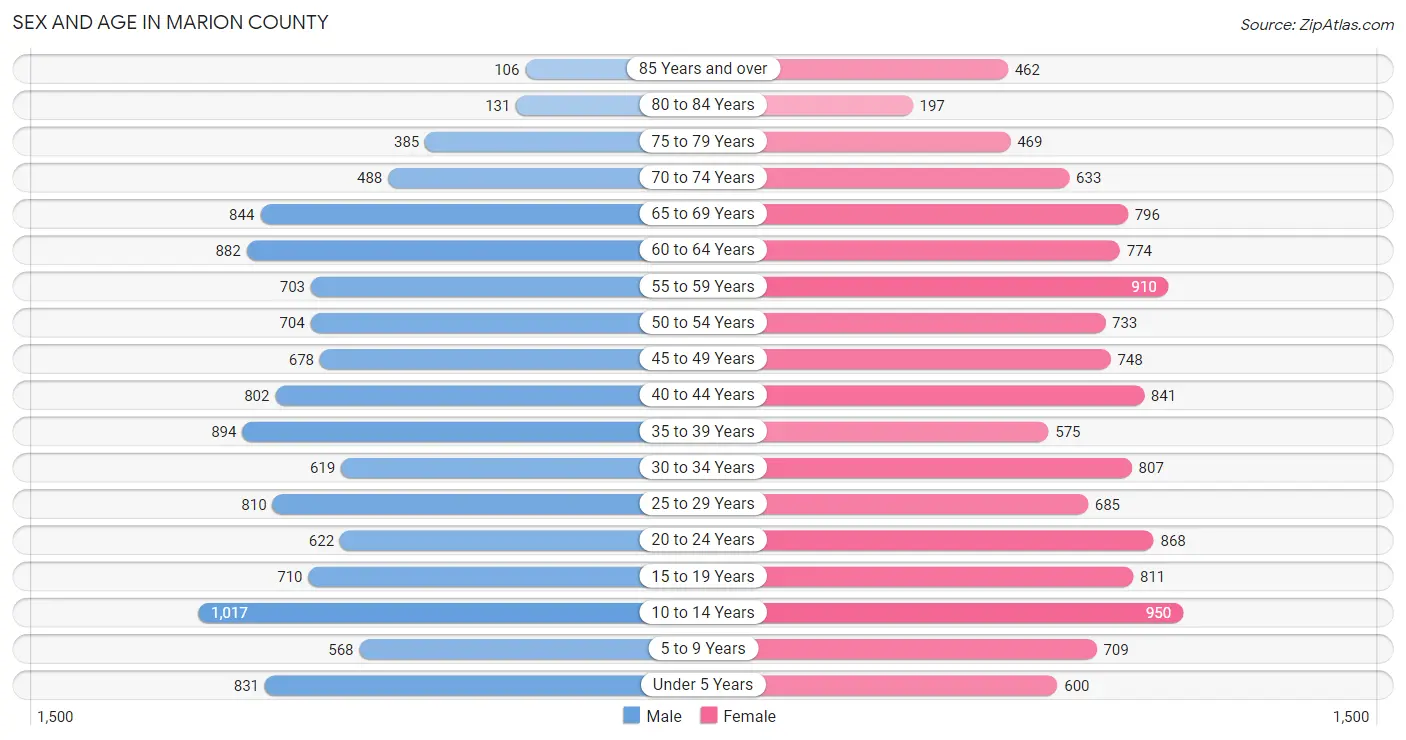
Sex and Age in Marion County
Sex and Age in Marion County
The most populous age groups in Marion County are 10 to 14 Years (1,017 | 8.6%) for men and 10 to 14 Years (950 | 7.6%) for women.
| Age Bracket | Male | Female |
| Under 5 Years | 831 (7.0%) | 600 (4.8%) |
| 5 to 9 Years | 568 (4.8%) | 709 (5.6%) |
| 10 to 14 Years | 1,017 (8.6%) | 950 (7.6%) |
| 15 to 19 Years | 710 (6.0%) | 811 (6.5%) |
| 20 to 24 Years | 622 (5.3%) | 868 (6.9%) |
| 25 to 29 Years | 810 (6.9%) | 685 (5.4%) |
| 30 to 34 Years | 619 (5.2%) | 807 (6.4%) |
| 35 to 39 Years | 894 (7.6%) | 575 (4.6%) |
| 40 to 44 Years | 802 (6.8%) | 841 (6.7%) |
| 45 to 49 Years | 678 (5.8%) | 748 (5.9%) |
| 50 to 54 Years | 704 (6.0%) | 733 (5.8%) |
| 55 to 59 Years | 703 (6.0%) | 910 (7.2%) |
| 60 to 64 Years | 882 (7.5%) | 774 (6.2%) |
| 65 to 69 Years | 844 (7.2%) | 796 (6.3%) |
| 70 to 74 Years | 488 (4.1%) | 633 (5.0%) |
| 75 to 79 Years | 385 (3.3%) | 469 (3.7%) |
| 80 to 84 Years | 131 (1.1%) | 197 (1.6%) |
| 85 Years and over | 106 (0.9%) | 462 (3.7%) |
| Total | 11,794 (100.0%) | 12,568 (100.0%) |
Families and Households in Marion County
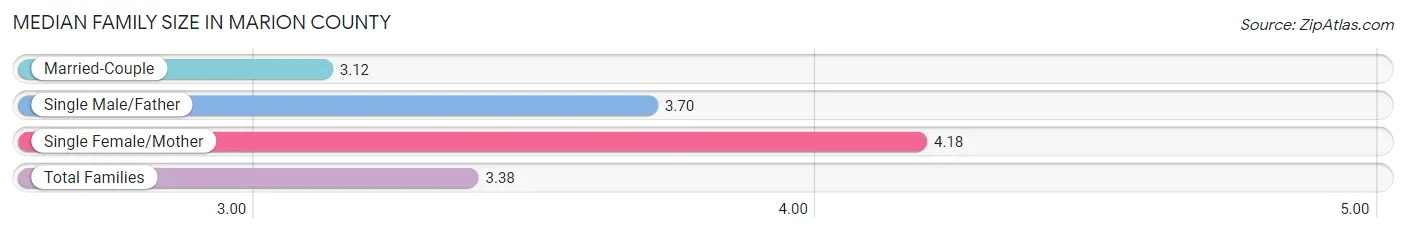
Median Family Size in Marion County
The median family size in Marion County is 3.38 persons per family, with single female/mother families (1,205 | 20.8%) accounting for the largest median family size of 4.18 persons per family. On the other hand, married-couple families (4,232 | 73.2%) represent the smallest median family size with 3.12 persons per family.
| Family Type | # Families | Family Size |
| Married-Couple | 4,232 (73.2%) | 3.12 |
| Single Male/Father | 345 (6.0%) | 3.70 |
| Single Female/Mother | 1,205 (20.8%) | 4.18 |
| Total Families | 5,782 (100.0%) | 3.38 |
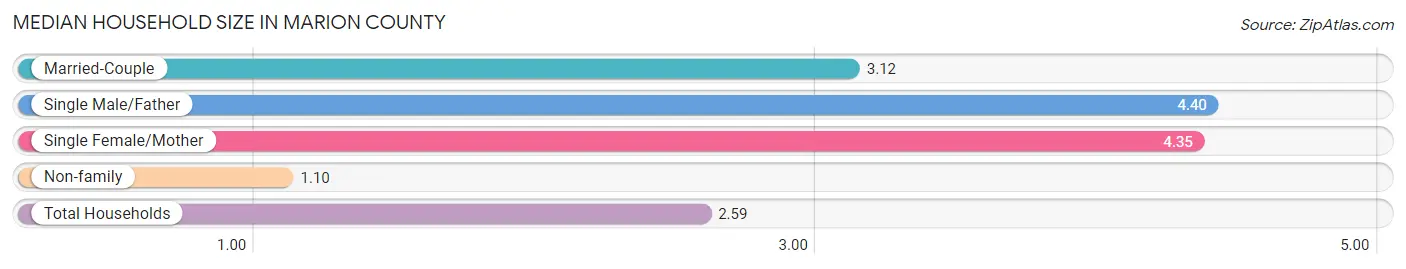
Median Household Size in Marion County
The median household size in Marion County is 2.59 persons per household, with single male/father households (345 | 3.8%) accounting for the largest median household size of 4.4 persons per household. non-family households (3,320 | 36.5%) represent the smallest median household size with 1.10 persons per household.
| Household Type | # Households | Household Size |
| Married-Couple | 4,232 (46.5%) | 3.12 |
| Single Male/Father | 345 (3.8%) | 4.40 |
| Single Female/Mother | 1,205 (13.2%) | 4.35 |
| Non-family | 3,320 (36.5%) | 1.10 |
| Total Households | 9,102 (100.0%) | 2.59 |
Household Size by Marriage Status in Marion County
Out of a total of 9,102 households in Marion County, 5,782 (63.5%) are family households, while 3,320 (36.5%) are nonfamily households. The most numerous type of family households are 2-person households, comprising 3,078, and the most common type of nonfamily households are 1-person households, comprising 3,112.
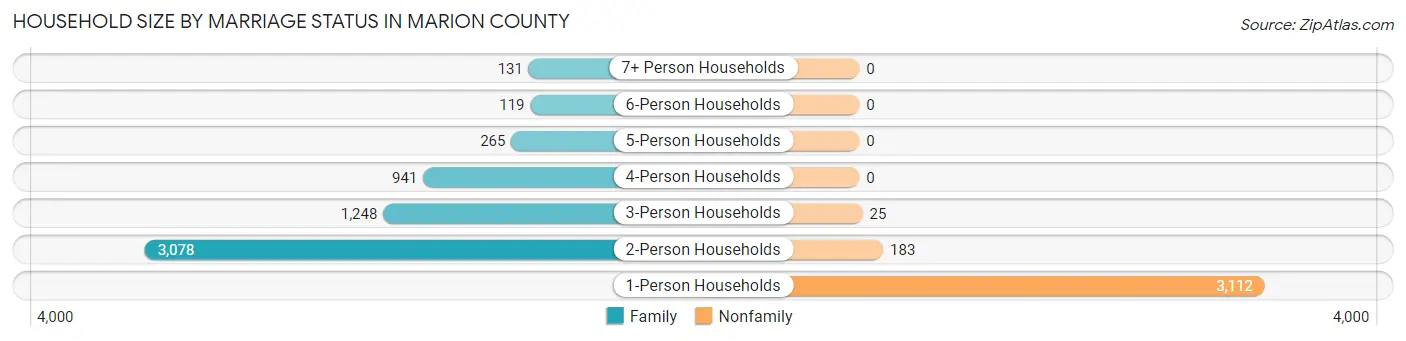
| Household Size | Family Households | Nonfamily Households |
| 1-Person Households | - | 3,112 (34.2%) |
| 2-Person Households | 3,078 (33.8%) | 183 (2.0%) |
| 3-Person Households | 1,248 (13.7%) | 25 (0.3%) |
| 4-Person Households | 941 (10.3%) | 0 (0.0%) |
| 5-Person Households | 265 (2.9%) | 0 (0.0%) |
| 6-Person Households | 119 (1.3%) | 0 (0.0%) |
| 7+ Person Households | 131 (1.4%) | 0 (0.0%) |
| Total | 5,782 (63.5%) | 3,320 (36.5%) |
Female Fertility in Marion County
Fertility by Age in Marion County
Average fertility rate in Marion County is 63.0 births per 1,000 women. Women in the age bracket of 20 to 34 years have the highest fertility rate with 117.0 births per 1,000 women. Women in the age bracket of 20 to 34 years acount for 79.6% of all women with births.
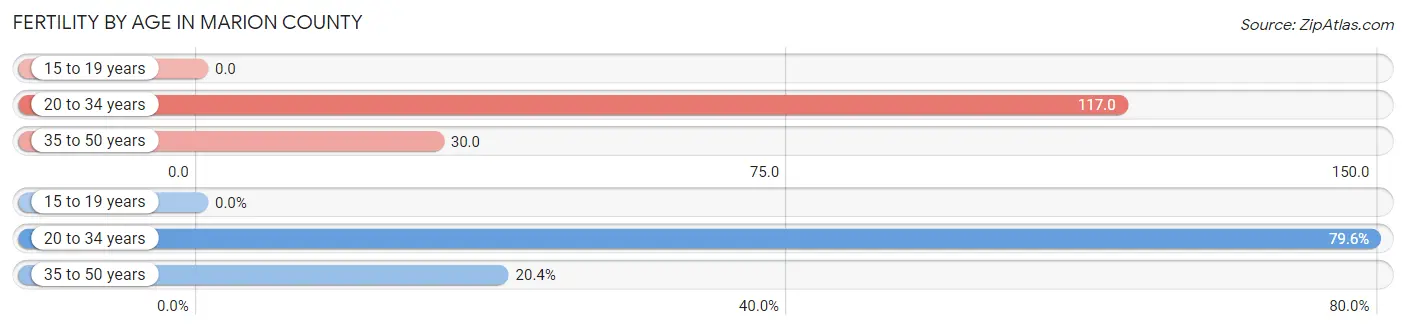
| Age Bracket | Women with Births | Births / 1,000 Women |
| 15 to 19 years | 0 (0.0%) | 0.0 |
| 20 to 34 years | 277 (79.6%) | 117.0 |
| 35 to 50 years | 71 (20.4%) | 30.0 |
| Total | 348 (100.0%) | 63.0 |
Fertility by Age by Marriage Status in Marion County
32.8% of women with births (348) in Marion County are married. The highest percentage of unmarried women with births falls into 20 to 34 years age bracket with 77.6% of them unmarried at the time of birth, while the lowest percentage of unmarried women with births belong to 35 to 50 years age bracket with 26.8% of them unmarried.
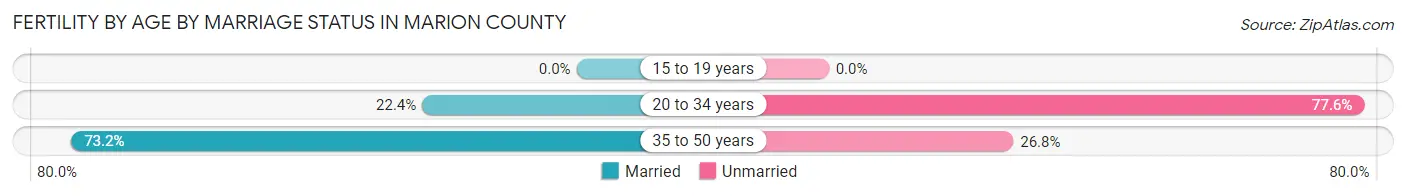
| Age Bracket | Married | Unmarried |
| 15 to 19 years | 0 (0.0%) | 0 (0.0%) |
| 20 to 34 years | 62 (22.4%) | 215 (77.6%) |
| 35 to 50 years | 52 (73.2%) | 19 (26.8%) |
| Total | 114 (32.8%) | 234 (67.2%) |
Fertility by Education in Marion County
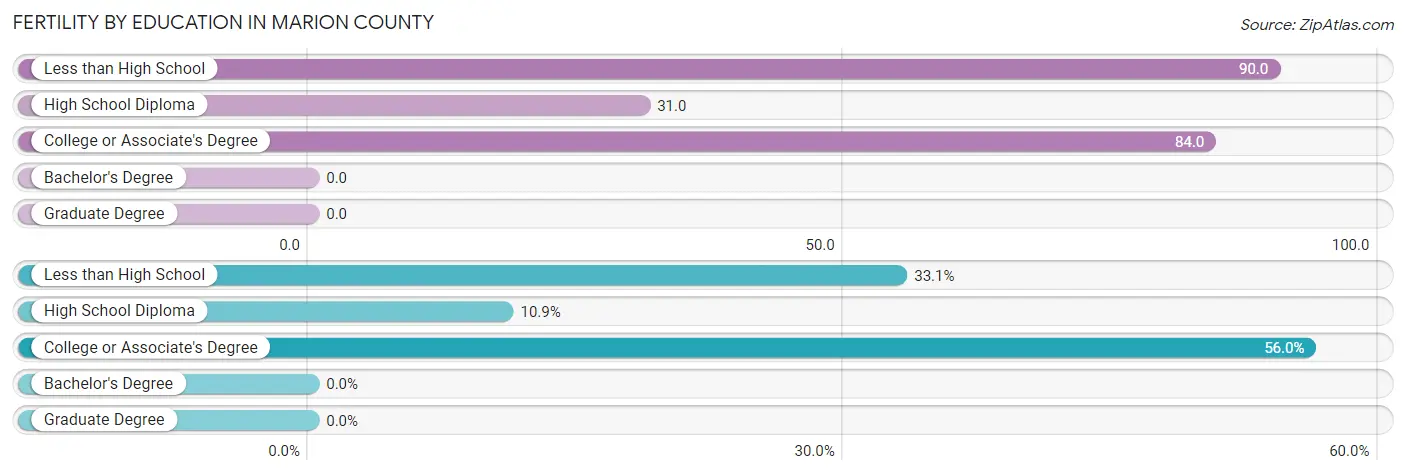
| Educational Attainment | Women with Births | Births / 1,000 Women |
| Less than High School | 115 (33.1%) | 90.0 |
| High School Diploma | 38 (10.9%) | 31.0 |
| College or Associate's Degree | 195 (56.0%) | 84.0 |
| Bachelor's Degree | 0 (0.0%) | 0.0 |
| Graduate Degree | 0 (0.0%) | 0.0 |
| Total | 348 (100.0%) | 63.0 |
Fertility by Education by Marriage Status in Marion County
67.2% of women with births in Marion County are unmarried. Women with the educational attainment of college or associate's degree are most likely to be married with 52.3% of them married at childbirth, while women with the educational attainment of high school diploma are least likely to be married with 100.0% of them unmarried at childbirth.
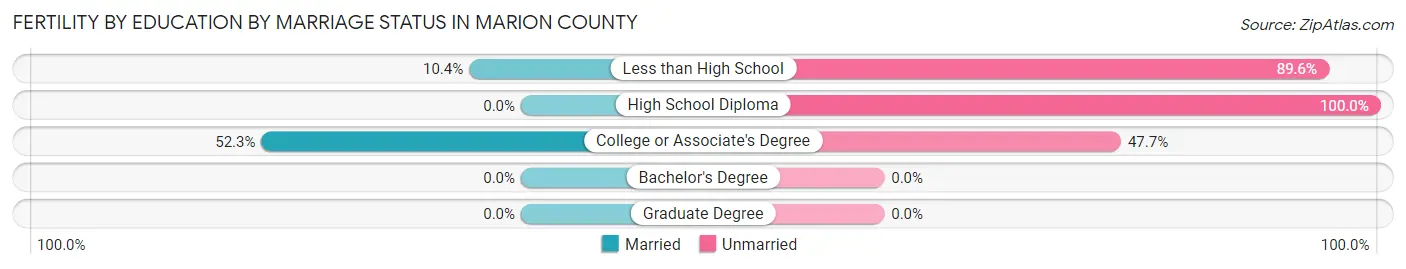
| Educational Attainment | Married | Unmarried |
| Less than High School | 12 (10.4%) | 103 (89.6%) |
| High School Diploma | 0 (0.0%) | 38 (100.0%) |
| College or Associate's Degree | 102 (52.3%) | 93 (47.7%) |
| Bachelor's Degree | 0 (0.0%) | 0 (0.0%) |
| Graduate Degree | 0 (0.0%) | 0 (0.0%) |
| Total | 114 (32.8%) | 234 (67.2%) |
Employment Characteristics in Marion County
Employment by Class of Employer in Marion County
Among the 8,800 employed individuals in Marion County, private company employees (6,398 | 72.7%), self-employed (not incorporated) (700 | 8.0%), and not-for-profit organizations (427 | 4.9%) make up the most common classes of employment.
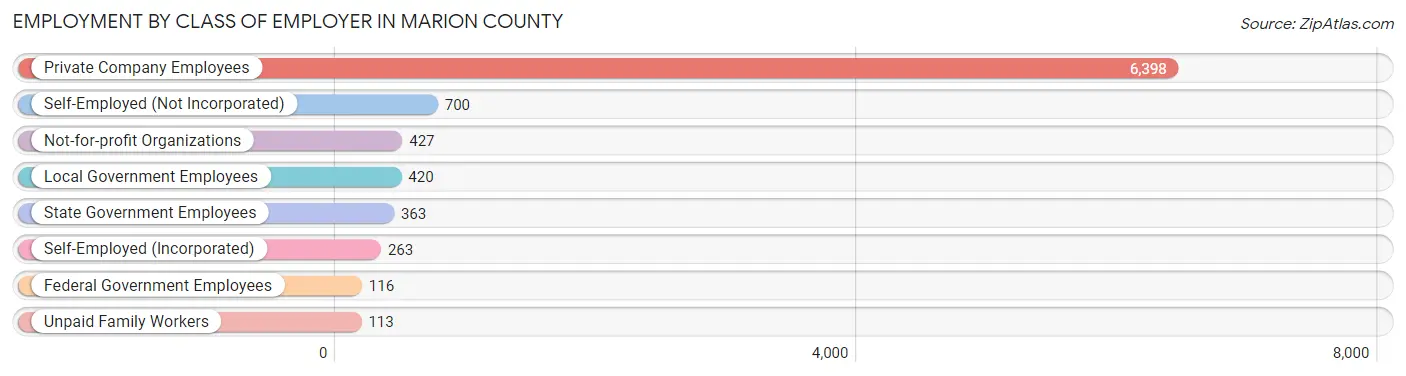
| Employer Class | # Employees | % Employees |
| Private Company Employees | 6,398 | 72.7% |
| Self-Employed (Incorporated) | 263 | 3.0% |
| Self-Employed (Not Incorporated) | 700 | 8.0% |
| Not-for-profit Organizations | 427 | 4.9% |
| Local Government Employees | 420 | 4.8% |
| State Government Employees | 363 | 4.1% |
| Federal Government Employees | 116 | 1.3% |
| Unpaid Family Workers | 113 | 1.3% |
| Total | 8,800 | 100.0% |
Employment Status by Age in Marion County
According to the labor force statistics for Marion County, out of the total population over 16 years of age (19,288), 51.5% or 9,933 individuals are in the labor force, with 9.5% or 944 of them unemployed. The age group with the highest labor force participation rate is 25 to 29 years, with 85.4% or 1,277 individuals in the labor force. Within the labor force, the 16 to 19 years age range has the highest percentage of unemployed individuals, with 20.5% or 61 of them being unemployed.
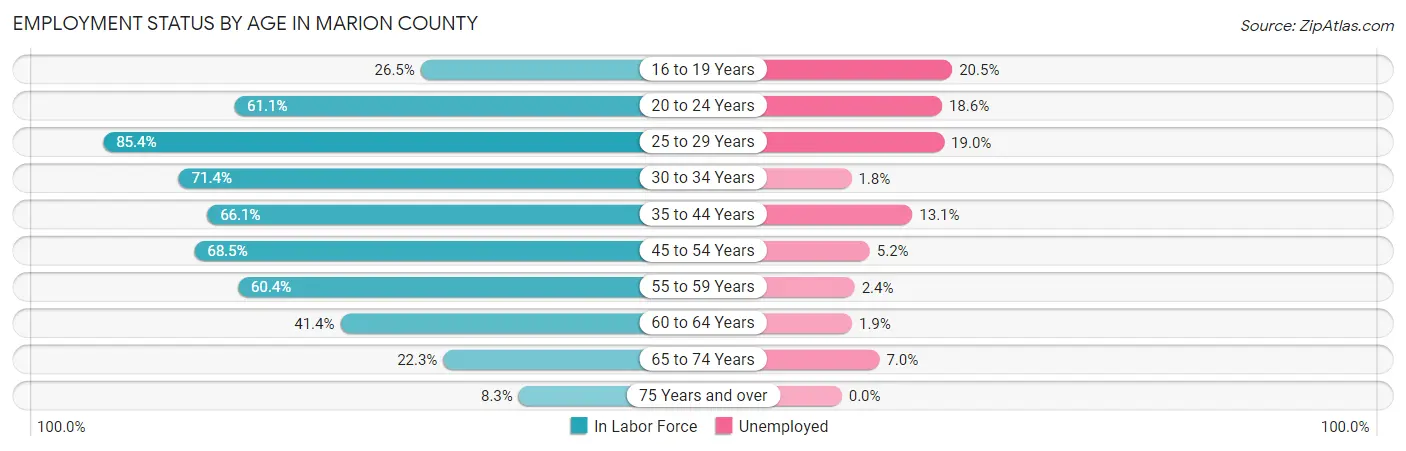
| Age Bracket | In Labor Force | Unemployed |
| 16 to 19 Years | 297 (26.5%) | 61 (20.5%) |
| 20 to 24 Years | 910 (61.1%) | 169 (18.6%) |
| 25 to 29 Years | 1,277 (85.4%) | 243 (19.0%) |
| 30 to 34 Years | 1,018 (71.4%) | 18 (1.8%) |
| 35 to 44 Years | 2,057 (66.1%) | 269 (13.1%) |
| 45 to 54 Years | 1,961 (68.5%) | 102 (5.2%) |
| 55 to 59 Years | 974 (60.4%) | 23 (2.4%) |
| 60 to 64 Years | 686 (41.4%) | 13 (1.9%) |
| 65 to 74 Years | 616 (22.3%) | 43 (7.0%) |
| 75 Years and over | 145 (8.3%) | 0 (0.0%) |
| Total | 9,933 (51.5%) | 944 (9.5%) |
Employment Status by Educational Attainment in Marion County
According to labor force statistics for Marion County, 65.5% of individuals (7,968) out of the total population between 25 and 64 years of age (12,165) are in the labor force, with 8.4% or 669 of them being unemployed. The group with the highest labor force participation rate are those with the educational attainment of bachelor's degree or higher, with 78.5% or 1,050 individuals in the labor force. Within the labor force, individuals with less than high school education have the highest percentage of unemployment, with 26.7% or 252 of them being unemployed.
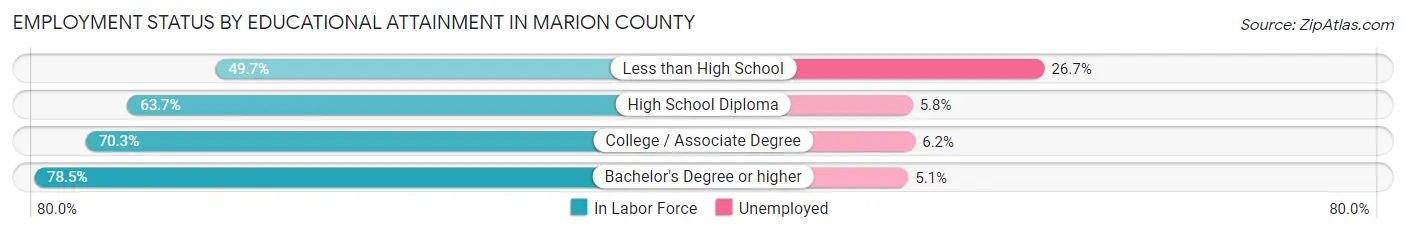
| Educational Attainment | In Labor Force | Unemployed |
| Less than High School | 942 (49.7%) | 506 (26.7%) |
| High School Diploma | 2,900 (63.7%) | 264 (5.8%) |
| College / Associate Degree | 3,079 (70.3%) | 272 (6.2%) |
| Bachelor's Degree or higher | 1,050 (78.5%) | 68 (5.1%) |
| Total | 7,968 (65.5%) | 1,022 (8.4%) |
Employment Occupations by Sex in Marion County
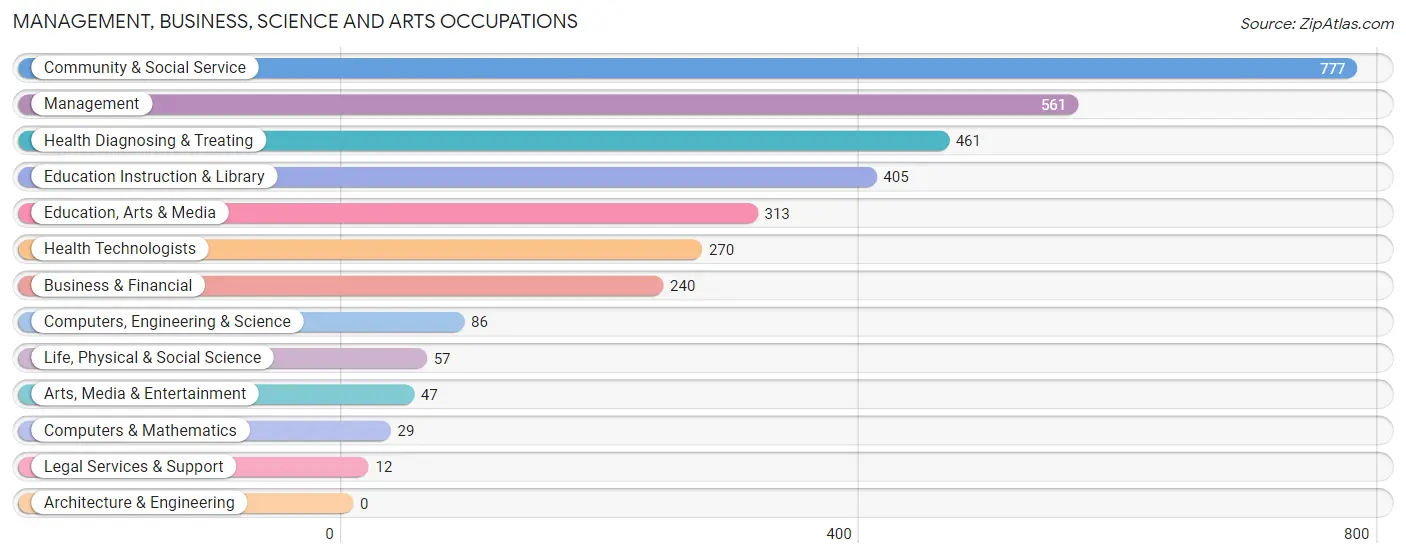
Management, Business, Science and Arts Occupations
The most common Management, Business, Science and Arts occupations in Marion County are Community & Social Service (777 | 8.6%), Management (561 | 6.2%), Health Diagnosing & Treating (461 | 5.1%), Education Instruction & Library (405 | 4.5%), and Education, Arts & Media (313 | 3.5%).
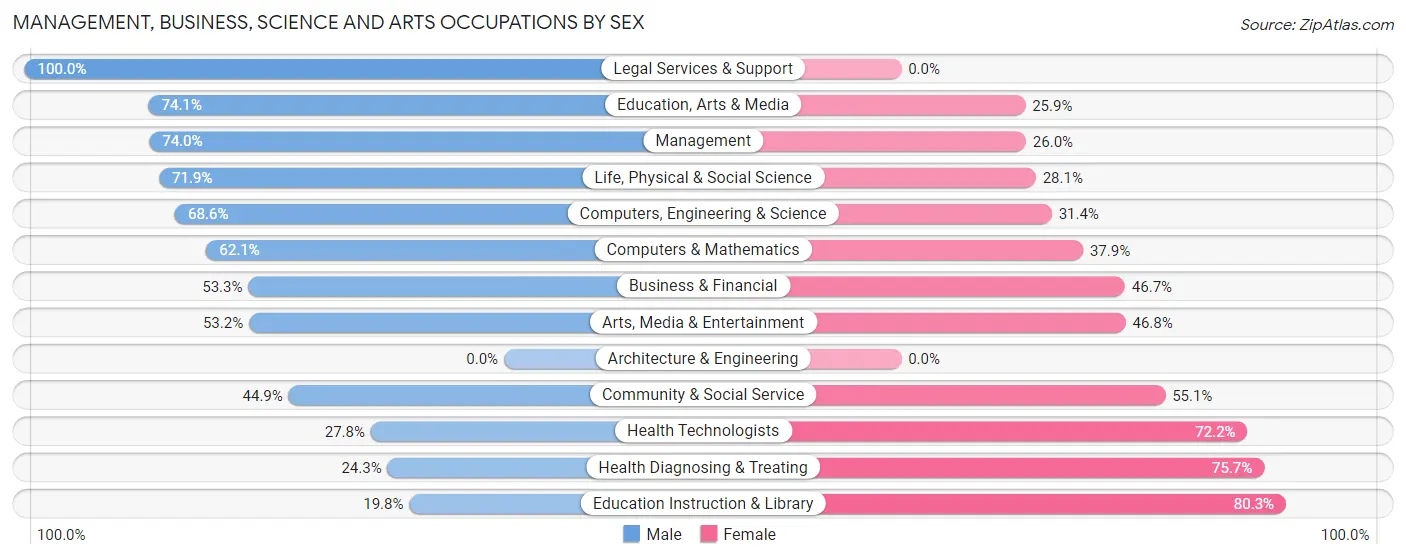
Management, Business, Science and Arts Occupations by Sex
Within the Management, Business, Science and Arts occupations in Marion County, the most male-oriented occupations are Legal Services & Support (100.0%), Education, Arts & Media (74.1%), and Management (74.0%), while the most female-oriented occupations are Education Instruction & Library (80.2%), Health Diagnosing & Treating (75.7%), and Health Technologists (72.2%).
| Occupation | Male | Female |
| Management | 415 (74.0%) | 146 (26.0%) |
| Business & Financial | 128 (53.3%) | 112 (46.7%) |
| Computers, Engineering & Science | 59 (68.6%) | 27 (31.4%) |
| Computers & Mathematics | 18 (62.1%) | 11 (37.9%) |
| Architecture & Engineering | 0 (0.0%) | 0 (0.0%) |
| Life, Physical & Social Science | 41 (71.9%) | 16 (28.1%) |
| Community & Social Service | 349 (44.9%) | 428 (55.1%) |
| Education, Arts & Media | 232 (74.1%) | 81 (25.9%) |
| Legal Services & Support | 12 (100.0%) | 0 (0.0%) |
| Education Instruction & Library | 80 (19.8%) | 325 (80.2%) |
| Arts, Media & Entertainment | 25 (53.2%) | 22 (46.8%) |
| Health Diagnosing & Treating | 112 (24.3%) | 349 (75.7%) |
| Health Technologists | 75 (27.8%) | 195 (72.2%) |
| Total (Category) | 1,063 (50.0%) | 1,062 (50.0%) |
| Total (Overall) | 4,790 (53.3%) | 4,193 (46.7%) |
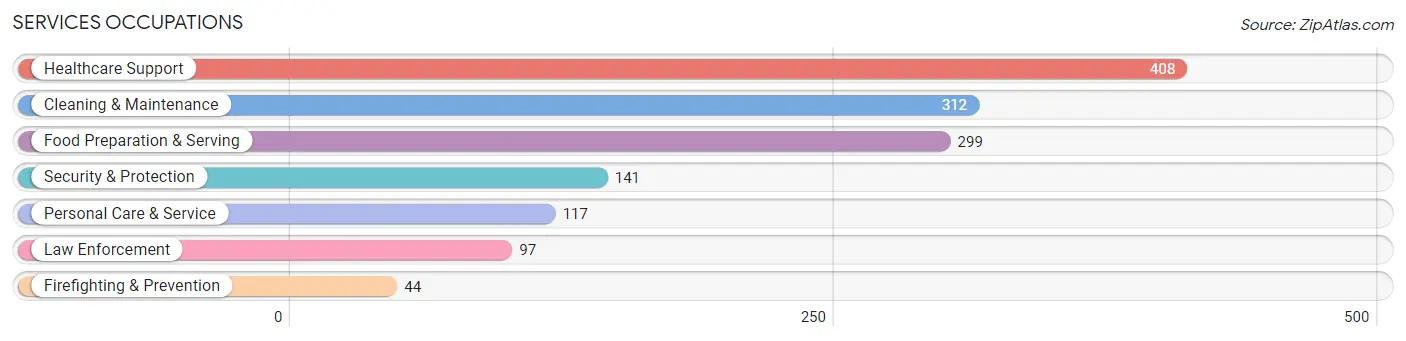
Services Occupations
The most common Services occupations in Marion County are Healthcare Support (408 | 4.5%), Cleaning & Maintenance (312 | 3.5%), Food Preparation & Serving (299 | 3.3%), Security & Protection (141 | 1.6%), and Personal Care & Service (117 | 1.3%).
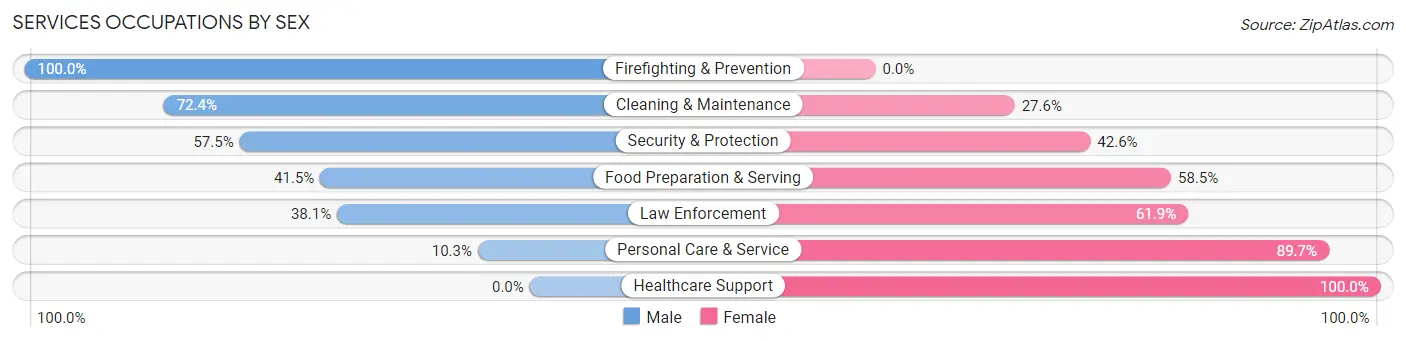
Services Occupations by Sex
Within the Services occupations in Marion County, the most male-oriented occupations are Firefighting & Prevention (100.0%), Cleaning & Maintenance (72.4%), and Security & Protection (57.5%), while the most female-oriented occupations are Healthcare Support (100.0%), Personal Care & Service (89.7%), and Law Enforcement (61.9%).
| Occupation | Male | Female |
| Healthcare Support | 0 (0.0%) | 408 (100.0%) |
| Security & Protection | 81 (57.5%) | 60 (42.5%) |
| Firefighting & Prevention | 44 (100.0%) | 0 (0.0%) |
| Law Enforcement | 37 (38.1%) | 60 (61.9%) |
| Food Preparation & Serving | 124 (41.5%) | 175 (58.5%) |
| Cleaning & Maintenance | 226 (72.4%) | 86 (27.6%) |
| Personal Care & Service | 12 (10.3%) | 105 (89.7%) |
| Total (Category) | 443 (34.7%) | 834 (65.3%) |
| Total (Overall) | 4,790 (53.3%) | 4,193 (46.7%) |
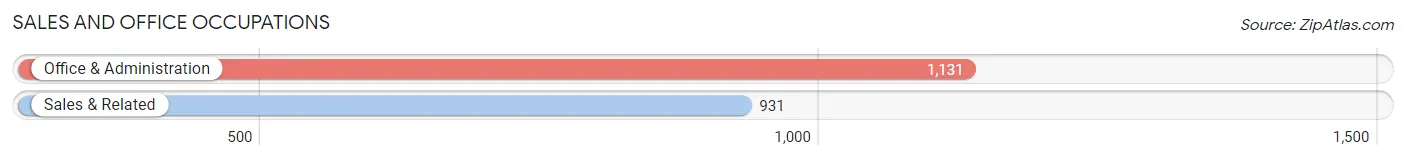
Sales and Office Occupations
The most common Sales and Office occupations in Marion County are Office & Administration (1,131 | 12.6%), and Sales & Related (931 | 10.4%).
Sales and Office Occupations by Sex
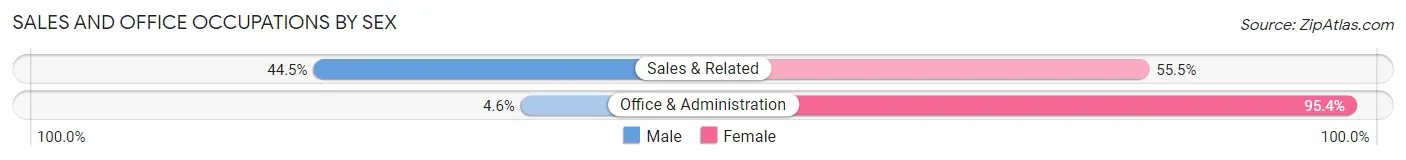
| Occupation | Male | Female |
| Sales & Related | 414 (44.5%) | 517 (55.5%) |
| Office & Administration | 52 (4.6%) | 1,079 (95.4%) |
| Total (Category) | 466 (22.6%) | 1,596 (77.4%) |
| Total (Overall) | 4,790 (53.3%) | 4,193 (46.7%) |
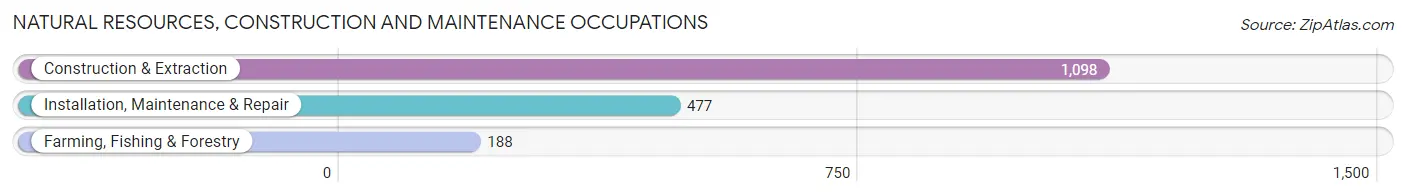
Natural Resources, Construction and Maintenance Occupations
The most common Natural Resources, Construction and Maintenance occupations in Marion County are Construction & Extraction (1,098 | 12.2%), Installation, Maintenance & Repair (477 | 5.3%), and Farming, Fishing & Forestry (188 | 2.1%).
Natural Resources, Construction and Maintenance Occupations by Sex
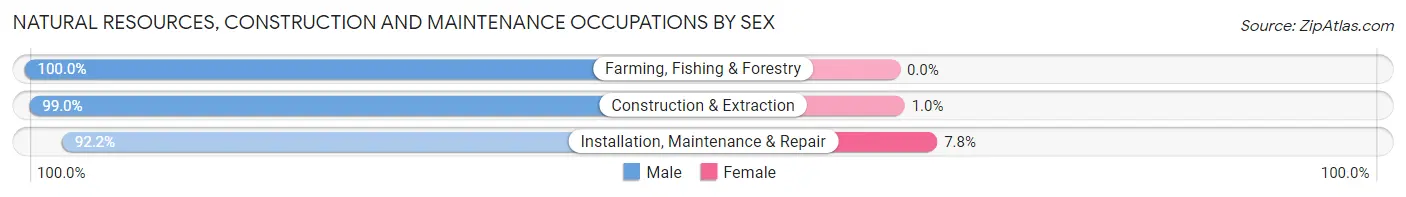
| Occupation | Male | Female |
| Farming, Fishing & Forestry | 188 (100.0%) | 0 (0.0%) |
| Construction & Extraction | 1,087 (99.0%) | 11 (1.0%) |
| Installation, Maintenance & Repair | 440 (92.2%) | 37 (7.8%) |
| Total (Category) | 1,715 (97.3%) | 48 (2.7%) |
| Total (Overall) | 4,790 (53.3%) | 4,193 (46.7%) |
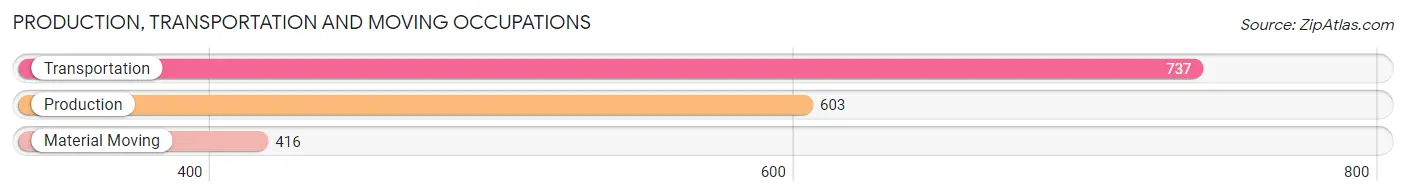
Production, Transportation and Moving Occupations
The most common Production, Transportation and Moving occupations in Marion County are Transportation (737 | 8.2%), Production (603 | 6.7%), and Material Moving (416 | 4.6%).
Production, Transportation and Moving Occupations by Sex
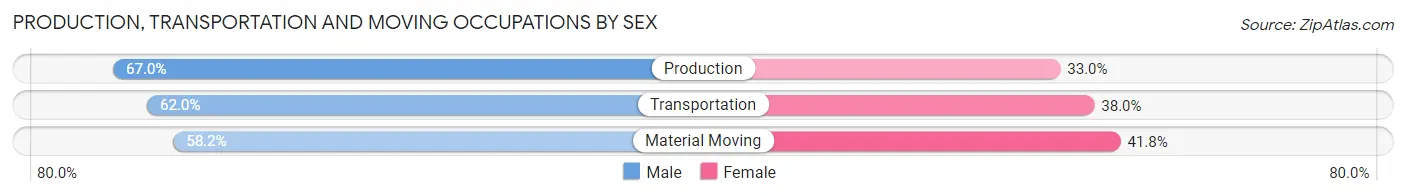
| Occupation | Male | Female |
| Production | 404 (67.0%) | 199 (33.0%) |
| Transportation | 457 (62.0%) | 280 (38.0%) |
| Material Moving | 242 (58.2%) | 174 (41.8%) |
| Total (Category) | 1,103 (62.8%) | 653 (37.2%) |
| Total (Overall) | 4,790 (53.3%) | 4,193 (46.7%) |
Employment Industries by Sex in Marion County
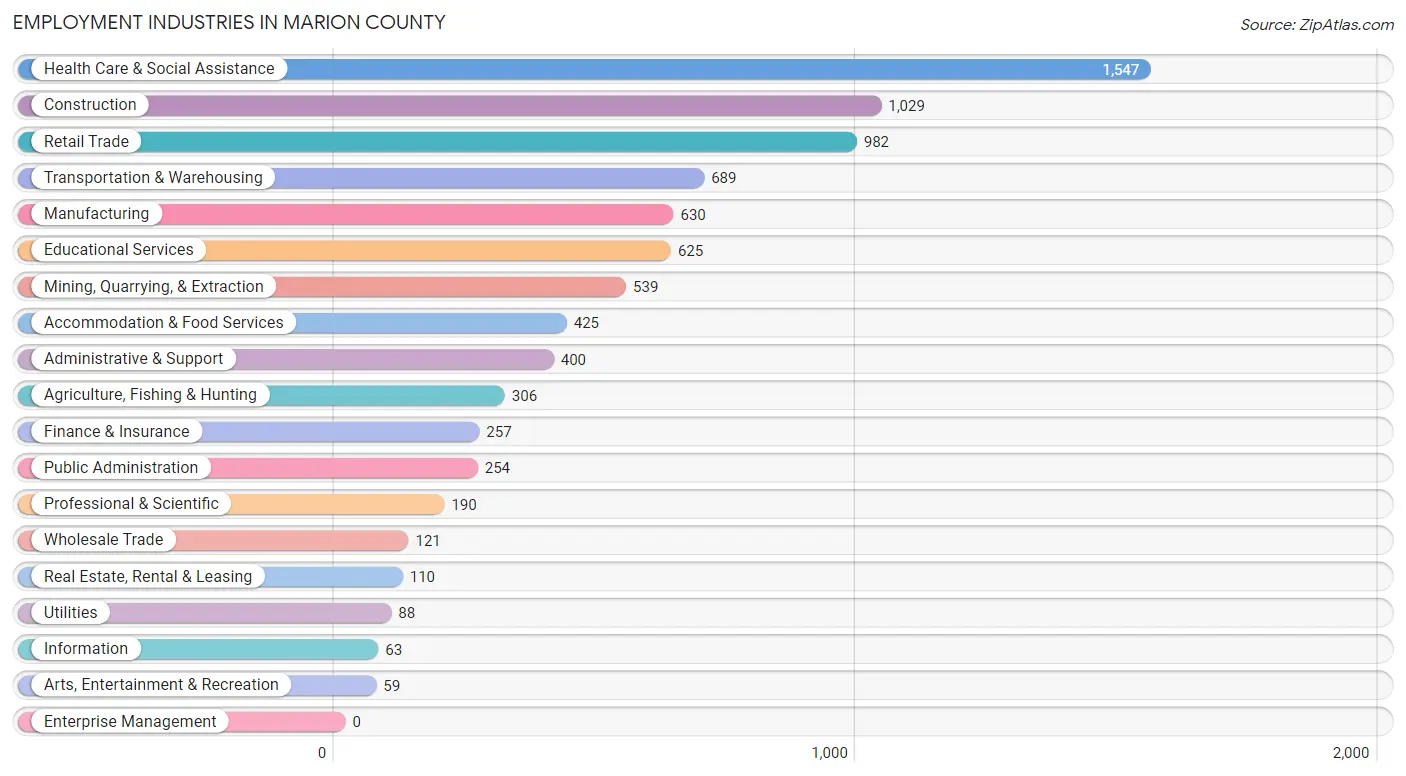
Employment Industries in Marion County
The major employment industries in Marion County include Health Care & Social Assistance (1,547 | 17.2%), Construction (1,029 | 11.5%), Retail Trade (982 | 10.9%), Transportation & Warehousing (689 | 7.7%), and Manufacturing (630 | 7.0%).
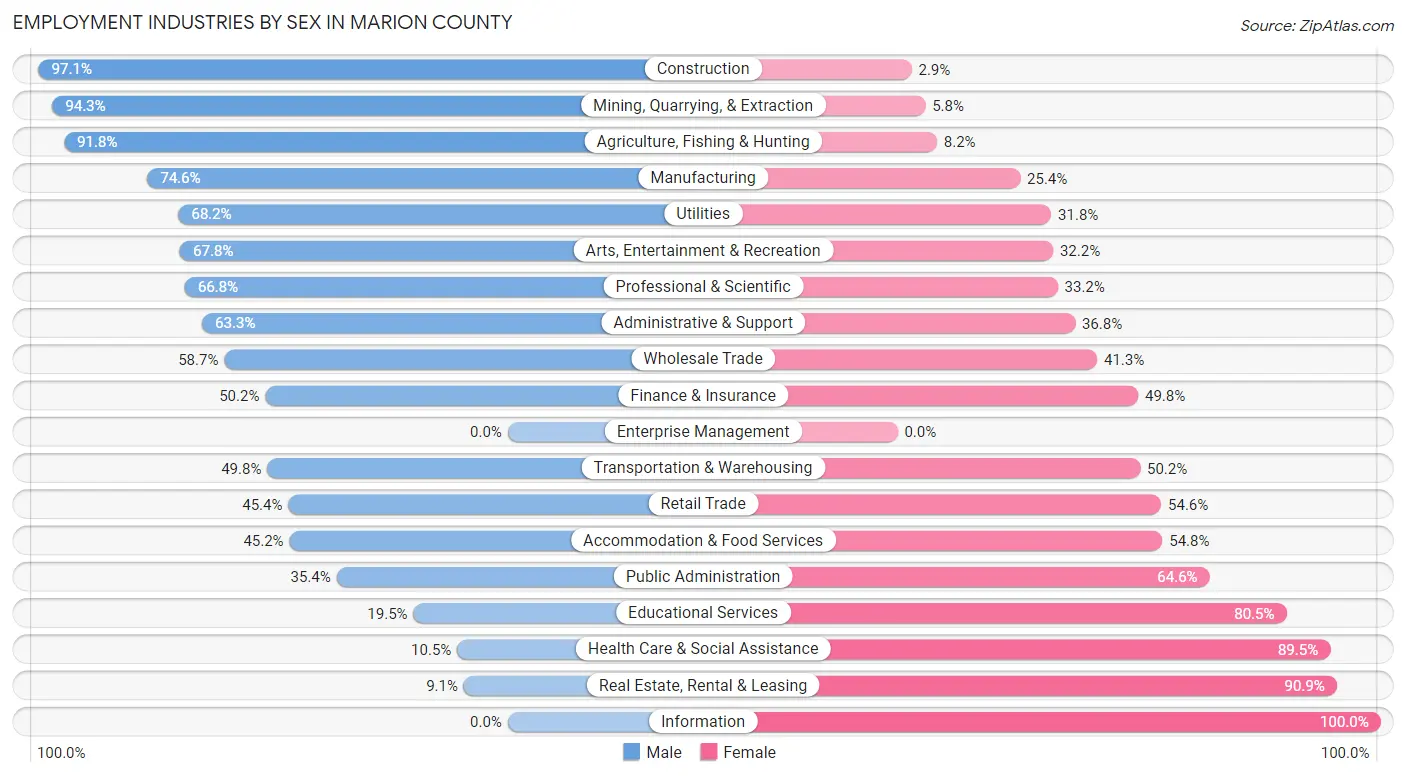
Employment Industries by Sex in Marion County
The Marion County industries that see more men than women are Construction (97.1%), Mining, Quarrying, & Extraction (94.3%), and Agriculture, Fishing & Hunting (91.8%), whereas the industries that tend to have a higher number of women are Information (100.0%), Real Estate, Rental & Leasing (90.9%), and Health Care & Social Assistance (89.5%).
| Industry | Male | Female |
| Agriculture, Fishing & Hunting | 281 (91.8%) | 25 (8.2%) |
| Mining, Quarrying, & Extraction | 508 (94.3%) | 31 (5.8%) |
| Construction | 999 (97.1%) | 30 (2.9%) |
| Manufacturing | 470 (74.6%) | 160 (25.4%) |
| Wholesale Trade | 71 (58.7%) | 50 (41.3%) |
| Retail Trade | 446 (45.4%) | 536 (54.6%) |
| Transportation & Warehousing | 343 (49.8%) | 346 (50.2%) |
| Utilities | 60 (68.2%) | 28 (31.8%) |
| Information | 0 (0.0%) | 63 (100.0%) |
| Finance & Insurance | 129 (50.2%) | 128 (49.8%) |
| Real Estate, Rental & Leasing | 10 (9.1%) | 100 (90.9%) |
| Professional & Scientific | 127 (66.8%) | 63 (33.2%) |
| Enterprise Management | 0 (0.0%) | 0 (0.0%) |
| Administrative & Support | 253 (63.2%) | 147 (36.7%) |
| Educational Services | 122 (19.5%) | 503 (80.5%) |
| Health Care & Social Assistance | 162 (10.5%) | 1,385 (89.5%) |
| Arts, Entertainment & Recreation | 40 (67.8%) | 19 (32.2%) |
| Accommodation & Food Services | 192 (45.2%) | 233 (54.8%) |
| Public Administration | 90 (35.4%) | 164 (64.6%) |
| Total | 4,790 (53.3%) | 4,193 (46.7%) |
Education in Marion County
School Enrollment in Marion County
The most common levels of schooling among the 5,444 students in Marion County are middle school (1,514 | 27.8%), high school (1,180 | 21.7%), and elementary school (1,087 | 20.0%).
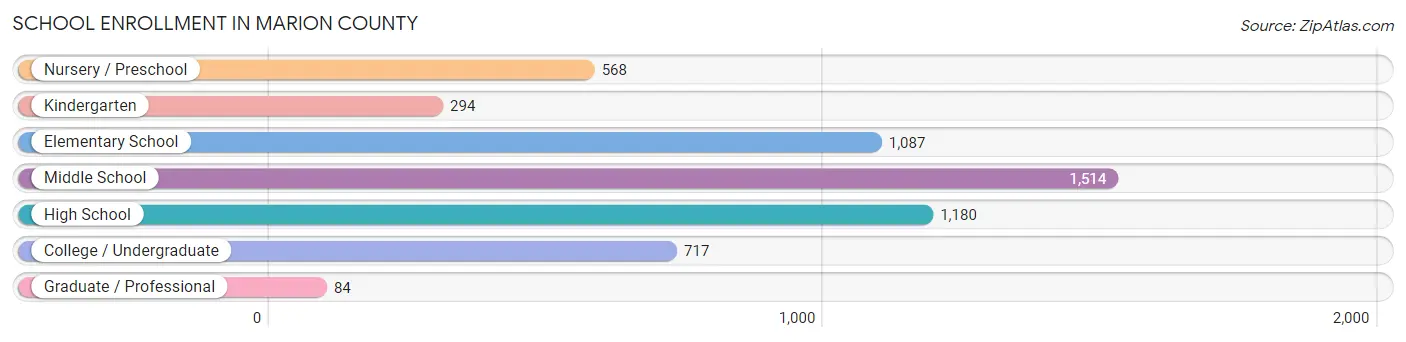
| School Level | # Students | % Students |
| Nursery / Preschool | 568 | 10.4% |
| Kindergarten | 294 | 5.4% |
| Elementary School | 1,087 | 20.0% |
| Middle School | 1,514 | 27.8% |
| High School | 1,180 | 21.7% |
| College / Undergraduate | 717 | 13.2% |
| Graduate / Professional | 84 | 1.5% |
| Total | 5,444 | 100.0% |
School Enrollment by Age by Funding Source in Marion County
Out of a total of 5,444 students who are enrolled in schools in Marion County, 1,111 (20.4%) attend a private institution, while the remaining 4,333 (79.6%) are enrolled in public schools. The age group of 3 to 4 year olds has the highest likelihood of being enrolled in private schools, with 280 (57.9% in the age bracket) enrolled. Conversely, the age group of 18 to 19 year olds has the lowest likelihood of being enrolled in a private school, with 369 (100.0% in the age bracket) attending a public institution.
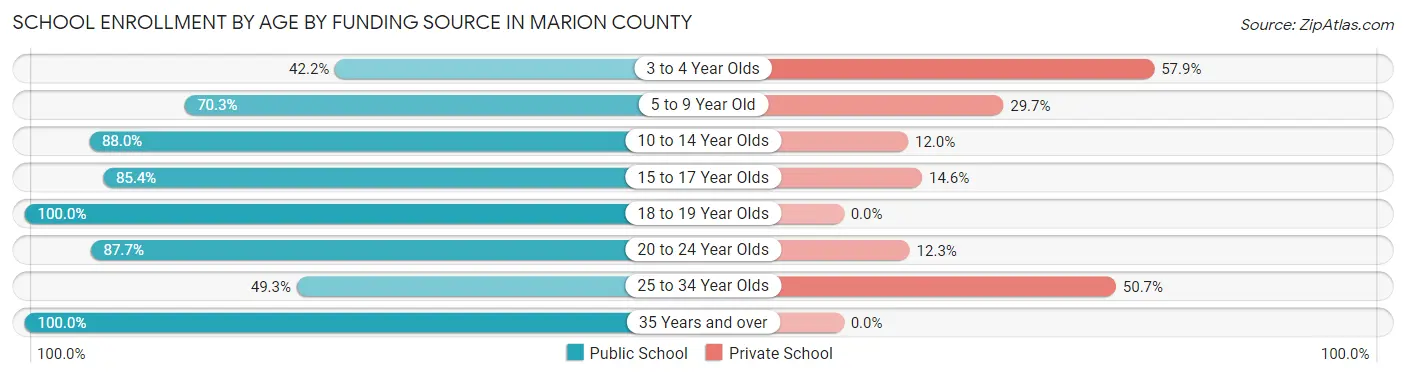
| Age Bracket | Public School | Private School |
| 3 to 4 Year Olds | 204 (42.1%) | 280 (57.9%) |
| 5 to 9 Year Old | 846 (70.3%) | 358 (29.7%) |
| 10 to 14 Year Olds | 1,600 (88.0%) | 218 (12.0%) |
| 15 to 17 Year Olds | 772 (85.4%) | 132 (14.6%) |
| 18 to 19 Year Olds | 369 (100.0%) | 0 (0.0%) |
| 20 to 24 Year Olds | 357 (87.7%) | 50 (12.3%) |
| 25 to 34 Year Olds | 70 (49.3%) | 72 (50.7%) |
| 35 Years and over | 116 (100.0%) | 0 (0.0%) |
| Total | 4,333 (79.6%) | 1,111 (20.4%) |
Educational Attainment by Field of Study in Marion County
Education (610 | 31.3%), science & technology (320 | 16.4%), business (244 | 12.5%), arts & humanities (172 | 8.8%), and social sciences (148 | 7.6%) are the most common fields of study among 1,950 individuals in Marion County who have obtained a bachelor's degree or higher.
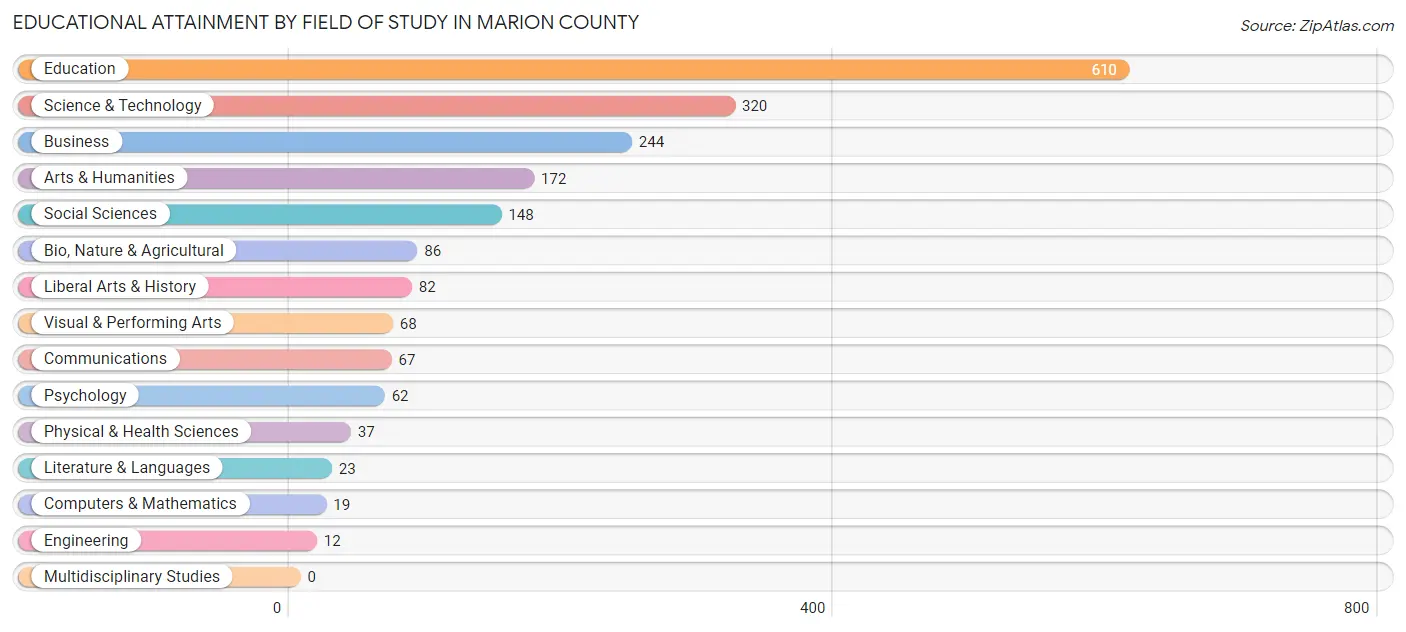
| Field of Study | # Graduates | % Graduates |
| Computers & Mathematics | 19 | 1.0% |
| Bio, Nature & Agricultural | 86 | 4.4% |
| Physical & Health Sciences | 37 | 1.9% |
| Psychology | 62 | 3.2% |
| Social Sciences | 148 | 7.6% |
| Engineering | 12 | 0.6% |
| Multidisciplinary Studies | 0 | 0.0% |
| Science & Technology | 320 | 16.4% |
| Business | 244 | 12.5% |
| Education | 610 | 31.3% |
| Literature & Languages | 23 | 1.2% |
| Liberal Arts & History | 82 | 4.2% |
| Visual & Performing Arts | 68 | 3.5% |
| Communications | 67 | 3.4% |
| Arts & Humanities | 172 | 8.8% |
| Total | 1,950 | 100.0% |
Transportation & Commute in Marion County
Vehicle Availability by Sex in Marion County
The most prevalent vehicle ownership categories in Marion County are males with 2 vehicles (1,650, accounting for 35.5%) and females with 2 vehicles (1,424, making up 39.9%).
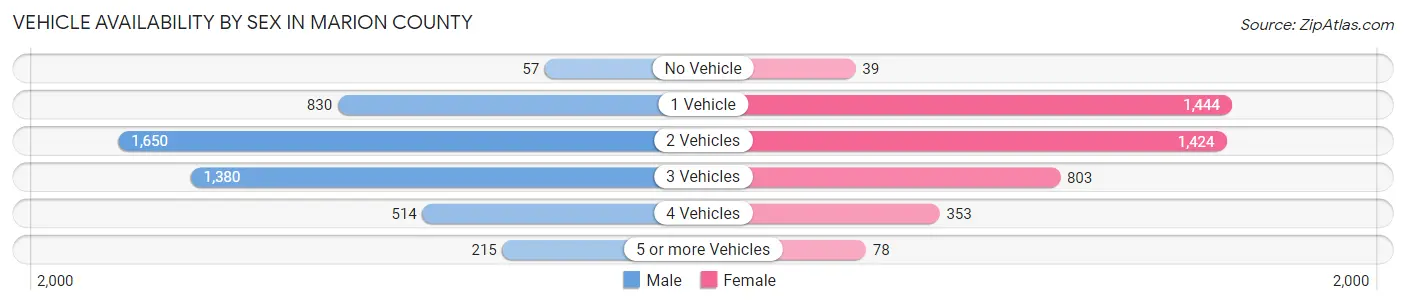
| Vehicles Available | Male | Female |
| No Vehicle | 57 (1.2%) | 39 (0.9%) |
| 1 Vehicle | 830 (17.9%) | 1,444 (34.9%) |
| 2 Vehicles | 1,650 (35.5%) | 1,424 (34.4%) |
| 3 Vehicles | 1,380 (29.7%) | 803 (19.4%) |
| 4 Vehicles | 514 (11.1%) | 353 (8.5%) |
| 5 or more Vehicles | 215 (4.6%) | 78 (1.9%) |
| Total | 4,646 (100.0%) | 4,141 (100.0%) |
Commute Time in Marion County
The most frequently occuring commute durations in Marion County are 10 to 14 minutes (1,257 commuters, 14.6%), 15 to 19 minutes (1,220 commuters, 14.2%), and 90 or more minutes (1,035 commuters, 12.0%).
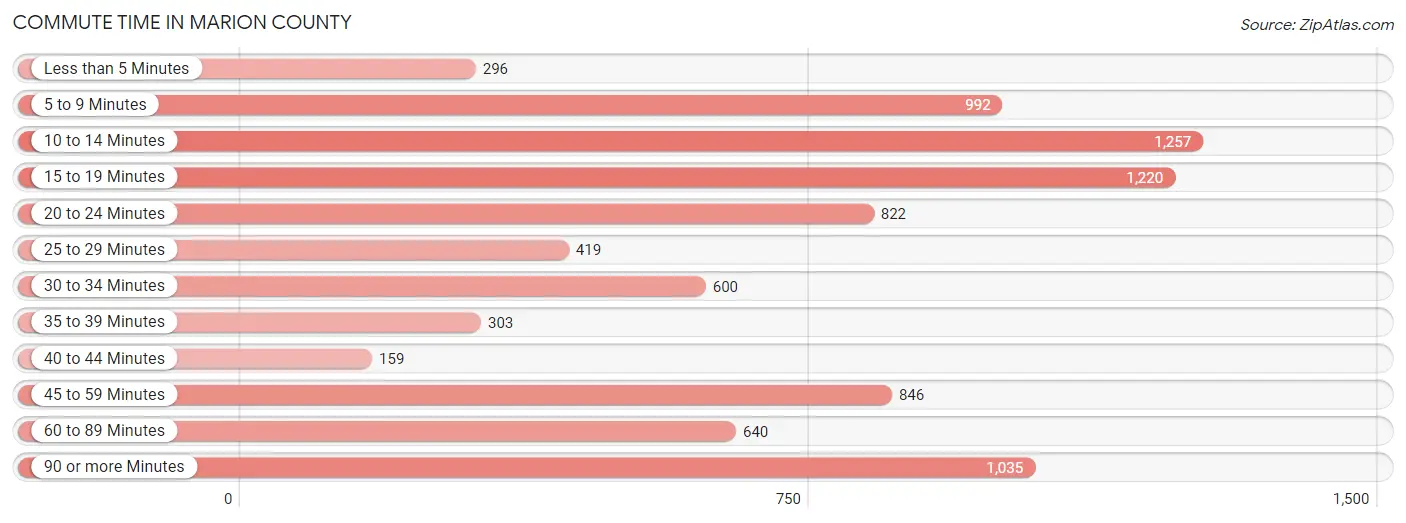
| Commute Time | # Commuters | % Commuters |
| Less than 5 Minutes | 296 | 3.5% |
| 5 to 9 Minutes | 992 | 11.6% |
| 10 to 14 Minutes | 1,257 | 14.6% |
| 15 to 19 Minutes | 1,220 | 14.2% |
| 20 to 24 Minutes | 822 | 9.6% |
| 25 to 29 Minutes | 419 | 4.9% |
| 30 to 34 Minutes | 600 | 7.0% |
| 35 to 39 Minutes | 303 | 3.5% |
| 40 to 44 Minutes | 159 | 1.8% |
| 45 to 59 Minutes | 846 | 9.9% |
| 60 to 89 Minutes | 640 | 7.4% |
| 90 or more Minutes | 1,035 | 12.0% |
Commute Time by Sex in Marion County
The most common commute times in Marion County are 90 or more minutes (776 commuters, 17.0%) for males and 10 to 14 minutes (752 commuters, 18.7%) for females.
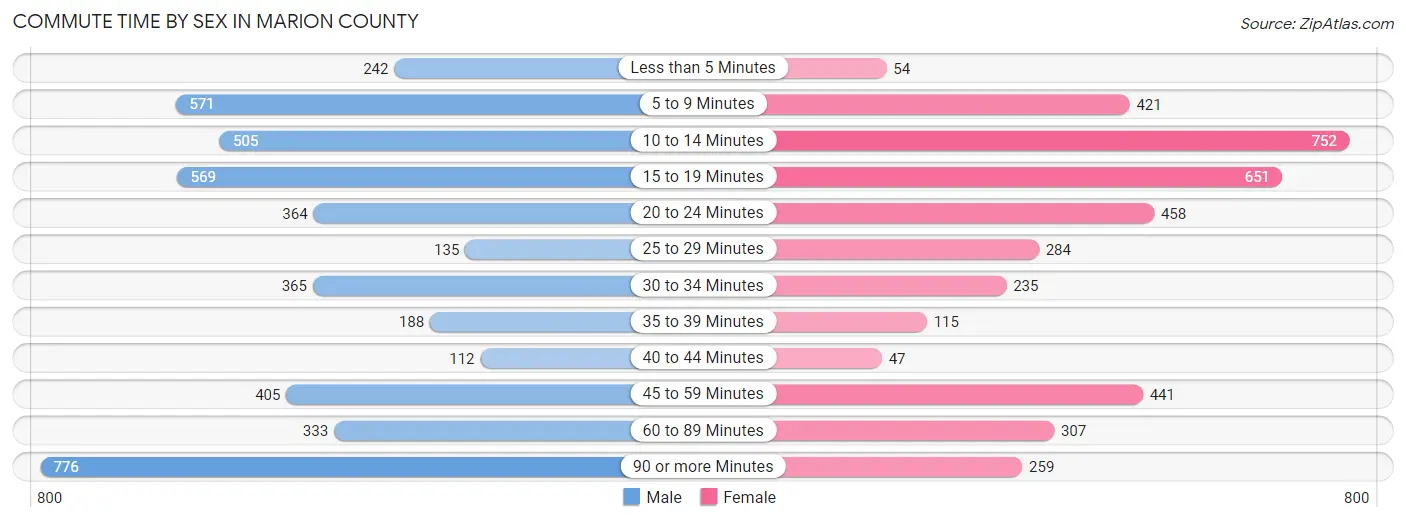
| Commute Time | Male | Female |
| Less than 5 Minutes | 242 (5.3%) | 54 (1.3%) |
| 5 to 9 Minutes | 571 (12.5%) | 421 (10.5%) |
| 10 to 14 Minutes | 505 (11.1%) | 752 (18.7%) |
| 15 to 19 Minutes | 569 (12.5%) | 651 (16.2%) |
| 20 to 24 Minutes | 364 (8.0%) | 458 (11.4%) |
| 25 to 29 Minutes | 135 (3.0%) | 284 (7.1%) |
| 30 to 34 Minutes | 365 (8.0%) | 235 (5.8%) |
| 35 to 39 Minutes | 188 (4.1%) | 115 (2.9%) |
| 40 to 44 Minutes | 112 (2.5%) | 47 (1.2%) |
| 45 to 59 Minutes | 405 (8.9%) | 441 (11.0%) |
| 60 to 89 Minutes | 333 (7.3%) | 307 (7.6%) |
| 90 or more Minutes | 776 (17.0%) | 259 (6.4%) |
Time of Departure to Work by Sex in Marion County
The most frequent times of departure to work in Marion County are 12:00 AM to 4:59 AM (914, 20.0%) for males and 6:30 AM to 6:59 AM (873, 21.7%) for females.
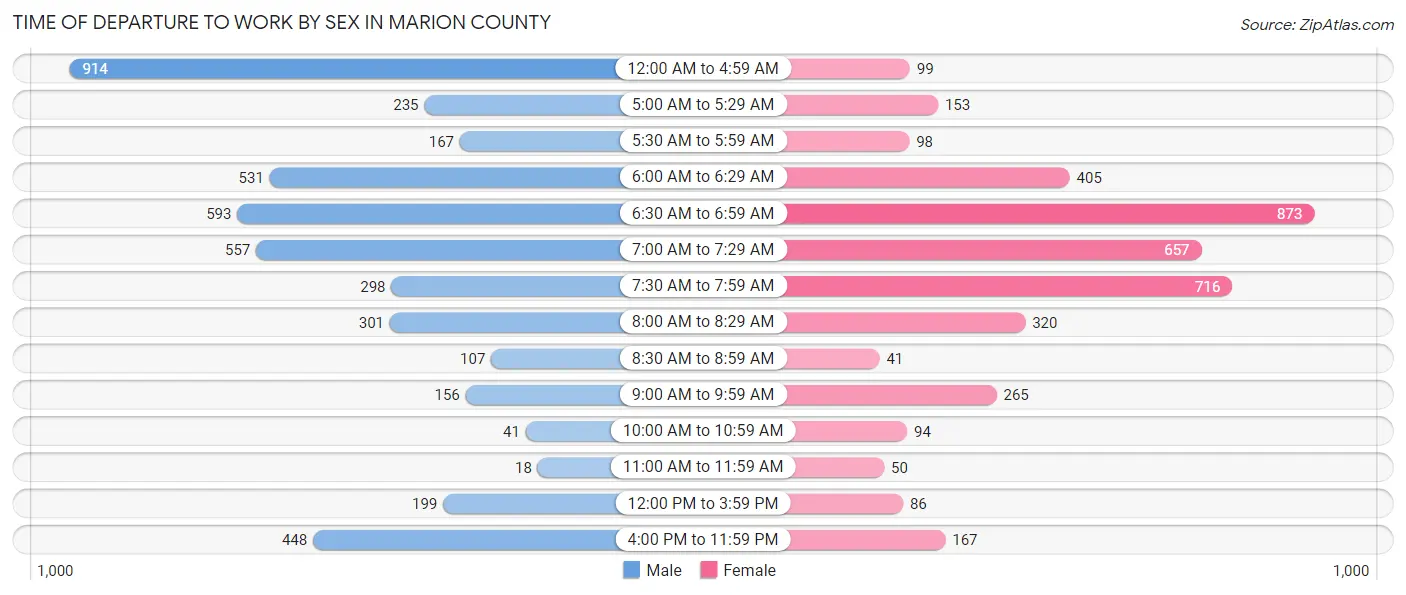
| Time of Departure | Male | Female |
| 12:00 AM to 4:59 AM | 914 (20.0%) | 99 (2.5%) |
| 5:00 AM to 5:29 AM | 235 (5.1%) | 153 (3.8%) |
| 5:30 AM to 5:59 AM | 167 (3.7%) | 98 (2.4%) |
| 6:00 AM to 6:29 AM | 531 (11.6%) | 405 (10.1%) |
| 6:30 AM to 6:59 AM | 593 (13.0%) | 873 (21.7%) |
| 7:00 AM to 7:29 AM | 557 (12.2%) | 657 (16.3%) |
| 7:30 AM to 7:59 AM | 298 (6.5%) | 716 (17.8%) |
| 8:00 AM to 8:29 AM | 301 (6.6%) | 320 (8.0%) |
| 8:30 AM to 8:59 AM | 107 (2.3%) | 41 (1.0%) |
| 9:00 AM to 9:59 AM | 156 (3.4%) | 265 (6.6%) |
| 10:00 AM to 10:59 AM | 41 (0.9%) | 94 (2.3%) |
| 11:00 AM to 11:59 AM | 18 (0.4%) | 50 (1.2%) |
| 12:00 PM to 3:59 PM | 199 (4.4%) | 86 (2.1%) |
| 4:00 PM to 11:59 PM | 448 (9.8%) | 167 (4.2%) |
| Total | 4,565 (100.0%) | 4,024 (100.0%) |
Housing Occupancy in Marion County
Occupancy by Ownership in Marion County
Of the total 9,102 dwellings in Marion County, owner-occupied units account for 7,224 (79.4%), while renter-occupied units make up 1,878 (20.6%).
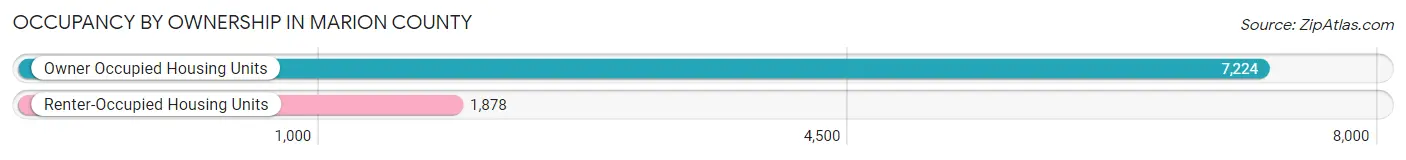
| Occupancy | # Housing Units | % Housing Units |
| Owner Occupied Housing Units | 7,224 | 79.4% |
| Renter-Occupied Housing Units | 1,878 | 20.6% |
| Total Occupied Housing Units | 9,102 | 100.0% |
Occupancy by Household Size in Marion County
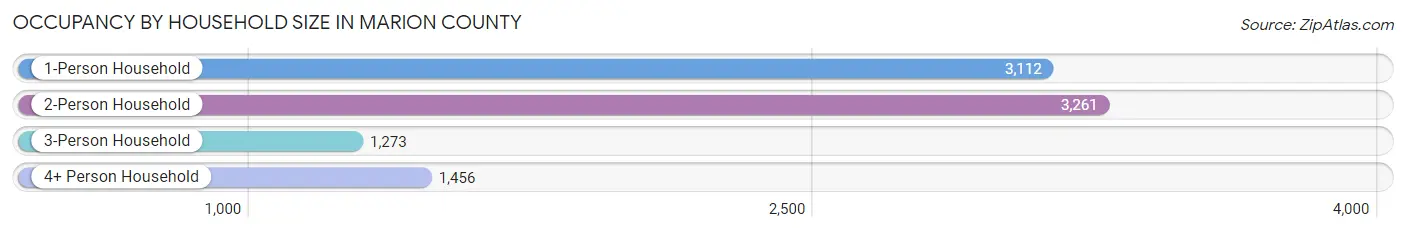
| Household Size | # Housing Units | % Housing Units |
| 1-Person Household | 3,112 | 34.2% |
| 2-Person Household | 3,261 | 35.8% |
| 3-Person Household | 1,273 | 14.0% |
| 4+ Person Household | 1,456 | 16.0% |
| Total Housing Units | 9,102 | 100.0% |
Occupancy by Ownership by Household Size in Marion County
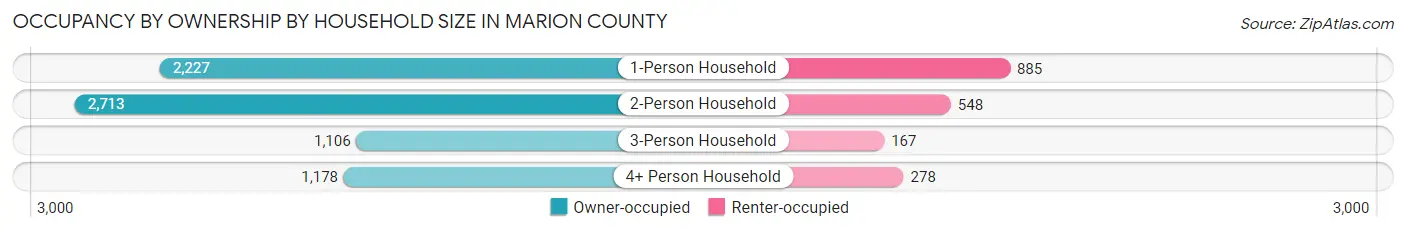
| Household Size | Owner-occupied | Renter-occupied |
| 1-Person Household | 2,227 (71.6%) | 885 (28.4%) |
| 2-Person Household | 2,713 (83.2%) | 548 (16.8%) |
| 3-Person Household | 1,106 (86.9%) | 167 (13.1%) |
| 4+ Person Household | 1,178 (80.9%) | 278 (19.1%) |
| Total Housing Units | 7,224 (79.4%) | 1,878 (20.6%) |
Occupancy by Educational Attainment in Marion County
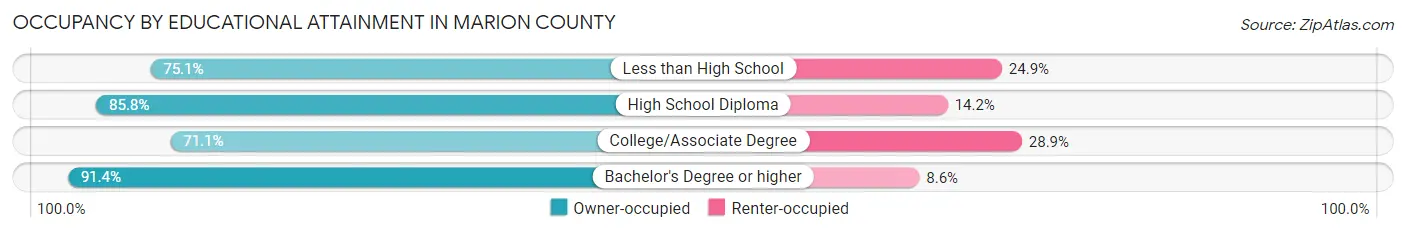
| Household Size | Owner-occupied | Renter-occupied |
| Less than High School | 1,042 (75.1%) | 346 (24.9%) |
| High School Diploma | 2,773 (85.8%) | 458 (14.2%) |
| College/Associate Degree | 2,415 (71.1%) | 981 (28.9%) |
| Bachelor's Degree or higher | 994 (91.4%) | 93 (8.6%) |
Occupancy by Age of Householder in Marion County
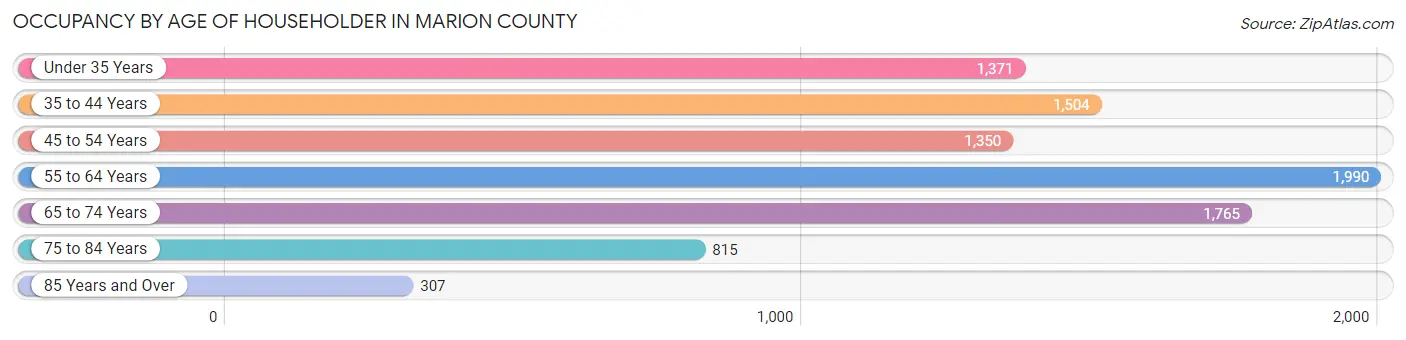
| Age Bracket | # Households | % Households |
| Under 35 Years | 1,371 | 15.1% |
| 35 to 44 Years | 1,504 | 16.5% |
| 45 to 54 Years | 1,350 | 14.8% |
| 55 to 64 Years | 1,990 | 21.9% |
| 65 to 74 Years | 1,765 | 19.4% |
| 75 to 84 Years | 815 | 8.9% |
| 85 Years and Over | 307 | 3.4% |
| Total | 9,102 | 100.0% |
Housing Finances in Marion County
Median Income by Occupancy in Marion County
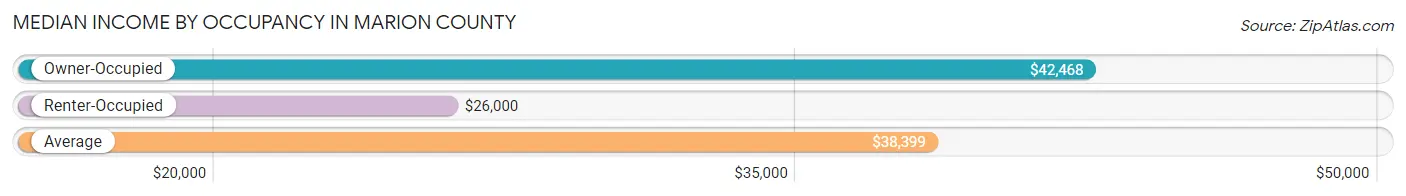
| Occupancy Type | # Households | Median Income |
| Owner-Occupied | 7,224 (79.4%) | $42,468 |
| Renter-Occupied | 1,878 (20.6%) | $26,000 |
| Average | 9,102 (100.0%) | $38,399 |
Occupancy by Householder Income Bracket in Marion County
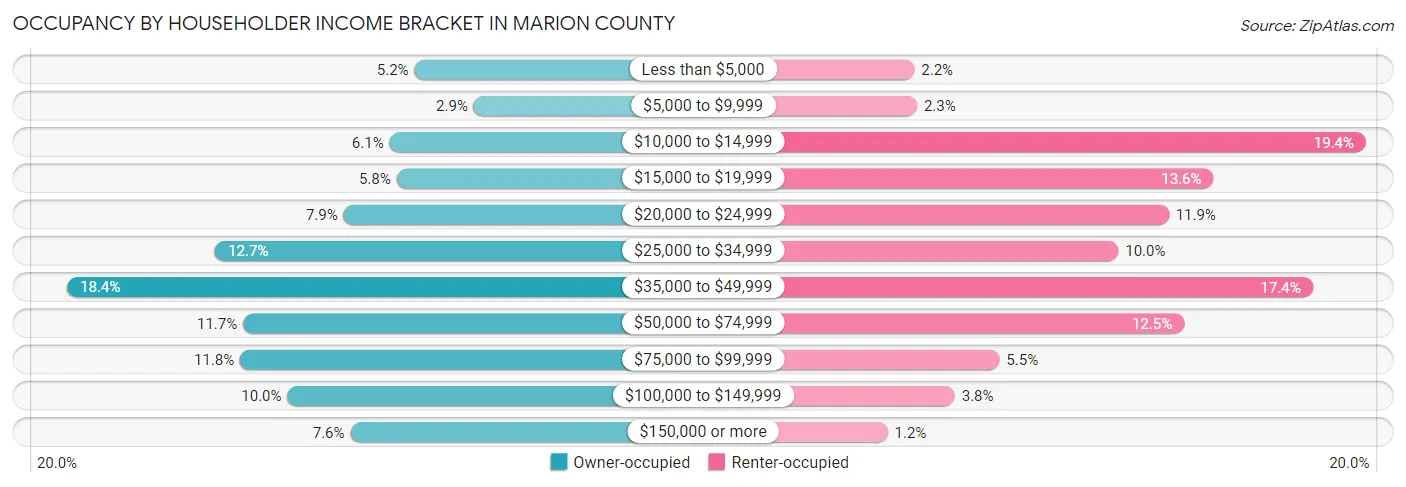
| Income Bracket | Owner-occupied | Renter-occupied |
| Less than $5,000 | 372 (5.1%) | 42 (2.2%) |
| $5,000 to $9,999 | 209 (2.9%) | 44 (2.3%) |
| $10,000 to $14,999 | 441 (6.1%) | 365 (19.4%) |
| $15,000 to $19,999 | 421 (5.8%) | 256 (13.6%) |
| $20,000 to $24,999 | 567 (7.9%) | 224 (11.9%) |
| $25,000 to $34,999 | 920 (12.7%) | 188 (10.0%) |
| $35,000 to $49,999 | 1,328 (18.4%) | 327 (17.4%) |
| $50,000 to $74,999 | 844 (11.7%) | 235 (12.5%) |
| $75,000 to $99,999 | 852 (11.8%) | 103 (5.5%) |
| $100,000 to $149,999 | 722 (10.0%) | 71 (3.8%) |
| $150,000 or more | 548 (7.6%) | 23 (1.2%) |
| Total | 7,224 (100.0%) | 1,878 (100.0%) |
Monthly Housing Cost Tiers in Marion County
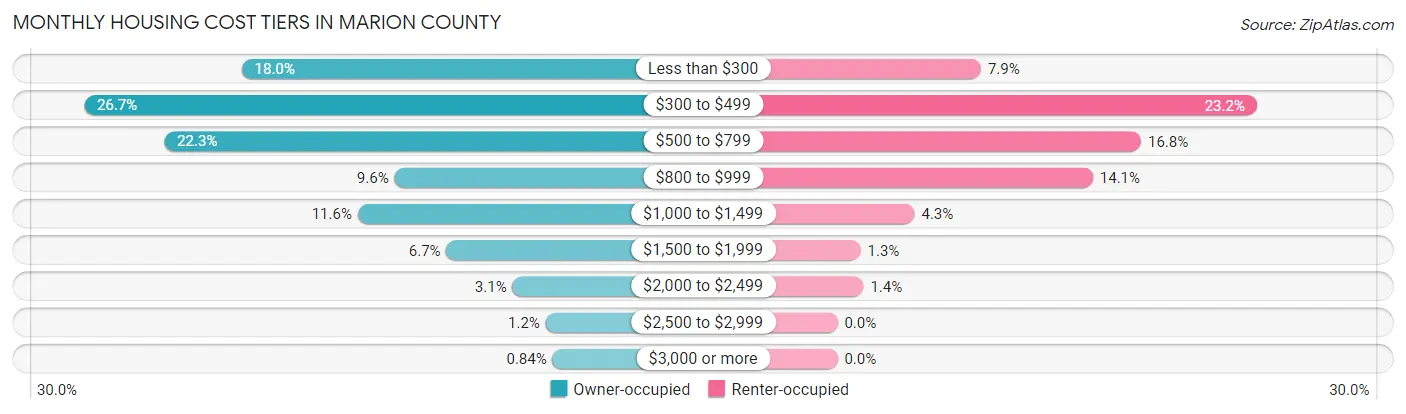
| Monthly Cost | Owner-occupied | Renter-occupied |
| Less than $300 | 1,301 (18.0%) | 149 (7.9%) |
| $300 to $499 | 1,930 (26.7%) | 435 (23.2%) |
| $500 to $799 | 1,611 (22.3%) | 315 (16.8%) |
| $800 to $999 | 691 (9.6%) | 265 (14.1%) |
| $1,000 to $1,499 | 838 (11.6%) | 80 (4.3%) |
| $1,500 to $1,999 | 484 (6.7%) | 24 (1.3%) |
| $2,000 to $2,499 | 220 (3.0%) | 27 (1.4%) |
| $2,500 to $2,999 | 88 (1.2%) | 0 (0.0%) |
| $3,000 or more | 61 (0.8%) | 0 (0.0%) |
| Total | 7,224 (100.0%) | 1,878 (100.0%) |
Physical Housing Characteristics in Marion County
Housing Structures in Marion County
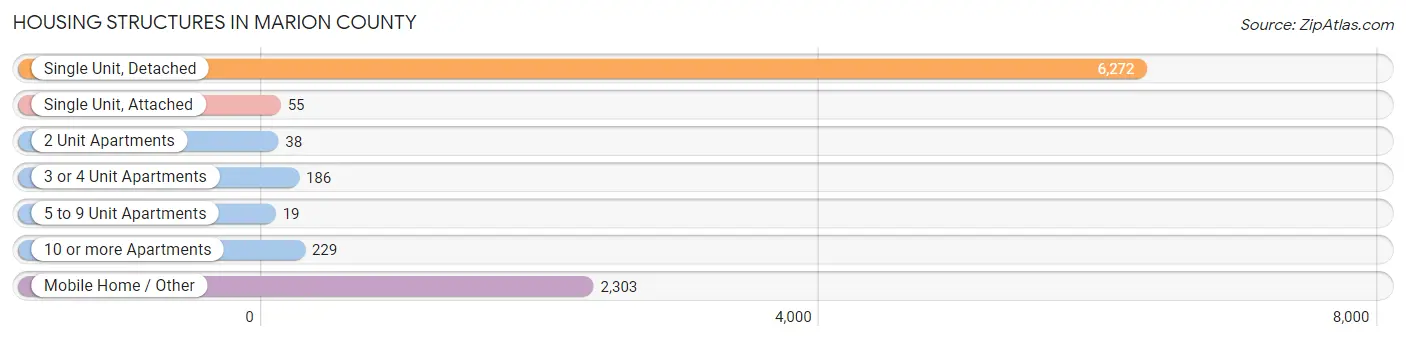
| Structure Type | # Housing Units | % Housing Units |
| Single Unit, Detached | 6,272 | 68.9% |
| Single Unit, Attached | 55 | 0.6% |
| 2 Unit Apartments | 38 | 0.4% |
| 3 or 4 Unit Apartments | 186 | 2.0% |
| 5 to 9 Unit Apartments | 19 | 0.2% |
| 10 or more Apartments | 229 | 2.5% |
| Mobile Home / Other | 2,303 | 25.3% |
| Total | 9,102 | 100.0% |
Housing Structures by Occupancy in Marion County
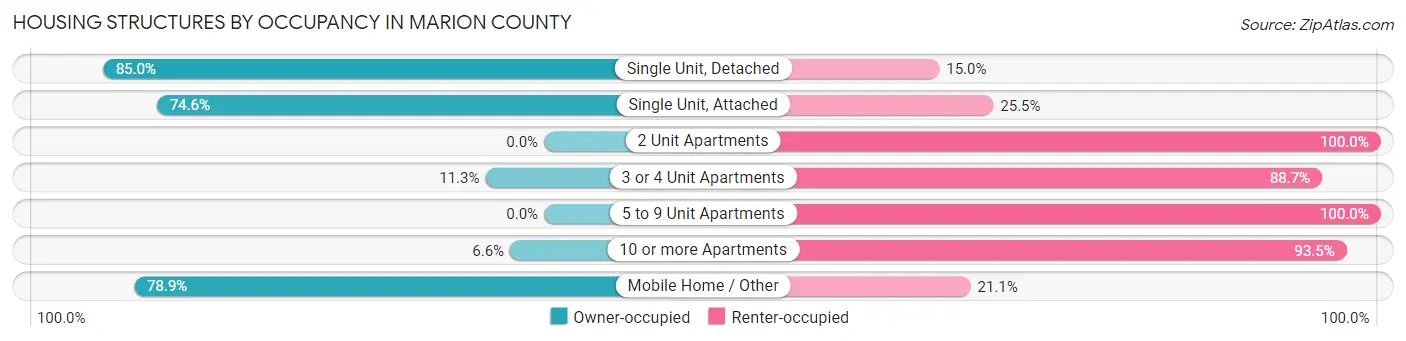
| Structure Type | Owner-occupied | Renter-occupied |
| Single Unit, Detached | 5,329 (85.0%) | 943 (15.0%) |
| Single Unit, Attached | 41 (74.6%) | 14 (25.5%) |
| 2 Unit Apartments | 0 (0.0%) | 38 (100.0%) |
| 3 or 4 Unit Apartments | 21 (11.3%) | 165 (88.7%) |
| 5 to 9 Unit Apartments | 0 (0.0%) | 19 (100.0%) |
| 10 or more Apartments | 15 (6.6%) | 214 (93.4%) |
| Mobile Home / Other | 1,818 (78.9%) | 485 (21.1%) |
| Total | 7,224 (79.4%) | 1,878 (20.6%) |
Housing Structures by Number of Rooms in Marion County
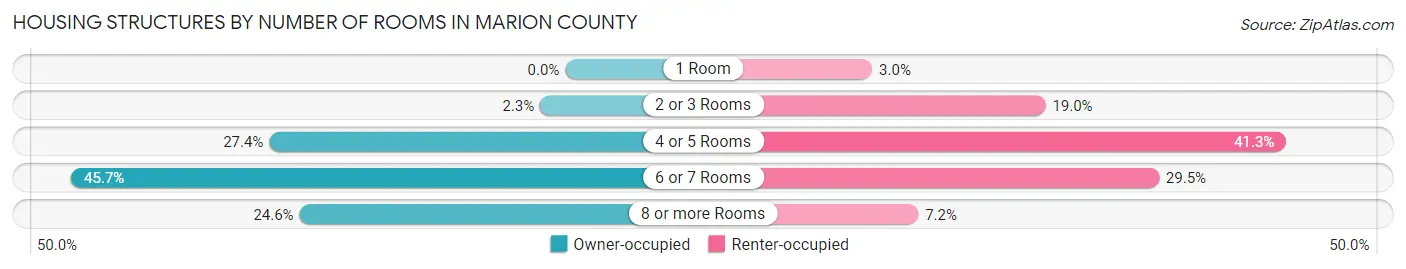
| Number of Rooms | Owner-occupied | Renter-occupied |
| 1 Room | 0 (0.0%) | 56 (3.0%) |
| 2 or 3 Rooms | 168 (2.3%) | 357 (19.0%) |
| 4 or 5 Rooms | 1,978 (27.4%) | 775 (41.3%) |
| 6 or 7 Rooms | 3,302 (45.7%) | 554 (29.5%) |
| 8 or more Rooms | 1,776 (24.6%) | 136 (7.2%) |
| Total | 7,224 (100.0%) | 1,878 (100.0%) |
Housing Structure by Heating Type in Marion County
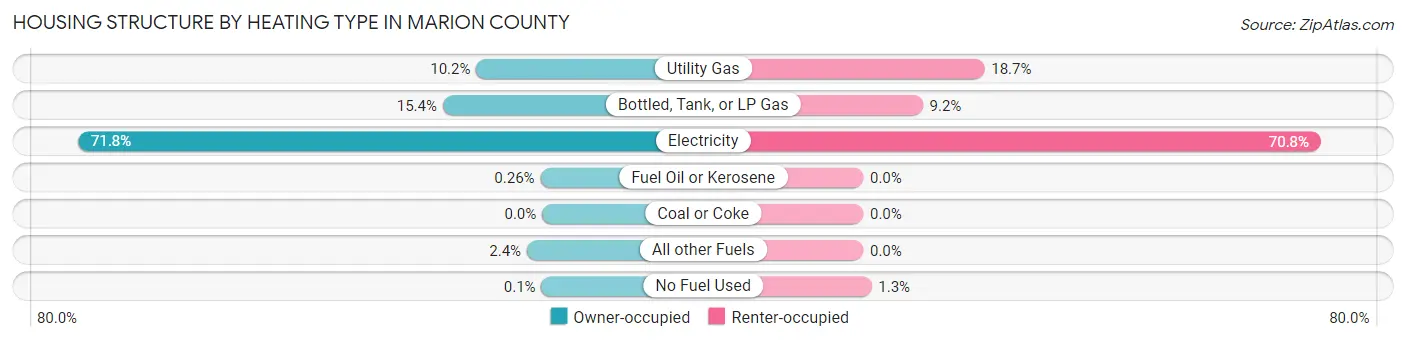
| Heating Type | Owner-occupied | Renter-occupied |
| Utility Gas | 735 (10.2%) | 352 (18.7%) |
| Bottled, Tank, or LP Gas | 1,109 (15.3%) | 173 (9.2%) |
| Electricity | 5,184 (71.8%) | 1,329 (70.8%) |
| Fuel Oil or Kerosene | 19 (0.3%) | 0 (0.0%) |
| Coal or Coke | 0 (0.0%) | 0 (0.0%) |
| All other Fuels | 170 (2.4%) | 0 (0.0%) |
| No Fuel Used | 7 (0.1%) | 24 (1.3%) |
| Total | 7,224 (100.0%) | 1,878 (100.0%) |
Household Vehicle Usage in Marion County
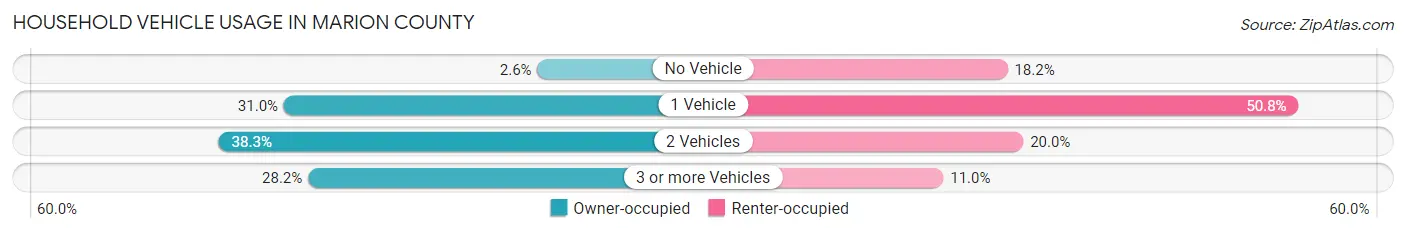
| Vehicles per Household | Owner-occupied | Renter-occupied |
| No Vehicle | 184 (2.5%) | 342 (18.2%) |
| 1 Vehicle | 2,236 (30.9%) | 954 (50.8%) |
| 2 Vehicles | 2,764 (38.3%) | 375 (20.0%) |
| 3 or more Vehicles | 2,040 (28.2%) | 207 (11.0%) |
| Total | 7,224 (100.0%) | 1,878 (100.0%) |
Real Estate & Mortgages in Marion County
Real Estate and Mortgage Overview in Marion County
| Characteristic | Without Mortgage | With Mortgage |
| Housing Units | 4,495 | 2,729 |
| Median Property Value | $82,500 | $132,500 |
| Median Household Income | $33,837 | $388 |
| Monthly Housing Costs | $378 | $61 |
| Real Estate Taxes | $621 | $535 |
Property Value by Mortgage Status in Marion County
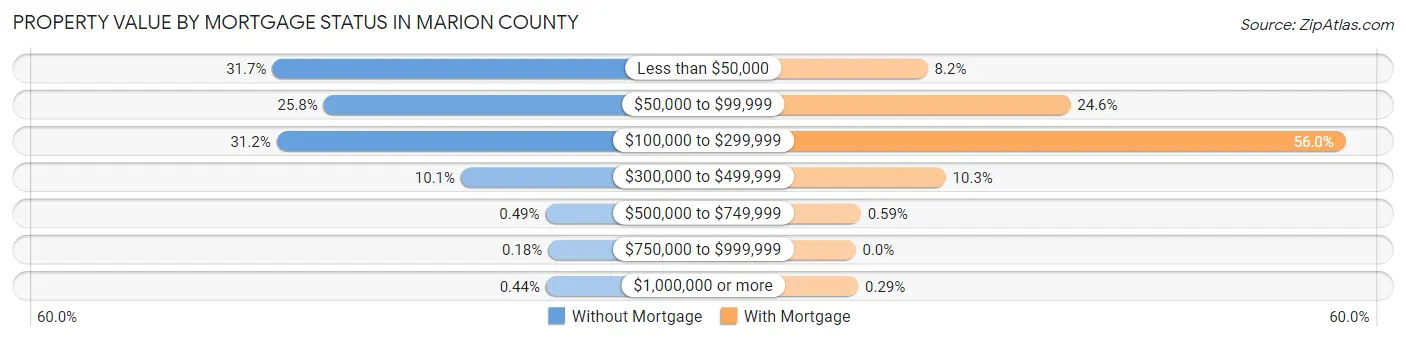
| Property Value | Without Mortgage | With Mortgage |
| Less than $50,000 | 1,425 (31.7%) | 225 (8.2%) |
| $50,000 to $99,999 | 1,161 (25.8%) | 670 (24.5%) |
| $100,000 to $299,999 | 1,403 (31.2%) | 1,529 (56.0%) |
| $300,000 to $499,999 | 456 (10.1%) | 281 (10.3%) |
| $500,000 to $749,999 | 22 (0.5%) | 16 (0.6%) |
| $750,000 to $999,999 | 8 (0.2%) | 0 (0.0%) |
| $1,000,000 or more | 20 (0.4%) | 8 (0.3%) |
| Total | 4,495 (100.0%) | 2,729 (100.0%) |
Household Income by Mortgage Status in Marion County
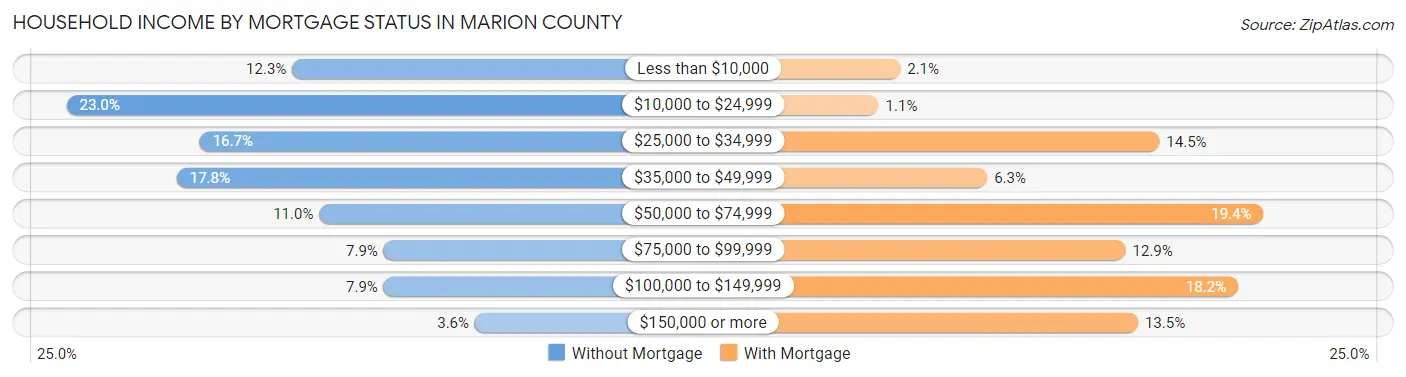
| Household Income | Without Mortgage | With Mortgage |
| Less than $10,000 | 551 (12.3%) | 58 (2.1%) |
| $10,000 to $24,999 | 1,034 (23.0%) | 30 (1.1%) |
| $25,000 to $34,999 | 749 (16.7%) | 395 (14.5%) |
| $35,000 to $49,999 | 798 (17.7%) | 171 (6.3%) |
| $50,000 to $74,999 | 493 (11.0%) | 530 (19.4%) |
| $75,000 to $99,999 | 355 (7.9%) | 351 (12.9%) |
| $100,000 to $149,999 | 355 (7.9%) | 497 (18.2%) |
| $150,000 or more | 160 (3.6%) | 367 (13.5%) |
| Total | 4,495 (100.0%) | 2,729 (100.0%) |
Property Value to Household Income Ratio in Marion County
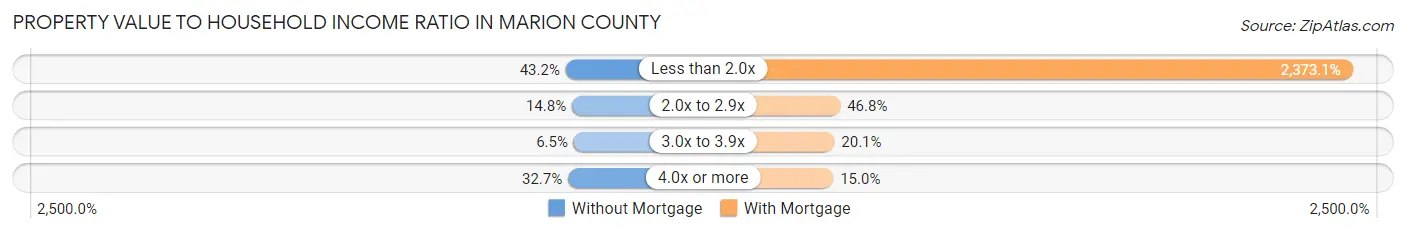
| Value-to-Income Ratio | Without Mortgage | With Mortgage |
| Less than 2.0x | 1,940 (43.2%) | 64,761 (2,373.1%) |
| 2.0x to 2.9x | 665 (14.8%) | 1,277 (46.8%) |
| 3.0x to 3.9x | 290 (6.5%) | 548 (20.1%) |
| 4.0x or more | 1,470 (32.7%) | 410 (15.0%) |
| Total | 4,495 (100.0%) | 2,729 (100.0%) |
Real Estate Taxes by Mortgage Status in Marion County
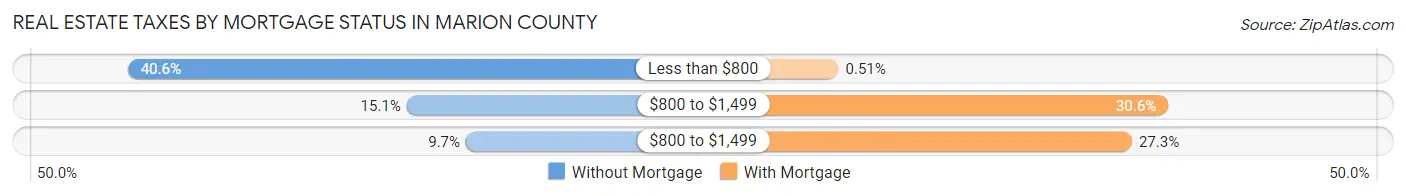
| Property Taxes | Without Mortgage | With Mortgage |
| Less than $800 | 1,824 (40.6%) | 14 (0.5%) |
| $800 to $1,499 | 679 (15.1%) | 835 (30.6%) |
| $800 to $1,499 | 436 (9.7%) | 745 (27.3%) |
| Total | 4,495 (100.0%) | 2,729 (100.0%) |
Health & Disability in Marion County
Health Insurance Coverage by Age in Marion County
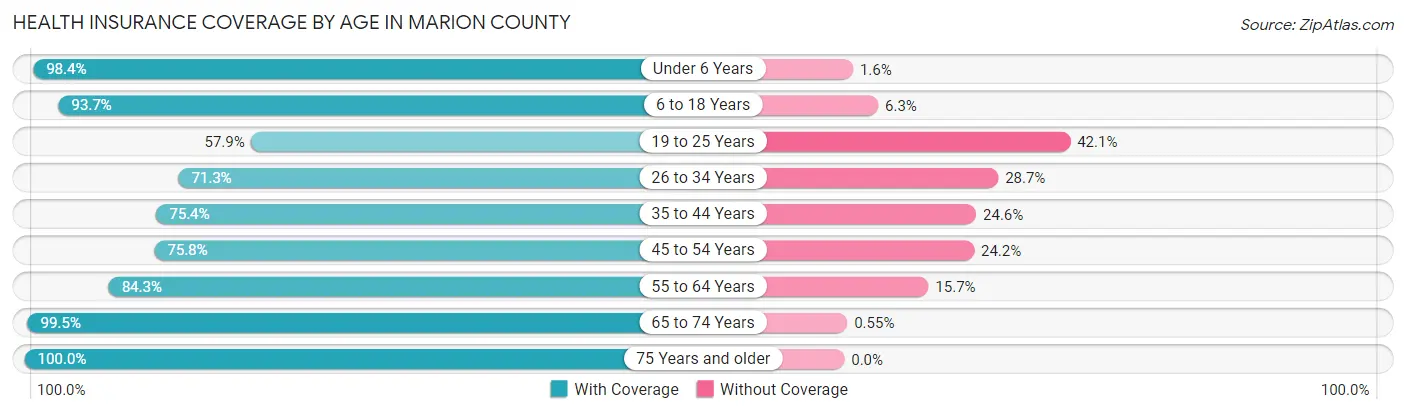
| Age Bracket | With Coverage | Without Coverage |
| Under 6 Years | 1,637 (98.4%) | 27 (1.6%) |
| 6 to 18 Years | 4,128 (93.7%) | 278 (6.3%) |
| 19 to 25 Years | 1,041 (57.9%) | 758 (42.1%) |
| 26 to 34 Years | 1,761 (71.3%) | 709 (28.7%) |
| 35 to 44 Years | 2,252 (75.4%) | 734 (24.6%) |
| 45 to 54 Years | 2,130 (75.8%) | 680 (24.2%) |
| 55 to 64 Years | 2,677 (84.3%) | 498 (15.7%) |
| 65 to 74 Years | 2,707 (99.5%) | 15 (0.5%) |
| 75 Years and older | 1,587 (100.0%) | 0 (0.0%) |
| Total | 19,920 (84.3%) | 3,699 (15.7%) |
Health Insurance Coverage by Citizenship Status in Marion County

| Citizenship Status | With Coverage | Without Coverage |
| Native Born | 1,637 (98.4%) | 27 (1.6%) |
| Foreign Born, Citizen | 4,128 (93.7%) | 278 (6.3%) |
| Foreign Born, not a Citizen | 1,041 (57.9%) | 758 (42.1%) |
Health Insurance Coverage by Household Income in Marion County
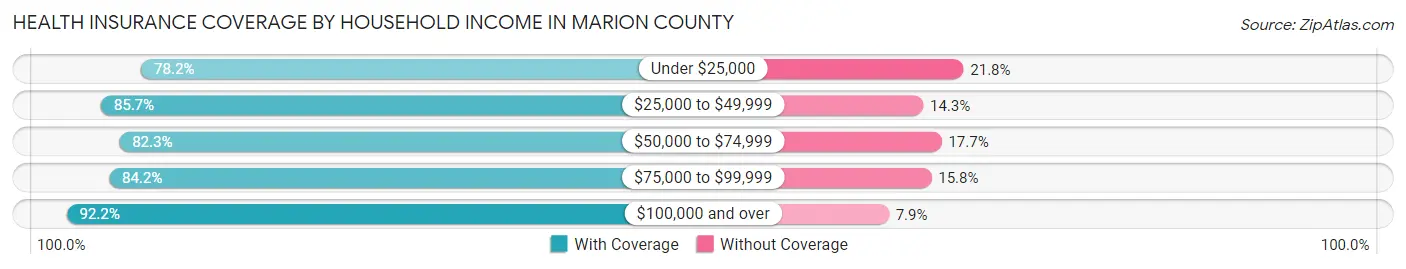
| Household Income | With Coverage | Without Coverage |
| Under $25,000 | 4,376 (78.2%) | 1,223 (21.8%) |
| $25,000 to $49,999 | 6,105 (85.7%) | 1,018 (14.3%) |
| $50,000 to $74,999 | 2,945 (82.3%) | 635 (17.7%) |
| $75,000 to $99,999 | 2,626 (84.2%) | 494 (15.8%) |
| $100,000 and over | 3,849 (92.1%) | 328 (7.9%) |
Public vs Private Health Insurance Coverage by Age in Marion County
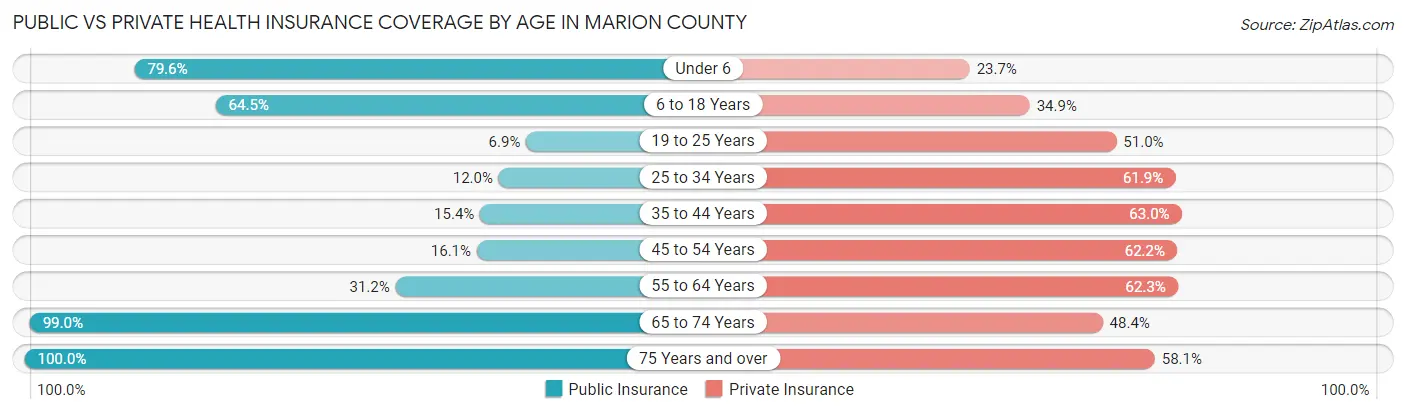
| Age Bracket | Public Insurance | Private Insurance |
| Under 6 | 1,325 (79.6%) | 395 (23.7%) |
| 6 to 18 Years | 2,843 (64.5%) | 1,537 (34.9%) |
| 19 to 25 Years | 124 (6.9%) | 917 (51.0%) |
| 25 to 34 Years | 296 (12.0%) | 1,528 (61.9%) |
| 35 to 44 Years | 461 (15.4%) | 1,882 (63.0%) |
| 45 to 54 Years | 451 (16.1%) | 1,747 (62.2%) |
| 55 to 64 Years | 989 (31.1%) | 1,979 (62.3%) |
| 65 to 74 Years | 2,696 (99.0%) | 1,318 (48.4%) |
| 75 Years and over | 1,587 (100.0%) | 922 (58.1%) |
| Total | 10,772 (45.6%) | 12,225 (51.8%) |
Disability Status by Sex by Age in Marion County
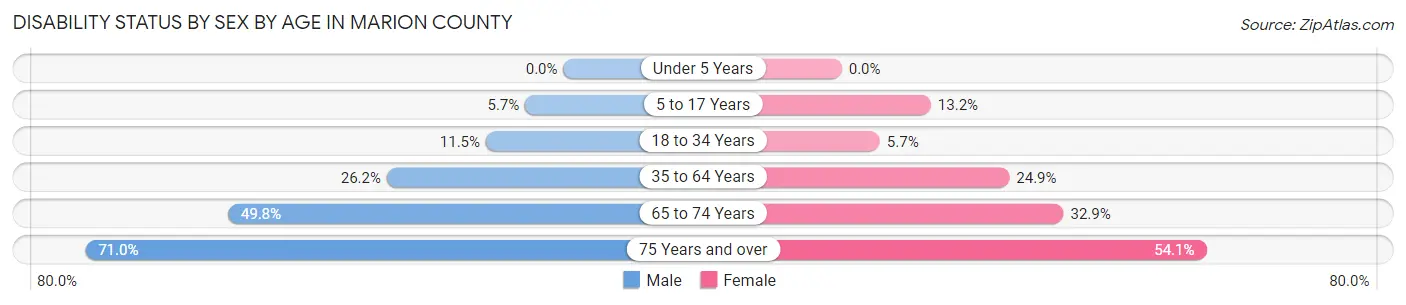
| Age Bracket | Male | Female |
| Under 5 Years | 0 (0.0%) | 0 (0.0%) |
| 5 to 17 Years | 114 (5.7%) | 297 (13.2%) |
| 18 to 34 Years | 245 (11.5%) | 143 (5.7%) |
| 35 to 64 Years | 1,177 (26.2%) | 1,115 (24.9%) |
| 65 to 74 Years | 660 (49.8%) | 460 (32.9%) |
| 75 Years and over | 421 (71.0%) | 538 (54.1%) |
Disability Class by Sex by Age in Marion County
Disability Class: Hearing Difficulty
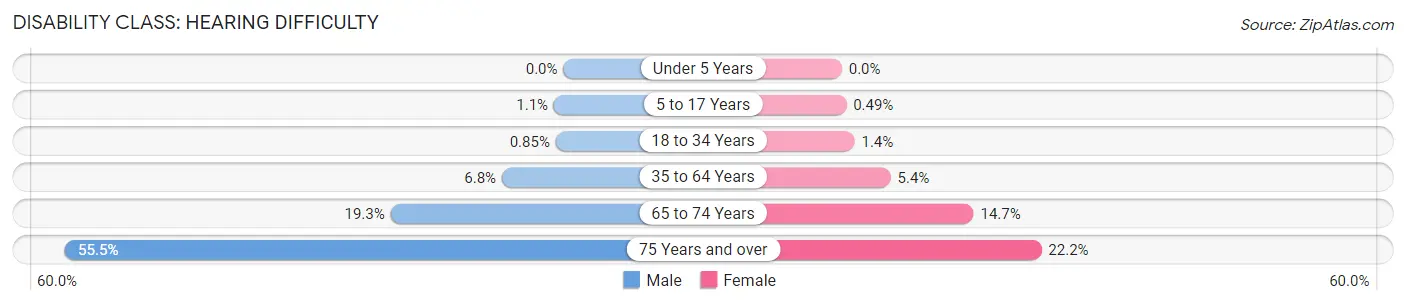
| Age Bracket | Male | Female |
| Under 5 Years | 0 (0.0%) | 0 (0.0%) |
| 5 to 17 Years | 21 (1.1%) | 11 (0.5%) |
| 18 to 34 Years | 18 (0.9%) | 36 (1.4%) |
| 35 to 64 Years | 307 (6.8%) | 244 (5.4%) |
| 65 to 74 Years | 255 (19.3%) | 205 (14.7%) |
| 75 Years and over | 329 (55.5%) | 221 (22.2%) |
Disability Class: Vision Difficulty
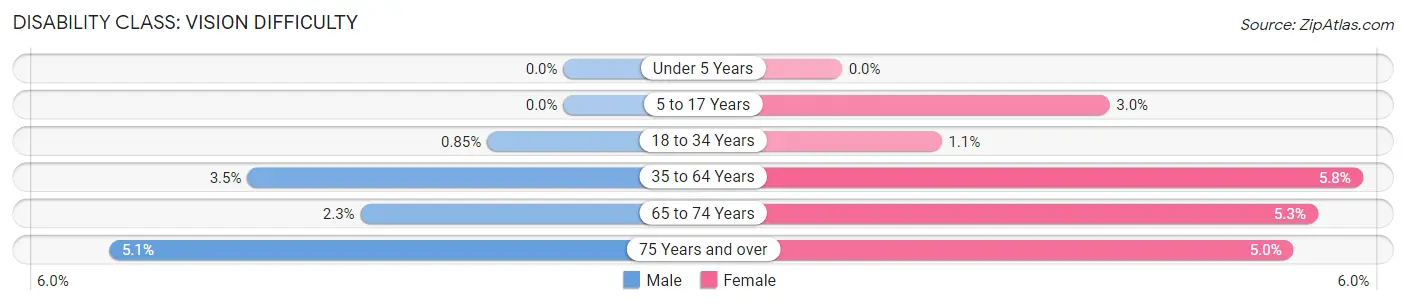
| Age Bracket | Male | Female |
| Under 5 Years | 0 (0.0%) | 0 (0.0%) |
| 5 to 17 Years | 0 (0.0%) | 67 (3.0%) |
| 18 to 34 Years | 18 (0.9%) | 28 (1.1%) |
| 35 to 64 Years | 158 (3.5%) | 260 (5.8%) |
| 65 to 74 Years | 30 (2.3%) | 74 (5.3%) |
| 75 Years and over | 30 (5.1%) | 50 (5.0%) |
Disability Class: Cognitive Difficulty
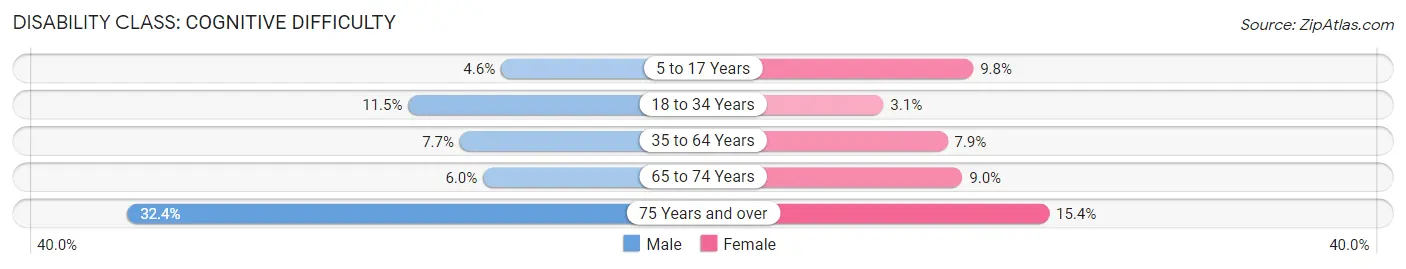
| Age Bracket | Male | Female |
| 5 to 17 Years | 93 (4.6%) | 219 (9.8%) |
| 18 to 34 Years | 245 (11.5%) | 78 (3.1%) |
| 35 to 64 Years | 345 (7.7%) | 352 (7.9%) |
| 65 to 74 Years | 79 (6.0%) | 125 (8.9%) |
| 75 Years and over | 192 (32.4%) | 153 (15.4%) |
Disability Class: Ambulatory Difficulty
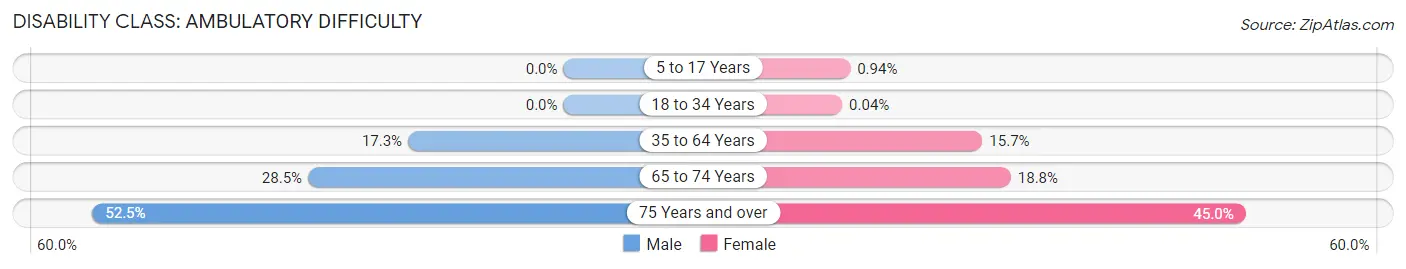
| Age Bracket | Male | Female |
| 5 to 17 Years | 0 (0.0%) | 21 (0.9%) |
| 18 to 34 Years | 0 (0.0%) | 1 (0.0%) |
| 35 to 64 Years | 777 (17.3%) | 702 (15.7%) |
| 65 to 74 Years | 377 (28.4%) | 263 (18.8%) |
| 75 Years and over | 311 (52.4%) | 447 (45.0%) |
Disability Class: Self-Care Difficulty
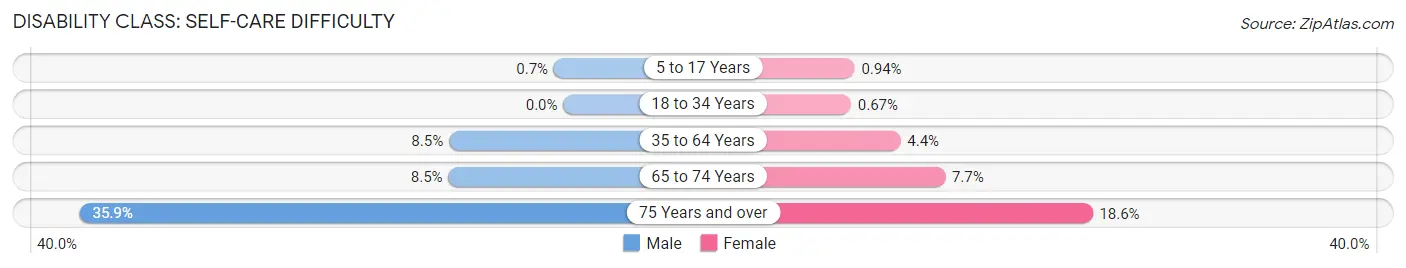
| Age Bracket | Male | Female |
| 5 to 17 Years | 14 (0.7%) | 21 (0.9%) |
| 18 to 34 Years | 0 (0.0%) | 17 (0.7%) |
| 35 to 64 Years | 381 (8.5%) | 195 (4.3%) |
| 65 to 74 Years | 113 (8.5%) | 107 (7.7%) |
| 75 Years and over | 213 (35.9%) | 185 (18.6%) |
Technology Access in Marion County
Computing Device Access in Marion County
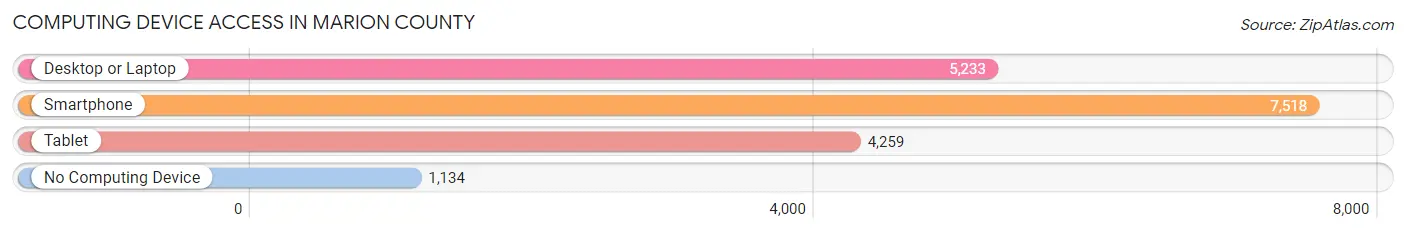
| Device Type | # Households | % Households |
| Desktop or Laptop | 5,233 | 57.5% |
| Smartphone | 7,518 | 82.6% |
| Tablet | 4,259 | 46.8% |
| No Computing Device | 1,134 | 12.5% |
| Total | 9,102 | 100.0% |
Internet Access in Marion County
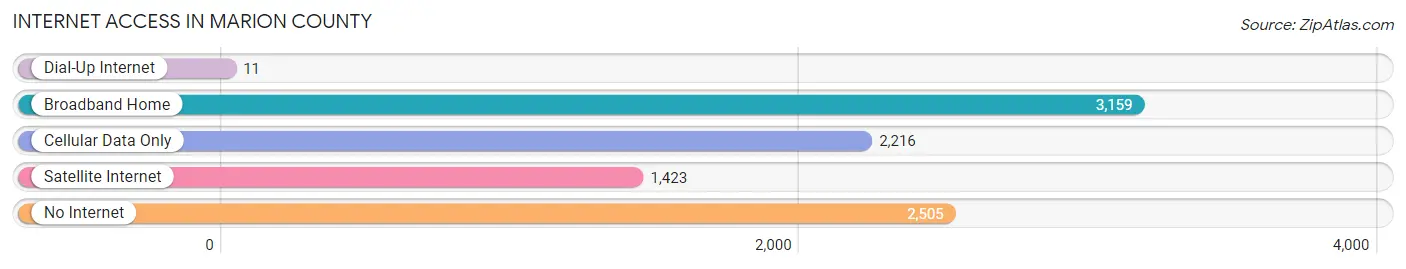
| Internet Type | # Households | % Households |
| Dial-Up Internet | 11 | 0.1% |
| Broadband Home | 3,159 | 34.7% |
| Cellular Data Only | 2,216 | 24.3% |
| Satellite Internet | 1,423 | 15.6% |
| No Internet | 2,505 | 27.5% |
| Total | 9,102 | 100.0% |
Marion County Summary
Marion County, Mississippi is located in the southeastern corner of the state, bordered by the states of Alabama and Louisiana. It is part of the Hattiesburg, MS Metropolitan Statistical Area. The county seat is Columbia, and the population was 27,476 at the 2010 census.
History
Marion County was established in 1811, and was named for General Francis Marion, a Revolutionary War hero. The county was originally part of the Choctaw Nation, and was later part of the Mississippi Territory. The county was divided into two parts in 1820, with the western part becoming Lamar County.
Geography
Marion County is located in the southeastern corner of Mississippi, and is bordered by the states of Alabama and Louisiana. It is part of the Hattiesburg, MS Metropolitan Statistical Area. The county has a total area of 590 square miles, of which 587 square miles is land and 3 square miles (0.5%) is water. The county is mostly flat, with some rolling hills in the northern part. The Pearl River forms the western border of the county.
Economy
Marion County has a diverse economy, with a mix of agriculture, manufacturing, and services. The county is home to several large manufacturing companies, including International Paper, Georgia-Pacific, and Tyson Foods. Agriculture is also an important part of the economy, with crops such as cotton, soybeans, corn, and wheat being grown in the county. The county also has a thriving tourism industry, with attractions such as the Marion County Historical Museum, the Marion County Fair, and the Marion County Arts Council.
Demographics
As of the 2010 census, there were 27,476 people, 10,717 households, and 7,541 families residing in the county. The population density was 46.7 people per square mile. The racial makeup of the county was 68.3% White, 28.7% African American, 0.3% Native American, 0.3% Asian, 0.1% Pacific Islander, 0.7% from other races, and 1.6% from two or more races. Hispanic or Latino of any race were 2.2% of the population.
The median income for a household in the county was $31,945, and the median income for a family was $39,945. The per capita income for the county was $17,845. About 19.2% of families and 23.2% of the population were below the poverty line, including 33.2% of those under age 18 and 17.2% of those age 65 or over.
Marion County is a rural county with a diverse economy and a rich history. It is home to several large manufacturing companies, as well as a thriving agricultural industry. The county also has a thriving tourism industry, with attractions such as the Marion County Historical Museum, the Marion County Fair, and the Marion County Arts Council. The population of the county is diverse, with a mix of races and ethnicities. The median income for a household in the county is lower than the state average, but the per capita income is slightly higher.
Common Questions
What is Per Capita Income in Marion County?
Per Capita income in Marion County is $23,055.
What is the Median Family Income in Marion County?
Median Family Income in Marion County is $49,144.
What is the Median Household income in Marion County?
Median Household Income in Marion County is $38,399.
What is Income or Wage Gap in Marion County?
Income or Wage Gap in Marion County is 39.0%.
Women in Marion County earn 61.0 cents for every dollar earned by a man.
What is Family Income Deficit in Marion County?
Family Income Deficit in Marion County is $10,045.
Families that are below poverty line in Marion County earn $10,045 less on average than the poverty threshold level.
What is Inequality or Gini Index in Marion County?
Inequality or Gini Index in Marion County is 0.49.
What is the Total Population of Marion County?
Total Population of Marion County is 24,362.
What is the Total Male Population of Marion County?
Total Male Population of Marion County is 11,794.
What is the Total Female Population of Marion County?
Total Female Population of Marion County is 12,568.
What is the Ratio of Males per 100 Females in Marion County?
There are 93.84 Males per 100 Females in Marion County.
What is the Ratio of Females per 100 Males in Marion County?
There are 106.56 Females per 100 Males in Marion County.
What is the Median Population Age in Marion County?
Median Population Age in Marion County is 40.3 Years.
What is the Average Family Size in Marion County
Average Family Size in Marion County is 3.4 People.
What is the Average Household Size in Marion County
Average Household Size in Marion County is 2.6 People.
How Large is the Labor Force in Marion County?
There are 9,933 People in the Labor Forcein in Marion County.
What is the Percentage of People in the Labor Force in Marion County?
51.5% of People are in the Labor Force in Marion County.
What is the Unemployment Rate in Marion County?
Unemployment Rate in Marion County is 9.5%.