Leflore County, MS Map & Demographics
Leflore County Map
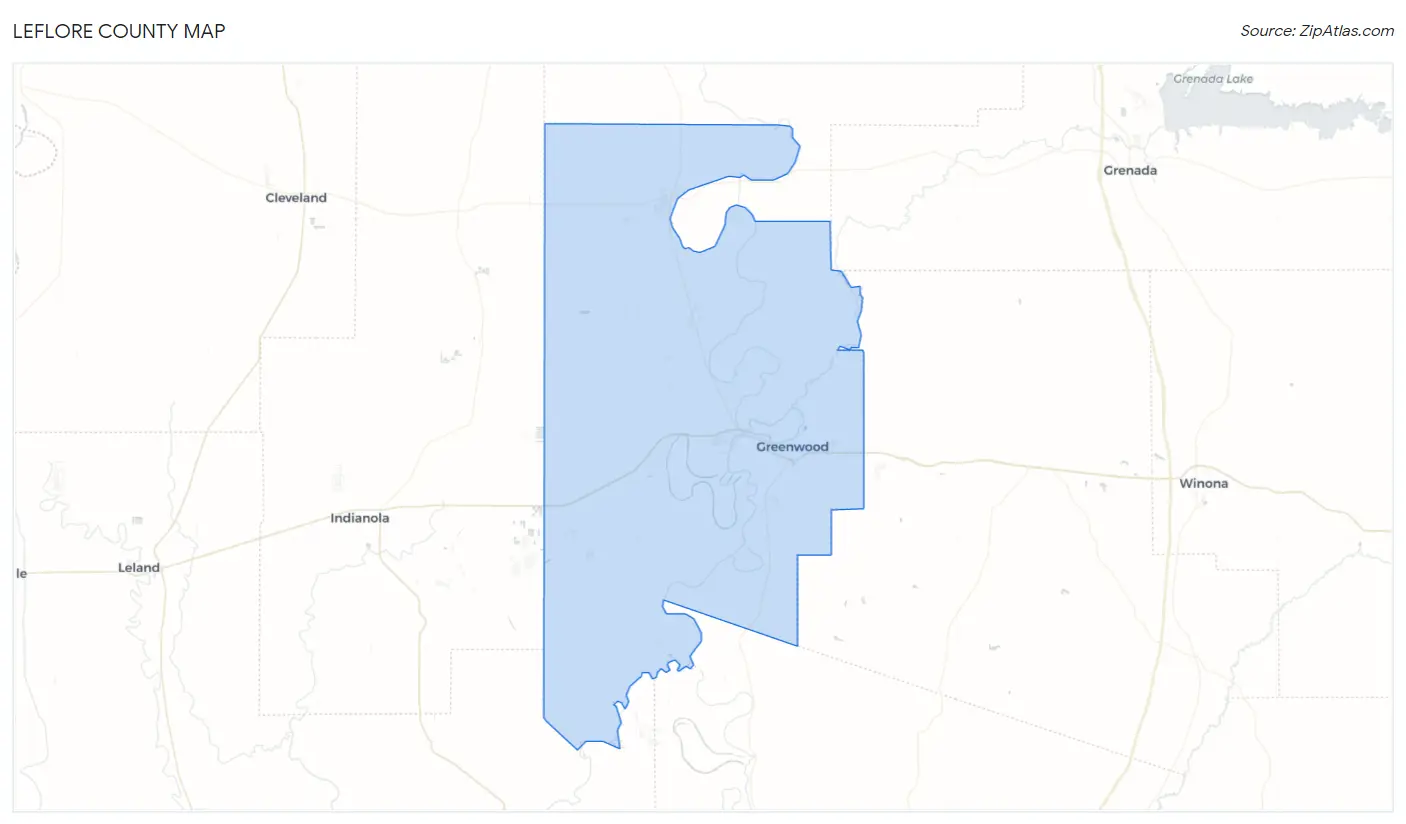
Leflore County Overview
$23,281
PER CAPITA INCOME
$40,600
AVG FAMILY INCOME
$33,115
AVG HOUSEHOLD INCOME
20.9%
WAGE / INCOME GAP [ % ]
79.1¢/ $1
WAGE / INCOME GAP [ $ ]
$12,650
FAMILY INCOME DEFICIT
0.57
INEQUALITY / GINI INDEX
27,920
TOTAL POPULATION
13,124
MALE POPULATION
14,796
FEMALE POPULATION
88.70
MALES / 100 FEMALES
112.74
FEMALES / 100 MALES
34.4
MEDIAN AGE
3.8
AVG FAMILY SIZE
2.8
AVG HOUSEHOLD SIZE
11,726
LABOR FORCE [ PEOPLE ]
56.1%
PERCENT IN LABOR FORCE
11.8%
UNEMPLOYMENT RATE
Leflore County Area Codes
Income in Leflore County
Income Overview in Leflore County
Per Capita Income in Leflore County is $23,281, while median incomes of families and households are $40,600 and $33,115 respectively.
| Characteristic | Number | Measure |
| Per Capita Income | 27,920 | $23,281 |
| Median Family Income | 5,736 | $40,600 |
| Mean Family Income | 5,736 | $76,925 |
| Median Household Income | 9,656 | $33,115 |
| Mean Household Income | 9,656 | $60,870 |
| Income Deficit | 5,736 | $12,650 |
| Wage / Income Gap (%) | 27,920 | 20.93% |
| Wage / Income Gap ($) | 27,920 | 79.07¢ per $1 |
| Gini / Inequality Index | 27,920 | 0.57 |
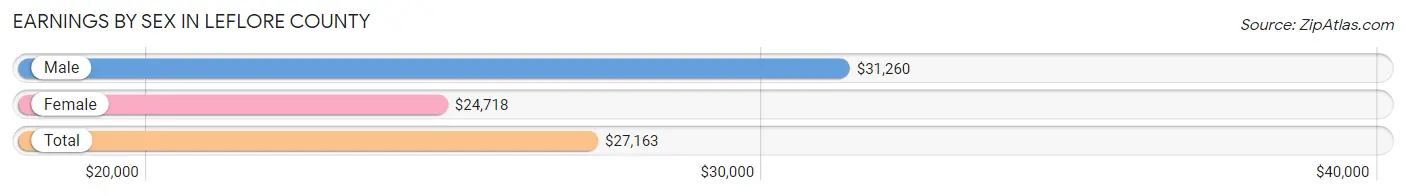
Earnings by Sex in Leflore County
Average Earnings in Leflore County are $27,163, $31,260 for men and $24,718 for women, a difference of 20.9%.
| Sex | Number | Average Earnings |
| Male | 5,383 (46.6%) | $31,260 |
| Female | 6,162 (53.4%) | $24,718 |
| Total | 11,545 (100.0%) | $27,163 |
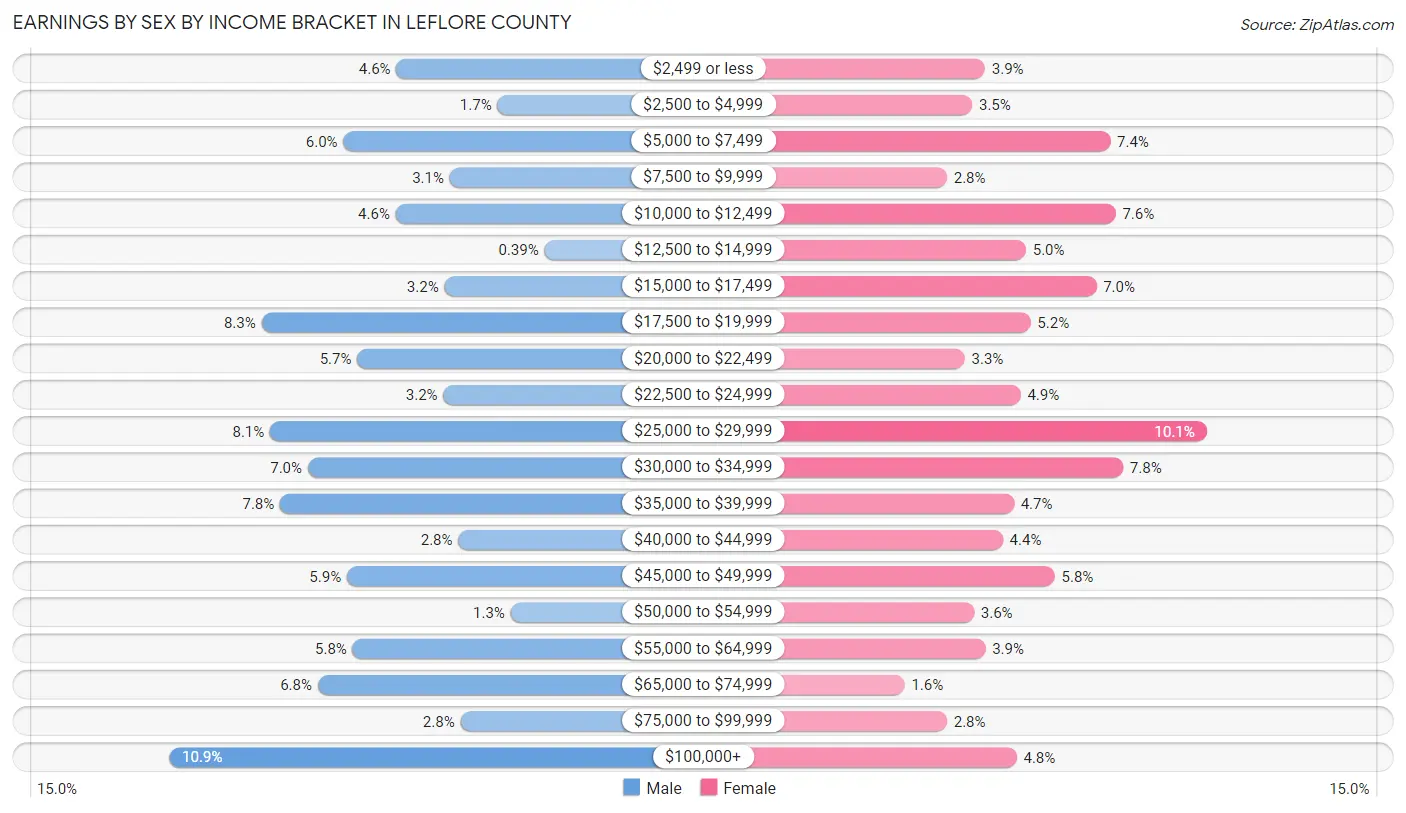
Earnings by Sex by Income Bracket in Leflore County
The most common earnings brackets in Leflore County are $100,000+ for men (589 | 10.9%) and $25,000 to $29,999 for women (623 | 10.1%).
| Income | Male | Female |
| $2,499 or less | 245 (4.5%) | 239 (3.9%) |
| $2,500 to $4,999 | 92 (1.7%) | 217 (3.5%) |
| $5,000 to $7,499 | 325 (6.0%) | 456 (7.4%) |
| $7,500 to $9,999 | 164 (3.0%) | 173 (2.8%) |
| $10,000 to $12,499 | 246 (4.6%) | 465 (7.5%) |
| $12,500 to $14,999 | 21 (0.4%) | 310 (5.0%) |
| $15,000 to $17,499 | 172 (3.2%) | 432 (7.0%) |
| $17,500 to $19,999 | 449 (8.3%) | 318 (5.2%) |
| $20,000 to $22,499 | 304 (5.7%) | 204 (3.3%) |
| $22,500 to $24,999 | 174 (3.2%) | 301 (4.9%) |
| $25,000 to $29,999 | 436 (8.1%) | 623 (10.1%) |
| $30,000 to $34,999 | 379 (7.0%) | 478 (7.8%) |
| $35,000 to $39,999 | 421 (7.8%) | 289 (4.7%) |
| $40,000 to $44,999 | 151 (2.8%) | 270 (4.4%) |
| $45,000 to $49,999 | 320 (5.9%) | 360 (5.8%) |
| $50,000 to $54,999 | 72 (1.3%) | 220 (3.6%) |
| $55,000 to $64,999 | 311 (5.8%) | 240 (3.9%) |
| $65,000 to $74,999 | 364 (6.8%) | 100 (1.6%) |
| $75,000 to $99,999 | 148 (2.8%) | 173 (2.8%) |
| $100,000+ | 589 (10.9%) | 294 (4.8%) |
| Total | 5,383 (100.0%) | 6,162 (100.0%) |
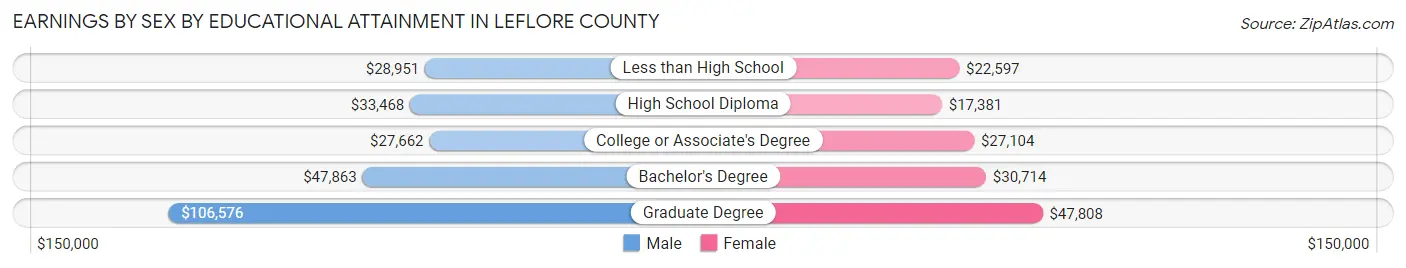
Earnings by Sex by Educational Attainment in Leflore County
Average earnings in Leflore County are $34,170 for men and $27,128 for women, a difference of 20.6%. Men with an educational attainment of graduate degree enjoy the highest average annual earnings of $106,576, while those with college or associate's degree education earn the least with $27,662. Women with an educational attainment of graduate degree earn the most with the average annual earnings of $47,808, while those with high school diploma education have the smallest earnings of $17,381.
| Educational Attainment | Male Income | Female Income |
| Less than High School | $28,951 | $22,597 |
| High School Diploma | $33,468 | $17,381 |
| College or Associate's Degree | $27,662 | $27,104 |
| Bachelor's Degree | $47,863 | $30,714 |
| Graduate Degree | $106,576 | $47,808 |
| Total | $34,170 | $27,128 |
Family Income in Leflore County
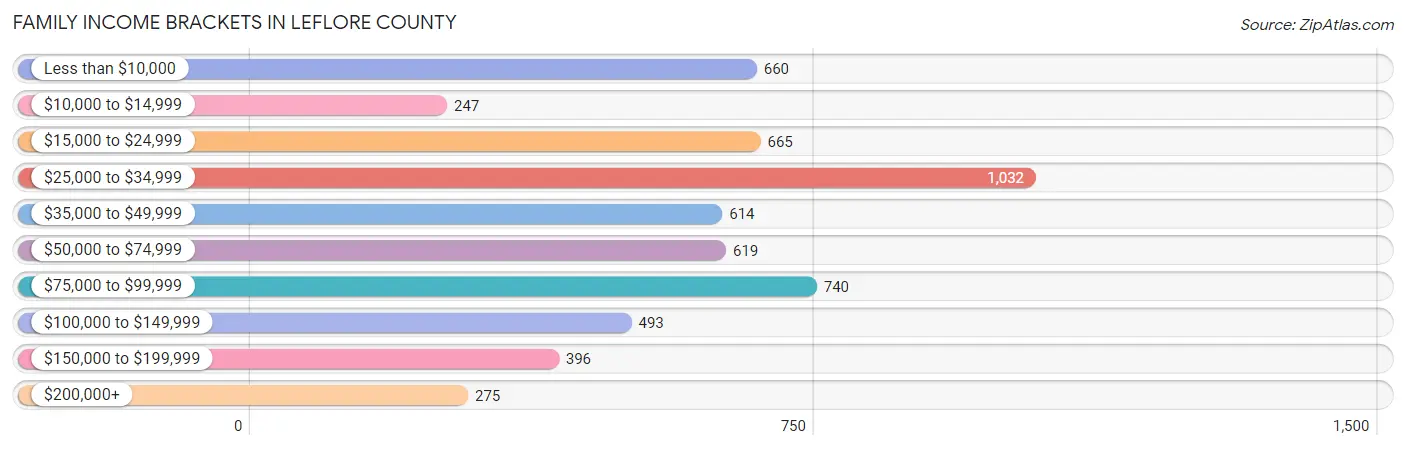
Family Income Brackets in Leflore County
According to the Leflore County family income data, there are 1,032 families falling into the $25,000 to $34,999 income range, which is the most common income bracket and makes up 18.0% of all families. Conversely, the $10,000 to $14,999 income bracket is the least frequent group with only 247 families (4.3%) belonging to this category.
| Income Bracket | # Families | % Families |
| Less than $10,000 | 660 | 11.5% |
| $10,000 to $14,999 | 247 | 4.3% |
| $15,000 to $24,999 | 665 | 11.6% |
| $25,000 to $34,999 | 1,032 | 18.0% |
| $35,000 to $49,999 | 614 | 10.7% |
| $50,000 to $74,999 | 619 | 10.8% |
| $75,000 to $99,999 | 740 | 12.9% |
| $100,000 to $149,999 | 493 | 8.6% |
| $150,000 to $199,999 | 396 | 6.9% |
| $200,000+ | 275 | 4.8% |
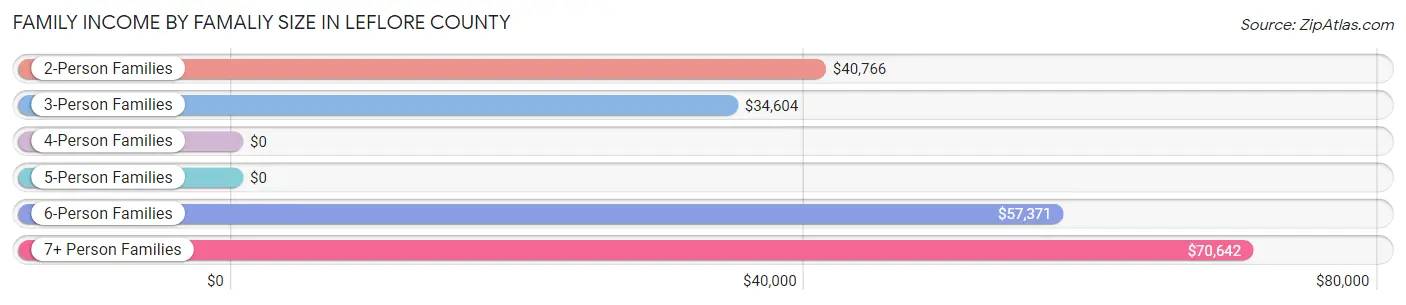
Family Income by Famaliy Size in Leflore County
7+ person families (131 | 2.3%) account for the highest median family income in Leflore County with $70,642 per family, while 2-person families (2,714 | 47.3%) have the highest median income of $20,383 per family member.
| Income Bracket | # Families | Median Income |
| 2-Person Families | 2,714 (47.3%) | $40,766 |
| 3-Person Families | 1,331 (23.2%) | $34,604 |
| 4-Person Families | 1,070 (18.6%) | $0 |
| 5-Person Families | 417 (7.3%) | $0 |
| 6-Person Families | 73 (1.3%) | $57,371 |
| 7+ Person Families | 131 (2.3%) | $70,642 |
| Total | 5,736 (100.0%) | $40,600 |
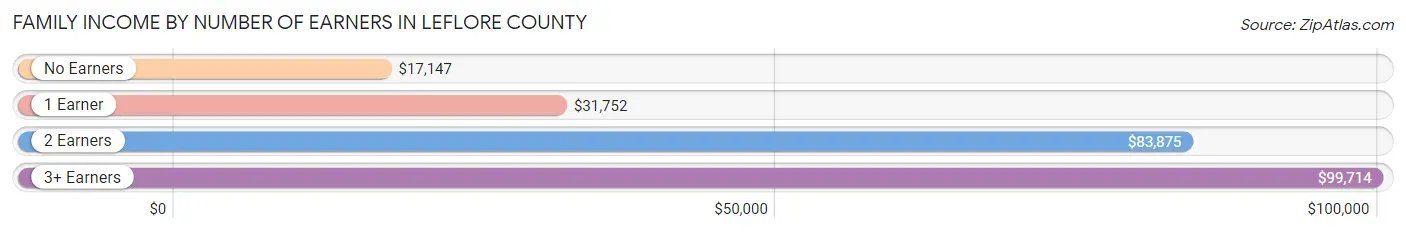
Family Income by Number of Earners in Leflore County
The median family income in Leflore County is $40,600, with families comprising 3+ earners (342) having the highest median family income of $99,714, while families with no earners (1,073) have the lowest median family income of $17,147, accounting for 6.0% and 18.7% of families, respectively.
| Number of Earners | # Families | Median Income |
| No Earners | 1,073 (18.7%) | $17,147 |
| 1 Earner | 2,407 (42.0%) | $31,752 |
| 2 Earners | 1,914 (33.4%) | $83,875 |
| 3+ Earners | 342 (6.0%) | $99,714 |
| Total | 5,736 (100.0%) | $40,600 |
Household Income in Leflore County
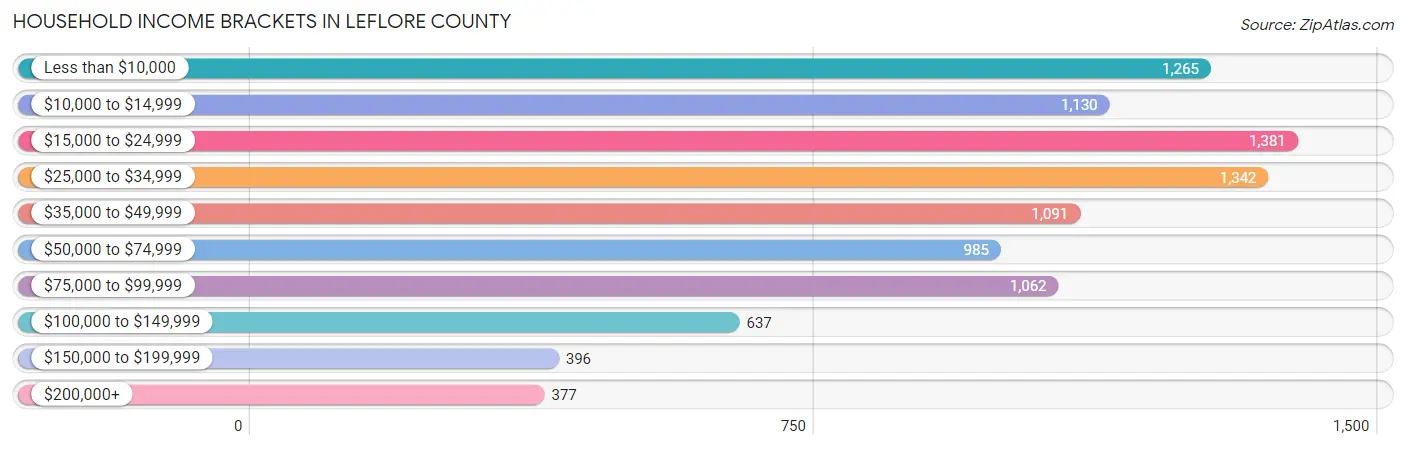
Household Income Brackets in Leflore County
With 1,381 households falling in the category, the $15,000 to $24,999 income range is the most frequent in Leflore County, accounting for 14.3% of all households. In contrast, only 377 households (3.9%) fall into the $200,000+ income bracket, making it the least populous group.
| Income Bracket | # Households | % Households |
| Less than $10,000 | 1,265 | 13.1% |
| $10,000 to $14,999 | 1,130 | 11.7% |
| $15,000 to $24,999 | 1,381 | 14.3% |
| $25,000 to $34,999 | 1,342 | 13.9% |
| $35,000 to $49,999 | 1,091 | 11.3% |
| $50,000 to $74,999 | 985 | 10.2% |
| $75,000 to $99,999 | 1,062 | 11.0% |
| $100,000 to $149,999 | 637 | 6.6% |
| $150,000 to $199,999 | 396 | 4.1% |
| $200,000+ | 377 | 3.9% |
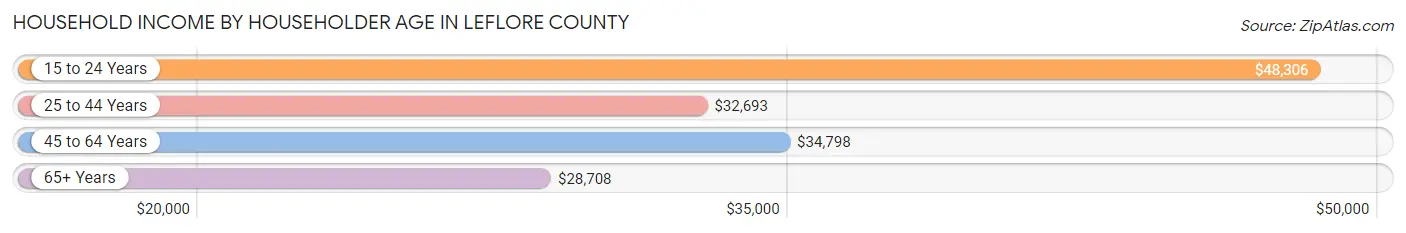
Household Income by Householder Age in Leflore County
The median household income in Leflore County is $33,115, with the highest median household income of $48,306 found in the 15 to 24 years age bracket for the primary householder. A total of 282 households (2.9%) fall into this category. Meanwhile, the 65+ years age bracket for the primary householder has the lowest median household income of $28,708, with 2,806 households (29.1%) in this group.
| Income Bracket | # Households | Median Income |
| 15 to 24 Years | 282 (2.9%) | $48,306 |
| 25 to 44 Years | 2,864 (29.7%) | $32,693 |
| 45 to 64 Years | 3,704 (38.4%) | $34,798 |
| 65+ Years | 2,806 (29.1%) | $28,708 |
| Total | 9,656 (100.0%) | $33,115 |
Poverty in Leflore County
Income Below Poverty by Sex and Age in Leflore County
With 29.1% poverty level for males and 34.8% for females among the residents of Leflore County, 15 year old males and 16 and 17 year old females are the most vulnerable to poverty, with 46 males (59.7%) and 138 females (72.6%) in their respective age groups living below the poverty level.
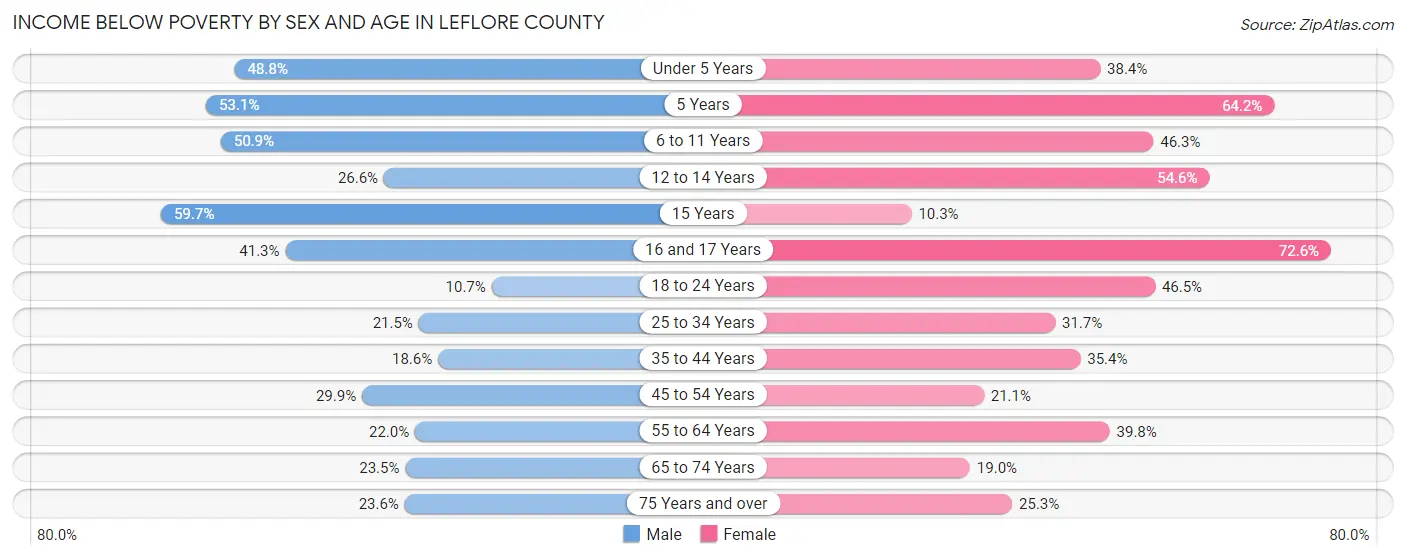
| Age Bracket | Male | Female |
| Under 5 Years | 501 (48.8%) | 374 (38.4%) |
| 5 Years | 130 (53.1%) | 113 (64.2%) |
| 6 to 11 Years | 653 (50.9%) | 581 (46.3%) |
| 12 to 14 Years | 162 (26.6%) | 371 (54.6%) |
| 15 Years | 46 (59.7%) | 37 (10.3%) |
| 16 and 17 Years | 225 (41.3%) | 138 (72.6%) |
| 18 to 24 Years | 96 (10.6%) | 578 (46.5%) |
| 25 to 34 Years | 377 (21.5%) | 621 (31.7%) |
| 35 to 44 Years | 258 (18.6%) | 633 (35.4%) |
| 45 to 54 Years | 403 (29.9%) | 344 (21.1%) |
| 55 to 64 Years | 320 (22.0%) | 721 (39.8%) |
| 65 to 74 Years | 234 (23.5%) | 260 (19.0%) |
| 75 Years and over | 106 (23.6%) | 242 (25.3%) |
| Total | 3,511 (29.1%) | 5,013 (34.8%) |
Income Above Poverty by Sex and Age in Leflore County
According to the poverty statistics in Leflore County, males aged 18 to 24 years and females aged 15 years are the age groups that are most secure financially, with 89.3% of males and 89.7% of females in these age groups living above the poverty line.
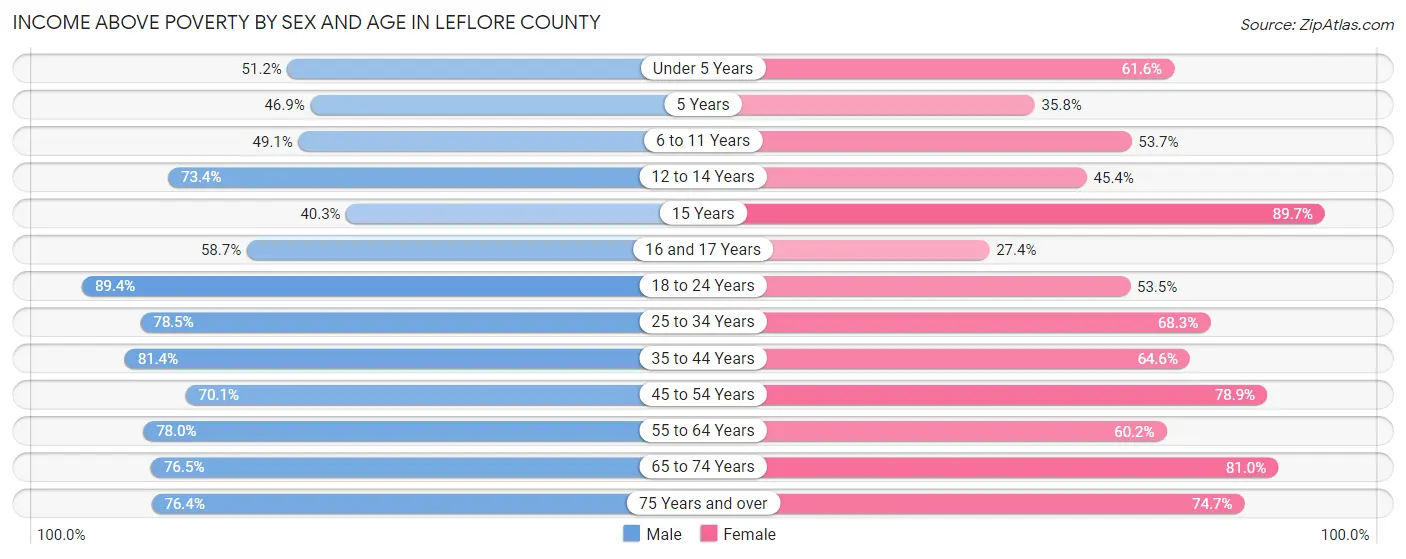
| Age Bracket | Male | Female |
| Under 5 Years | 525 (51.2%) | 601 (61.6%) |
| 5 Years | 115 (46.9%) | 63 (35.8%) |
| 6 to 11 Years | 631 (49.1%) | 675 (53.7%) |
| 12 to 14 Years | 446 (73.4%) | 309 (45.4%) |
| 15 Years | 31 (40.3%) | 321 (89.7%) |
| 16 and 17 Years | 320 (58.7%) | 52 (27.4%) |
| 18 to 24 Years | 805 (89.3%) | 665 (53.5%) |
| 25 to 34 Years | 1,378 (78.5%) | 1,340 (68.3%) |
| 35 to 44 Years | 1,128 (81.4%) | 1,154 (64.6%) |
| 45 to 54 Years | 945 (70.1%) | 1,287 (78.9%) |
| 55 to 64 Years | 1,133 (78.0%) | 1,092 (60.2%) |
| 65 to 74 Years | 763 (76.5%) | 1,107 (81.0%) |
| 75 Years and over | 344 (76.4%) | 715 (74.7%) |
| Total | 8,564 (70.9%) | 9,381 (65.2%) |
Income Below Poverty Among Married-Couple Families in Leflore County
The poverty statistics for married-couple families in Leflore County show that 9.7% or 251 of the total 2,587 families live below the poverty line. Families with 5 or more children have the highest poverty rate of 60.0%, comprising of 15 families. On the other hand, families with no children have the lowest poverty rate of 5.7%, which includes 93 families.
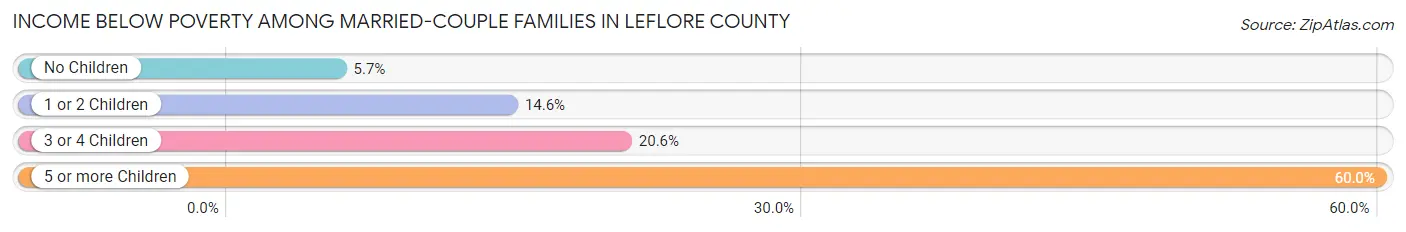
| Children | Above Poverty | Below Poverty |
| No Children | 1,548 (94.3%) | 93 (5.7%) |
| 1 or 2 Children | 666 (85.4%) | 114 (14.6%) |
| 3 or 4 Children | 112 (79.4%) | 29 (20.6%) |
| 5 or more Children | 10 (40.0%) | 15 (60.0%) |
| Total | 2,336 (90.3%) | 251 (9.7%) |
Income Below Poverty Among Single-Parent Households in Leflore County
According to the poverty data in Leflore County, 27.5% or 134 single-father households and 41.4% or 1,102 single-mother households are living below the poverty line. Among single-father households, those with 3 or 4 children have the highest poverty rate, with 42 households (100.0%) experiencing poverty. Likewise, among single-mother households, those with 3 or 4 children have the highest poverty rate, with 384 households (82.8%) falling below the poverty line.
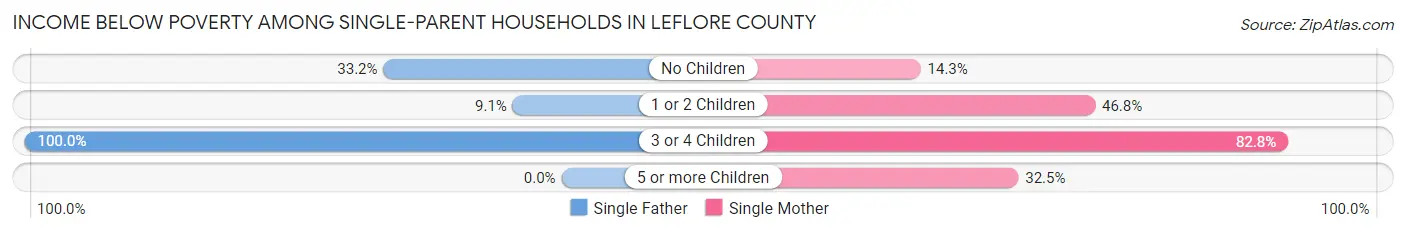
| Children | Single Father | Single Mother |
| No Children | 71 (33.2%) | 132 (14.3%) |
| 1 or 2 Children | 21 (9.1%) | 559 (46.8%) |
| 3 or 4 Children | 42 (100.0%) | 384 (82.8%) |
| 5 or more Children | 0 (0.0%) | 27 (32.5%) |
| Total | 134 (27.5%) | 1,102 (41.4%) |
Income Below Poverty Among Married-Couple vs Single-Parent Households in Leflore County
The poverty data for Leflore County shows that 251 of the married-couple family households (9.7%) and 1,236 of the single-parent households (39.3%) are living below the poverty level. Within the married-couple family households, those with 5 or more children have the highest poverty rate, with 15 households (60.0%) falling below the poverty line. Among the single-parent households, those with 3 or 4 children have the highest poverty rate, with 426 household (84.2%) living below poverty.
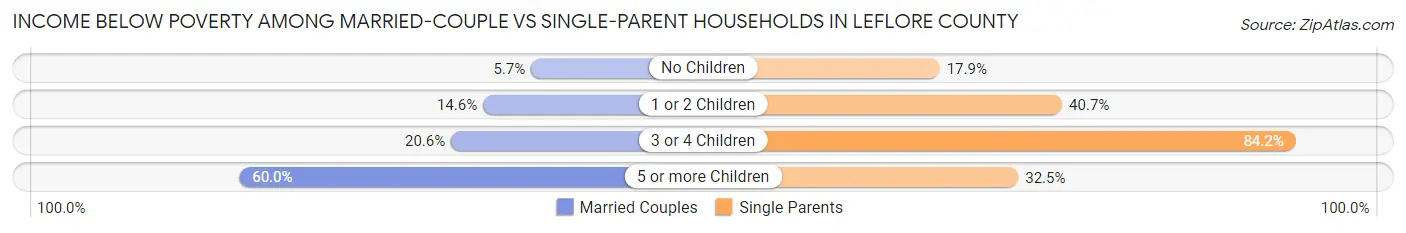
| Children | Married-Couple Families | Single-Parent Households |
| No Children | 93 (5.7%) | 203 (17.9%) |
| 1 or 2 Children | 114 (14.6%) | 580 (40.7%) |
| 3 or 4 Children | 29 (20.6%) | 426 (84.2%) |
| 5 or more Children | 15 (60.0%) | 27 (32.5%) |
| Total | 251 (9.7%) | 1,236 (39.3%) |
Race in Leflore County
The most populous races in Leflore County are Black / African American (20,841 | 74.7%), White / Caucasian (6,027 | 21.6%), and Hispanic or Latino (812 | 2.9%).
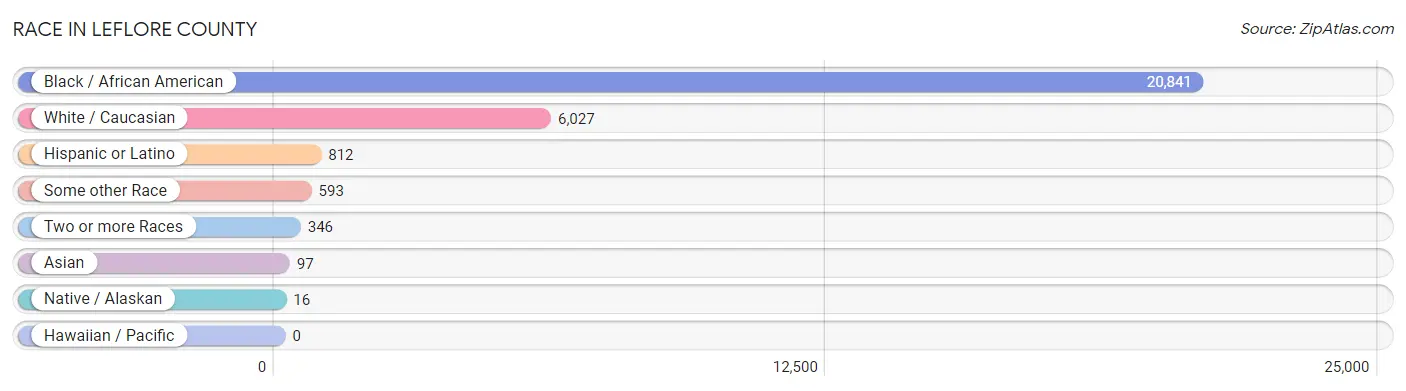
| Race | # Population | % Population |
| Asian | 97 | 0.4% |
| Black / African American | 20,841 | 74.7% |
| Hawaiian / Pacific | 0 | 0.0% |
| Hispanic or Latino | 812 | 2.9% |
| Native / Alaskan | 16 | 0.1% |
| White / Caucasian | 6,027 | 21.6% |
| Two or more Races | 346 | 1.2% |
| Some other Race | 593 | 2.1% |
| Total | 27,920 | 100.0% |
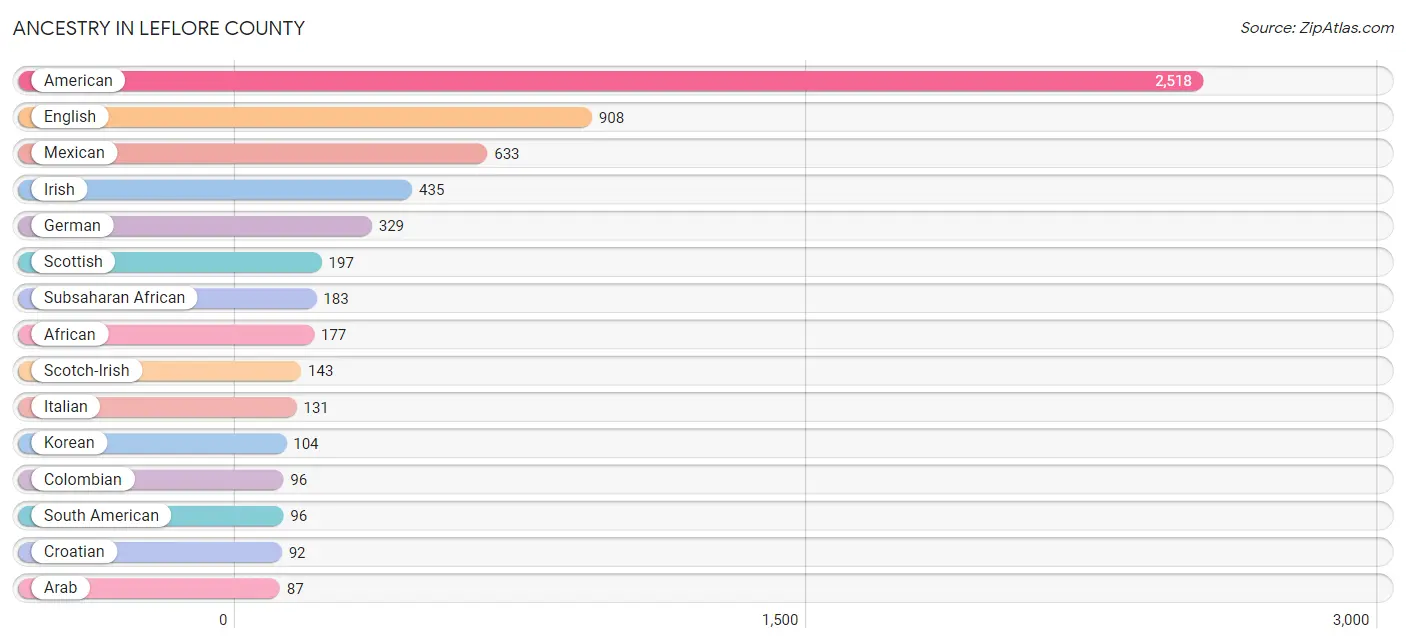
Ancestry in Leflore County
The most populous ancestries reported in Leflore County are American (2,518 | 9.0%), English (908 | 3.3%), Mexican (633 | 2.3%), Irish (435 | 1.6%), and German (329 | 1.2%), together accounting for 17.3% of all Leflore County residents.
| Ancestry | # Population | % Population |
| African | 177 | 0.6% |
| American | 2,518 | 9.0% |
| Arab | 87 | 0.3% |
| Belgian | 12 | 0.0% |
| Bhutanese | 2 | 0.0% |
| British | 16 | 0.1% |
| Central American | 72 | 0.3% |
| Cherokee | 1 | 0.0% |
| Choctaw | 16 | 0.1% |
| Colombian | 96 | 0.3% |
| Croatian | 92 | 0.3% |
| Dutch | 62 | 0.2% |
| English | 908 | 3.3% |
| European | 35 | 0.1% |
| French | 48 | 0.2% |
| German | 329 | 1.2% |
| Guatemalan | 72 | 0.3% |
| Hungarian | 18 | 0.1% |
| Irish | 435 | 1.6% |
| Italian | 131 | 0.5% |
| Korean | 104 | 0.4% |
| Lebanese | 66 | 0.2% |
| Mexican | 633 | 2.3% |
| Norwegian | 33 | 0.1% |
| Polish | 24 | 0.1% |
| Portuguese | 10 | 0.0% |
| Romanian | 16 | 0.1% |
| Scotch-Irish | 143 | 0.5% |
| Scottish | 197 | 0.7% |
| South American | 96 | 0.3% |
| Spanish | 11 | 0.0% |
| Subsaharan African | 183 | 0.7% |
| Swedish | 30 | 0.1% |
| Syrian | 21 | 0.1% |
| Thai | 15 | 0.1% |
| Welsh | 30 | 0.1% | View All 36 Rows |
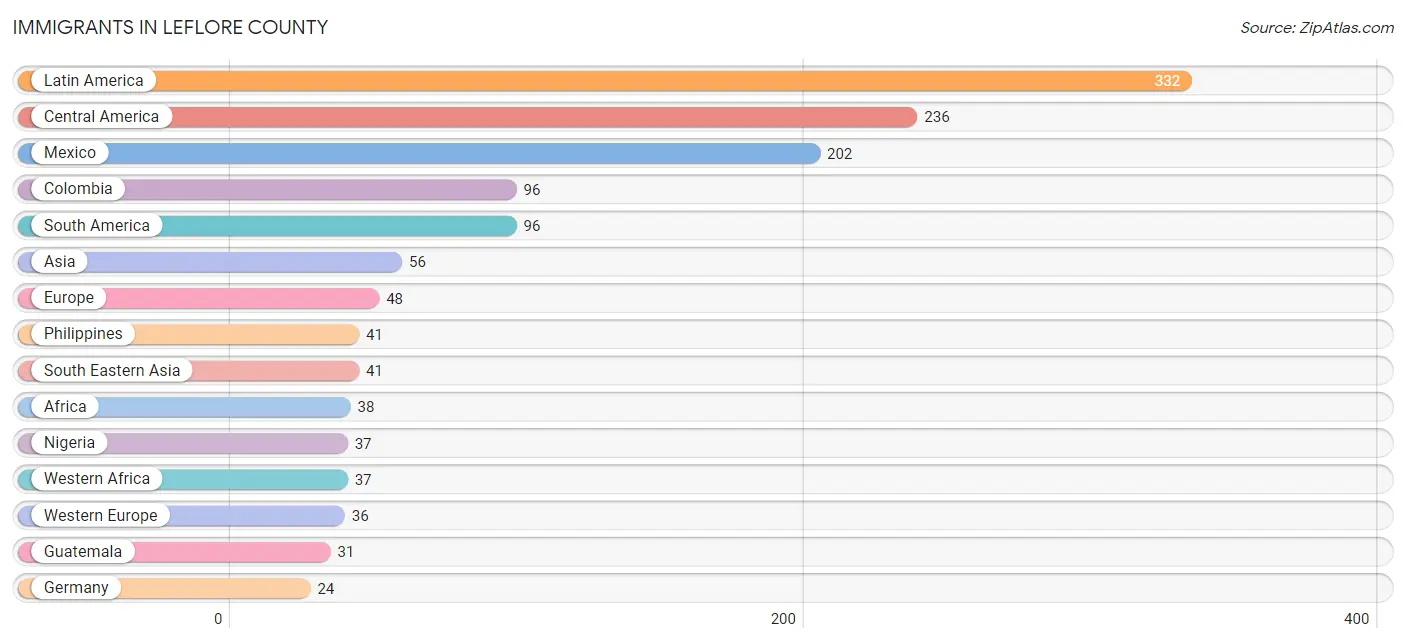
Immigrants in Leflore County
The most numerous immigrant groups reported in Leflore County came from Latin America (332 | 1.2%), Central America (236 | 0.9%), Mexico (202 | 0.7%), Colombia (96 | 0.3%), and South America (96 | 0.3%), together accounting for 3.4% of all Leflore County residents.
| Immigration Origin | # Population | % Population |
| Africa | 38 | 0.1% |
| Asia | 56 | 0.2% |
| Belgium | 12 | 0.0% |
| Central America | 236 | 0.9% |
| Colombia | 96 | 0.3% |
| Eastern Africa | 1 | 0.0% |
| Europe | 48 | 0.2% |
| Germany | 24 | 0.1% |
| Guatemala | 31 | 0.1% |
| Honduras | 3 | 0.0% |
| India | 15 | 0.1% |
| Italy | 12 | 0.0% |
| Latin America | 332 | 1.2% |
| Mexico | 202 | 0.7% |
| Nigeria | 37 | 0.1% |
| Philippines | 41 | 0.2% |
| South America | 96 | 0.3% |
| South Central Asia | 15 | 0.1% |
| South Eastern Asia | 41 | 0.2% |
| Southern Europe | 12 | 0.0% |
| Western Africa | 37 | 0.1% |
| Western Europe | 36 | 0.1% | View All 22 Rows |
Sex and Age in Leflore County
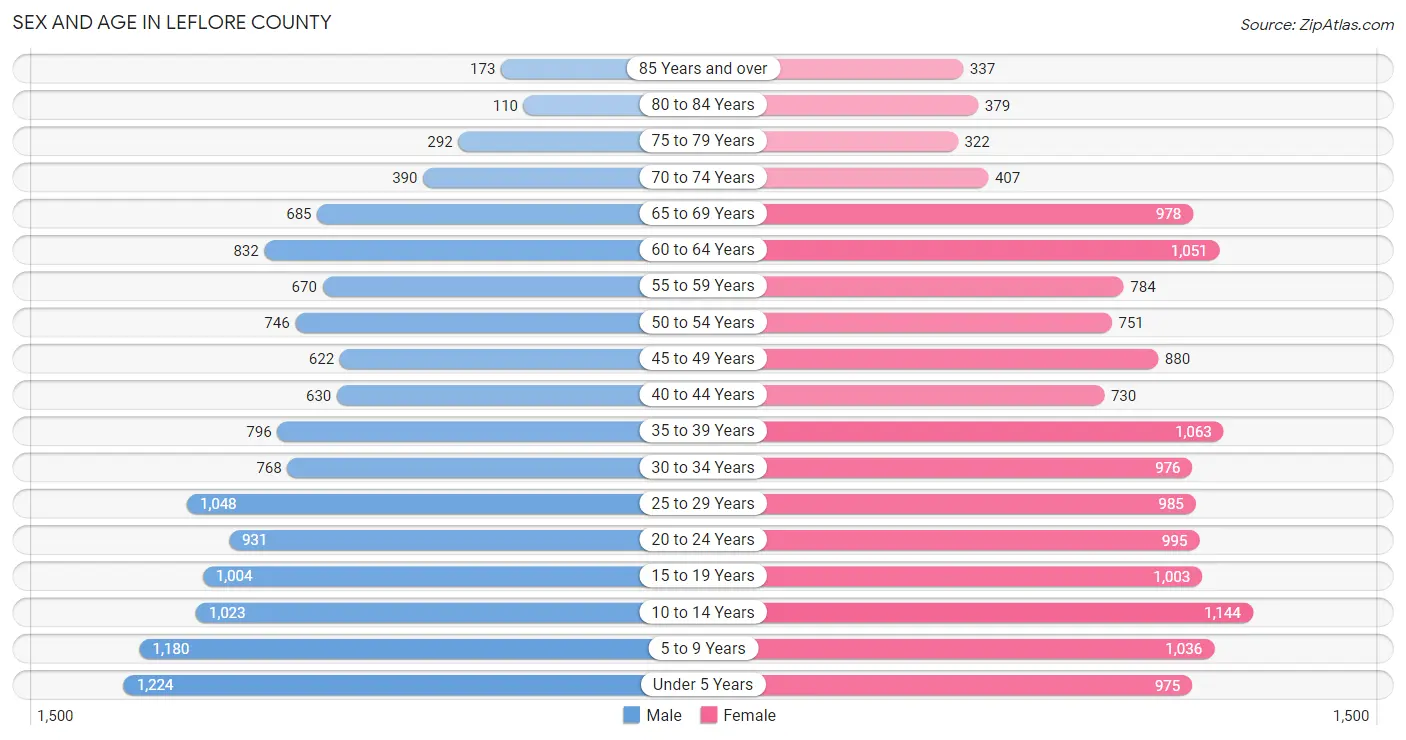
Sex and Age in Leflore County
The most populous age groups in Leflore County are Under 5 Years (1,224 | 9.3%) for men and 10 to 14 Years (1,144 | 7.7%) for women.
| Age Bracket | Male | Female |
| Under 5 Years | 1,224 (9.3%) | 975 (6.6%) |
| 5 to 9 Years | 1,180 (9.0%) | 1,036 (7.0%) |
| 10 to 14 Years | 1,023 (7.8%) | 1,144 (7.7%) |
| 15 to 19 Years | 1,004 (7.6%) | 1,003 (6.8%) |
| 20 to 24 Years | 931 (7.1%) | 995 (6.7%) |
| 25 to 29 Years | 1,048 (8.0%) | 985 (6.7%) |
| 30 to 34 Years | 768 (5.9%) | 976 (6.6%) |
| 35 to 39 Years | 796 (6.1%) | 1,063 (7.2%) |
| 40 to 44 Years | 630 (4.8%) | 730 (4.9%) |
| 45 to 49 Years | 622 (4.7%) | 880 (5.9%) |
| 50 to 54 Years | 746 (5.7%) | 751 (5.1%) |
| 55 to 59 Years | 670 (5.1%) | 784 (5.3%) |
| 60 to 64 Years | 832 (6.3%) | 1,051 (7.1%) |
| 65 to 69 Years | 685 (5.2%) | 978 (6.6%) |
| 70 to 74 Years | 390 (3.0%) | 407 (2.8%) |
| 75 to 79 Years | 292 (2.2%) | 322 (2.2%) |
| 80 to 84 Years | 110 (0.8%) | 379 (2.6%) |
| 85 Years and over | 173 (1.3%) | 337 (2.3%) |
| Total | 13,124 (100.0%) | 14,796 (100.0%) |
Families and Households in Leflore County
Median Family Size in Leflore County
The median family size in Leflore County is 3.75 persons per family, with single female/mother families (2,662 | 46.4%) accounting for the largest median family size of 4.08 persons per family. On the other hand, married-couple families (2,587 | 45.1%) represent the smallest median family size with 3.41 persons per family.

| Family Type | # Families | Family Size |
| Married-Couple | 2,587 (45.1%) | 3.41 |
| Single Male/Father | 487 (8.5%) | 3.69 |
| Single Female/Mother | 2,662 (46.4%) | 4.08 |
| Total Families | 5,736 (100.0%) | 3.75 |
Median Household Size in Leflore County
The median household size in Leflore County is 2.77 persons per household, with single female/mother households (2,662 | 27.6%) accounting for the largest median household size of 4.21 persons per household. non-family households (3,920 | 40.6%) represent the smallest median household size with 1.13 persons per household.

| Household Type | # Households | Household Size |
| Married-Couple | 2,587 (26.8%) | 3.53 |
| Single Male/Father | 487 (5.0%) | 4.00 |
| Single Female/Mother | 2,662 (27.6%) | 4.21 |
| Non-family | 3,920 (40.6%) | 1.13 |
| Total Households | 9,656 (100.0%) | 2.77 |
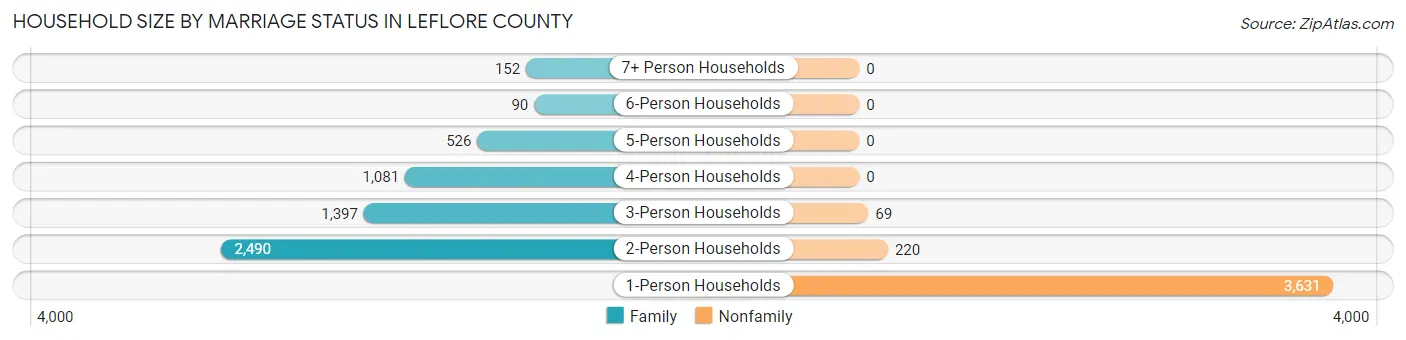
Household Size by Marriage Status in Leflore County
Out of a total of 9,656 households in Leflore County, 5,736 (59.4%) are family households, while 3,920 (40.6%) are nonfamily households. The most numerous type of family households are 2-person households, comprising 2,490, and the most common type of nonfamily households are 1-person households, comprising 3,631.
| Household Size | Family Households | Nonfamily Households |
| 1-Person Households | - | 3,631 (37.6%) |
| 2-Person Households | 2,490 (25.8%) | 220 (2.3%) |
| 3-Person Households | 1,397 (14.5%) | 69 (0.7%) |
| 4-Person Households | 1,081 (11.2%) | 0 (0.0%) |
| 5-Person Households | 526 (5.4%) | 0 (0.0%) |
| 6-Person Households | 90 (0.9%) | 0 (0.0%) |
| 7+ Person Households | 152 (1.6%) | 0 (0.0%) |
| Total | 5,736 (59.4%) | 3,920 (40.6%) |
Female Fertility in Leflore County
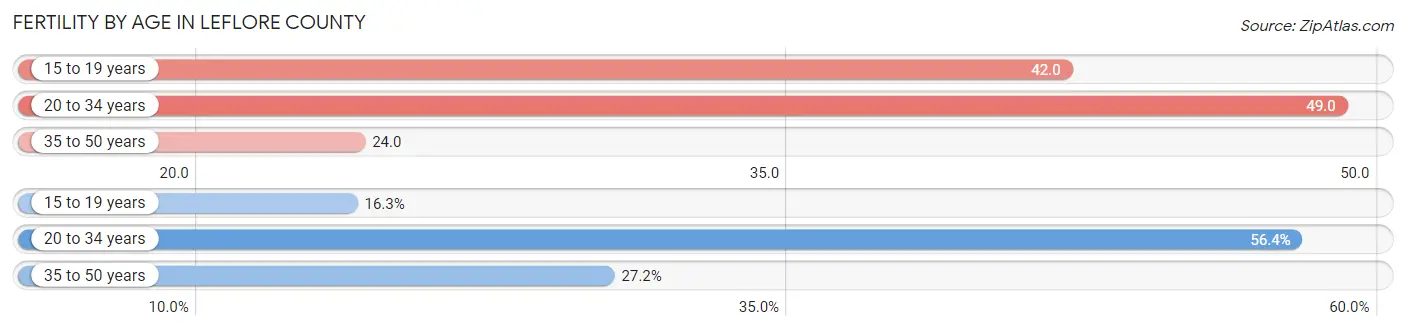
Fertility by Age in Leflore County
Average fertility rate in Leflore County is 38.0 births per 1,000 women. Women in the age bracket of 20 to 34 years have the highest fertility rate with 49.0 births per 1,000 women. Women in the age bracket of 20 to 34 years acount for 56.4% of all women with births.
| Age Bracket | Women with Births | Births / 1,000 Women |
| 15 to 19 years | 42 (16.3%) | 42.0 |
| 20 to 34 years | 145 (56.4%) | 49.0 |
| 35 to 50 years | 70 (27.2%) | 24.0 |
| Total | 257 (100.0%) | 38.0 |
Fertility by Age by Marriage Status in Leflore County
27.6% of women with births (257) in Leflore County are married. The highest percentage of unmarried women with births falls into 15 to 19 years age bracket with 100.0% of them unmarried at the time of birth, while the lowest percentage of unmarried women with births belong to 35 to 50 years age bracket with 22.9% of them unmarried.
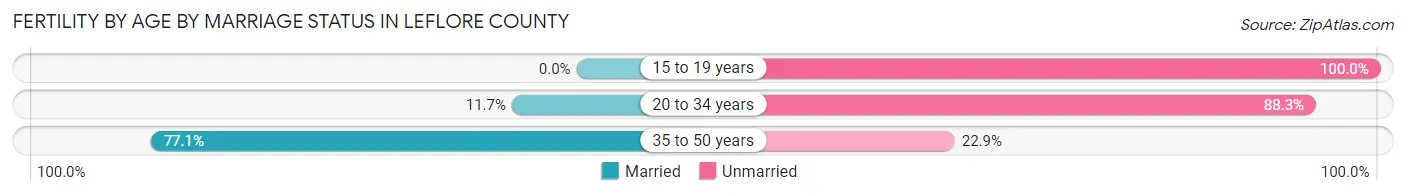
| Age Bracket | Married | Unmarried |
| 15 to 19 years | 0 (0.0%) | 42 (100.0%) |
| 20 to 34 years | 17 (11.7%) | 128 (88.3%) |
| 35 to 50 years | 54 (77.1%) | 16 (22.9%) |
| Total | 71 (27.6%) | 186 (72.4%) |
Fertility by Education in Leflore County
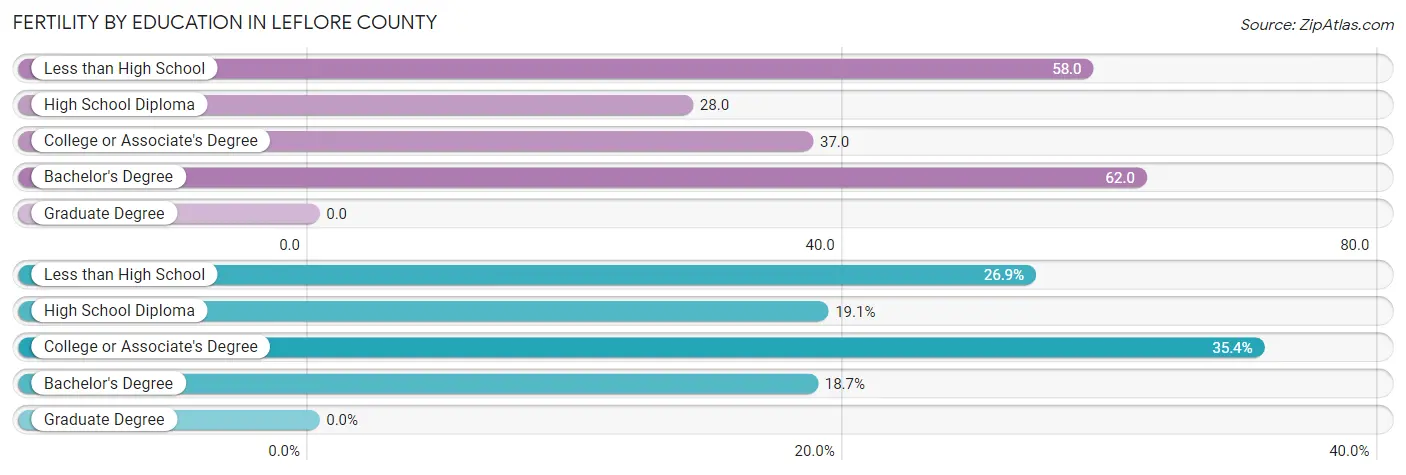
| Educational Attainment | Women with Births | Births / 1,000 Women |
| Less than High School | 69 (26.9%) | 58.0 |
| High School Diploma | 49 (19.1%) | 28.0 |
| College or Associate's Degree | 91 (35.4%) | 37.0 |
| Bachelor's Degree | 48 (18.7%) | 62.0 |
| Graduate Degree | 0 (0.0%) | 0.0 |
| Total | 257 (100.0%) | 38.0 |
Fertility by Education by Marriage Status in Leflore County
72.4% of women with births in Leflore County are unmarried. Women with the educational attainment of bachelor's degree are most likely to be married with 100.0% of them married at childbirth, while women with the educational attainment of less than high school are least likely to be married with 100.0% of them unmarried at childbirth.
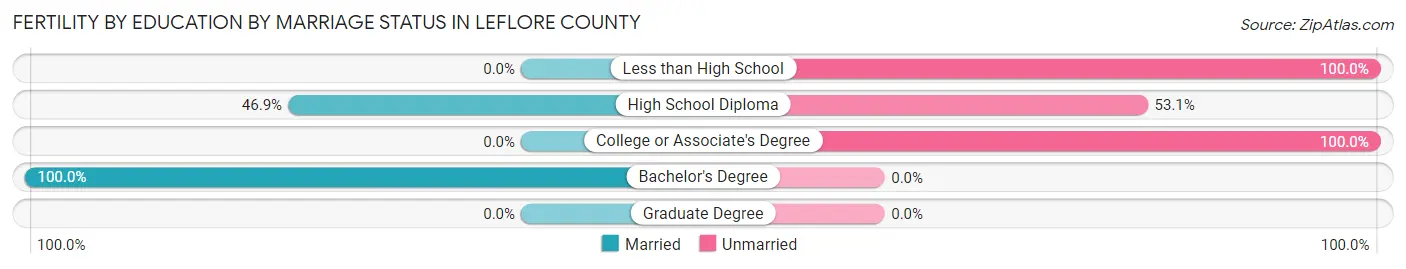
| Educational Attainment | Married | Unmarried |
| Less than High School | 0 (0.0%) | 69 (100.0%) |
| High School Diploma | 23 (46.9%) | 26 (53.1%) |
| College or Associate's Degree | 0 (0.0%) | 91 (100.0%) |
| Bachelor's Degree | 48 (100.0%) | 0 (0.0%) |
| Graduate Degree | 0 (0.0%) | 0 (0.0%) |
| Total | 71 (27.6%) | 186 (72.4%) |
Employment Characteristics in Leflore County
Employment by Class of Employer in Leflore County
Among the 10,240 employed individuals in Leflore County, private company employees (6,483 | 63.3%), local government employees (1,168 | 11.4%), and not-for-profit organizations (822 | 8.0%) make up the most common classes of employment.
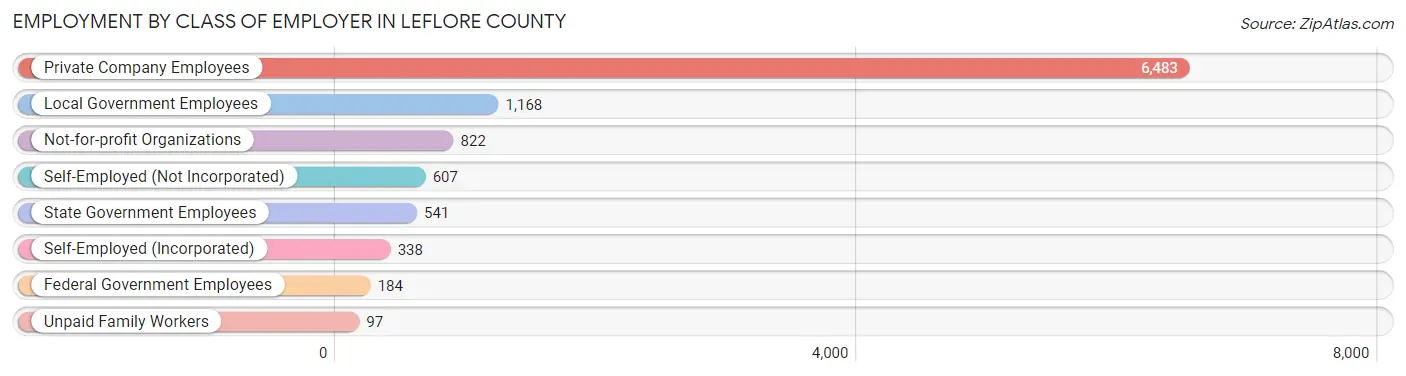
| Employer Class | # Employees | % Employees |
| Private Company Employees | 6,483 | 63.3% |
| Self-Employed (Incorporated) | 338 | 3.3% |
| Self-Employed (Not Incorporated) | 607 | 5.9% |
| Not-for-profit Organizations | 822 | 8.0% |
| Local Government Employees | 1,168 | 11.4% |
| State Government Employees | 541 | 5.3% |
| Federal Government Employees | 184 | 1.8% |
| Unpaid Family Workers | 97 | 0.9% |
| Total | 10,240 | 100.0% |
Employment Status by Age in Leflore County
According to the labor force statistics for Leflore County, out of the total population over 16 years of age (20,902), 56.1% or 11,726 individuals are in the labor force, with 11.8% or 1,384 of them unemployed. The age group with the highest labor force participation rate is 25 to 29 years, with 85.5% or 1,738 individuals in the labor force. Within the labor force, the 16 to 19 years age range has the highest percentage of unemployed individuals, with 63.3% or 249 of them being unemployed.
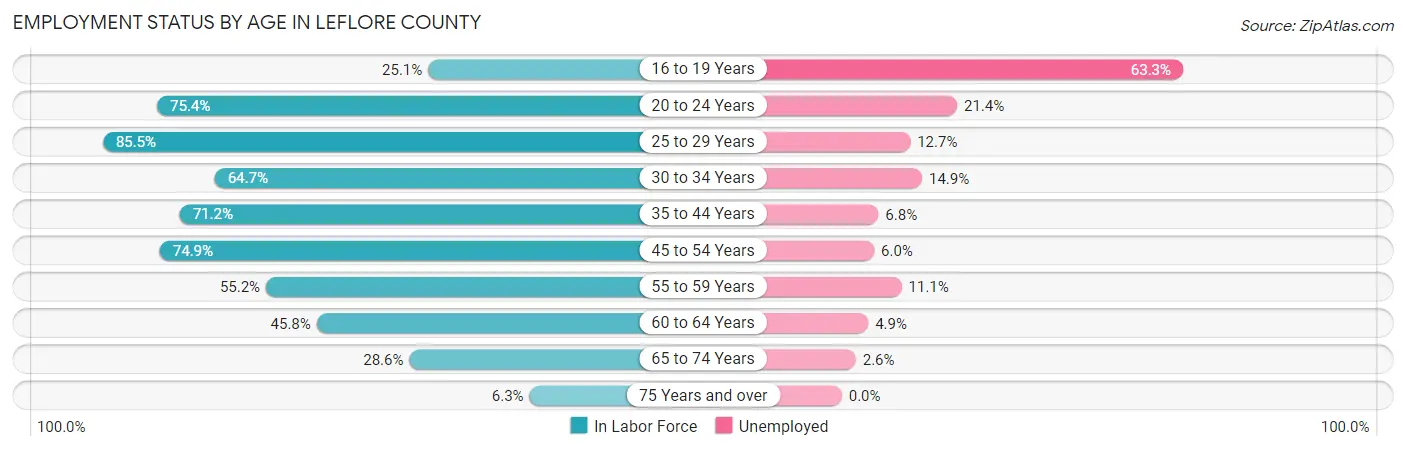
| Age Bracket | In Labor Force | Unemployed |
| 16 to 19 Years | 394 (25.1%) | 249 (63.3%) |
| 20 to 24 Years | 1,452 (75.4%) | 311 (21.4%) |
| 25 to 29 Years | 1,738 (85.5%) | 221 (12.7%) |
| 30 to 34 Years | 1,128 (64.7%) | 168 (14.9%) |
| 35 to 44 Years | 2,292 (71.2%) | 156 (6.8%) |
| 45 to 54 Years | 2,246 (74.9%) | 135 (6.0%) |
| 55 to 59 Years | 803 (55.2%) | 89 (11.1%) |
| 60 to 64 Years | 862 (45.8%) | 42 (4.9%) |
| 65 to 74 Years | 704 (28.6%) | 18 (2.6%) |
| 75 Years and over | 102 (6.3%) | 0 (0.0%) |
| Total | 11,726 (56.1%) | 1,384 (11.8%) |
Employment Status by Educational Attainment in Leflore County
According to labor force statistics for Leflore County, 68.0% of individuals (9,066) out of the total population between 25 and 64 years of age (13,332) are in the labor force, with 8.9% or 807 of them being unemployed. The group with the highest labor force participation rate are those with the educational attainment of bachelor's degree or higher, with 90.7% or 2,436 individuals in the labor force. Within the labor force, individuals with less than high school education have the highest percentage of unemployment, with 21.7% or 160 of them being unemployed.
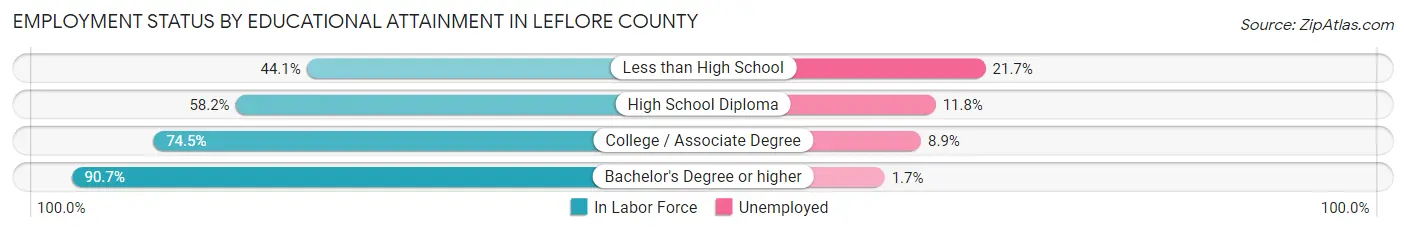
| Educational Attainment | In Labor Force | Unemployed |
| Less than High School | 738 (44.1%) | 363 (21.7%) |
| High School Diploma | 2,825 (58.2%) | 573 (11.8%) |
| College / Associate Degree | 3,068 (74.5%) | 367 (8.9%) |
| Bachelor's Degree or higher | 2,436 (90.7%) | 46 (1.7%) |
| Total | 9,066 (68.0%) | 1,187 (8.9%) |
Employment Occupations by Sex in Leflore County
Management, Business, Science and Arts Occupations
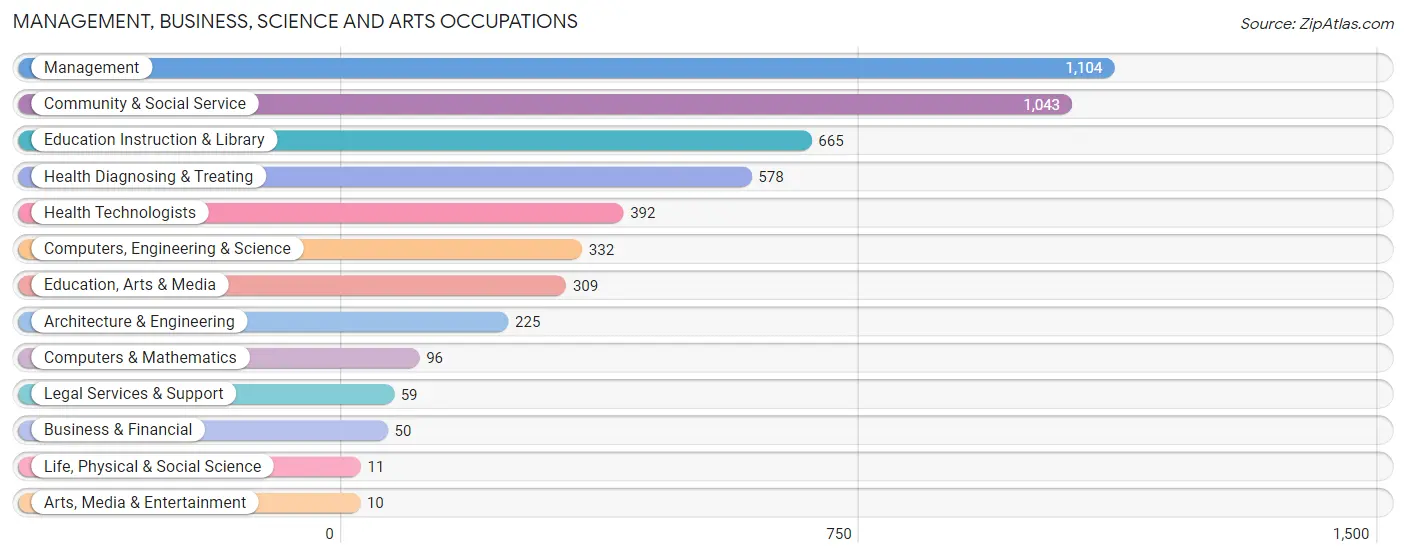
The most common Management, Business, Science and Arts occupations in Leflore County are Management (1,104 | 10.7%), Community & Social Service (1,043 | 10.1%), Education Instruction & Library (665 | 6.5%), Health Diagnosing & Treating (578 | 5.6%), and Health Technologists (392 | 3.8%).
Management, Business, Science and Arts Occupations by Sex
Within the Management, Business, Science and Arts occupations in Leflore County, the most male-oriented occupations are Computers & Mathematics (100.0%), Arts, Media & Entertainment (100.0%), and Computers, Engineering & Science (89.5%), while the most female-oriented occupations are Life, Physical & Social Science (100.0%), Education Instruction & Library (85.6%), and Education, Arts & Media (82.2%).
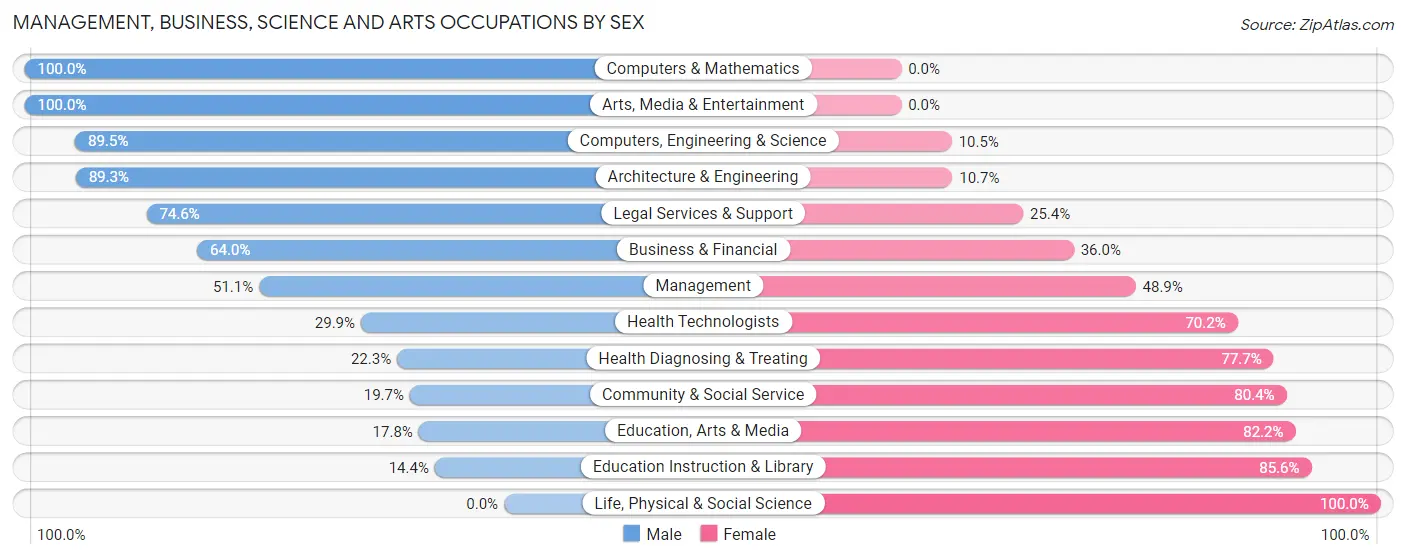
| Occupation | Male | Female |
| Management | 564 (51.1%) | 540 (48.9%) |
| Business & Financial | 32 (64.0%) | 18 (36.0%) |
| Computers, Engineering & Science | 297 (89.5%) | 35 (10.5%) |
| Computers & Mathematics | 96 (100.0%) | 0 (0.0%) |
| Architecture & Engineering | 201 (89.3%) | 24 (10.7%) |
| Life, Physical & Social Science | 0 (0.0%) | 11 (100.0%) |
| Community & Social Service | 205 (19.7%) | 838 (80.3%) |
| Education, Arts & Media | 55 (17.8%) | 254 (82.2%) |
| Legal Services & Support | 44 (74.6%) | 15 (25.4%) |
| Education Instruction & Library | 96 (14.4%) | 569 (85.6%) |
| Arts, Media & Entertainment | 10 (100.0%) | 0 (0.0%) |
| Health Diagnosing & Treating | 129 (22.3%) | 449 (77.7%) |
| Health Technologists | 117 (29.8%) | 275 (70.2%) |
| Total (Category) | 1,227 (39.5%) | 1,880 (60.5%) |
| Total (Overall) | 4,695 (45.5%) | 5,615 (54.5%) |
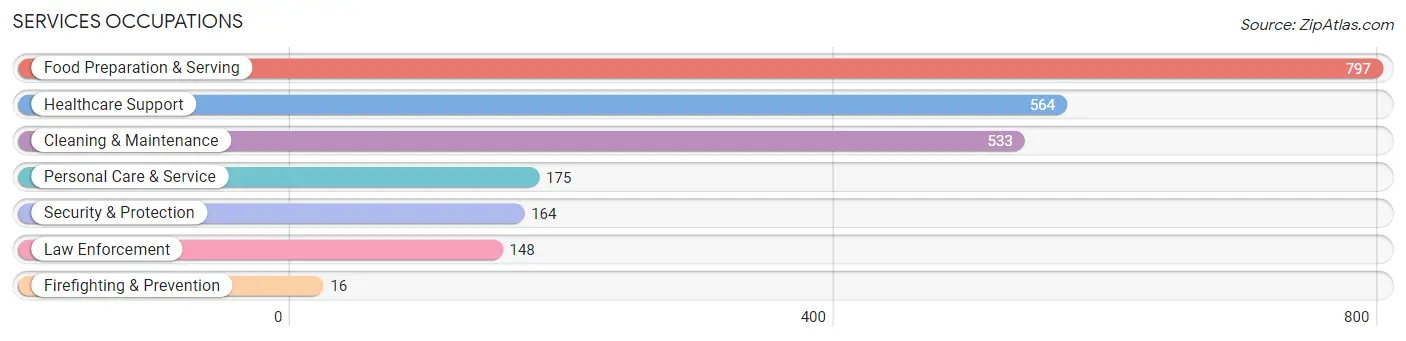
Services Occupations
The most common Services occupations in Leflore County are Food Preparation & Serving (797 | 7.7%), Healthcare Support (564 | 5.5%), Cleaning & Maintenance (533 | 5.2%), Personal Care & Service (175 | 1.7%), and Security & Protection (164 | 1.6%).
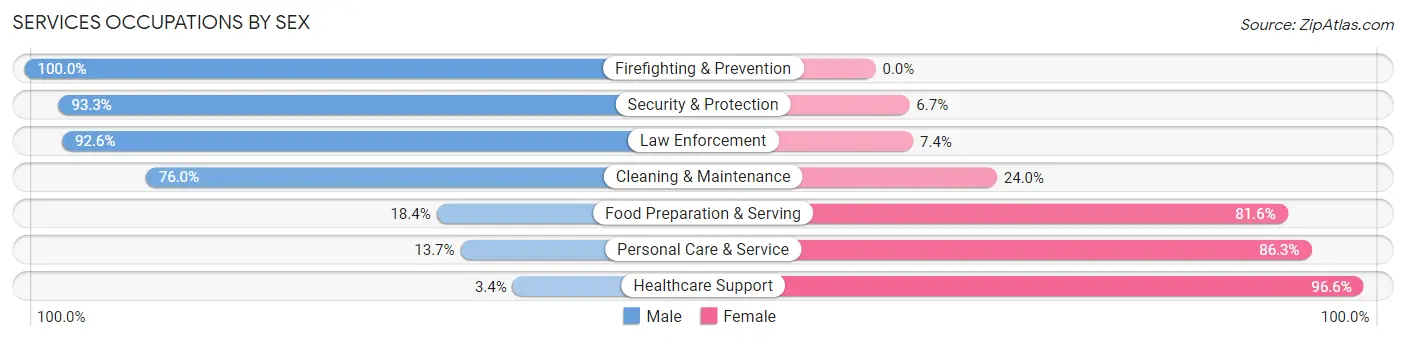
Services Occupations by Sex
Within the Services occupations in Leflore County, the most male-oriented occupations are Firefighting & Prevention (100.0%), Security & Protection (93.3%), and Law Enforcement (92.6%), while the most female-oriented occupations are Healthcare Support (96.6%), Personal Care & Service (86.3%), and Food Preparation & Serving (81.6%).
| Occupation | Male | Female |
| Healthcare Support | 19 (3.4%) | 545 (96.6%) |
| Security & Protection | 153 (93.3%) | 11 (6.7%) |
| Firefighting & Prevention | 16 (100.0%) | 0 (0.0%) |
| Law Enforcement | 137 (92.6%) | 11 (7.4%) |
| Food Preparation & Serving | 147 (18.4%) | 650 (81.6%) |
| Cleaning & Maintenance | 405 (76.0%) | 128 (24.0%) |
| Personal Care & Service | 24 (13.7%) | 151 (86.3%) |
| Total (Category) | 748 (33.5%) | 1,485 (66.5%) |
| Total (Overall) | 4,695 (45.5%) | 5,615 (54.5%) |
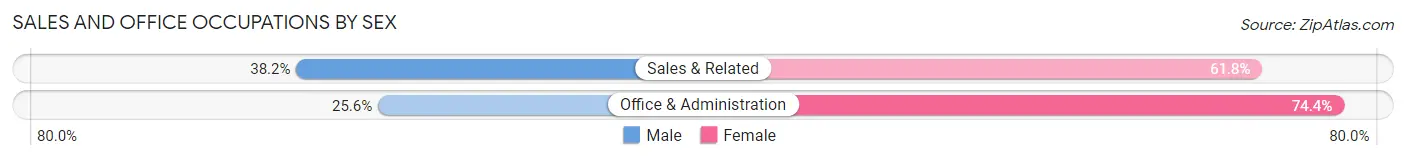
Sales and Office Occupations
The most common Sales and Office occupations in Leflore County are Sales & Related (1,178 | 11.4%), and Office & Administration (1,034 | 10.0%).

Sales and Office Occupations by Sex
| Occupation | Male | Female |
| Sales & Related | 450 (38.2%) | 728 (61.8%) |
| Office & Administration | 265 (25.6%) | 769 (74.4%) |
| Total (Category) | 715 (32.3%) | 1,497 (67.7%) |
| Total (Overall) | 4,695 (45.5%) | 5,615 (54.5%) |
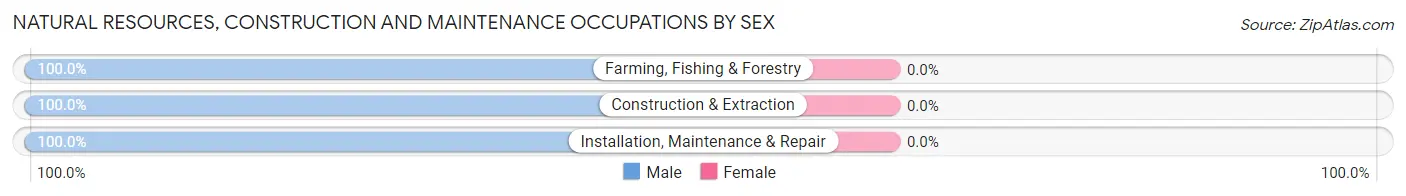
Natural Resources, Construction and Maintenance Occupations
The most common Natural Resources, Construction and Maintenance occupations in Leflore County are Installation, Maintenance & Repair (251 | 2.4%), Construction & Extraction (246 | 2.4%), and Farming, Fishing & Forestry (147 | 1.4%).

Natural Resources, Construction and Maintenance Occupations by Sex
| Occupation | Male | Female |
| Farming, Fishing & Forestry | 147 (100.0%) | 0 (0.0%) |
| Construction & Extraction | 246 (100.0%) | 0 (0.0%) |
| Installation, Maintenance & Repair | 251 (100.0%) | 0 (0.0%) |
| Total (Category) | 644 (100.0%) | 0 (0.0%) |
| Total (Overall) | 4,695 (45.5%) | 5,615 (54.5%) |
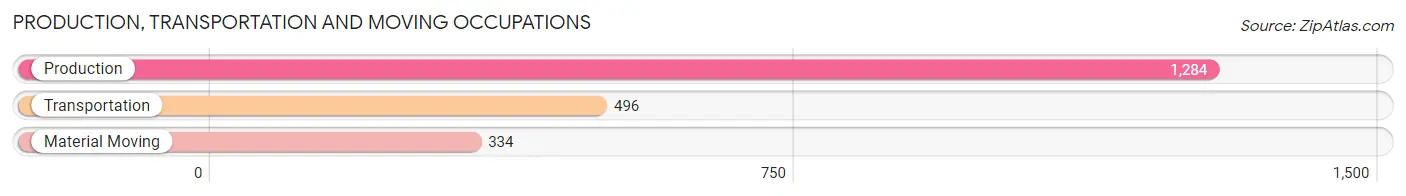
Production, Transportation and Moving Occupations
The most common Production, Transportation and Moving occupations in Leflore County are Production (1,284 | 12.4%), Transportation (496 | 4.8%), and Material Moving (334 | 3.2%).
Production, Transportation and Moving Occupations by Sex
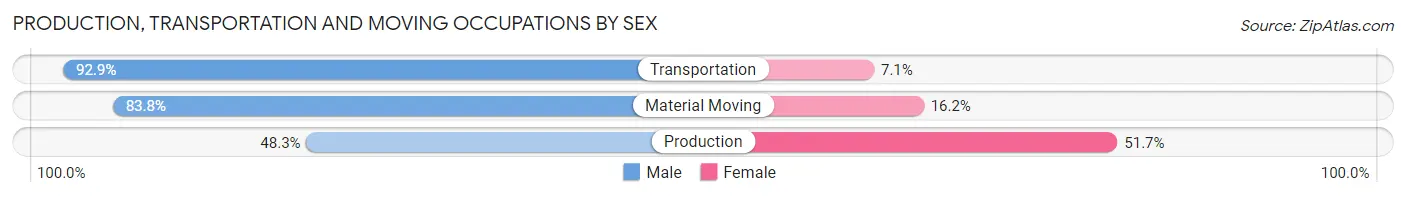
| Occupation | Male | Female |
| Production | 620 (48.3%) | 664 (51.7%) |
| Transportation | 461 (92.9%) | 35 (7.1%) |
| Material Moving | 280 (83.8%) | 54 (16.2%) |
| Total (Category) | 1,361 (64.4%) | 753 (35.6%) |
| Total (Overall) | 4,695 (45.5%) | 5,615 (54.5%) |
Employment Industries by Sex in Leflore County
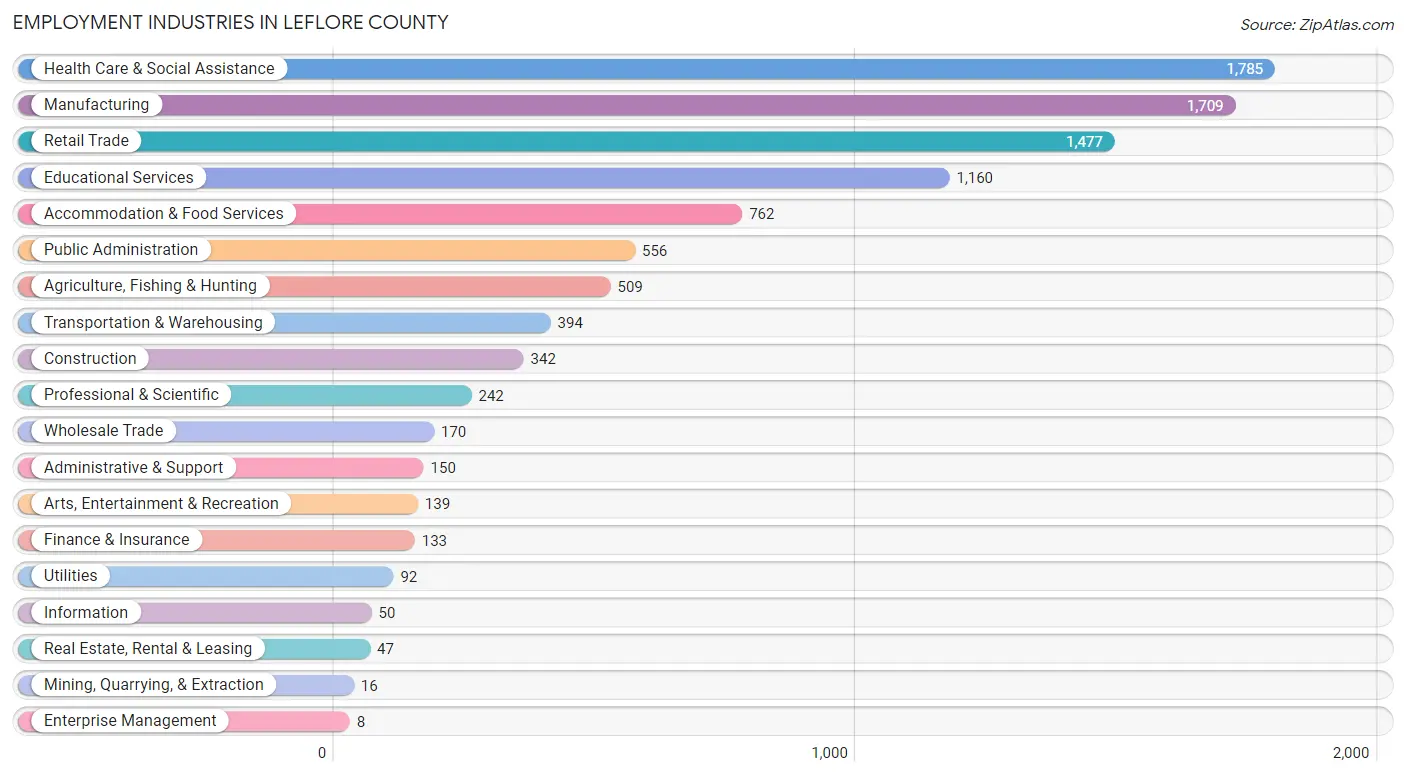
Employment Industries in Leflore County
The major employment industries in Leflore County include Health Care & Social Assistance (1,785 | 17.3%), Manufacturing (1,709 | 16.6%), Retail Trade (1,477 | 14.3%), Educational Services (1,160 | 11.3%), and Accommodation & Food Services (762 | 7.4%).
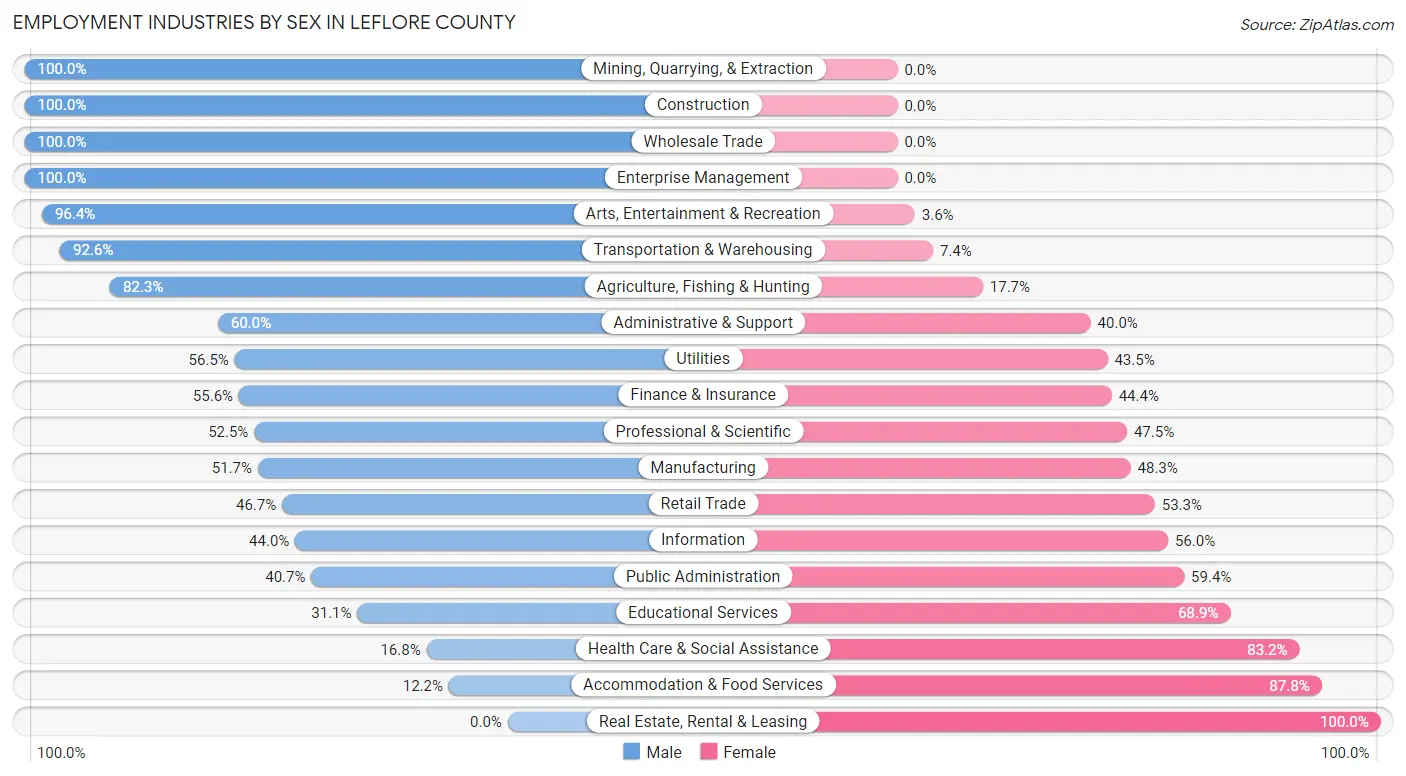
Employment Industries by Sex in Leflore County
The Leflore County industries that see more men than women are Mining, Quarrying, & Extraction (100.0%), Construction (100.0%), and Wholesale Trade (100.0%), whereas the industries that tend to have a higher number of women are Real Estate, Rental & Leasing (100.0%), Accommodation & Food Services (87.8%), and Health Care & Social Assistance (83.2%).
| Industry | Male | Female |
| Agriculture, Fishing & Hunting | 419 (82.3%) | 90 (17.7%) |
| Mining, Quarrying, & Extraction | 16 (100.0%) | 0 (0.0%) |
| Construction | 342 (100.0%) | 0 (0.0%) |
| Manufacturing | 884 (51.7%) | 825 (48.3%) |
| Wholesale Trade | 170 (100.0%) | 0 (0.0%) |
| Retail Trade | 690 (46.7%) | 787 (53.3%) |
| Transportation & Warehousing | 365 (92.6%) | 29 (7.4%) |
| Utilities | 52 (56.5%) | 40 (43.5%) |
| Information | 22 (44.0%) | 28 (56.0%) |
| Finance & Insurance | 74 (55.6%) | 59 (44.4%) |
| Real Estate, Rental & Leasing | 0 (0.0%) | 47 (100.0%) |
| Professional & Scientific | 127 (52.5%) | 115 (47.5%) |
| Enterprise Management | 8 (100.0%) | 0 (0.0%) |
| Administrative & Support | 90 (60.0%) | 60 (40.0%) |
| Educational Services | 361 (31.1%) | 799 (68.9%) |
| Health Care & Social Assistance | 300 (16.8%) | 1,485 (83.2%) |
| Arts, Entertainment & Recreation | 134 (96.4%) | 5 (3.6%) |
| Accommodation & Food Services | 93 (12.2%) | 669 (87.8%) |
| Public Administration | 226 (40.6%) | 330 (59.4%) |
| Total | 4,695 (45.5%) | 5,615 (54.5%) |
Education in Leflore County
School Enrollment in Leflore County
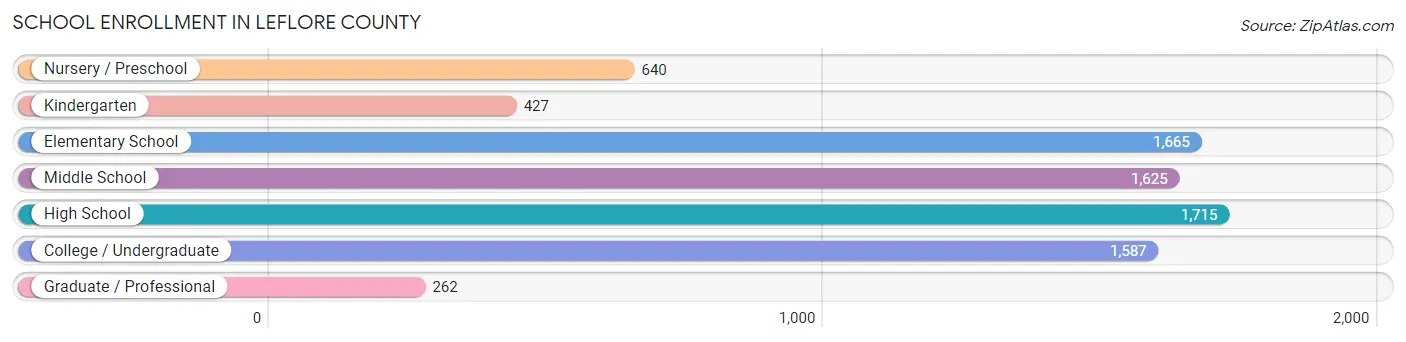
The most common levels of schooling among the 7,921 students in Leflore County are high school (1,715 | 21.6%), elementary school (1,665 | 21.0%), and middle school (1,625 | 20.5%).
| School Level | # Students | % Students |
| Nursery / Preschool | 640 | 8.1% |
| Kindergarten | 427 | 5.4% |
| Elementary School | 1,665 | 21.0% |
| Middle School | 1,625 | 20.5% |
| High School | 1,715 | 21.6% |
| College / Undergraduate | 1,587 | 20.0% |
| Graduate / Professional | 262 | 3.3% |
| Total | 7,921 | 100.0% |
School Enrollment by Age by Funding Source in Leflore County
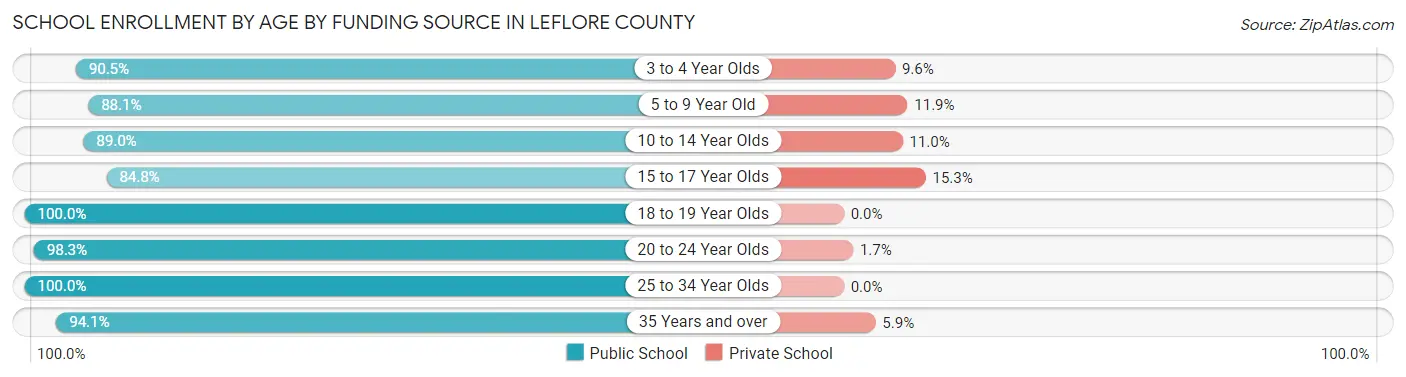
Out of a total of 7,921 students who are enrolled in schools in Leflore County, 721 (9.1%) attend a private institution, while the remaining 7,200 (90.9%) are enrolled in public schools. The age group of 15 to 17 year olds has the highest likelihood of being enrolled in private schools, with 181 (15.2% in the age bracket) enrolled. Conversely, the age group of 18 to 19 year olds has the lowest likelihood of being enrolled in a private school, with 669 (100.0% in the age bracket) attending a public institution.
| Age Bracket | Public School | Private School |
| 3 to 4 Year Olds | 379 (90.4%) | 40 (9.6%) |
| 5 to 9 Year Old | 1,836 (88.1%) | 247 (11.9%) |
| 10 to 14 Year Olds | 1,827 (89.0%) | 225 (11.0%) |
| 15 to 17 Year Olds | 1,006 (84.8%) | 181 (15.2%) |
| 18 to 19 Year Olds | 669 (100.0%) | 0 (0.0%) |
| 20 to 24 Year Olds | 967 (98.3%) | 17 (1.7%) |
| 25 to 34 Year Olds | 324 (100.0%) | 0 (0.0%) |
| 35 Years and over | 191 (94.1%) | 12 (5.9%) |
| Total | 7,200 (90.9%) | 721 (9.1%) |
Educational Attainment by Field of Study in Leflore County
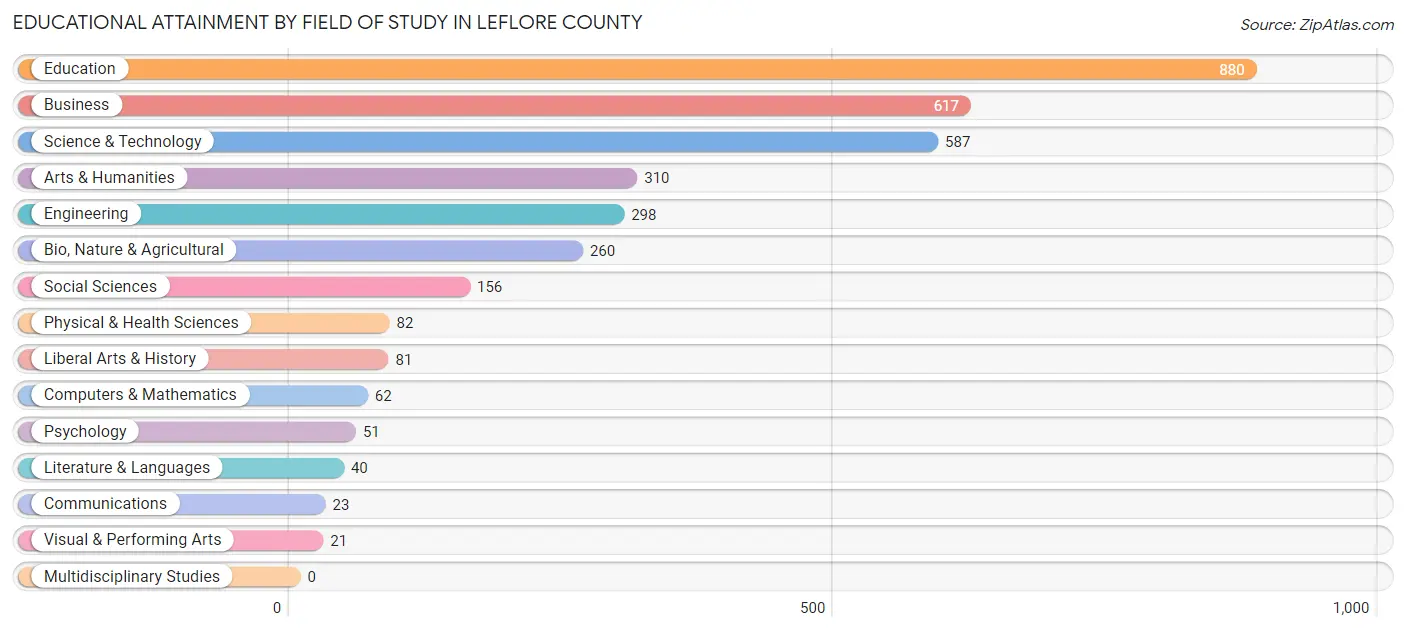
Education (880 | 25.4%), business (617 | 17.8%), science & technology (587 | 16.9%), arts & humanities (310 | 8.9%), and engineering (298 | 8.6%) are the most common fields of study among 3,468 individuals in Leflore County who have obtained a bachelor's degree or higher.
| Field of Study | # Graduates | % Graduates |
| Computers & Mathematics | 62 | 1.8% |
| Bio, Nature & Agricultural | 260 | 7.5% |
| Physical & Health Sciences | 82 | 2.4% |
| Psychology | 51 | 1.5% |
| Social Sciences | 156 | 4.5% |
| Engineering | 298 | 8.6% |
| Multidisciplinary Studies | 0 | 0.0% |
| Science & Technology | 587 | 16.9% |
| Business | 617 | 17.8% |
| Education | 880 | 25.4% |
| Literature & Languages | 40 | 1.1% |
| Liberal Arts & History | 81 | 2.3% |
| Visual & Performing Arts | 21 | 0.6% |
| Communications | 23 | 0.7% |
| Arts & Humanities | 310 | 8.9% |
| Total | 3,468 | 100.0% |
Transportation & Commute in Leflore County
Vehicle Availability by Sex in Leflore County
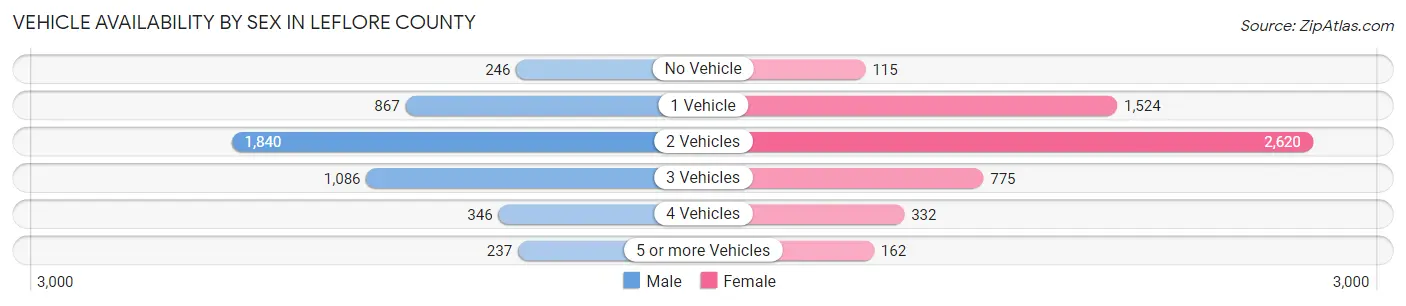
The most prevalent vehicle ownership categories in Leflore County are males with 2 vehicles (1,840, accounting for 39.8%) and females with 2 vehicles (2,620, making up 33.3%).
| Vehicles Available | Male | Female |
| No Vehicle | 246 (5.3%) | 115 (2.1%) |
| 1 Vehicle | 867 (18.8%) | 1,524 (27.6%) |
| 2 Vehicles | 1,840 (39.8%) | 2,620 (47.4%) |
| 3 Vehicles | 1,086 (23.5%) | 775 (14.0%) |
| 4 Vehicles | 346 (7.5%) | 332 (6.0%) |
| 5 or more Vehicles | 237 (5.1%) | 162 (2.9%) |
| Total | 4,622 (100.0%) | 5,528 (100.0%) |
Commute Time in Leflore County
The most frequently occuring commute durations in Leflore County are 10 to 14 minutes (3,710 commuters, 37.4%), 15 to 19 minutes (1,802 commuters, 18.2%), and 5 to 9 minutes (1,761 commuters, 17.7%).
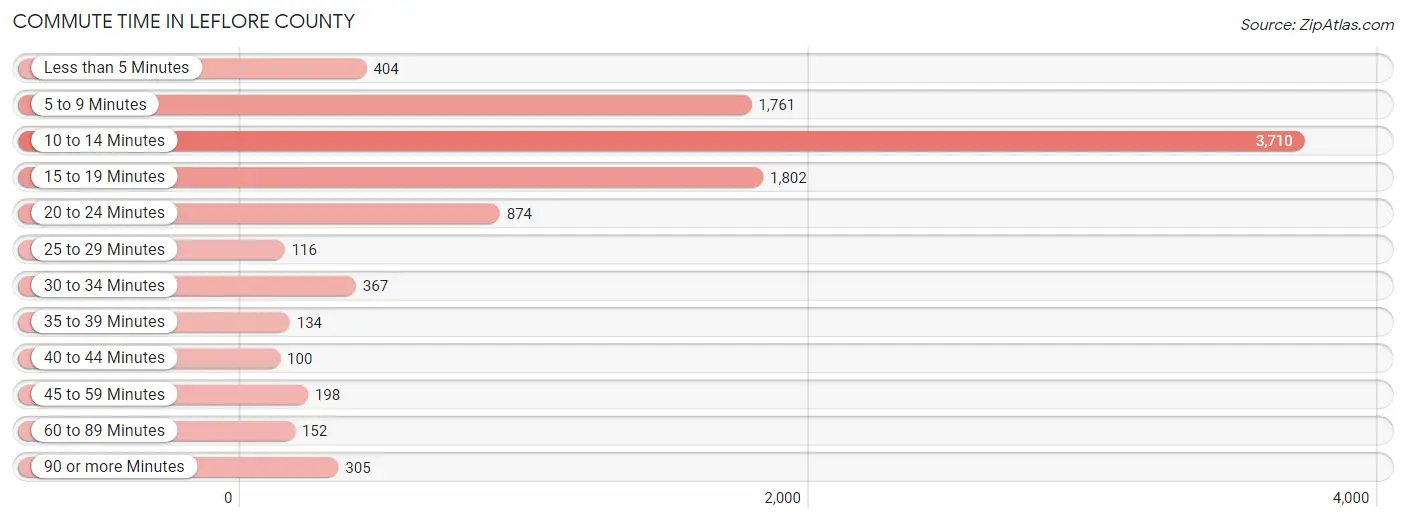
| Commute Time | # Commuters | % Commuters |
| Less than 5 Minutes | 404 | 4.1% |
| 5 to 9 Minutes | 1,761 | 17.7% |
| 10 to 14 Minutes | 3,710 | 37.4% |
| 15 to 19 Minutes | 1,802 | 18.2% |
| 20 to 24 Minutes | 874 | 8.8% |
| 25 to 29 Minutes | 116 | 1.2% |
| 30 to 34 Minutes | 367 | 3.7% |
| 35 to 39 Minutes | 134 | 1.3% |
| 40 to 44 Minutes | 100 | 1.0% |
| 45 to 59 Minutes | 198 | 2.0% |
| 60 to 89 Minutes | 152 | 1.5% |
| 90 or more Minutes | 305 | 3.1% |
Commute Time by Sex in Leflore County
The most common commute times in Leflore County are 10 to 14 minutes (1,675 commuters, 36.6%) for males and 10 to 14 minutes (2,035 commuters, 38.0%) for females.
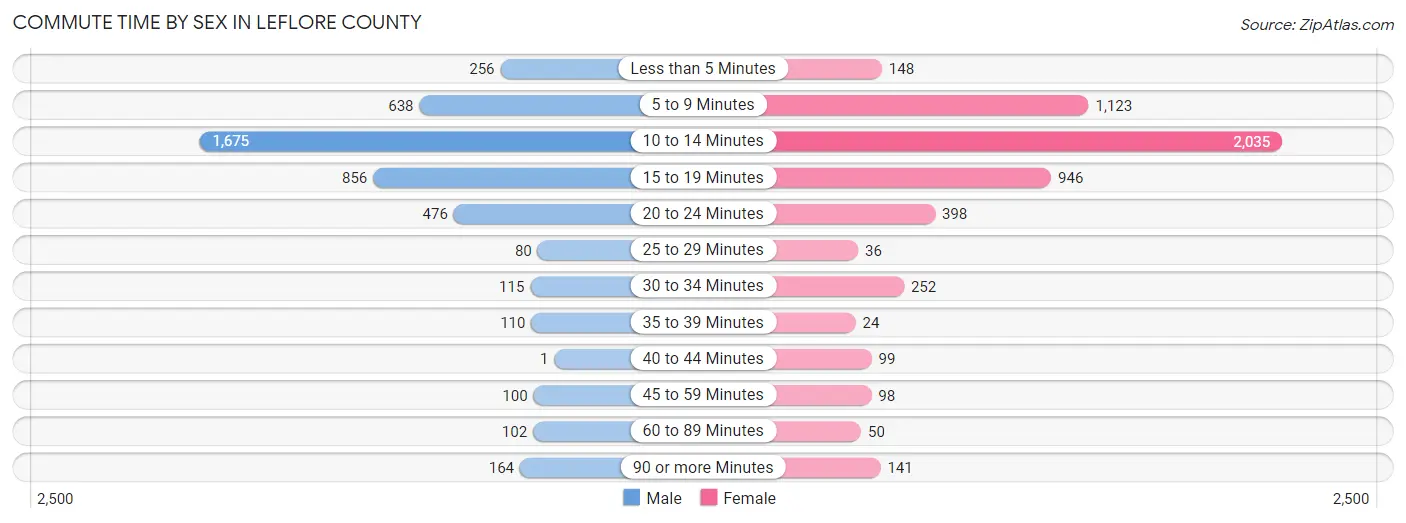
| Commute Time | Male | Female |
| Less than 5 Minutes | 256 (5.6%) | 148 (2.8%) |
| 5 to 9 Minutes | 638 (14.0%) | 1,123 (21.0%) |
| 10 to 14 Minutes | 1,675 (36.6%) | 2,035 (38.0%) |
| 15 to 19 Minutes | 856 (18.7%) | 946 (17.7%) |
| 20 to 24 Minutes | 476 (10.4%) | 398 (7.4%) |
| 25 to 29 Minutes | 80 (1.8%) | 36 (0.7%) |
| 30 to 34 Minutes | 115 (2.5%) | 252 (4.7%) |
| 35 to 39 Minutes | 110 (2.4%) | 24 (0.4%) |
| 40 to 44 Minutes | 1 (0.0%) | 99 (1.8%) |
| 45 to 59 Minutes | 100 (2.2%) | 98 (1.8%) |
| 60 to 89 Minutes | 102 (2.2%) | 50 (0.9%) |
| 90 or more Minutes | 164 (3.6%) | 141 (2.6%) |
Time of Departure to Work by Sex in Leflore County
The most frequent times of departure to work in Leflore County are 7:00 AM to 7:29 AM (1,333, 29.1%) for males and 7:00 AM to 7:29 AM (1,460, 27.3%) for females.
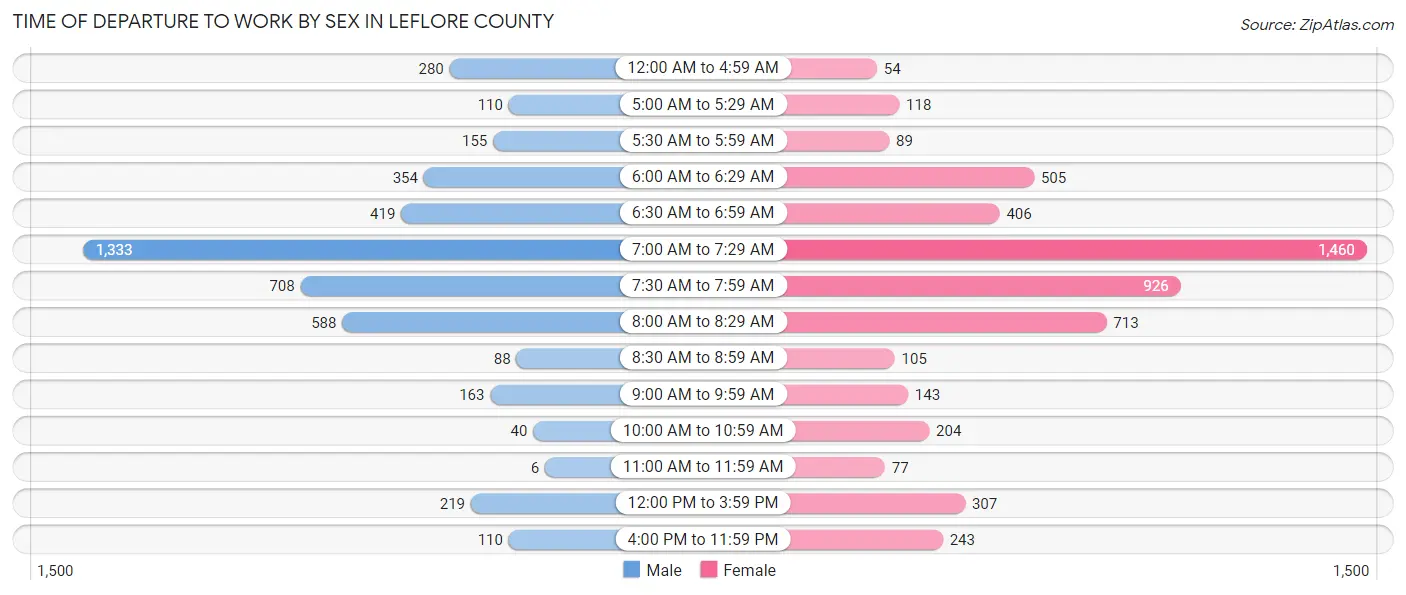
| Time of Departure | Male | Female |
| 12:00 AM to 4:59 AM | 280 (6.1%) | 54 (1.0%) |
| 5:00 AM to 5:29 AM | 110 (2.4%) | 118 (2.2%) |
| 5:30 AM to 5:59 AM | 155 (3.4%) | 89 (1.7%) |
| 6:00 AM to 6:29 AM | 354 (7.7%) | 505 (9.4%) |
| 6:30 AM to 6:59 AM | 419 (9.2%) | 406 (7.6%) |
| 7:00 AM to 7:29 AM | 1,333 (29.1%) | 1,460 (27.3%) |
| 7:30 AM to 7:59 AM | 708 (15.5%) | 926 (17.3%) |
| 8:00 AM to 8:29 AM | 588 (12.9%) | 713 (13.3%) |
| 8:30 AM to 8:59 AM | 88 (1.9%) | 105 (2.0%) |
| 9:00 AM to 9:59 AM | 163 (3.6%) | 143 (2.7%) |
| 10:00 AM to 10:59 AM | 40 (0.9%) | 204 (3.8%) |
| 11:00 AM to 11:59 AM | 6 (0.1%) | 77 (1.4%) |
| 12:00 PM to 3:59 PM | 219 (4.8%) | 307 (5.7%) |
| 4:00 PM to 11:59 PM | 110 (2.4%) | 243 (4.5%) |
| Total | 4,573 (100.0%) | 5,350 (100.0%) |
Housing Occupancy in Leflore County
Occupancy by Ownership in Leflore County
Of the total 9,656 dwellings in Leflore County, owner-occupied units account for 5,299 (54.9%), while renter-occupied units make up 4,357 (45.1%).
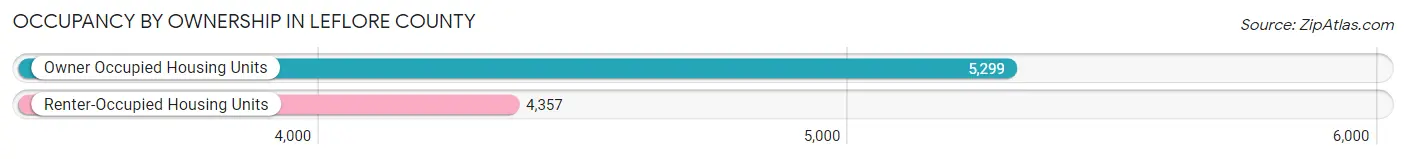
| Occupancy | # Housing Units | % Housing Units |
| Owner Occupied Housing Units | 5,299 | 54.9% |
| Renter-Occupied Housing Units | 4,357 | 45.1% |
| Total Occupied Housing Units | 9,656 | 100.0% |
Occupancy by Household Size in Leflore County
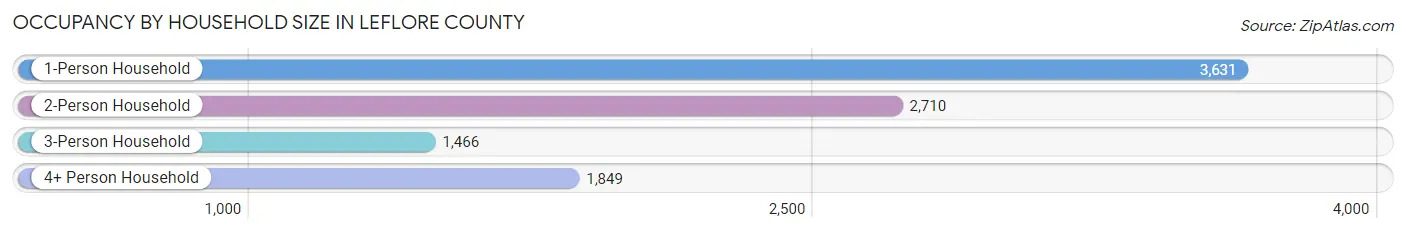
| Household Size | # Housing Units | % Housing Units |
| 1-Person Household | 3,631 | 37.6% |
| 2-Person Household | 2,710 | 28.1% |
| 3-Person Household | 1,466 | 15.2% |
| 4+ Person Household | 1,849 | 19.2% |
| Total Housing Units | 9,656 | 100.0% |
Occupancy by Ownership by Household Size in Leflore County
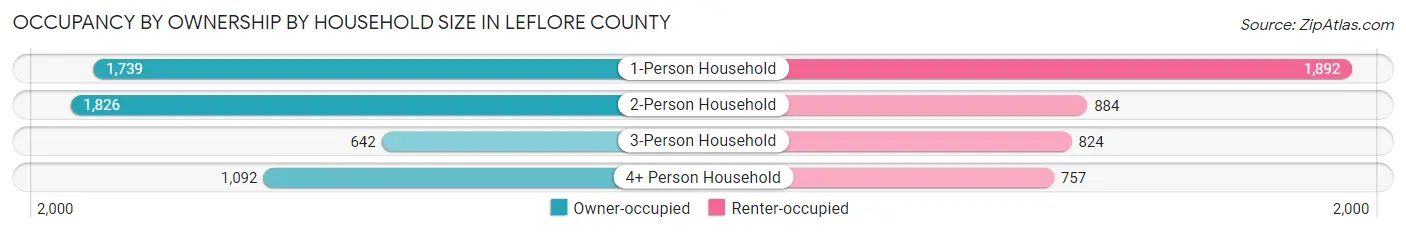
| Household Size | Owner-occupied | Renter-occupied |
| 1-Person Household | 1,739 (47.9%) | 1,892 (52.1%) |
| 2-Person Household | 1,826 (67.4%) | 884 (32.6%) |
| 3-Person Household | 642 (43.8%) | 824 (56.2%) |
| 4+ Person Household | 1,092 (59.1%) | 757 (40.9%) |
| Total Housing Units | 5,299 (54.9%) | 4,357 (45.1%) |
Occupancy by Educational Attainment in Leflore County
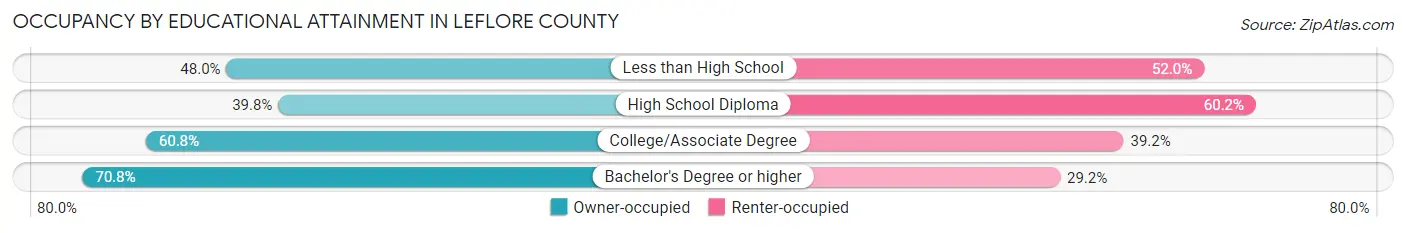
| Household Size | Owner-occupied | Renter-occupied |
| Less than High School | 694 (48.0%) | 752 (52.0%) |
| High School Diploma | 1,162 (39.8%) | 1,759 (60.2%) |
| College/Associate Degree | 1,832 (60.8%) | 1,183 (39.2%) |
| Bachelor's Degree or higher | 1,611 (70.8%) | 663 (29.2%) |
Occupancy by Age of Householder in Leflore County
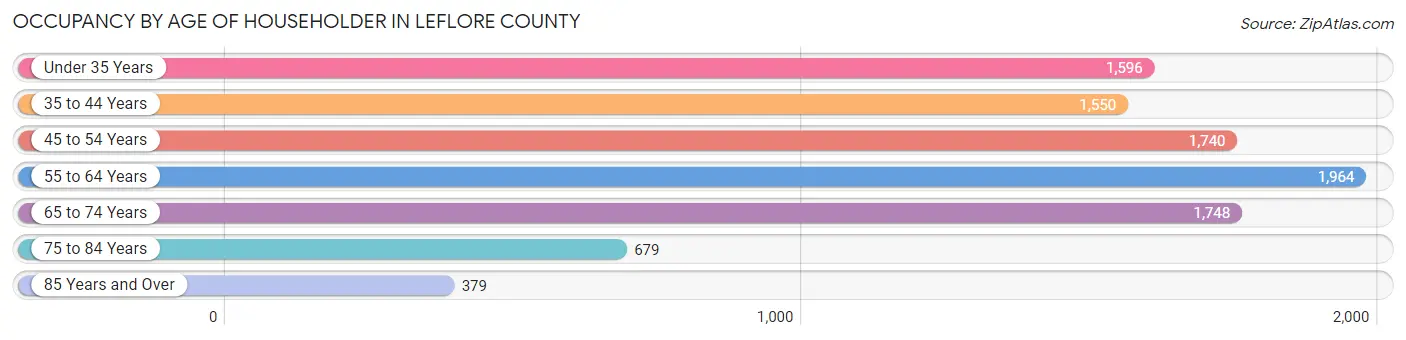
| Age Bracket | # Households | % Households |
| Under 35 Years | 1,596 | 16.5% |
| 35 to 44 Years | 1,550 | 16.1% |
| 45 to 54 Years | 1,740 | 18.0% |
| 55 to 64 Years | 1,964 | 20.3% |
| 65 to 74 Years | 1,748 | 18.1% |
| 75 to 84 Years | 679 | 7.0% |
| 85 Years and Over | 379 | 3.9% |
| Total | 9,656 | 100.0% |
Housing Finances in Leflore County
Median Income by Occupancy in Leflore County
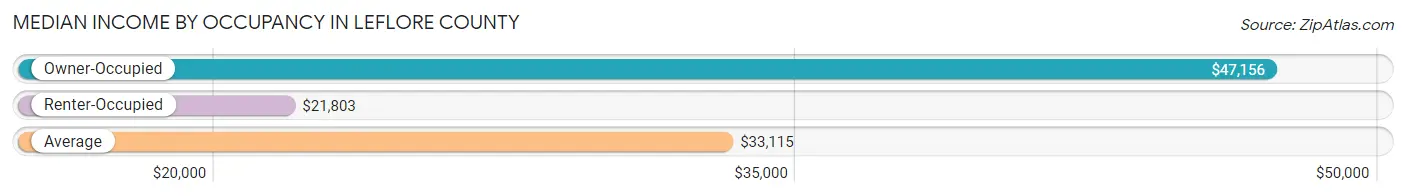
| Occupancy Type | # Households | Median Income |
| Owner-Occupied | 5,299 (54.9%) | $47,156 |
| Renter-Occupied | 4,357 (45.1%) | $21,803 |
| Average | 9,656 (100.0%) | $33,115 |
Occupancy by Householder Income Bracket in Leflore County
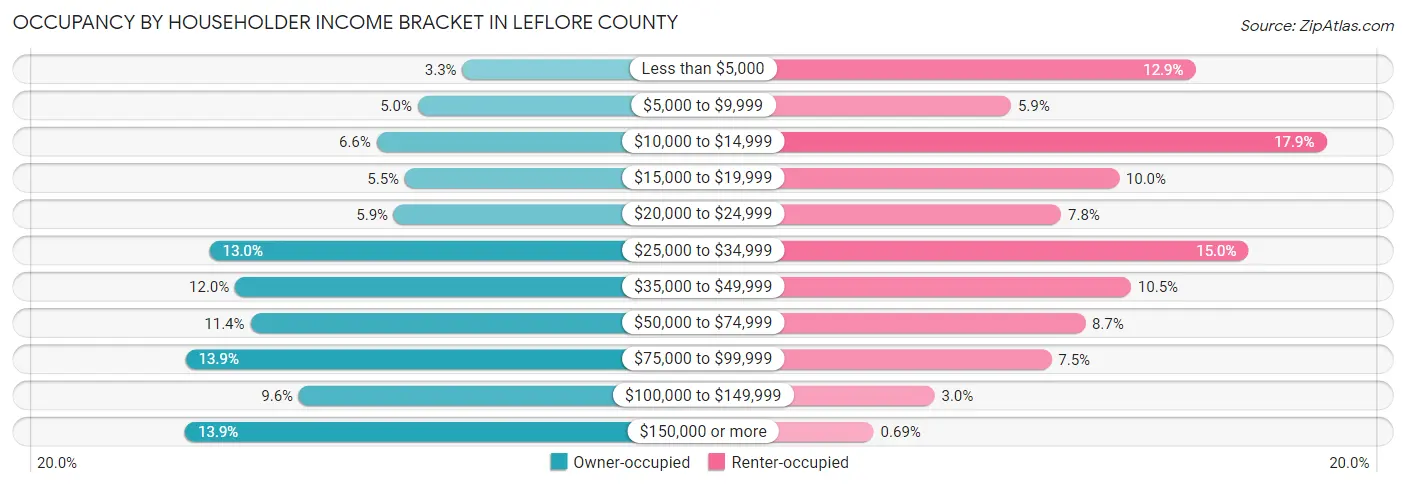
| Income Bracket | Owner-occupied | Renter-occupied |
| Less than $5,000 | 176 (3.3%) | 564 (12.9%) |
| $5,000 to $9,999 | 266 (5.0%) | 258 (5.9%) |
| $10,000 to $14,999 | 349 (6.6%) | 781 (17.9%) |
| $15,000 to $19,999 | 292 (5.5%) | 437 (10.0%) |
| $20,000 to $24,999 | 314 (5.9%) | 341 (7.8%) |
| $25,000 to $34,999 | 686 (13.0%) | 652 (15.0%) |
| $35,000 to $49,999 | 635 (12.0%) | 457 (10.5%) |
| $50,000 to $74,999 | 604 (11.4%) | 381 (8.7%) |
| $75,000 to $99,999 | 735 (13.9%) | 325 (7.5%) |
| $100,000 to $149,999 | 506 (9.6%) | 131 (3.0%) |
| $150,000 or more | 736 (13.9%) | 30 (0.7%) |
| Total | 5,299 (100.0%) | 4,357 (100.0%) |
Monthly Housing Cost Tiers in Leflore County
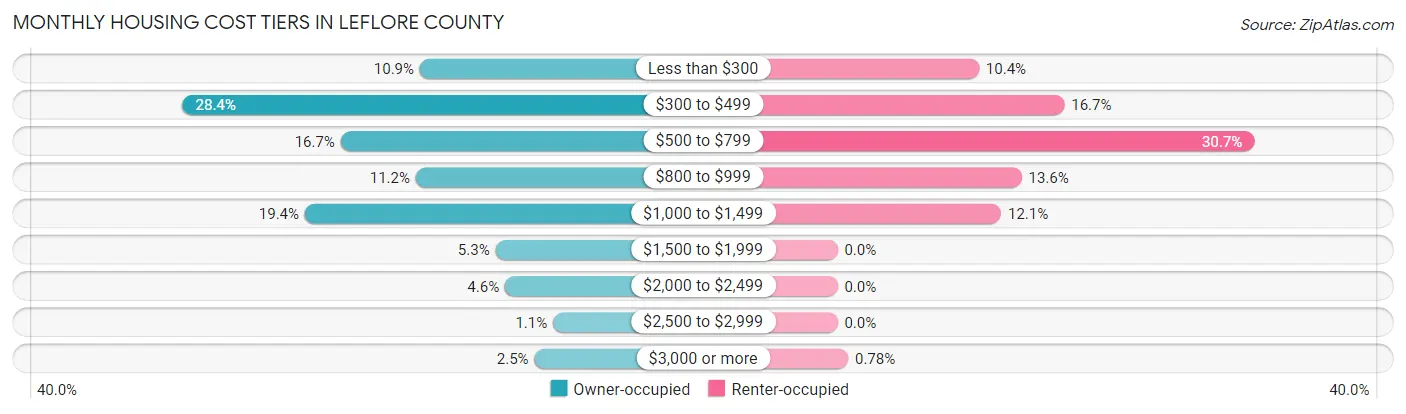
| Monthly Cost | Owner-occupied | Renter-occupied |
| Less than $300 | 577 (10.9%) | 454 (10.4%) |
| $300 to $499 | 1,503 (28.4%) | 728 (16.7%) |
| $500 to $799 | 886 (16.7%) | 1,337 (30.7%) |
| $800 to $999 | 593 (11.2%) | 591 (13.6%) |
| $1,000 to $1,499 | 1,026 (19.4%) | 525 (12.0%) |
| $1,500 to $1,999 | 282 (5.3%) | 0 (0.0%) |
| $2,000 to $2,499 | 245 (4.6%) | 0 (0.0%) |
| $2,500 to $2,999 | 57 (1.1%) | 0 (0.0%) |
| $3,000 or more | 130 (2.5%) | 34 (0.8%) |
| Total | 5,299 (100.0%) | 4,357 (100.0%) |
Physical Housing Characteristics in Leflore County
Housing Structures in Leflore County
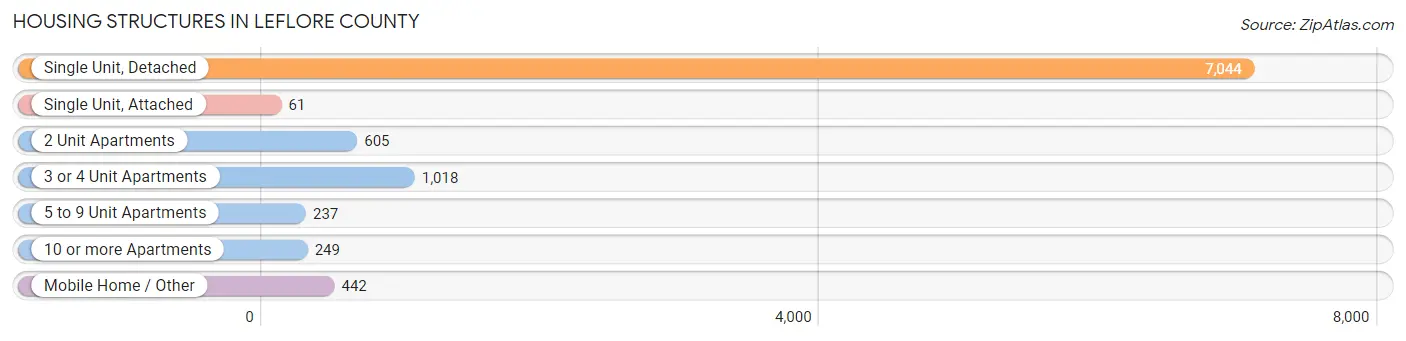
| Structure Type | # Housing Units | % Housing Units |
| Single Unit, Detached | 7,044 | 73.0% |
| Single Unit, Attached | 61 | 0.6% |
| 2 Unit Apartments | 605 | 6.3% |
| 3 or 4 Unit Apartments | 1,018 | 10.5% |
| 5 to 9 Unit Apartments | 237 | 2.5% |
| 10 or more Apartments | 249 | 2.6% |
| Mobile Home / Other | 442 | 4.6% |
| Total | 9,656 | 100.0% |
Housing Structures by Occupancy in Leflore County
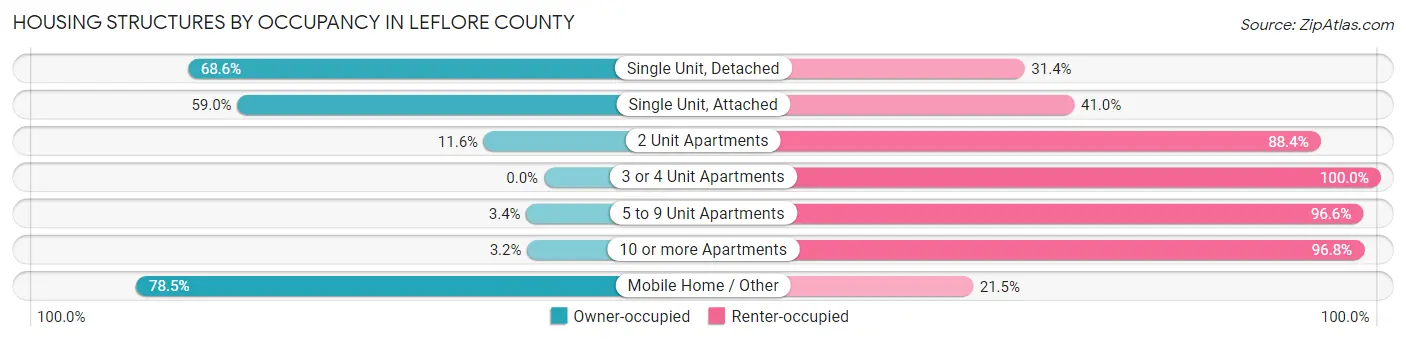
| Structure Type | Owner-occupied | Renter-occupied |
| Single Unit, Detached | 4,830 (68.6%) | 2,214 (31.4%) |
| Single Unit, Attached | 36 (59.0%) | 25 (41.0%) |
| 2 Unit Apartments | 70 (11.6%) | 535 (88.4%) |
| 3 or 4 Unit Apartments | 0 (0.0%) | 1,018 (100.0%) |
| 5 to 9 Unit Apartments | 8 (3.4%) | 229 (96.6%) |
| 10 or more Apartments | 8 (3.2%) | 241 (96.8%) |
| Mobile Home / Other | 347 (78.5%) | 95 (21.5%) |
| Total | 5,299 (54.9%) | 4,357 (45.1%) |
Housing Structures by Number of Rooms in Leflore County
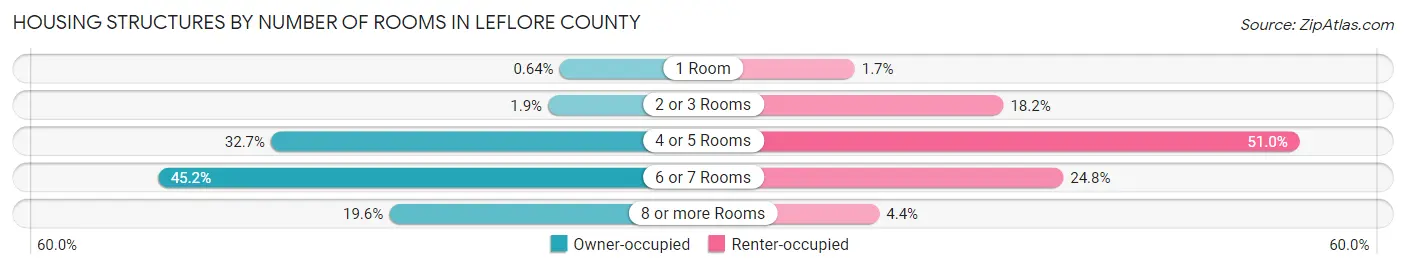
| Number of Rooms | Owner-occupied | Renter-occupied |
| 1 Room | 34 (0.6%) | 72 (1.7%) |
| 2 or 3 Rooms | 102 (1.9%) | 791 (18.1%) |
| 4 or 5 Rooms | 1,731 (32.7%) | 2,223 (51.0%) |
| 6 or 7 Rooms | 2,396 (45.2%) | 1,080 (24.8%) |
| 8 or more Rooms | 1,036 (19.6%) | 191 (4.4%) |
| Total | 5,299 (100.0%) | 4,357 (100.0%) |
Housing Structure by Heating Type in Leflore County
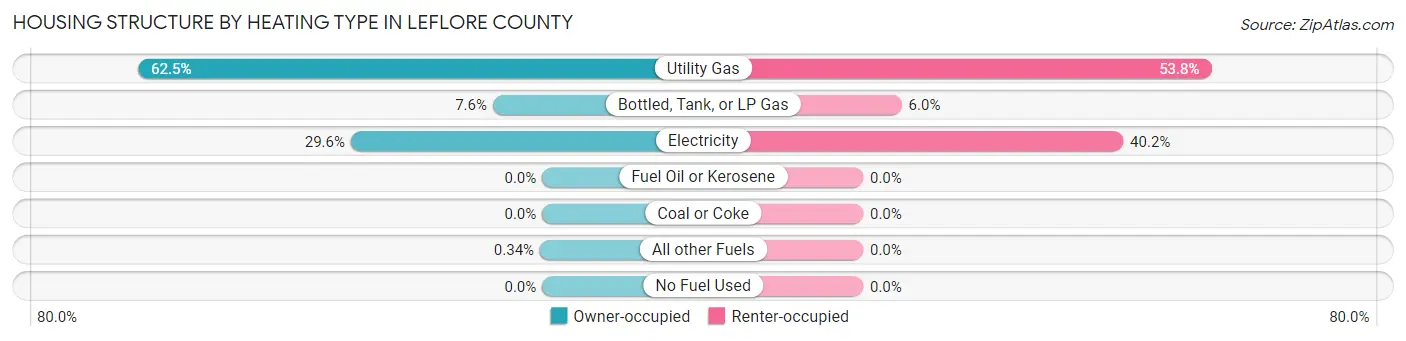
| Heating Type | Owner-occupied | Renter-occupied |
| Utility Gas | 3,310 (62.5%) | 2,345 (53.8%) |
| Bottled, Tank, or LP Gas | 404 (7.6%) | 260 (6.0%) |
| Electricity | 1,567 (29.6%) | 1,752 (40.2%) |
| Fuel Oil or Kerosene | 0 (0.0%) | 0 (0.0%) |
| Coal or Coke | 0 (0.0%) | 0 (0.0%) |
| All other Fuels | 18 (0.3%) | 0 (0.0%) |
| No Fuel Used | 0 (0.0%) | 0 (0.0%) |
| Total | 5,299 (100.0%) | 4,357 (100.0%) |
Household Vehicle Usage in Leflore County
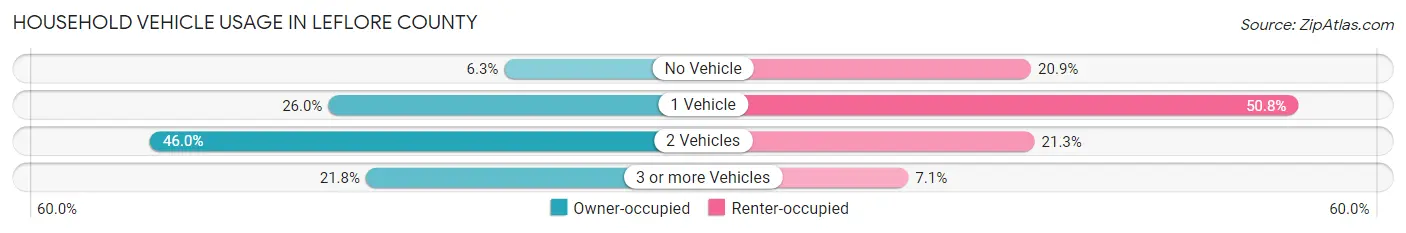
| Vehicles per Household | Owner-occupied | Renter-occupied |
| No Vehicle | 333 (6.3%) | 909 (20.9%) |
| 1 Vehicle | 1,377 (26.0%) | 2,212 (50.8%) |
| 2 Vehicles | 2,435 (46.0%) | 926 (21.2%) |
| 3 or more Vehicles | 1,154 (21.8%) | 310 (7.1%) |
| Total | 5,299 (100.0%) | 4,357 (100.0%) |
Real Estate & Mortgages in Leflore County
Real Estate and Mortgage Overview in Leflore County
| Characteristic | Without Mortgage | With Mortgage |
| Housing Units | 2,869 | 2,430 |
| Median Property Value | $82,800 | $118,400 |
| Median Household Income | $35,763 | $476 |
| Monthly Housing Costs | $417 | $130 |
| Real Estate Taxes | $902 | $604 |
Property Value by Mortgage Status in Leflore County
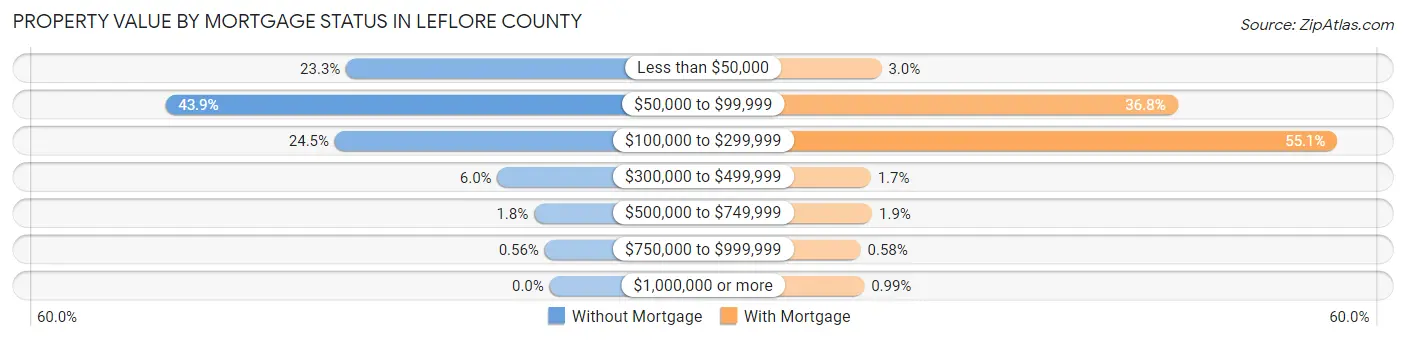
| Property Value | Without Mortgage | With Mortgage |
| Less than $50,000 | 667 (23.3%) | 72 (3.0%) |
| $50,000 to $99,999 | 1,260 (43.9%) | 894 (36.8%) |
| $100,000 to $299,999 | 704 (24.5%) | 1,338 (55.1%) |
| $300,000 to $499,999 | 171 (6.0%) | 42 (1.7%) |
| $500,000 to $749,999 | 51 (1.8%) | 46 (1.9%) |
| $750,000 to $999,999 | 16 (0.6%) | 14 (0.6%) |
| $1,000,000 or more | 0 (0.0%) | 24 (1.0%) |
| Total | 2,869 (100.0%) | 2,430 (100.0%) |
Household Income by Mortgage Status in Leflore County
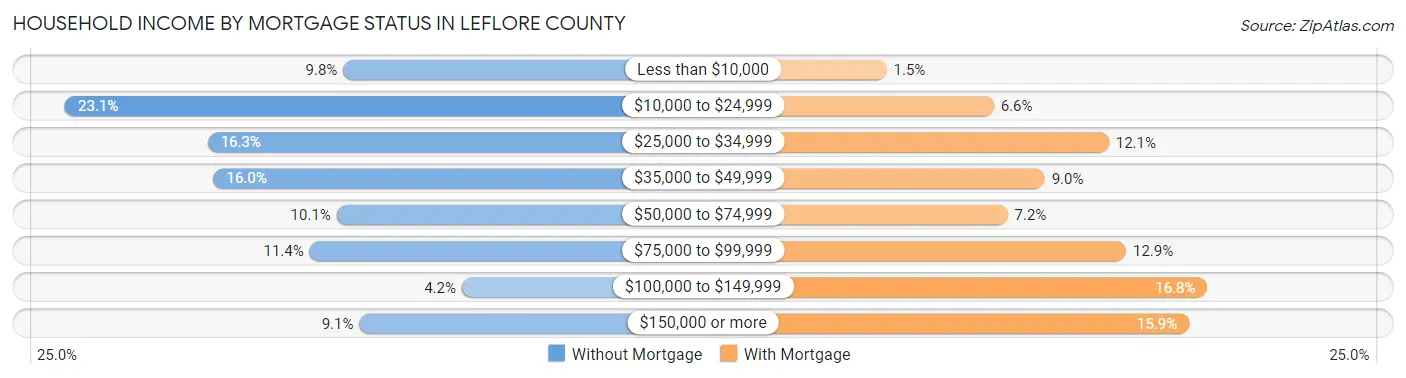
| Household Income | Without Mortgage | With Mortgage |
| Less than $10,000 | 282 (9.8%) | 36 (1.5%) |
| $10,000 to $24,999 | 662 (23.1%) | 160 (6.6%) |
| $25,000 to $34,999 | 467 (16.3%) | 293 (12.1%) |
| $35,000 to $49,999 | 459 (16.0%) | 219 (9.0%) |
| $50,000 to $74,999 | 291 (10.1%) | 176 (7.2%) |
| $75,000 to $99,999 | 328 (11.4%) | 313 (12.9%) |
| $100,000 to $149,999 | 120 (4.2%) | 407 (16.8%) |
| $150,000 or more | 260 (9.1%) | 386 (15.9%) |
| Total | 2,869 (100.0%) | 2,430 (100.0%) |
Property Value to Household Income Ratio in Leflore County
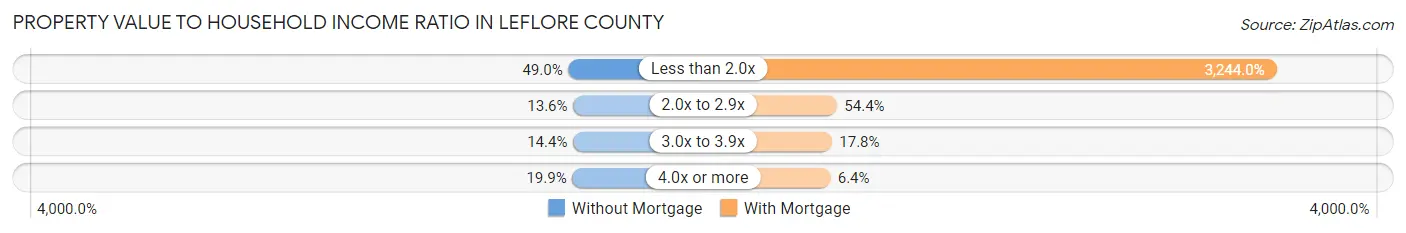
| Value-to-Income Ratio | Without Mortgage | With Mortgage |
| Less than 2.0x | 1,407 (49.0%) | 78,828 (3,244.0%) |
| 2.0x to 2.9x | 390 (13.6%) | 1,321 (54.4%) |
| 3.0x to 3.9x | 413 (14.4%) | 433 (17.8%) |
| 4.0x or more | 570 (19.9%) | 155 (6.4%) |
| Total | 2,869 (100.0%) | 2,430 (100.0%) |
Real Estate Taxes by Mortgage Status in Leflore County
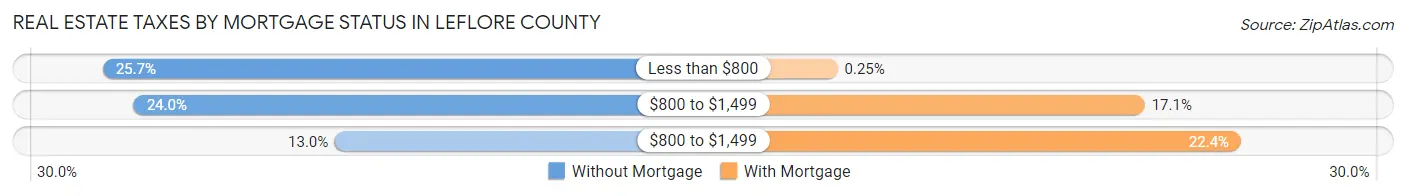
| Property Taxes | Without Mortgage | With Mortgage |
| Less than $800 | 738 (25.7%) | 6 (0.3%) |
| $800 to $1,499 | 689 (24.0%) | 415 (17.1%) |
| $800 to $1,499 | 374 (13.0%) | 543 (22.4%) |
| Total | 2,869 (100.0%) | 2,430 (100.0%) |
Health & Disability in Leflore County
Health Insurance Coverage by Age in Leflore County
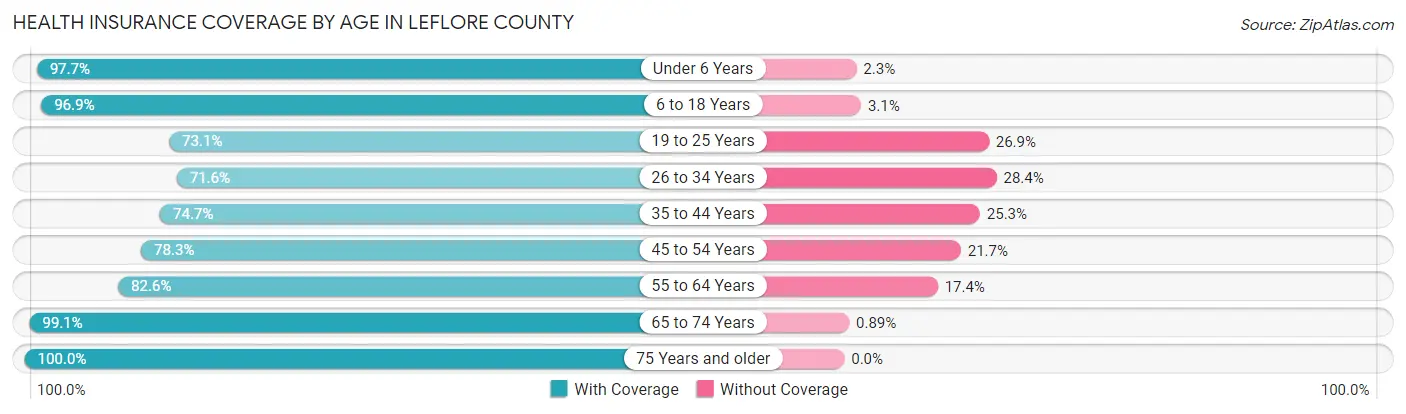
| Age Bracket | With Coverage | Without Coverage |
| Under 6 Years | 2,635 (97.7%) | 61 (2.3%) |
| 6 to 18 Years | 5,297 (96.9%) | 170 (3.1%) |
| 19 to 25 Years | 2,031 (73.1%) | 749 (26.9%) |
| 26 to 34 Years | 2,313 (71.6%) | 917 (28.4%) |
| 35 to 44 Years | 2,371 (74.7%) | 802 (25.3%) |
| 45 to 54 Years | 2,332 (78.3%) | 647 (21.7%) |
| 55 to 64 Years | 2,697 (82.6%) | 569 (17.4%) |
| 65 to 74 Years | 2,343 (99.1%) | 21 (0.9%) |
| 75 Years and older | 1,407 (100.0%) | 0 (0.0%) |
| Total | 23,426 (85.6%) | 3,936 (14.4%) |
Health Insurance Coverage by Citizenship Status in Leflore County
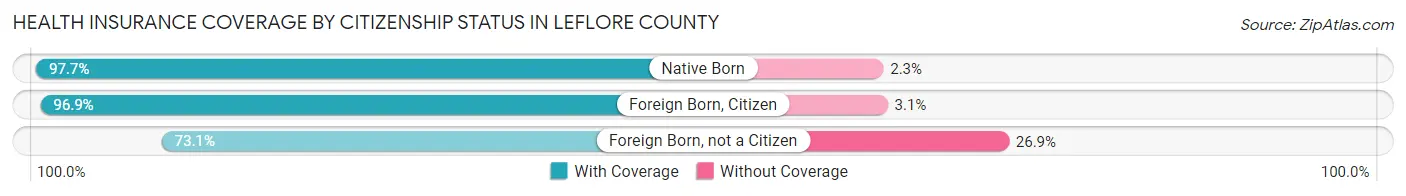
| Citizenship Status | With Coverage | Without Coverage |
| Native Born | 2,635 (97.7%) | 61 (2.3%) |
| Foreign Born, Citizen | 5,297 (96.9%) | 170 (3.1%) |
| Foreign Born, not a Citizen | 2,031 (73.1%) | 749 (26.9%) |
Health Insurance Coverage by Household Income in Leflore County
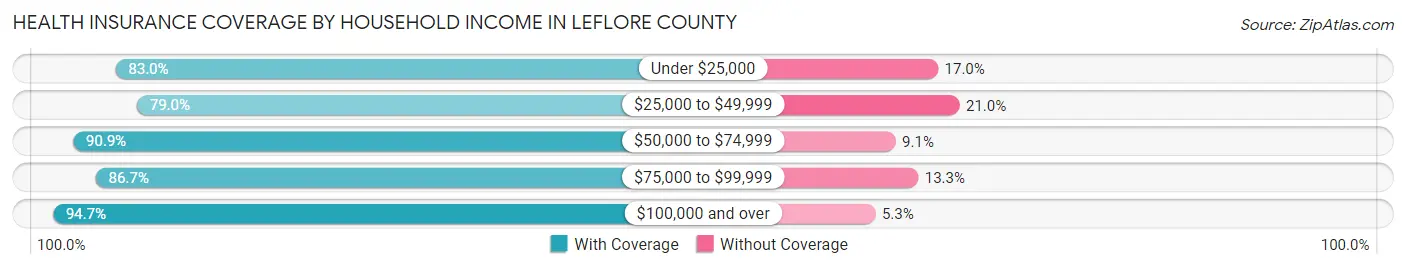
| Household Income | With Coverage | Without Coverage |
| Under $25,000 | 6,994 (83.0%) | 1,434 (17.0%) |
| $25,000 to $49,999 | 5,118 (79.0%) | 1,363 (21.0%) |
| $50,000 to $74,999 | 2,891 (90.9%) | 288 (9.1%) |
| $75,000 to $99,999 | 3,786 (86.7%) | 581 (13.3%) |
| $100,000 and over | 4,019 (94.7%) | 224 (5.3%) |
Public vs Private Health Insurance Coverage by Age in Leflore County
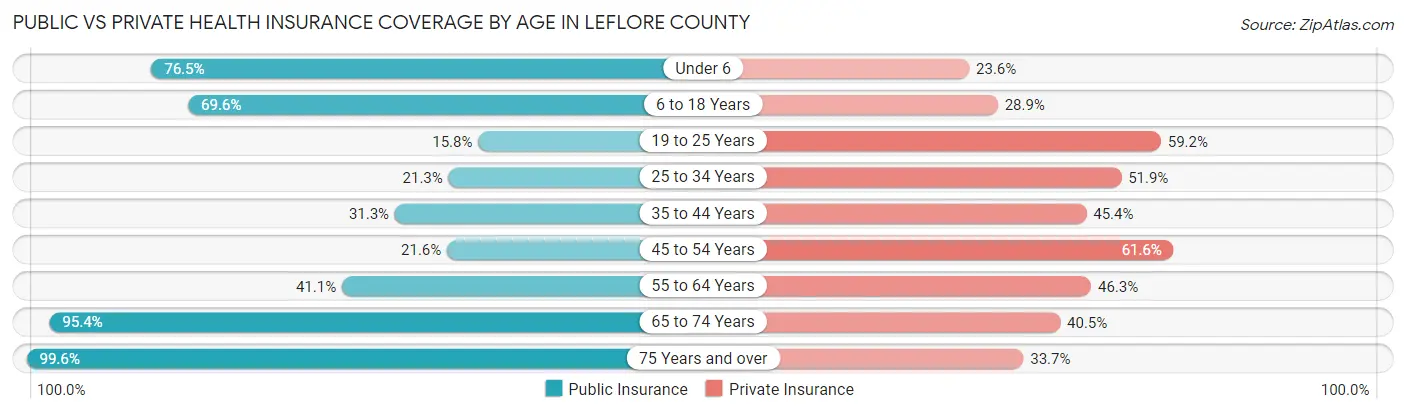
| Age Bracket | Public Insurance | Private Insurance |
| Under 6 | 2,062 (76.5%) | 637 (23.6%) |
| 6 to 18 Years | 3,807 (69.6%) | 1,582 (28.9%) |
| 19 to 25 Years | 439 (15.8%) | 1,646 (59.2%) |
| 25 to 34 Years | 688 (21.3%) | 1,675 (51.9%) |
| 35 to 44 Years | 992 (31.3%) | 1,440 (45.4%) |
| 45 to 54 Years | 643 (21.6%) | 1,835 (61.6%) |
| 55 to 64 Years | 1,342 (41.1%) | 1,511 (46.3%) |
| 65 to 74 Years | 2,255 (95.4%) | 958 (40.5%) |
| 75 Years and over | 1,402 (99.6%) | 474 (33.7%) |
| Total | 13,630 (49.8%) | 11,758 (43.0%) |
Disability Status by Sex by Age in Leflore County
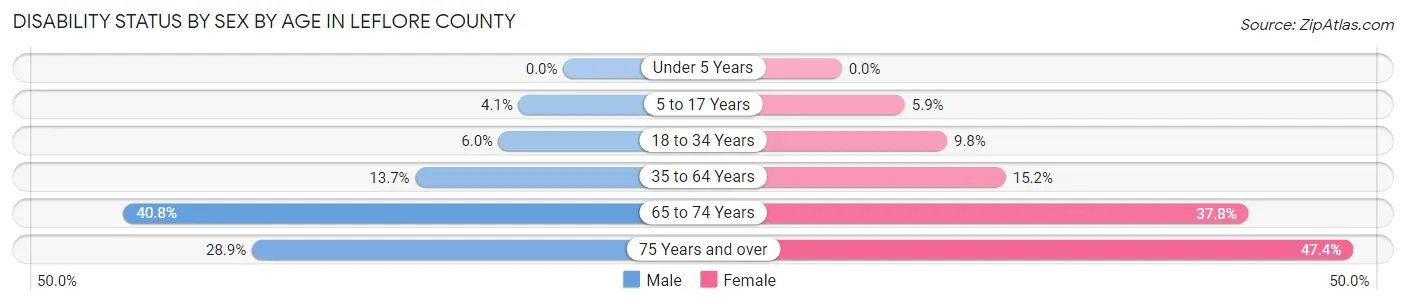
| Age Bracket | Male | Female |
| Under 5 Years | 0 (0.0%) | 0 (0.0%) |
| 5 to 17 Years | 117 (4.1%) | 160 (5.9%) |
| 18 to 34 Years | 182 (6.0%) | 329 (9.8%) |
| 35 to 64 Years | 575 (13.7%) | 796 (15.2%) |
| 65 to 74 Years | 407 (40.8%) | 516 (37.8%) |
| 75 Years and over | 130 (28.9%) | 454 (47.4%) |
Disability Class by Sex by Age in Leflore County
Disability Class: Hearing Difficulty
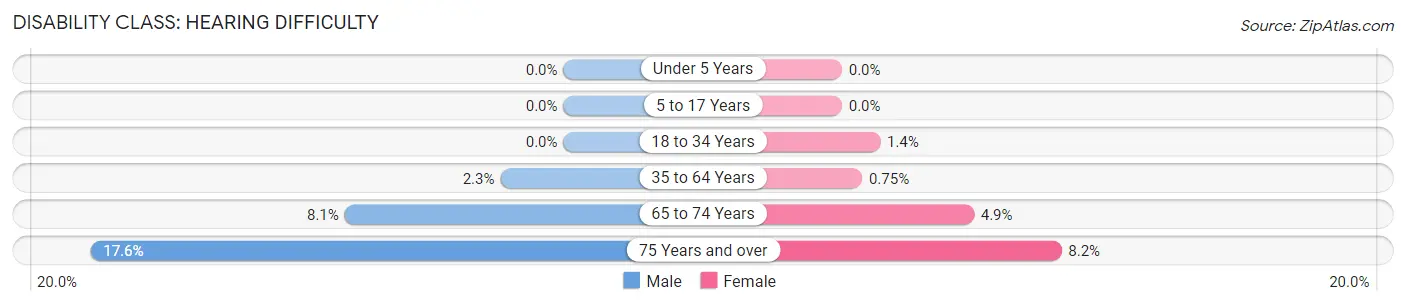
| Age Bracket | Male | Female |
| Under 5 Years | 0 (0.0%) | 0 (0.0%) |
| 5 to 17 Years | 0 (0.0%) | 0 (0.0%) |
| 18 to 34 Years | 0 (0.0%) | 48 (1.4%) |
| 35 to 64 Years | 98 (2.3%) | 39 (0.7%) |
| 65 to 74 Years | 81 (8.1%) | 67 (4.9%) |
| 75 Years and over | 79 (17.6%) | 78 (8.2%) |
Disability Class: Vision Difficulty
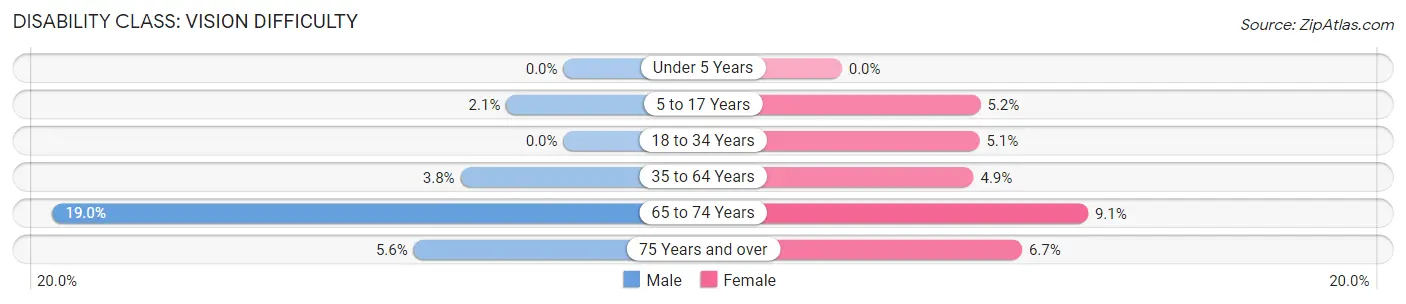
| Age Bracket | Male | Female |
| Under 5 Years | 0 (0.0%) | 0 (0.0%) |
| 5 to 17 Years | 60 (2.1%) | 141 (5.1%) |
| 18 to 34 Years | 0 (0.0%) | 172 (5.1%) |
| 35 to 64 Years | 160 (3.8%) | 256 (4.9%) |
| 65 to 74 Years | 189 (19.0%) | 125 (9.1%) |
| 75 Years and over | 25 (5.6%) | 64 (6.7%) |
Disability Class: Cognitive Difficulty
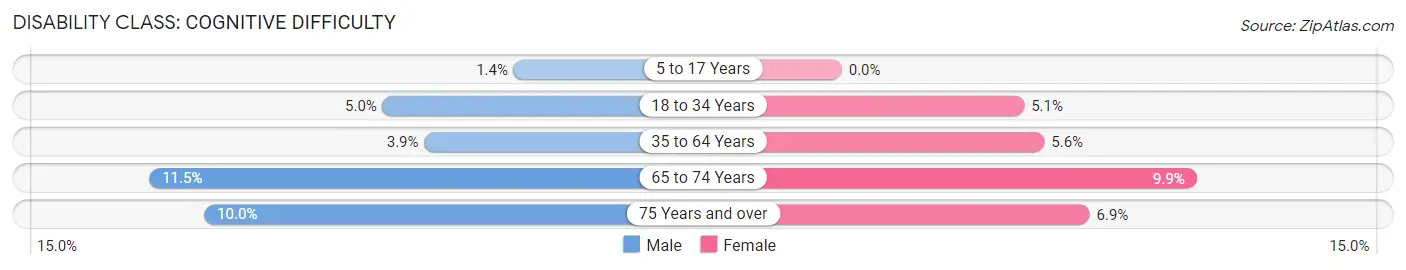
| Age Bracket | Male | Female |
| 5 to 17 Years | 39 (1.4%) | 0 (0.0%) |
| 18 to 34 Years | 153 (5.0%) | 171 (5.1%) |
| 35 to 64 Years | 162 (3.9%) | 295 (5.6%) |
| 65 to 74 Years | 115 (11.5%) | 135 (9.9%) |
| 75 Years and over | 45 (10.0%) | 66 (6.9%) |
Disability Class: Ambulatory Difficulty
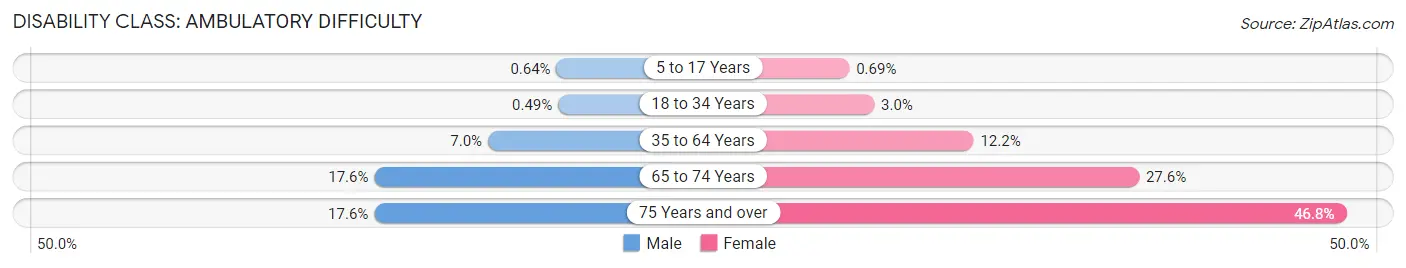
| Age Bracket | Male | Female |
| 5 to 17 Years | 18 (0.6%) | 19 (0.7%) |
| 18 to 34 Years | 15 (0.5%) | 101 (3.0%) |
| 35 to 64 Years | 293 (7.0%) | 639 (12.2%) |
| 65 to 74 Years | 175 (17.5%) | 377 (27.6%) |
| 75 Years and over | 79 (17.6%) | 448 (46.8%) |
Disability Class: Self-Care Difficulty
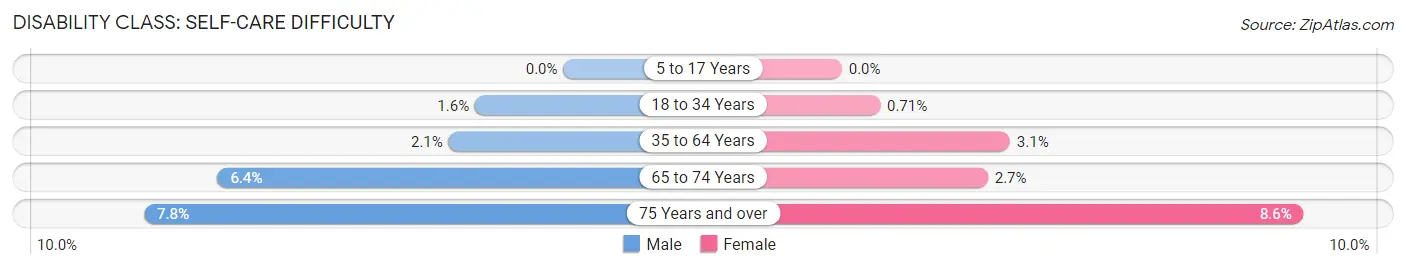
| Age Bracket | Male | Female |
| 5 to 17 Years | 0 (0.0%) | 0 (0.0%) |
| 18 to 34 Years | 50 (1.6%) | 24 (0.7%) |
| 35 to 64 Years | 89 (2.1%) | 163 (3.1%) |
| 65 to 74 Years | 64 (6.4%) | 37 (2.7%) |
| 75 Years and over | 35 (7.8%) | 82 (8.6%) |
Technology Access in Leflore County
Computing Device Access in Leflore County
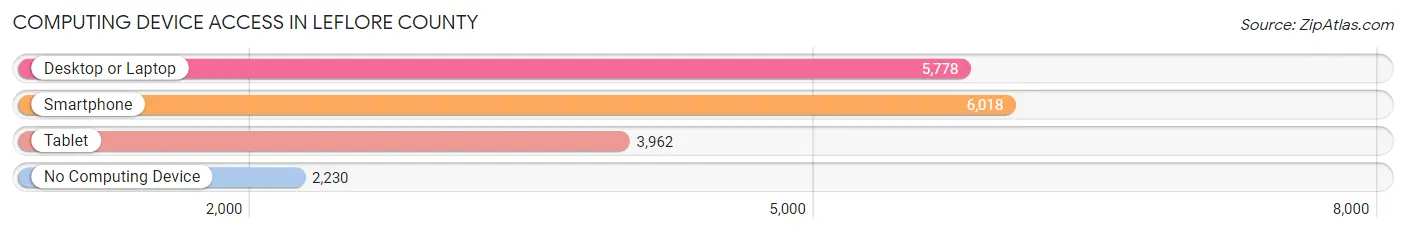
| Device Type | # Households | % Households |
| Desktop or Laptop | 5,778 | 59.8% |
| Smartphone | 6,018 | 62.3% |
| Tablet | 3,962 | 41.0% |
| No Computing Device | 2,230 | 23.1% |
| Total | 9,656 | 100.0% |
Internet Access in Leflore County
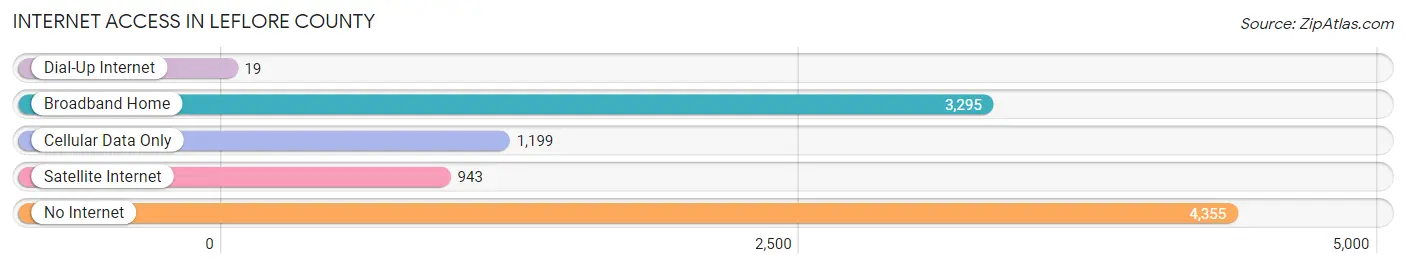
| Internet Type | # Households | % Households |
| Dial-Up Internet | 19 | 0.2% |
| Broadband Home | 3,295 | 34.1% |
| Cellular Data Only | 1,199 | 12.4% |
| Satellite Internet | 943 | 9.8% |
| No Internet | 4,355 | 45.1% |
| Total | 9,656 | 100.0% |
Leflore County Summary
Leflore County, Mississippi is located in the northwestern corner of the state, and is bordered by the Mississippi River to the west, the Yazoo River to the east, and the Tallahatchie River to the south. It is part of the Delta region of Mississippi, and is known for its rich agricultural heritage. The county seat is Greenwood, and the population was 32,317 at the 2010 census.
History
Leflore County was established in 1871, and was named for Choctaw Chief Greenwood Leflore. The county was formed from parts of Carroll, Sunflower, and Tallahatchie counties. The county was originally part of the Choctaw Nation, and was ceded to the United States in the Treaty of Dancing Rabbit Creek in 1830.
The county was home to many prominent African-American leaders during the Civil Rights Movement, including Medgar Evers, Fannie Lou Hamer, and Amzie Moore. The county was also the site of the infamous 1955 lynching of Emmett Till, a 14-year-old African-American boy who was accused of whistling at a white woman.
Geography
Leflore County is located in the northwestern corner of Mississippi, and is bordered by the Mississippi River to the west, the Yazoo River to the east, and the Tallahatchie River to the south. The county is part of the Delta region of Mississippi, and is known for its rich agricultural heritage. The county is mostly flat, with some rolling hills in the northern part of the county. The county is home to several lakes, including Lake Leflore, Lake Mary Crawford, and Lake Lee.
The county has a total area of 576 square miles, of which 571 square miles is land and 5.2 square miles is water. The county is home to several state parks, including the John W. Kyle State Park, the Lake Lee State Park, and the Lake Mary Crawford State Park.
Economy
Leflore County is known for its rich agricultural heritage, and is home to many farms and ranches. The county is also home to several manufacturing companies, including the Greenwood Mills, the Delta Pine and Land Company, and the Delta Wood Products Company.
The county is also home to several casinos, including the Silver Star Casino and the Golden Moon Casino. The casinos are located in the city of Philadelphia, and are owned by the Mississippi Band of Choctaw Indians.
Demographics
As of the 2010 census, there were 32,317 people, 11,845 households, and 8,072 families living in the county. The population density was 56.3 people per square mile. The racial makeup of the county was 57.3% African American, 40.2% White, 0.3% Native American, 0.2% Asian, 0.1% Pacific Islander, 0.7% from other races, and 1.3% from two or more races.
The median income for a household in the county was $25,945, and the median income for a family was $31,945. The per capita income for the county was $14,845. About 24.3% of the population was below the poverty line.
Common Questions
What is Per Capita Income in Leflore County?
Per Capita income in Leflore County is $23,281.
What is the Median Family Income in Leflore County?
Median Family Income in Leflore County is $40,600.
What is the Median Household income in Leflore County?
Median Household Income in Leflore County is $33,115.
What is Income or Wage Gap in Leflore County?
Income or Wage Gap in Leflore County is 20.9%.
Women in Leflore County earn 79.1 cents for every dollar earned by a man.
What is Family Income Deficit in Leflore County?
Family Income Deficit in Leflore County is $12,650.
Families that are below poverty line in Leflore County earn $12,650 less on average than the poverty threshold level.
What is Inequality or Gini Index in Leflore County?
Inequality or Gini Index in Leflore County is 0.57.
What is the Total Population of Leflore County?
Total Population of Leflore County is 27,920.
What is the Total Male Population of Leflore County?
Total Male Population of Leflore County is 13,124.
What is the Total Female Population of Leflore County?
Total Female Population of Leflore County is 14,796.
What is the Ratio of Males per 100 Females in Leflore County?
There are 88.70 Males per 100 Females in Leflore County.
What is the Ratio of Females per 100 Males in Leflore County?
There are 112.74 Females per 100 Males in Leflore County.
What is the Median Population Age in Leflore County?
Median Population Age in Leflore County is 34.4 Years.
What is the Average Family Size in Leflore County
Average Family Size in Leflore County is 3.8 People.
What is the Average Household Size in Leflore County
Average Household Size in Leflore County is 2.8 People.
How Large is the Labor Force in Leflore County?
There are 11,726 People in the Labor Forcein in Leflore County.
What is the Percentage of People in the Labor Force in Leflore County?
56.1% of People are in the Labor Force in Leflore County.
What is the Unemployment Rate in Leflore County?
Unemployment Rate in Leflore County is 11.8%.