Jefferson County, MS Map & Demographics
Jefferson County Map
Jefferson County Overview
$19,366
PER CAPITA INCOME
$37,130
AVG FAMILY INCOME
$31,544
AVG HOUSEHOLD INCOME
11.8%
WAGE / INCOME GAP [ % ]
88.2¢/ $1
WAGE / INCOME GAP [ $ ]
$14,760
FAMILY INCOME DEFICIT
0.51
INEQUALITY / GINI INDEX
7,207
TOTAL POPULATION
3,448
MALE POPULATION
3,759
FEMALE POPULATION
91.73
MALES / 100 FEMALES
109.02
FEMALES / 100 MALES
41.3
MEDIAN AGE
3.2
AVG FAMILY SIZE
2.7
AVG HOUSEHOLD SIZE
2,283
LABOR FORCE [ PEOPLE ]
39.2%
PERCENT IN LABOR FORCE
5.4%
UNEMPLOYMENT RATE
Jefferson County Area Codes
Income in Jefferson County
Income Overview in Jefferson County
Per Capita Income in Jefferson County is $19,366, while median incomes of families and households are $37,130 and $31,544 respectively.
| Characteristic | Number | Measure |
| Per Capita Income | 7,207 | $19,366 |
| Median Family Income | 1,820 | $37,130 |
| Mean Family Income | 1,820 | $58,346 |
| Median Household Income | 2,530 | $31,544 |
| Mean Household Income | 2,530 | $50,112 |
| Income Deficit | 1,820 | $14,760 |
| Wage / Income Gap (%) | 7,207 | 11.76% |
| Wage / Income Gap ($) | 7,207 | 88.24¢ per $1 |
| Gini / Inequality Index | 7,207 | 0.51 |
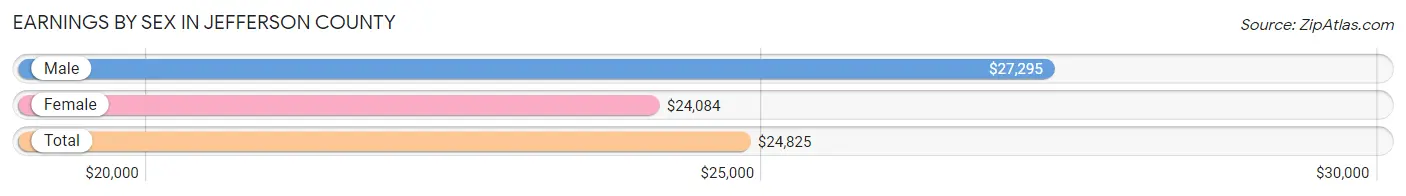
Earnings by Sex in Jefferson County
Average Earnings in Jefferson County are $24,825, $27,295 for men and $24,084 for women, a difference of 11.8%.
| Sex | Number | Average Earnings |
| Male | 1,191 (44.0%) | $27,295 |
| Female | 1,517 (56.0%) | $24,084 |
| Total | 2,708 (100.0%) | $24,825 |
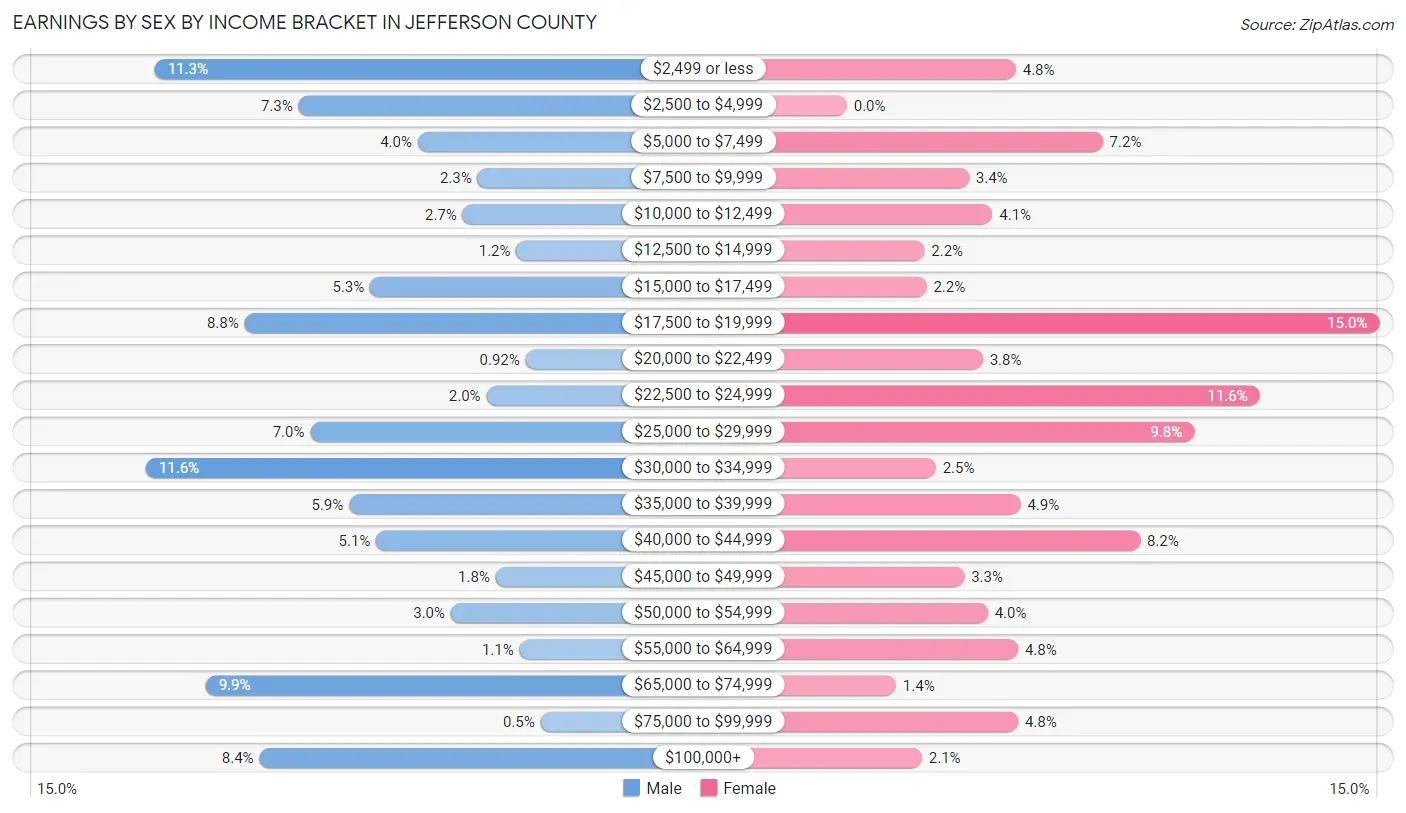
Earnings by Sex by Income Bracket in Jefferson County
The most common earnings brackets in Jefferson County are $30,000 to $34,999 for men (138 | 11.6%) and $17,500 to $19,999 for women (227 | 15.0%).
| Income | Male | Female |
| $2,499 or less | 135 (11.3%) | 72 (4.8%) |
| $2,500 to $4,999 | 87 (7.3%) | 0 (0.0%) |
| $5,000 to $7,499 | 47 (4.0%) | 109 (7.2%) |
| $7,500 to $9,999 | 27 (2.3%) | 52 (3.4%) |
| $10,000 to $12,499 | 32 (2.7%) | 62 (4.1%) |
| $12,500 to $14,999 | 14 (1.2%) | 33 (2.2%) |
| $15,000 to $17,499 | 63 (5.3%) | 34 (2.2%) |
| $17,500 to $19,999 | 105 (8.8%) | 227 (15.0%) |
| $20,000 to $22,499 | 11 (0.9%) | 58 (3.8%) |
| $22,500 to $24,999 | 24 (2.0%) | 176 (11.6%) |
| $25,000 to $29,999 | 83 (7.0%) | 148 (9.8%) |
| $30,000 to $34,999 | 138 (11.6%) | 38 (2.5%) |
| $35,000 to $39,999 | 70 (5.9%) | 74 (4.9%) |
| $40,000 to $44,999 | 61 (5.1%) | 125 (8.2%) |
| $45,000 to $49,999 | 21 (1.8%) | 50 (3.3%) |
| $50,000 to $54,999 | 36 (3.0%) | 60 (4.0%) |
| $55,000 to $64,999 | 13 (1.1%) | 73 (4.8%) |
| $65,000 to $74,999 | 118 (9.9%) | 21 (1.4%) |
| $75,000 to $99,999 | 6 (0.5%) | 73 (4.8%) |
| $100,000+ | 100 (8.4%) | 32 (2.1%) |
| Total | 1,191 (100.0%) | 1,517 (100.0%) |
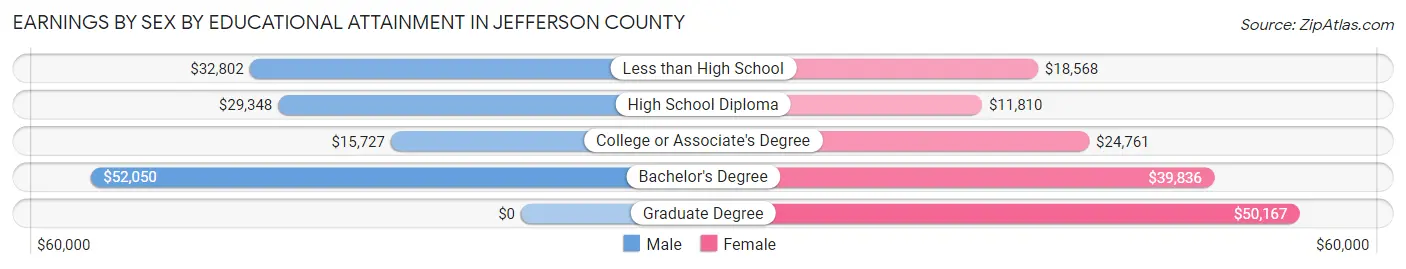
Earnings by Sex by Educational Attainment in Jefferson County
Average earnings in Jefferson County are $33,291 for men and $24,375 for women, a difference of 26.8%. Men with an educational attainment of bachelor's degree enjoy the highest average annual earnings of $52,050, while those with college or associate's degree education earn the least with $15,727. Women with an educational attainment of graduate degree earn the most with the average annual earnings of $50,167, while those with high school diploma education have the smallest earnings of $11,810.
| Educational Attainment | Male Income | Female Income |
| Less than High School | $32,802 | $18,568 |
| High School Diploma | $29,348 | $11,810 |
| College or Associate's Degree | $15,727 | $24,761 |
| Bachelor's Degree | $52,050 | $39,836 |
| Graduate Degree | - | - |
| Total | $33,291 | $24,375 |
Family Income in Jefferson County
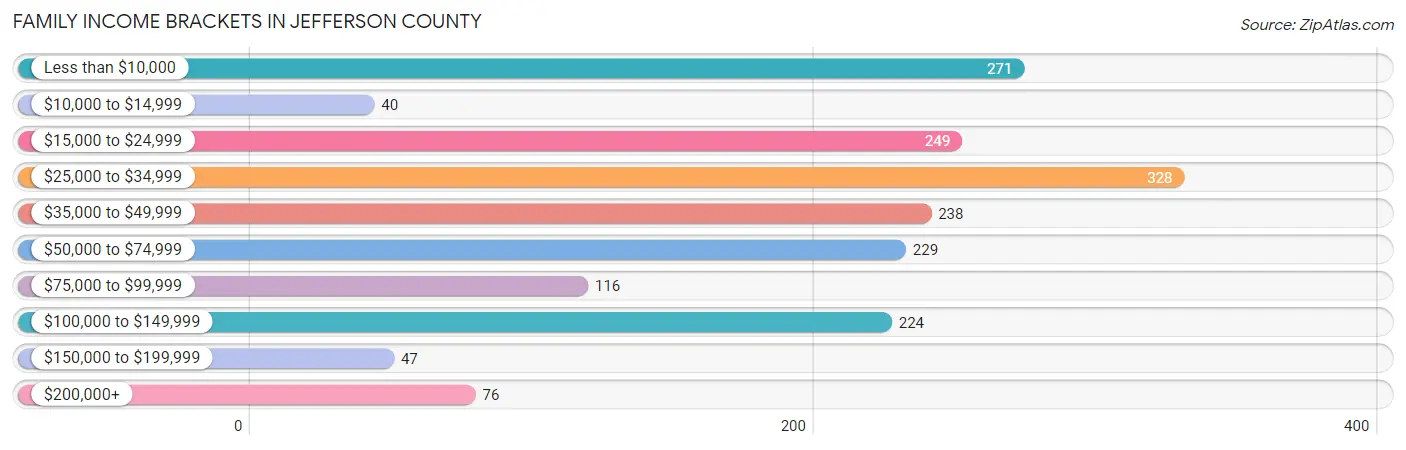
Family Income Brackets in Jefferson County
According to the Jefferson County family income data, there are 328 families falling into the $25,000 to $34,999 income range, which is the most common income bracket and makes up 18.0% of all families. Conversely, the $10,000 to $14,999 income bracket is the least frequent group with only 40 families (2.2%) belonging to this category.
| Income Bracket | # Families | % Families |
| Less than $10,000 | 271 | 14.9% |
| $10,000 to $14,999 | 40 | 2.2% |
| $15,000 to $24,999 | 249 | 13.7% |
| $25,000 to $34,999 | 328 | 18.0% |
| $35,000 to $49,999 | 238 | 13.1% |
| $50,000 to $74,999 | 229 | 12.6% |
| $75,000 to $99,999 | 116 | 6.4% |
| $100,000 to $149,999 | 224 | 12.3% |
| $150,000 to $199,999 | 47 | 2.6% |
| $200,000+ | 76 | 4.2% |
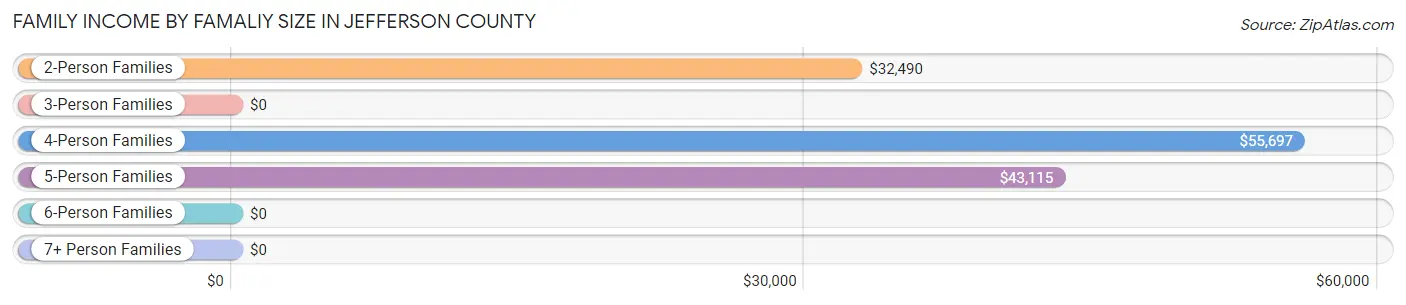
Family Income by Famaliy Size in Jefferson County
4-person families (286 | 15.7%) account for the highest median family income in Jefferson County with $55,697 per family, while 2-person families (695 | 38.2%) have the highest median income of $16,245 per family member.
| Income Bracket | # Families | Median Income |
| 2-Person Families | 695 (38.2%) | $32,490 |
| 3-Person Families | 574 (31.5%) | $0 |
| 4-Person Families | 286 (15.7%) | $55,697 |
| 5-Person Families | 228 (12.5%) | $43,115 |
| 6-Person Families | 18 (1.0%) | $0 |
| 7+ Person Families | 19 (1.0%) | $0 |
| Total | 1,820 (100.0%) | $37,130 |
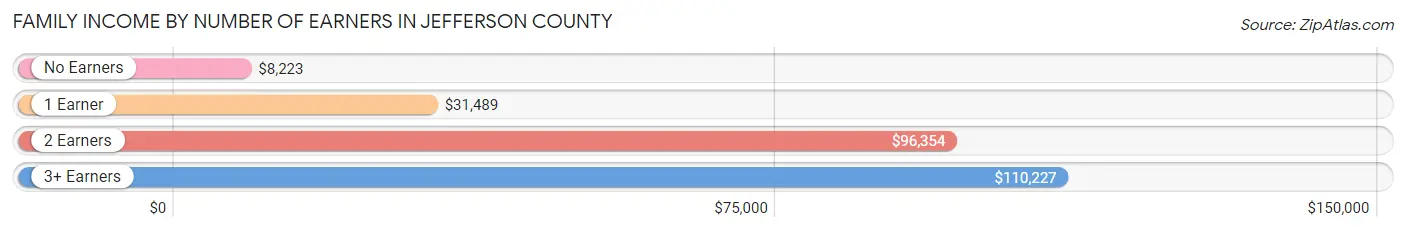
Family Income by Number of Earners in Jefferson County
The median family income in Jefferson County is $37,130, with families comprising 3+ earners (168) having the highest median family income of $110,227, while families with no earners (429) have the lowest median family income of $8,223, accounting for 9.2% and 23.6% of families, respectively.
| Number of Earners | # Families | Median Income |
| No Earners | 429 (23.6%) | $8,223 |
| 1 Earner | 895 (49.2%) | $31,489 |
| 2 Earners | 328 (18.0%) | $96,354 |
| 3+ Earners | 168 (9.2%) | $110,227 |
| Total | 1,820 (100.0%) | $37,130 |
Household Income in Jefferson County
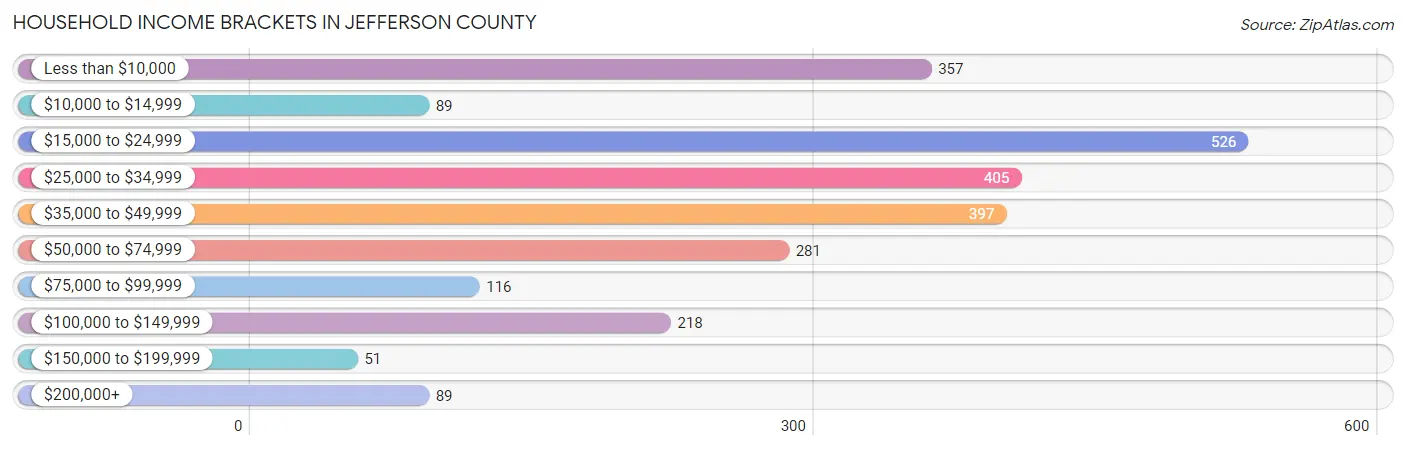
Household Income Brackets in Jefferson County
With 526 households falling in the category, the $15,000 to $24,999 income range is the most frequent in Jefferson County, accounting for 20.8% of all households. In contrast, only 51 households (2.0%) fall into the $150,000 to $199,999 income bracket, making it the least populous group.
| Income Bracket | # Households | % Households |
| Less than $10,000 | 357 | 14.1% |
| $10,000 to $14,999 | 89 | 3.5% |
| $15,000 to $24,999 | 526 | 20.8% |
| $25,000 to $34,999 | 405 | 16.0% |
| $35,000 to $49,999 | 397 | 15.7% |
| $50,000 to $74,999 | 281 | 11.1% |
| $75,000 to $99,999 | 116 | 4.6% |
| $100,000 to $149,999 | 218 | 8.6% |
| $150,000 to $199,999 | 51 | 2.0% |
| $200,000+ | 89 | 3.5% |
Household Income by Householder Age in Jefferson County
The median household income in Jefferson County is $31,544, with the highest median household income of $42,582 found in the 65+ years age bracket for the primary householder. A total of 896 households (35.4%) fall into this category. Meanwhile, the 15 to 24 years age bracket for the primary householder has the lowest median household income of $0, with 21 households (0.8%) in this group.
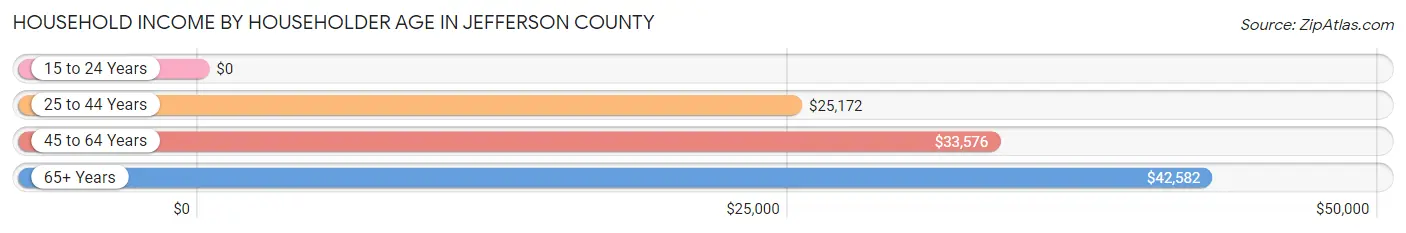
| Income Bracket | # Households | Median Income |
| 15 to 24 Years | 21 (0.8%) | $0 |
| 25 to 44 Years | 646 (25.5%) | $25,172 |
| 45 to 64 Years | 967 (38.2%) | $33,576 |
| 65+ Years | 896 (35.4%) | $42,582 |
| Total | 2,530 (100.0%) | $31,544 |
Poverty in Jefferson County
Income Below Poverty by Sex and Age in Jefferson County
With 32.0% poverty level for males and 31.6% for females among the residents of Jefferson County, 12 to 14 year old males and 15 year old females are the most vulnerable to poverty, with 70 males (92.1%) and 10 females (100.0%) in their respective age groups living below the poverty level.
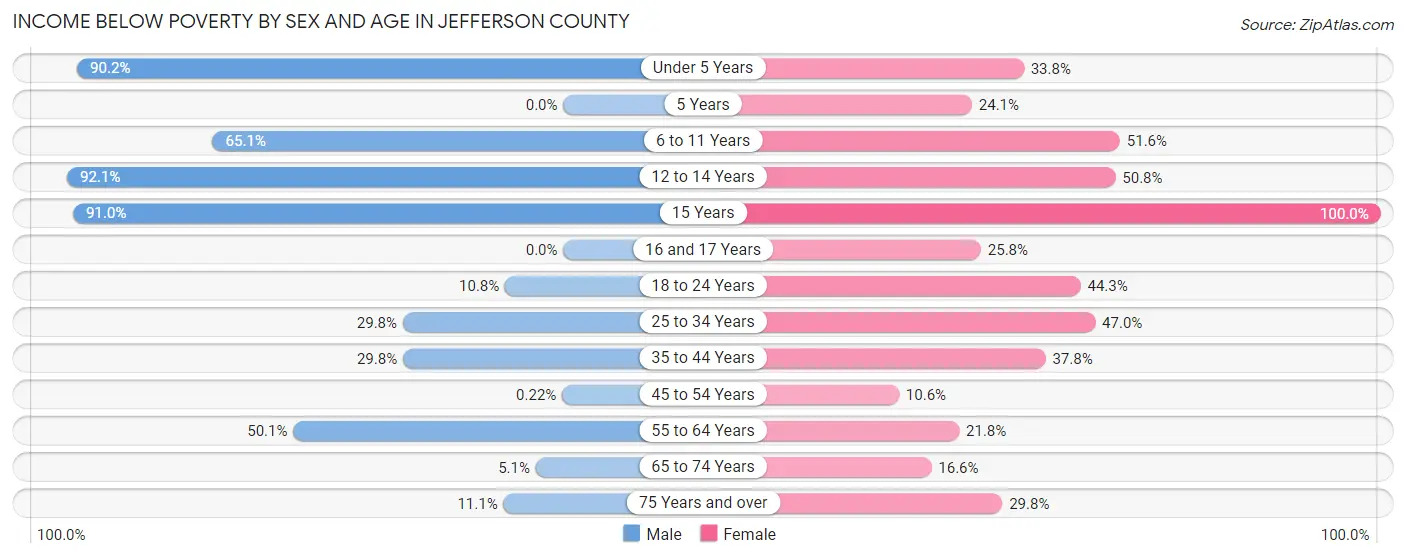
| Age Bracket | Male | Female |
| Under 5 Years | 148 (90.2%) | 78 (33.8%) |
| 5 Years | 0 (0.0%) | 7 (24.1%) |
| 6 to 11 Years | 220 (65.1%) | 160 (51.6%) |
| 12 to 14 Years | 70 (92.1%) | 65 (50.8%) |
| 15 Years | 81 (91.0%) | 10 (100.0%) |
| 16 and 17 Years | 0 (0.0%) | 32 (25.8%) |
| 18 to 24 Years | 44 (10.8%) | 121 (44.3%) |
| 25 to 34 Years | 42 (29.8%) | 190 (47.0%) |
| 35 to 44 Years | 114 (29.8%) | 152 (37.8%) |
| 45 to 54 Years | 1 (0.2%) | 46 (10.6%) |
| 55 to 64 Years | 209 (50.1%) | 132 (21.8%) |
| 65 to 74 Years | 17 (5.1%) | 59 (16.6%) |
| 75 Years and over | 18 (11.1%) | 123 (29.8%) |
| Total | 964 (32.0%) | 1,175 (31.6%) |
Income Above Poverty by Sex and Age in Jefferson County
According to the poverty statistics in Jefferson County, males aged 16 and 17 years and females aged 45 to 54 years are the age groups that are most secure financially, with 100.0% of males and 89.4% of females in these age groups living above the poverty line.
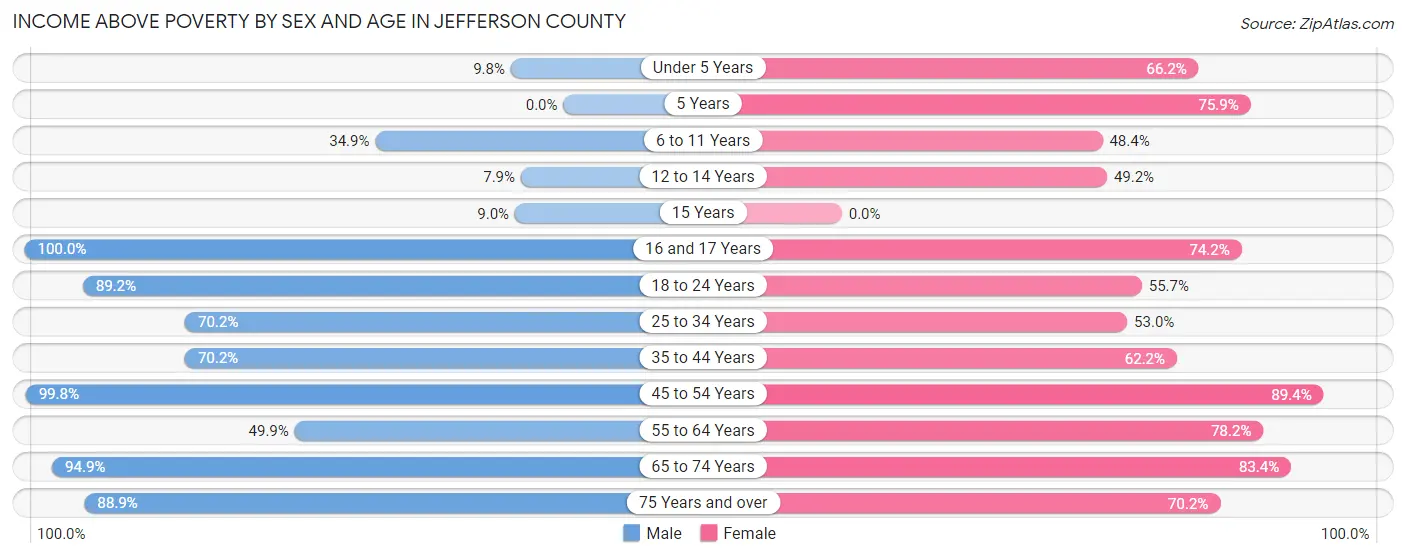
| Age Bracket | Male | Female |
| Under 5 Years | 16 (9.8%) | 153 (66.2%) |
| 5 Years | 0 (0.0%) | 22 (75.9%) |
| 6 to 11 Years | 118 (34.9%) | 150 (48.4%) |
| 12 to 14 Years | 6 (7.9%) | 63 (49.2%) |
| 15 Years | 8 (9.0%) | 0 (0.0%) |
| 16 and 17 Years | 53 (100.0%) | 92 (74.2%) |
| 18 to 24 Years | 363 (89.2%) | 152 (55.7%) |
| 25 to 34 Years | 99 (70.2%) | 214 (53.0%) |
| 35 to 44 Years | 269 (70.2%) | 250 (62.2%) |
| 45 to 54 Years | 448 (99.8%) | 388 (89.4%) |
| 55 to 64 Years | 208 (49.9%) | 474 (78.2%) |
| 65 to 74 Years | 315 (94.9%) | 296 (83.4%) |
| 75 Years and over | 144 (88.9%) | 290 (70.2%) |
| Total | 2,047 (68.0%) | 2,544 (68.4%) |
Income Below Poverty Among Married-Couple Families in Jefferson County
The poverty statistics for married-couple families in Jefferson County show that 7.7% or 57 of the total 737 families live below the poverty line. Families with 1 or 2 children have the highest poverty rate of 13.2%, comprising of 39 families. On the other hand, families with 3 or 4 children have the lowest poverty rate of 0.0%, which includes 0 families.
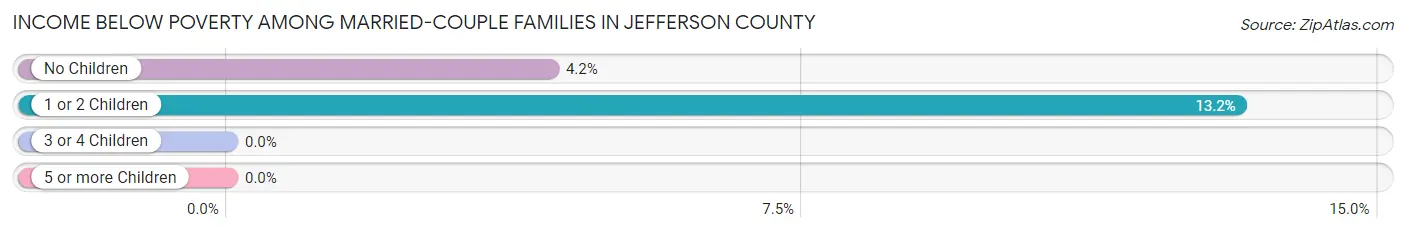
| Children | Above Poverty | Below Poverty |
| No Children | 412 (95.8%) | 18 (4.2%) |
| 1 or 2 Children | 257 (86.8%) | 39 (13.2%) |
| 3 or 4 Children | 11 (100.0%) | 0 (0.0%) |
| 5 or more Children | 0 (0.0%) | 0 (0.0%) |
| Total | 680 (92.3%) | 57 (7.7%) |
Income Below Poverty Among Single-Parent Households in Jefferson County
According to the poverty data in Jefferson County, 72.0% or 126 single-father households and 38.0% or 345 single-mother households are living below the poverty line. Among single-father households, those with 5 or more children have the highest poverty rate, with 11 households (100.0%) experiencing poverty. Likewise, among single-mother households, those with 3 or 4 children have the highest poverty rate, with 94 households (73.4%) falling below the poverty line.
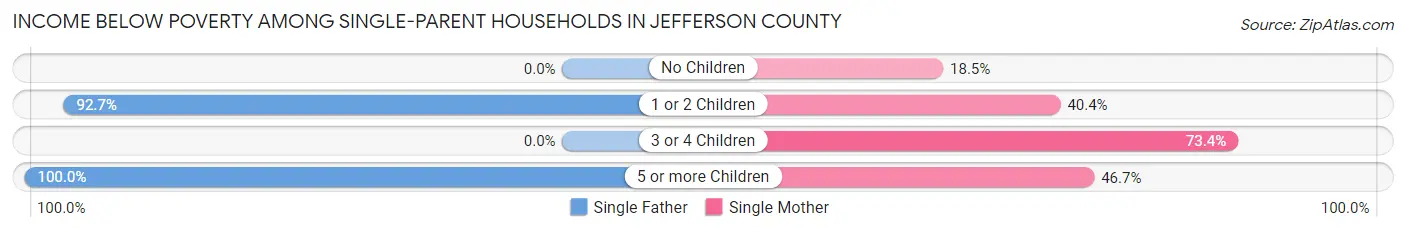
| Children | Single Father | Single Mother |
| No Children | 0 (0.0%) | 55 (18.5%) |
| 1 or 2 Children | 115 (92.7%) | 189 (40.4%) |
| 3 or 4 Children | 0 (0.0%) | 94 (73.4%) |
| 5 or more Children | 11 (100.0%) | 7 (46.7%) |
| Total | 126 (72.0%) | 345 (38.0%) |
Income Below Poverty Among Married-Couple vs Single-Parent Households in Jefferson County
The poverty data for Jefferson County shows that 57 of the married-couple family households (7.7%) and 471 of the single-parent households (43.5%) are living below the poverty level. Within the married-couple family households, those with 1 or 2 children have the highest poverty rate, with 39 households (13.2%) falling below the poverty line. Among the single-parent households, those with 3 or 4 children have the highest poverty rate, with 94 household (73.4%) living below poverty.
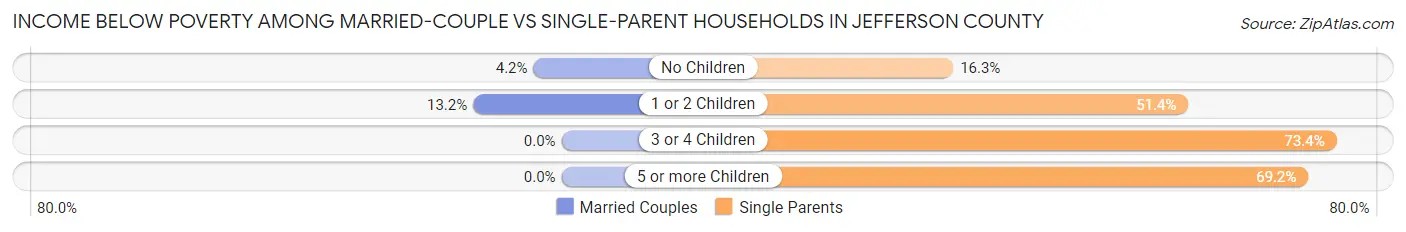
| Children | Married-Couple Families | Single-Parent Households |
| No Children | 18 (4.2%) | 55 (16.3%) |
| 1 or 2 Children | 39 (13.2%) | 304 (51.3%) |
| 3 or 4 Children | 0 (0.0%) | 94 (73.4%) |
| 5 or more Children | 0 (0.0%) | 18 (69.2%) |
| Total | 57 (7.7%) | 471 (43.5%) |
Race in Jefferson County
The most populous races in Jefferson County are Black / African American (5,697 | 79.0%), White / Caucasian (946 | 13.1%), and Hispanic or Latino (610 | 8.5%).
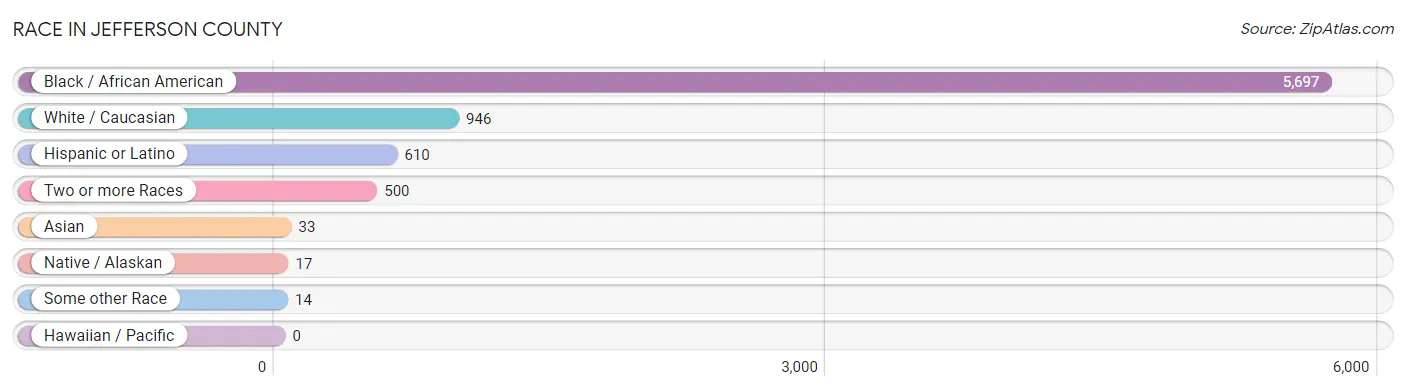
| Race | # Population | % Population |
| Asian | 33 | 0.5% |
| Black / African American | 5,697 | 79.0% |
| Hawaiian / Pacific | 0 | 0.0% |
| Hispanic or Latino | 610 | 8.5% |
| Native / Alaskan | 17 | 0.2% |
| White / Caucasian | 946 | 13.1% |
| Two or more Races | 500 | 6.9% |
| Some other Race | 14 | 0.2% |
| Total | 7,207 | 100.0% |
Ancestry in Jefferson County
The most populous ancestries reported in Jefferson County are Irish (204 | 2.8%), American (178 | 2.5%), German (177 | 2.5%), French (163 | 2.3%), and Cuban (136 | 1.9%), together accounting for 11.9% of all Jefferson County residents.
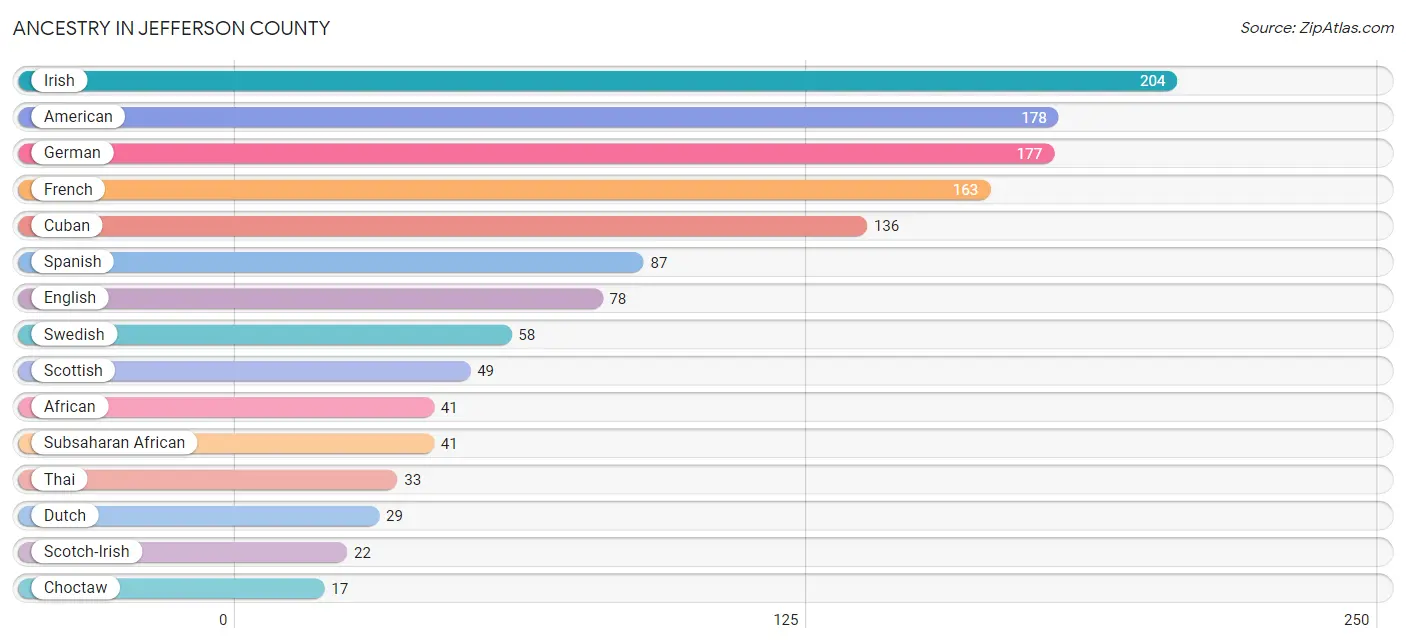
| Ancestry | # Population | % Population |
| African | 41 | 0.6% |
| American | 178 | 2.5% |
| Cherokee | 12 | 0.2% |
| Choctaw | 17 | 0.2% |
| Cuban | 136 | 1.9% |
| Dutch | 29 | 0.4% |
| English | 78 | 1.1% |
| French | 163 | 2.3% |
| German | 177 | 2.5% |
| Irish | 204 | 2.8% |
| Italian | 12 | 0.2% |
| Mexican | 6 | 0.1% |
| Polish | 7 | 0.1% |
| Scotch-Irish | 22 | 0.3% |
| Scottish | 49 | 0.7% |
| South American | 7 | 0.1% |
| Spanish | 87 | 1.2% |
| Subsaharan African | 41 | 0.6% |
| Swedish | 58 | 0.8% |
| Thai | 33 | 0.5% |
| Venezuelan | 7 | 0.1% | View All 21 Rows |
Immigrants in Jefferson County
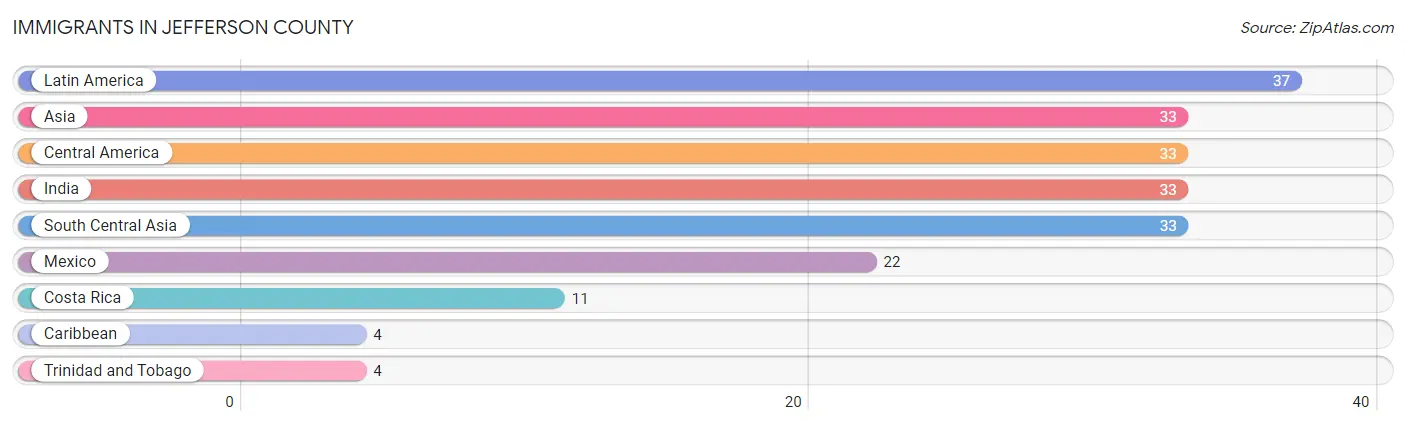
The most numerous immigrant groups reported in Jefferson County came from Latin America (37 | 0.5%), Asia (33 | 0.5%), Central America (33 | 0.5%), India (33 | 0.5%), and South Central Asia (33 | 0.5%), together accounting for 2.4% of all Jefferson County residents.
| Immigration Origin | # Population | % Population |
| Asia | 33 | 0.5% |
| Caribbean | 4 | 0.1% |
| Central America | 33 | 0.5% |
| Costa Rica | 11 | 0.2% |
| India | 33 | 0.5% |
| Latin America | 37 | 0.5% |
| Mexico | 22 | 0.3% |
| South Central Asia | 33 | 0.5% |
| Trinidad and Tobago | 4 | 0.1% | View All 9 Rows |
Sex and Age in Jefferson County
Sex and Age in Jefferson County
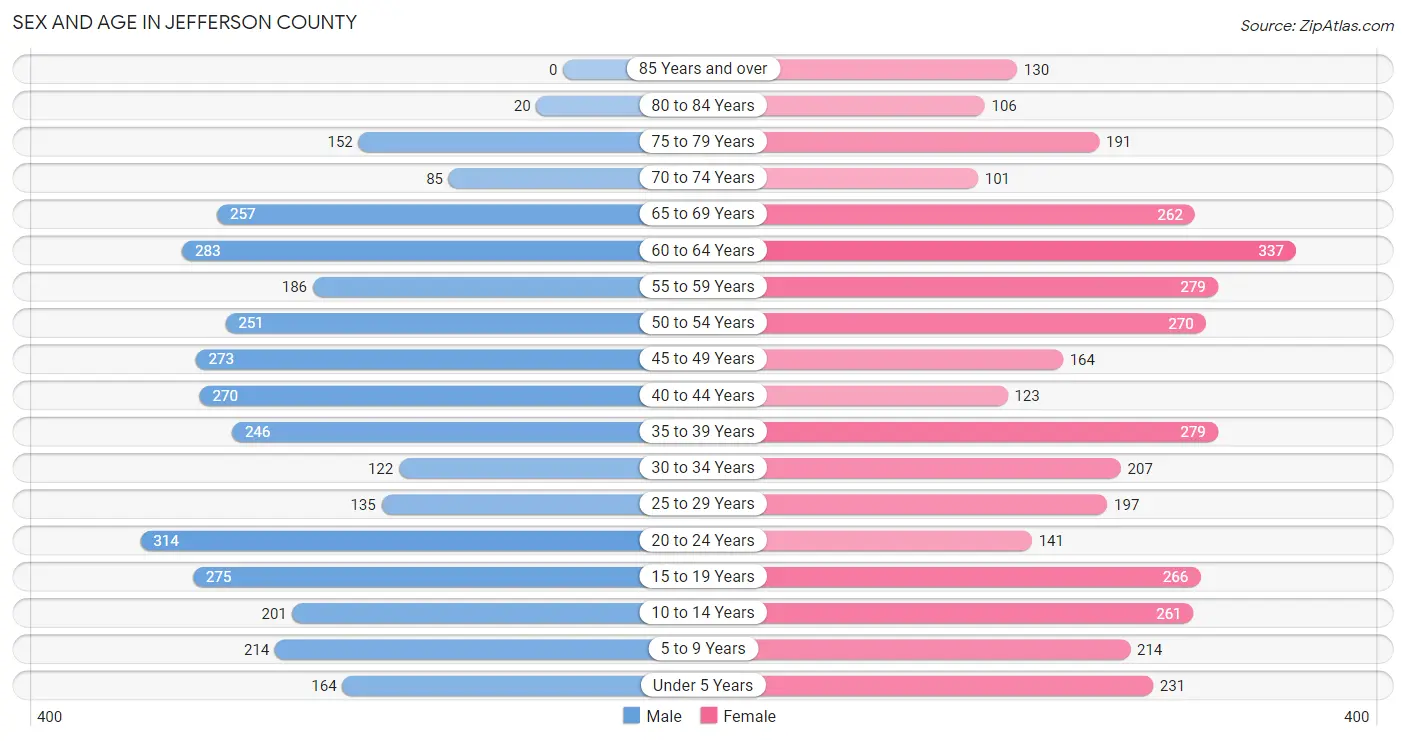
The most populous age groups in Jefferson County are 20 to 24 Years (314 | 9.1%) for men and 60 to 64 Years (337 | 9.0%) for women.
| Age Bracket | Male | Female |
| Under 5 Years | 164 (4.8%) | 231 (6.1%) |
| 5 to 9 Years | 214 (6.2%) | 214 (5.7%) |
| 10 to 14 Years | 201 (5.8%) | 261 (6.9%) |
| 15 to 19 Years | 275 (8.0%) | 266 (7.1%) |
| 20 to 24 Years | 314 (9.1%) | 141 (3.7%) |
| 25 to 29 Years | 135 (3.9%) | 197 (5.2%) |
| 30 to 34 Years | 122 (3.5%) | 207 (5.5%) |
| 35 to 39 Years | 246 (7.1%) | 279 (7.4%) |
| 40 to 44 Years | 270 (7.8%) | 123 (3.3%) |
| 45 to 49 Years | 273 (7.9%) | 164 (4.4%) |
| 50 to 54 Years | 251 (7.3%) | 270 (7.2%) |
| 55 to 59 Years | 186 (5.4%) | 279 (7.4%) |
| 60 to 64 Years | 283 (8.2%) | 337 (9.0%) |
| 65 to 69 Years | 257 (7.4%) | 262 (7.0%) |
| 70 to 74 Years | 85 (2.5%) | 101 (2.7%) |
| 75 to 79 Years | 152 (4.4%) | 191 (5.1%) |
| 80 to 84 Years | 20 (0.6%) | 106 (2.8%) |
| 85 Years and over | 0 (0.0%) | 130 (3.5%) |
| Total | 3,448 (100.0%) | 3,759 (100.0%) |
Families and Households in Jefferson County
Median Family Size in Jefferson County
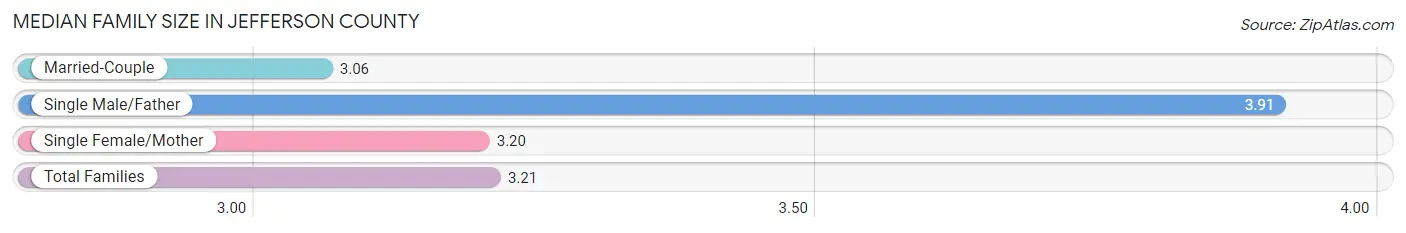
The median family size in Jefferson County is 3.21 persons per family, with single male/father families (175 | 9.6%) accounting for the largest median family size of 3.91 persons per family. On the other hand, married-couple families (737 | 40.5%) represent the smallest median family size with 3.06 persons per family.
| Family Type | # Families | Family Size |
| Married-Couple | 737 (40.5%) | 3.06 |
| Single Male/Father | 175 (9.6%) | 3.91 |
| Single Female/Mother | 908 (49.9%) | 3.20 |
| Total Families | 1,820 (100.0%) | 3.21 |
Median Household Size in Jefferson County
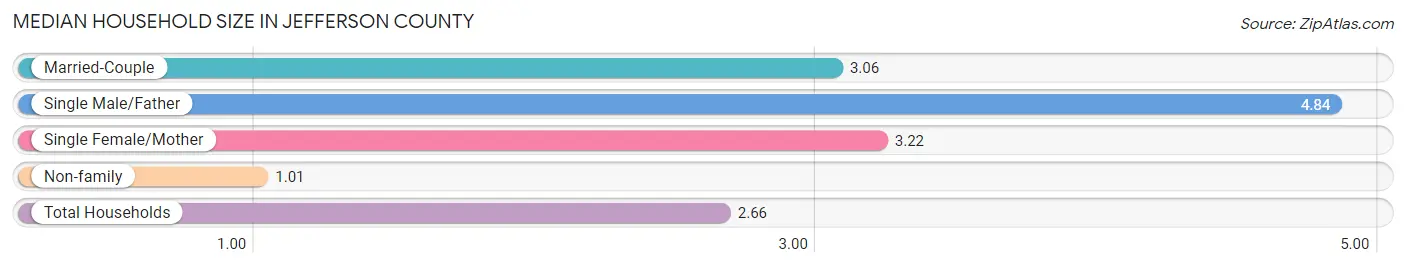
The median household size in Jefferson County is 2.66 persons per household, with single male/father households (175 | 6.9%) accounting for the largest median household size of 4.84 persons per household. non-family households (710 | 28.1%) represent the smallest median household size with 1.01 persons per household.
| Household Type | # Households | Household Size |
| Married-Couple | 737 (29.1%) | 3.06 |
| Single Male/Father | 175 (6.9%) | 4.84 |
| Single Female/Mother | 908 (35.9%) | 3.22 |
| Non-family | 710 (28.1%) | 1.01 |
| Total Households | 2,530 (100.0%) | 2.66 |
Household Size by Marriage Status in Jefferson County
Out of a total of 2,530 households in Jefferson County, 1,820 (71.9%) are family households, while 710 (28.1%) are nonfamily households. The most numerous type of family households are 2-person households, comprising 695, and the most common type of nonfamily households are 1-person households, comprising 703.
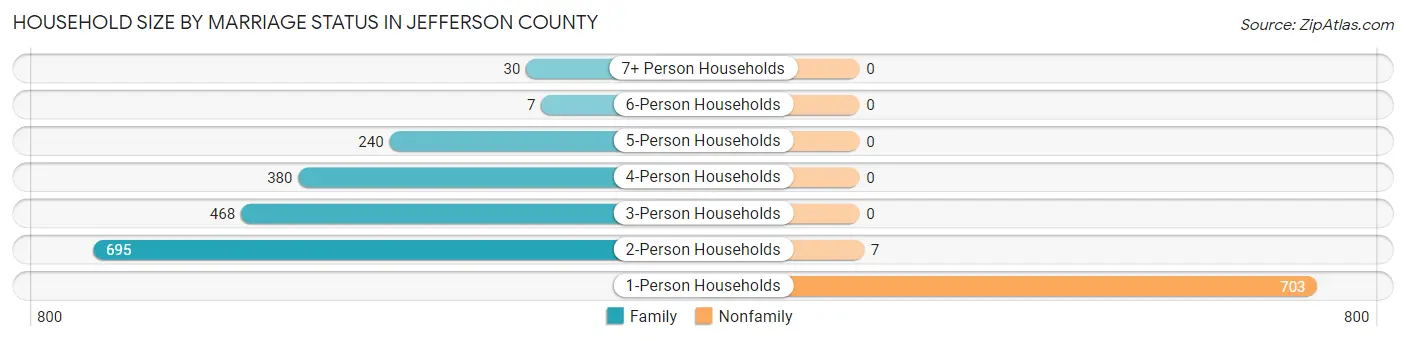
| Household Size | Family Households | Nonfamily Households |
| 1-Person Households | - | 703 (27.8%) |
| 2-Person Households | 695 (27.5%) | 7 (0.3%) |
| 3-Person Households | 468 (18.5%) | 0 (0.0%) |
| 4-Person Households | 380 (15.0%) | 0 (0.0%) |
| 5-Person Households | 240 (9.5%) | 0 (0.0%) |
| 6-Person Households | 7 (0.3%) | 0 (0.0%) |
| 7+ Person Households | 30 (1.2%) | 0 (0.0%) |
| Total | 1,820 (71.9%) | 710 (28.1%) |
Female Fertility in Jefferson County
Fertility by Age in Jefferson County
Average fertility rate in Jefferson County is 5.0 births per 1,000 women. Women in the age bracket of 20 to 34 years have the highest fertility rate with 13.0 births per 1,000 women. Women in the age bracket of 20 to 34 years acount for 100.0% of all women with births.
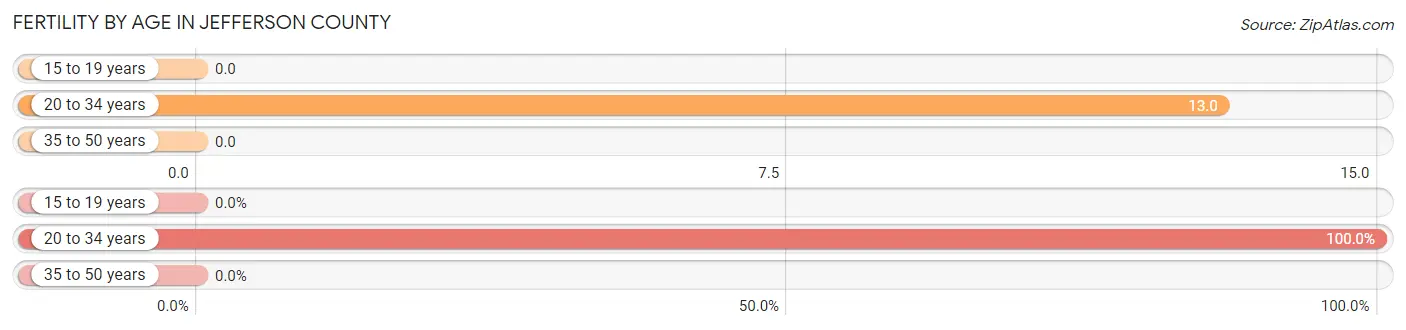
| Age Bracket | Women with Births | Births / 1,000 Women |
| 15 to 19 years | 0 (0.0%) | 0.0 |
| 20 to 34 years | 7 (100.0%) | 13.0 |
| 35 to 50 years | 0 (0.0%) | 0.0 |
| Total | 7 (100.0%) | 5.0 |
Fertility by Age by Marriage Status in Jefferson County
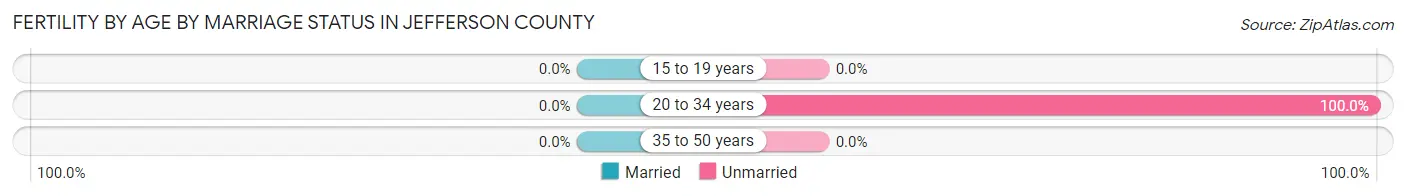
| Age Bracket | Married | Unmarried |
| 15 to 19 years | 0 (0.0%) | 0 (0.0%) |
| 20 to 34 years | 0 (0.0%) | 7 (100.0%) |
| 35 to 50 years | 0 (0.0%) | 0 (0.0%) |
| Total | 0 (0.0%) | 7 (100.0%) |
Fertility by Education in Jefferson County
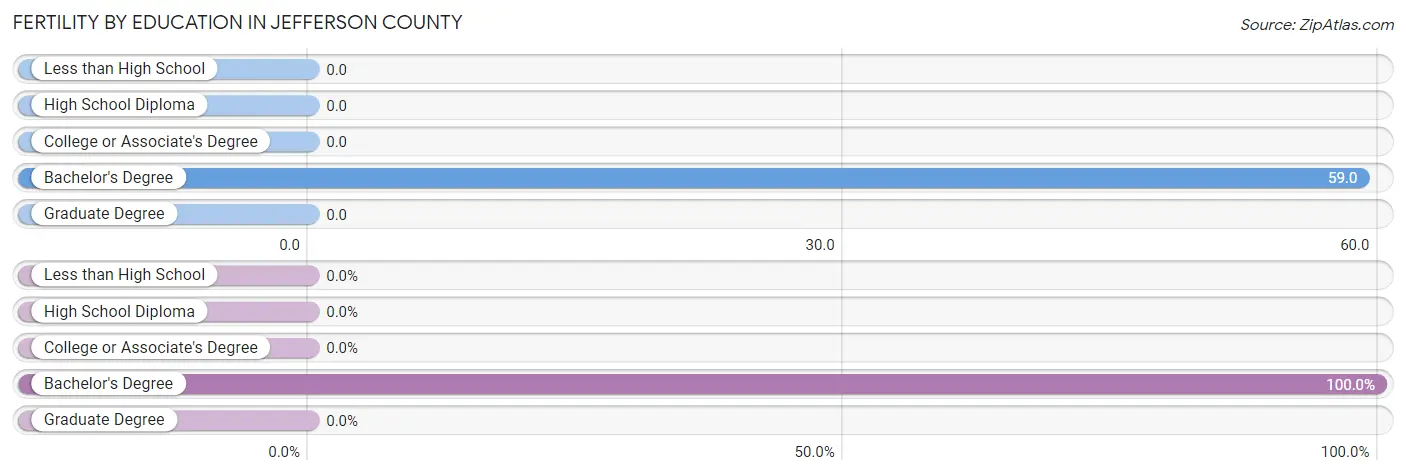
| Educational Attainment | Women with Births | Births / 1,000 Women |
| Less than High School | 0 (0.0%) | 0.0 |
| High School Diploma | 0 (0.0%) | 0.0 |
| College or Associate's Degree | 0 (0.0%) | 0.0 |
| Bachelor's Degree | 7 (100.0%) | 59.0 |
| Graduate Degree | 0 (0.0%) | 0.0 |
| Total | 7 (100.0%) | 5.0 |
Fertility by Education by Marriage Status in Jefferson County
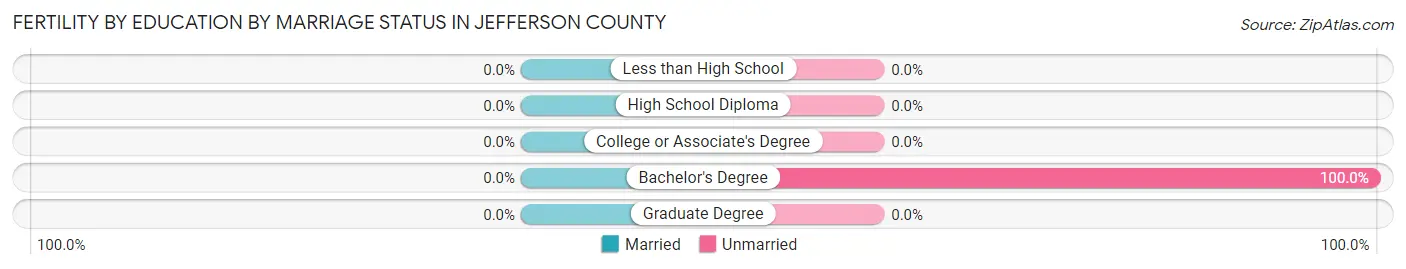
| Educational Attainment | Married | Unmarried |
| Less than High School | 0 (0.0%) | 0 (0.0%) |
| High School Diploma | 0 (0.0%) | 0 (0.0%) |
| College or Associate's Degree | 0 (0.0%) | 0 (0.0%) |
| Bachelor's Degree | 0 (0.0%) | 7 (100.0%) |
| Graduate Degree | 0 (0.0%) | 0 (0.0%) |
| Total | 0 (0.0%) | 7 (100.0%) |
Employment Characteristics in Jefferson County
Employment by Class of Employer in Jefferson County
Among the 2,102 employed individuals in Jefferson County, private company employees (1,035 | 49.2%), state government employees (327 | 15.6%), and local government employees (286 | 13.6%) make up the most common classes of employment.
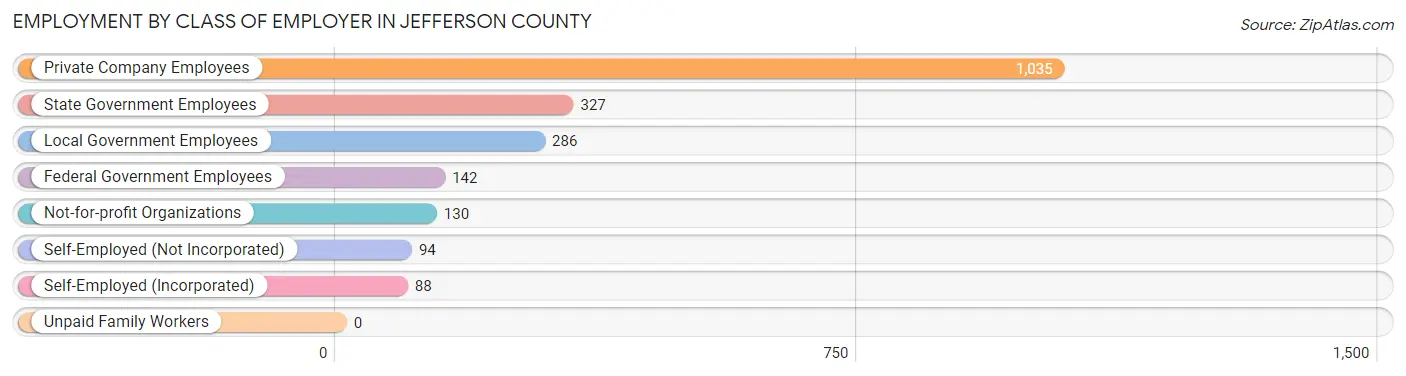
| Employer Class | # Employees | % Employees |
| Private Company Employees | 1,035 | 49.2% |
| Self-Employed (Incorporated) | 88 | 4.2% |
| Self-Employed (Not Incorporated) | 94 | 4.5% |
| Not-for-profit Organizations | 130 | 6.2% |
| Local Government Employees | 286 | 13.6% |
| State Government Employees | 327 | 15.6% |
| Federal Government Employees | 142 | 6.8% |
| Unpaid Family Workers | 0 | 0.0% |
| Total | 2,102 | 100.0% |
Employment Status by Age in Jefferson County
According to the labor force statistics for Jefferson County, out of the total population over 16 years of age (5,823), 39.2% or 2,283 individuals are in the labor force, with 5.4% or 123 of them unemployed. The age group with the highest labor force participation rate is 25 to 29 years, with 59.9% or 199 individuals in the labor force. Within the labor force, the 16 to 19 years age range has the highest percentage of unemployed individuals, with 60.0% or 12 of them being unemployed.
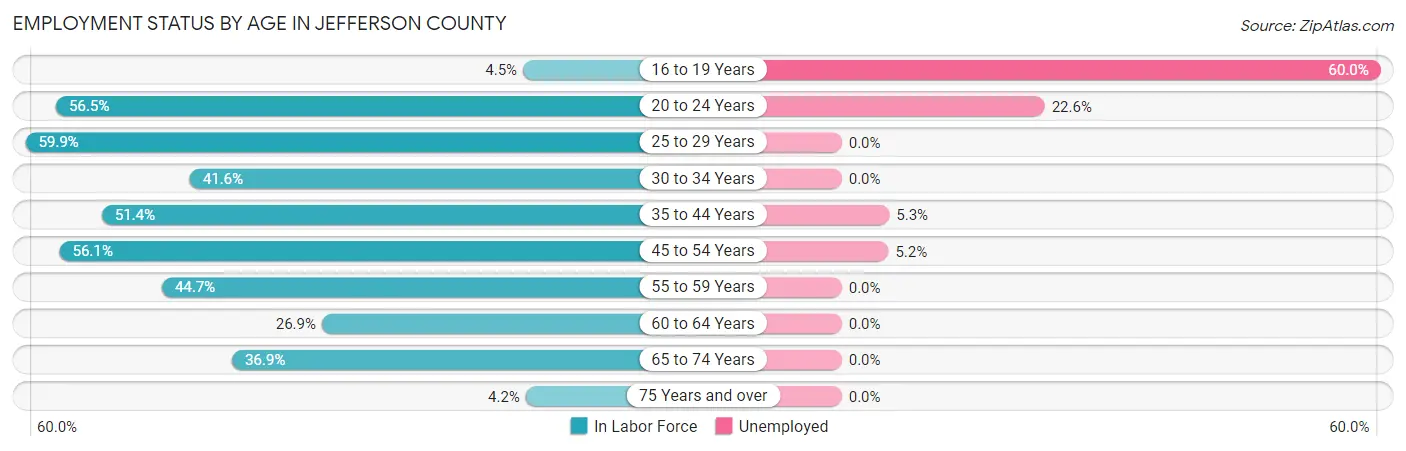
| Age Bracket | In Labor Force | Unemployed |
| 16 to 19 Years | 20 (4.5%) | 12 (60.0%) |
| 20 to 24 Years | 257 (56.5%) | 58 (22.6%) |
| 25 to 29 Years | 199 (59.9%) | 0 (0.0%) |
| 30 to 34 Years | 137 (41.6%) | 0 (0.0%) |
| 35 to 44 Years | 472 (51.4%) | 25 (5.3%) |
| 45 to 54 Years | 537 (56.1%) | 28 (5.2%) |
| 55 to 59 Years | 208 (44.7%) | 0 (0.0%) |
| 60 to 64 Years | 167 (26.9%) | 0 (0.0%) |
| 65 to 74 Years | 260 (36.9%) | 0 (0.0%) |
| 75 Years and over | 25 (4.2%) | 0 (0.0%) |
| Total | 2,283 (39.2%) | 123 (5.4%) |
Employment Status by Educational Attainment in Jefferson County
According to labor force statistics for Jefferson County, 47.5% of individuals (1,720) out of the total population between 25 and 64 years of age (3,622) are in the labor force, with 3.1% or 53 of them being unemployed. The group with the highest labor force participation rate are those with the educational attainment of bachelor's degree or higher, with 73.7% or 511 individuals in the labor force. Within the labor force, individuals with bachelor's degree or higher education have the highest percentage of unemployment, with 5.5% or 28 of them being unemployed.
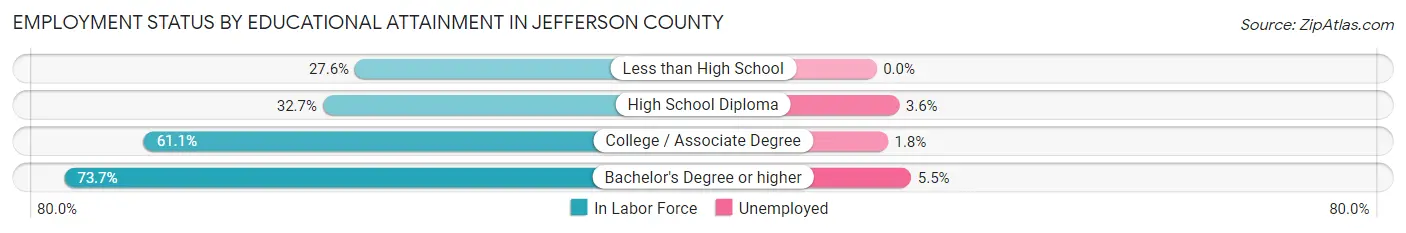
| Educational Attainment | In Labor Force | Unemployed |
| Less than High School | 204 (27.6%) | 0 (0.0%) |
| High School Diploma | 384 (32.7%) | 42 (3.6%) |
| College / Associate Degree | 621 (61.1%) | 18 (1.8%) |
| Bachelor's Degree or higher | 511 (73.7%) | 38 (5.5%) |
| Total | 1,720 (47.5%) | 112 (3.1%) |
Employment Occupations by Sex in Jefferson County
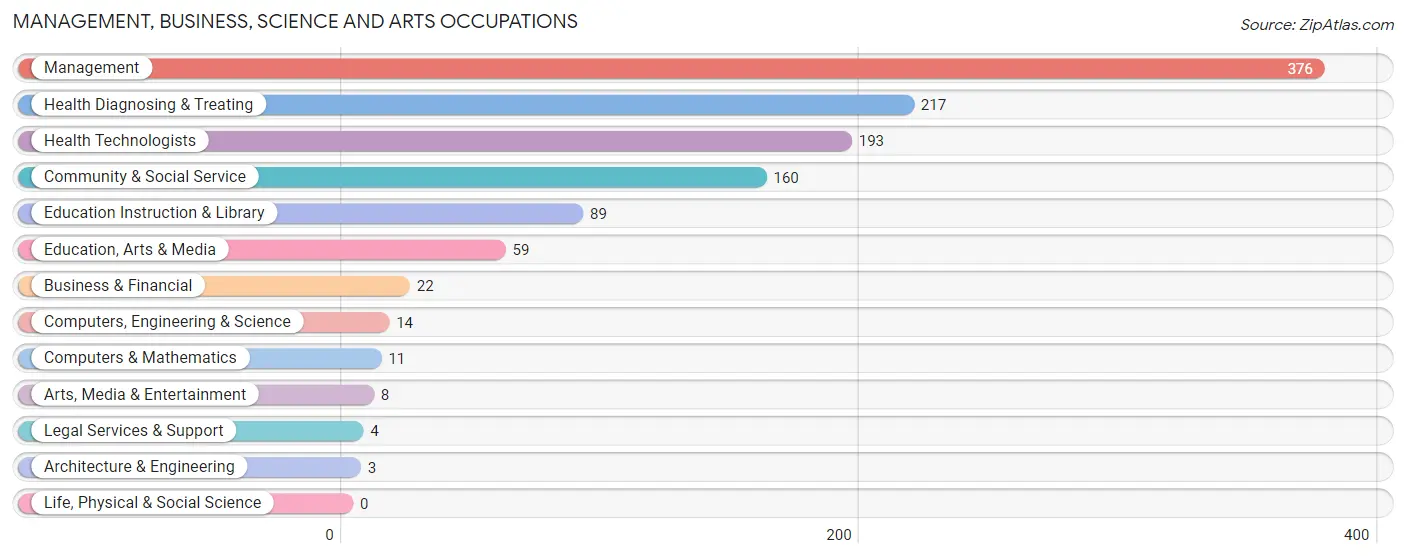
Management, Business, Science and Arts Occupations
The most common Management, Business, Science and Arts occupations in Jefferson County are Management (376 | 17.4%), Health Diagnosing & Treating (217 | 10.1%), Health Technologists (193 | 8.9%), Community & Social Service (160 | 7.4%), and Education Instruction & Library (89 | 4.1%).
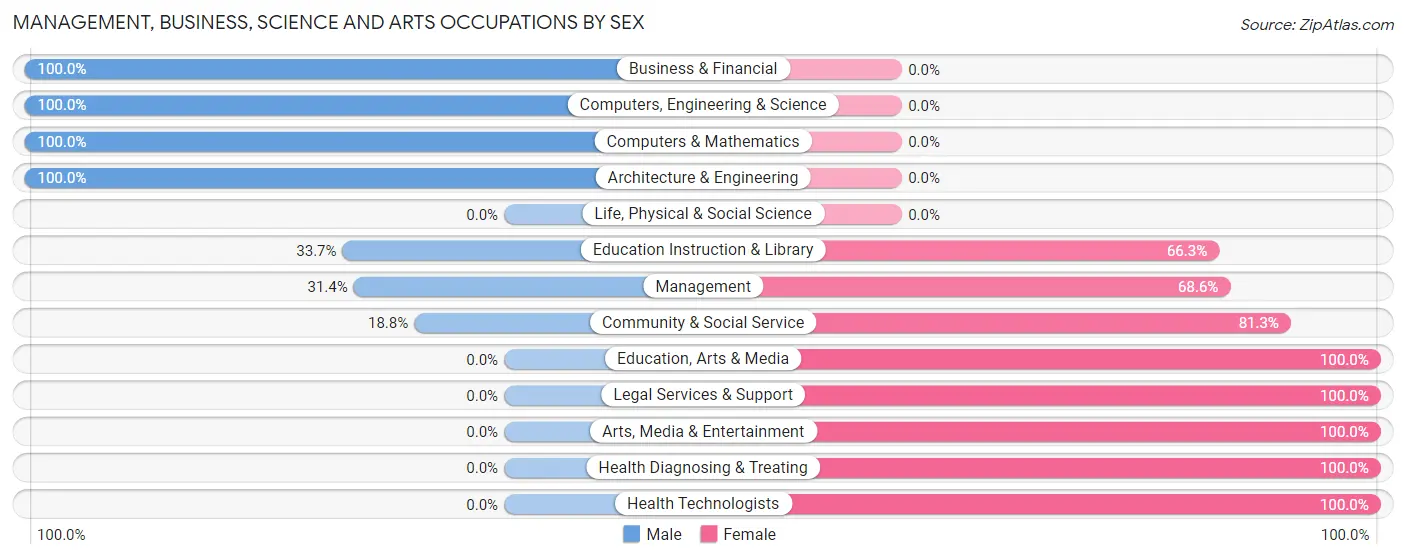
Management, Business, Science and Arts Occupations by Sex
Within the Management, Business, Science and Arts occupations in Jefferson County, the most male-oriented occupations are Business & Financial (100.0%), Computers, Engineering & Science (100.0%), and Computers & Mathematics (100.0%), while the most female-oriented occupations are Education, Arts & Media (100.0%), Legal Services & Support (100.0%), and Arts, Media & Entertainment (100.0%).
| Occupation | Male | Female |
| Management | 118 (31.4%) | 258 (68.6%) |
| Business & Financial | 22 (100.0%) | 0 (0.0%) |
| Computers, Engineering & Science | 14 (100.0%) | 0 (0.0%) |
| Computers & Mathematics | 11 (100.0%) | 0 (0.0%) |
| Architecture & Engineering | 3 (100.0%) | 0 (0.0%) |
| Life, Physical & Social Science | 0 (0.0%) | 0 (0.0%) |
| Community & Social Service | 30 (18.8%) | 130 (81.2%) |
| Education, Arts & Media | 0 (0.0%) | 59 (100.0%) |
| Legal Services & Support | 0 (0.0%) | 4 (100.0%) |
| Education Instruction & Library | 30 (33.7%) | 59 (66.3%) |
| Arts, Media & Entertainment | 0 (0.0%) | 8 (100.0%) |
| Health Diagnosing & Treating | 0 (0.0%) | 217 (100.0%) |
| Health Technologists | 0 (0.0%) | 193 (100.0%) |
| Total (Category) | 184 (23.3%) | 605 (76.7%) |
| Total (Overall) | 859 (39.8%) | 1,300 (60.2%) |
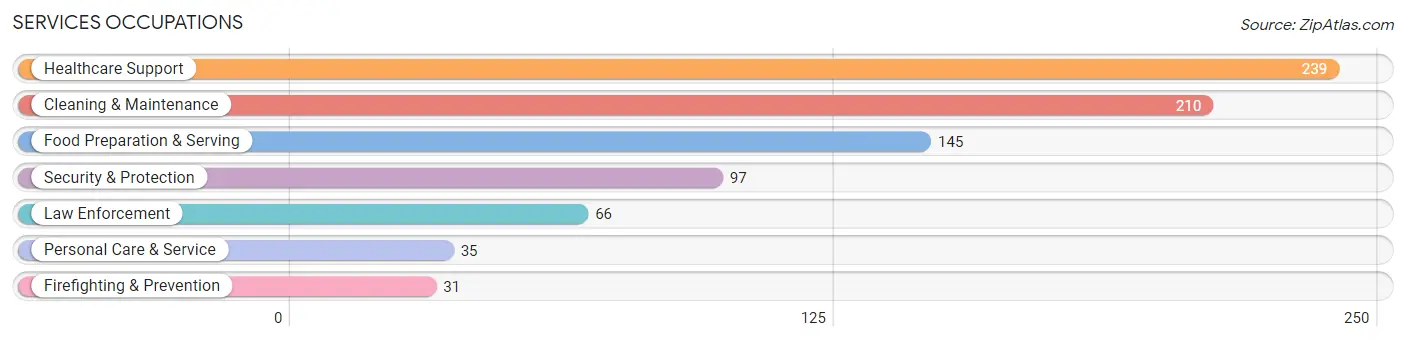
Services Occupations
The most common Services occupations in Jefferson County are Healthcare Support (239 | 11.1%), Cleaning & Maintenance (210 | 9.7%), Food Preparation & Serving (145 | 6.7%), Security & Protection (97 | 4.5%), and Law Enforcement (66 | 3.1%).
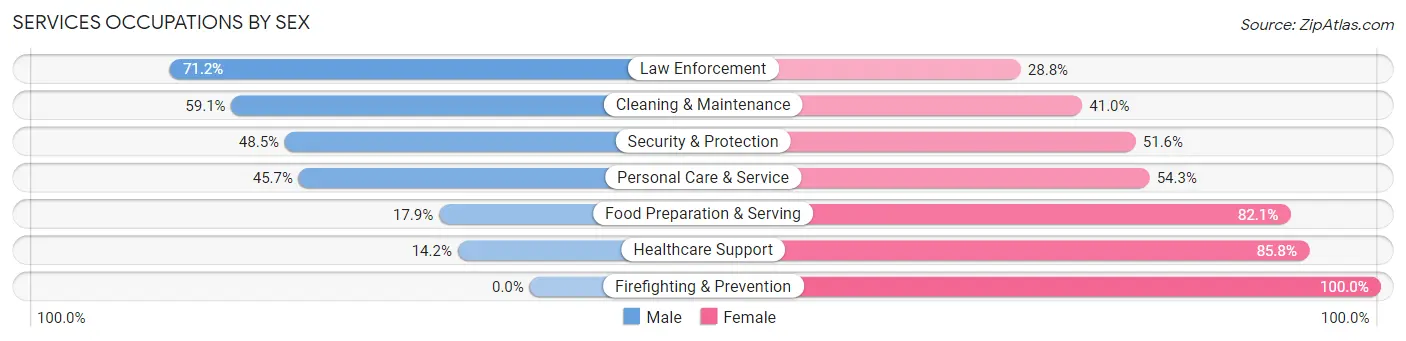
Services Occupations by Sex
Within the Services occupations in Jefferson County, the most male-oriented occupations are Law Enforcement (71.2%), Cleaning & Maintenance (59.1%), and Security & Protection (48.4%), while the most female-oriented occupations are Firefighting & Prevention (100.0%), Healthcare Support (85.8%), and Food Preparation & Serving (82.1%).
| Occupation | Male | Female |
| Healthcare Support | 34 (14.2%) | 205 (85.8%) |
| Security & Protection | 47 (48.4%) | 50 (51.5%) |
| Firefighting & Prevention | 0 (0.0%) | 31 (100.0%) |
| Law Enforcement | 47 (71.2%) | 19 (28.8%) |
| Food Preparation & Serving | 26 (17.9%) | 119 (82.1%) |
| Cleaning & Maintenance | 124 (59.1%) | 86 (40.9%) |
| Personal Care & Service | 16 (45.7%) | 19 (54.3%) |
| Total (Category) | 247 (34.0%) | 479 (66.0%) |
| Total (Overall) | 859 (39.8%) | 1,300 (60.2%) |
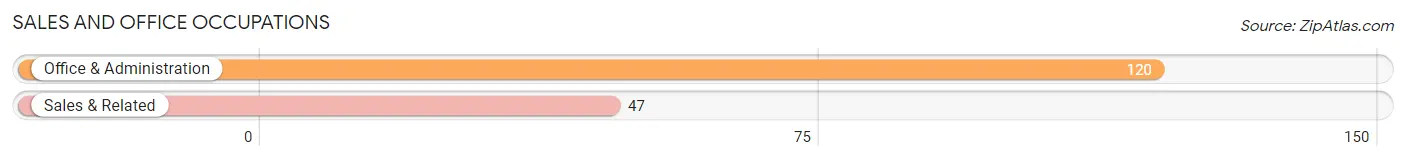
Sales and Office Occupations
The most common Sales and Office occupations in Jefferson County are Office & Administration (120 | 5.6%), and Sales & Related (47 | 2.2%).
Sales and Office Occupations by Sex
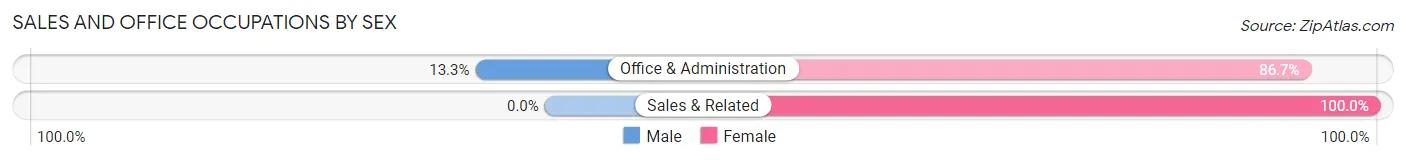
| Occupation | Male | Female |
| Sales & Related | 0 (0.0%) | 47 (100.0%) |
| Office & Administration | 16 (13.3%) | 104 (86.7%) |
| Total (Category) | 16 (9.6%) | 151 (90.4%) |
| Total (Overall) | 859 (39.8%) | 1,300 (60.2%) |
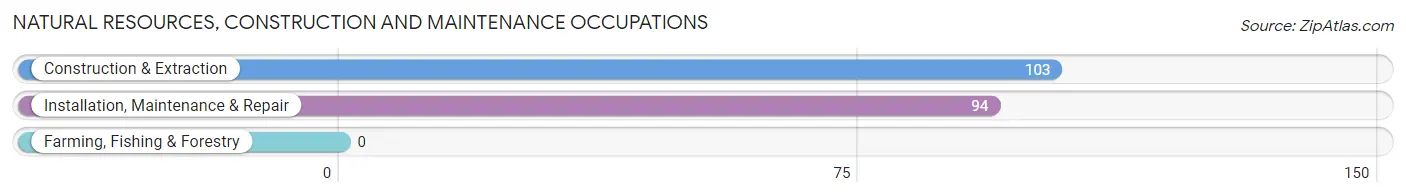
Natural Resources, Construction and Maintenance Occupations
The most common Natural Resources, Construction and Maintenance occupations in Jefferson County are Construction & Extraction (103 | 4.8%), and Installation, Maintenance & Repair (94 | 4.3%).
Natural Resources, Construction and Maintenance Occupations by Sex
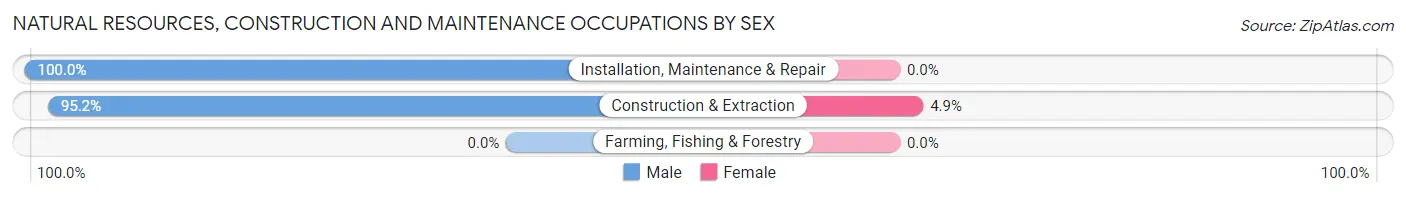
| Occupation | Male | Female |
| Farming, Fishing & Forestry | 0 (0.0%) | 0 (0.0%) |
| Construction & Extraction | 98 (95.2%) | 5 (4.9%) |
| Installation, Maintenance & Repair | 94 (100.0%) | 0 (0.0%) |
| Total (Category) | 192 (97.5%) | 5 (2.5%) |
| Total (Overall) | 859 (39.8%) | 1,300 (60.2%) |
Production, Transportation and Moving Occupations
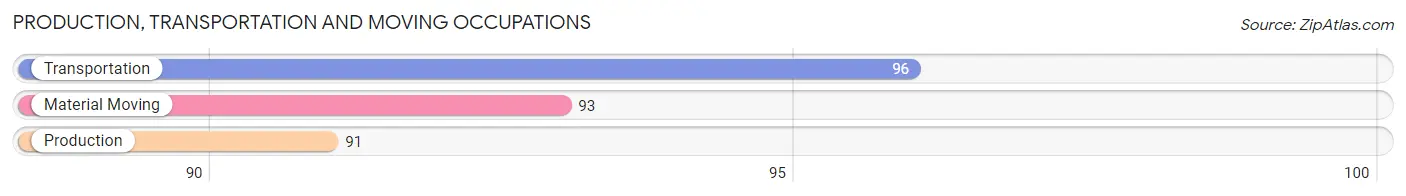
The most common Production, Transportation and Moving occupations in Jefferson County are Transportation (96 | 4.4%), Material Moving (93 | 4.3%), and Production (91 | 4.2%).
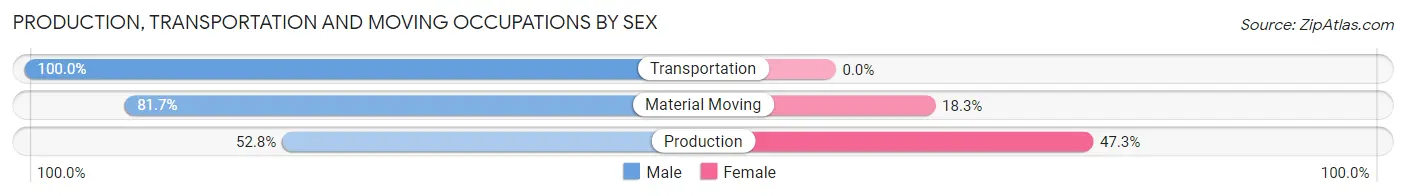
Production, Transportation and Moving Occupations by Sex
| Occupation | Male | Female |
| Production | 48 (52.7%) | 43 (47.2%) |
| Transportation | 96 (100.0%) | 0 (0.0%) |
| Material Moving | 76 (81.7%) | 17 (18.3%) |
| Total (Category) | 220 (78.6%) | 60 (21.4%) |
| Total (Overall) | 859 (39.8%) | 1,300 (60.2%) |
Employment Industries by Sex in Jefferson County
Employment Industries in Jefferson County
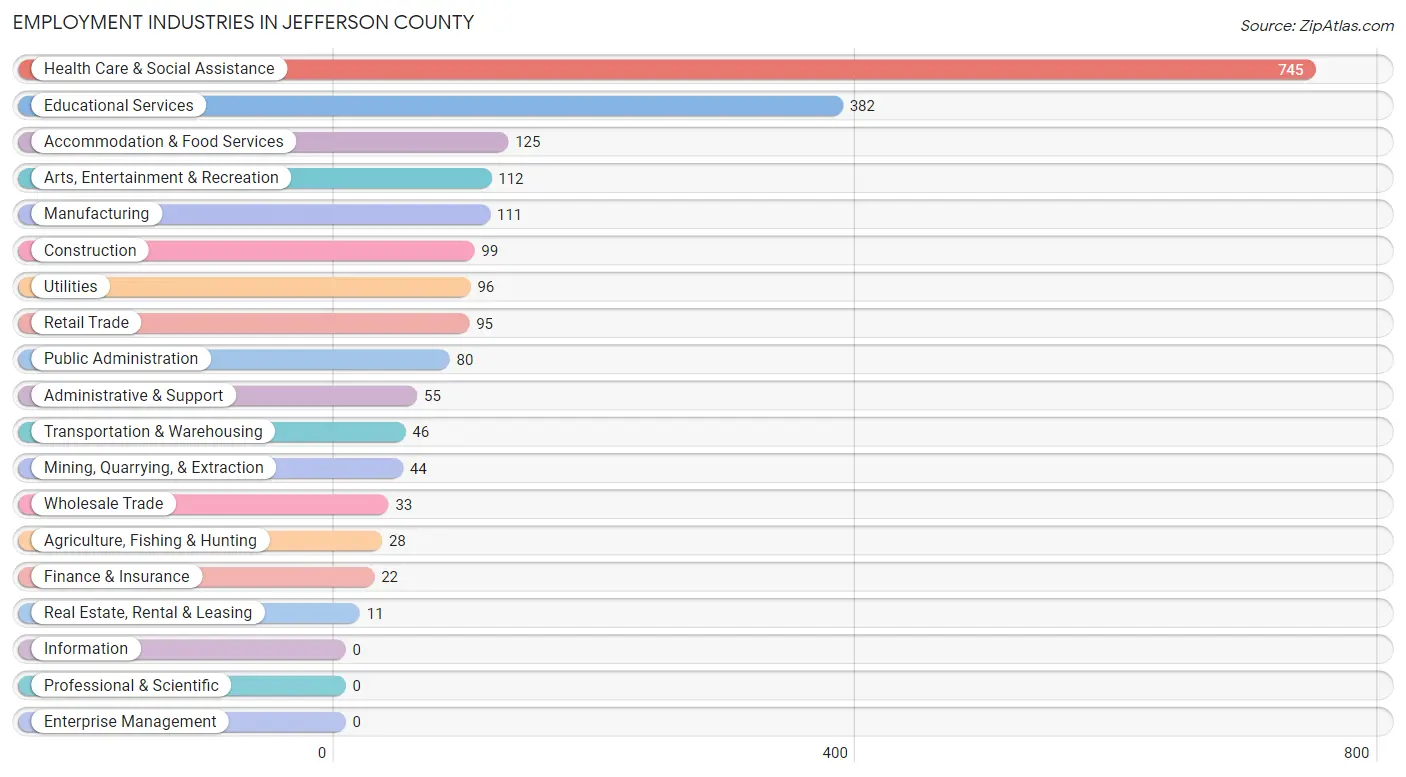
The major employment industries in Jefferson County include Health Care & Social Assistance (745 | 34.5%), Educational Services (382 | 17.7%), Accommodation & Food Services (125 | 5.8%), Arts, Entertainment & Recreation (112 | 5.2%), and Manufacturing (111 | 5.1%).
Employment Industries by Sex in Jefferson County
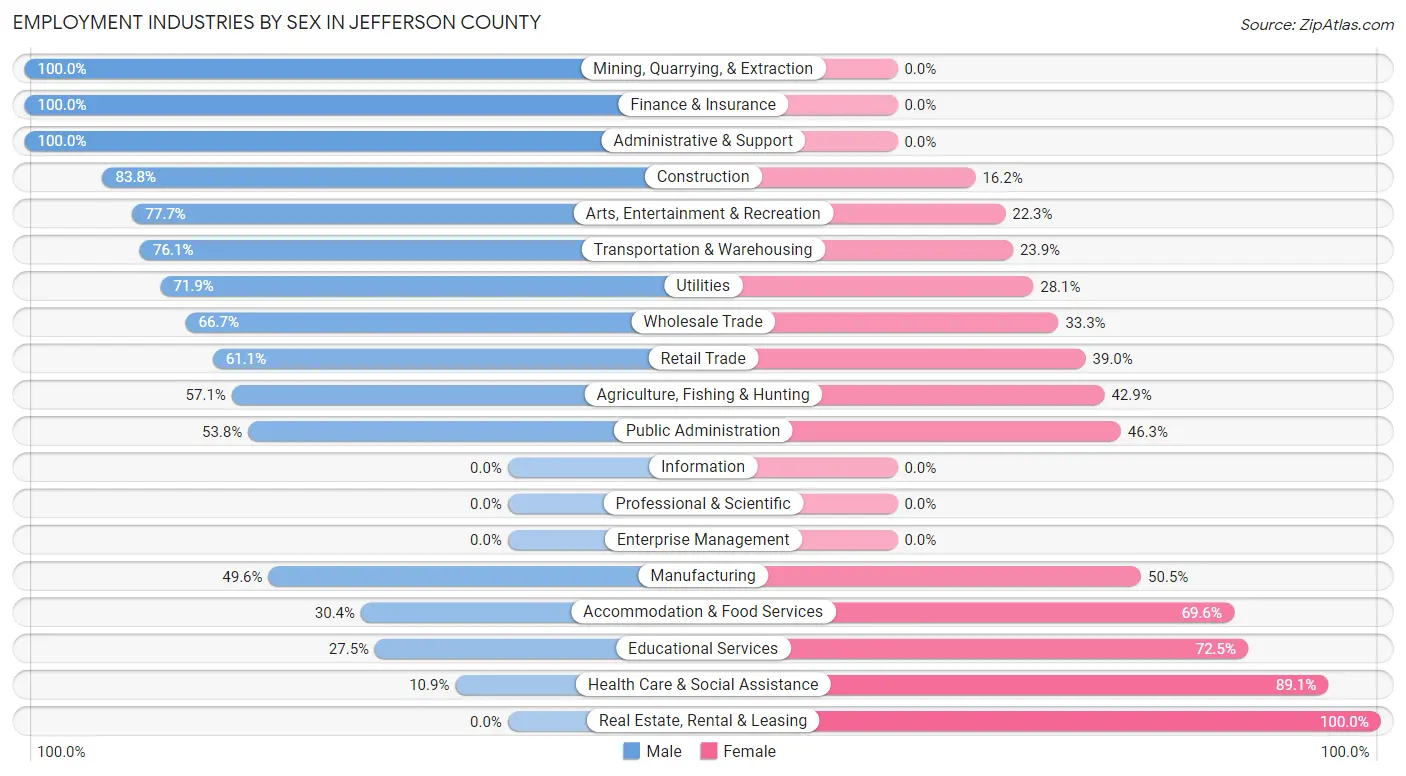
The Jefferson County industries that see more men than women are Mining, Quarrying, & Extraction (100.0%), Finance & Insurance (100.0%), and Administrative & Support (100.0%), whereas the industries that tend to have a higher number of women are Real Estate, Rental & Leasing (100.0%), Health Care & Social Assistance (89.1%), and Educational Services (72.5%).
| Industry | Male | Female |
| Agriculture, Fishing & Hunting | 16 (57.1%) | 12 (42.9%) |
| Mining, Quarrying, & Extraction | 44 (100.0%) | 0 (0.0%) |
| Construction | 83 (83.8%) | 16 (16.2%) |
| Manufacturing | 55 (49.5%) | 56 (50.4%) |
| Wholesale Trade | 22 (66.7%) | 11 (33.3%) |
| Retail Trade | 58 (61.1%) | 37 (39.0%) |
| Transportation & Warehousing | 35 (76.1%) | 11 (23.9%) |
| Utilities | 69 (71.9%) | 27 (28.1%) |
| Information | 0 (0.0%) | 0 (0.0%) |
| Finance & Insurance | 22 (100.0%) | 0 (0.0%) |
| Real Estate, Rental & Leasing | 0 (0.0%) | 11 (100.0%) |
| Professional & Scientific | 0 (0.0%) | 0 (0.0%) |
| Enterprise Management | 0 (0.0%) | 0 (0.0%) |
| Administrative & Support | 55 (100.0%) | 0 (0.0%) |
| Educational Services | 105 (27.5%) | 277 (72.5%) |
| Health Care & Social Assistance | 81 (10.9%) | 664 (89.1%) |
| Arts, Entertainment & Recreation | 87 (77.7%) | 25 (22.3%) |
| Accommodation & Food Services | 38 (30.4%) | 87 (69.6%) |
| Public Administration | 43 (53.7%) | 37 (46.3%) |
| Total | 859 (39.8%) | 1,300 (60.2%) |
Education in Jefferson County
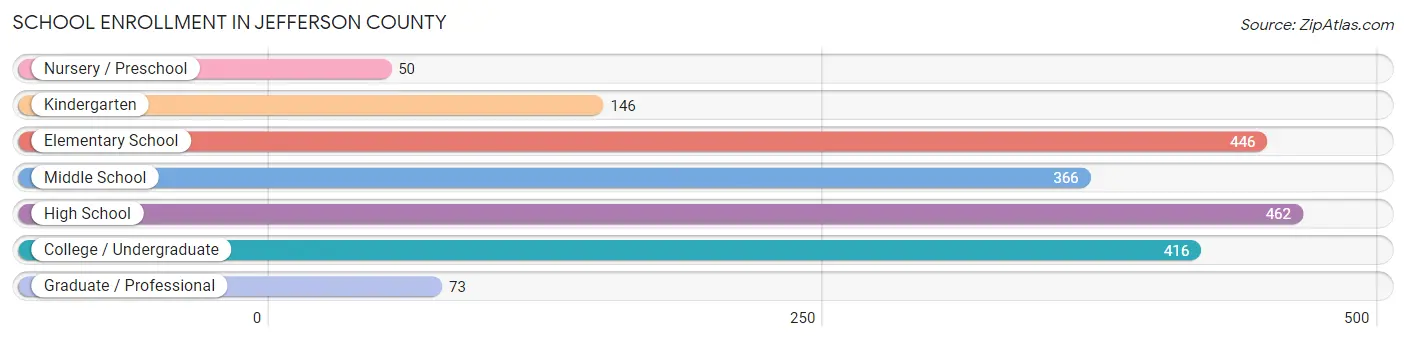
School Enrollment in Jefferson County
The most common levels of schooling among the 1,959 students in Jefferson County are high school (462 | 23.6%), elementary school (446 | 22.8%), and college / undergraduate (416 | 21.2%).
| School Level | # Students | % Students |
| Nursery / Preschool | 50 | 2.5% |
| Kindergarten | 146 | 7.4% |
| Elementary School | 446 | 22.8% |
| Middle School | 366 | 18.7% |
| High School | 462 | 23.6% |
| College / Undergraduate | 416 | 21.2% |
| Graduate / Professional | 73 | 3.7% |
| Total | 1,959 | 100.0% |
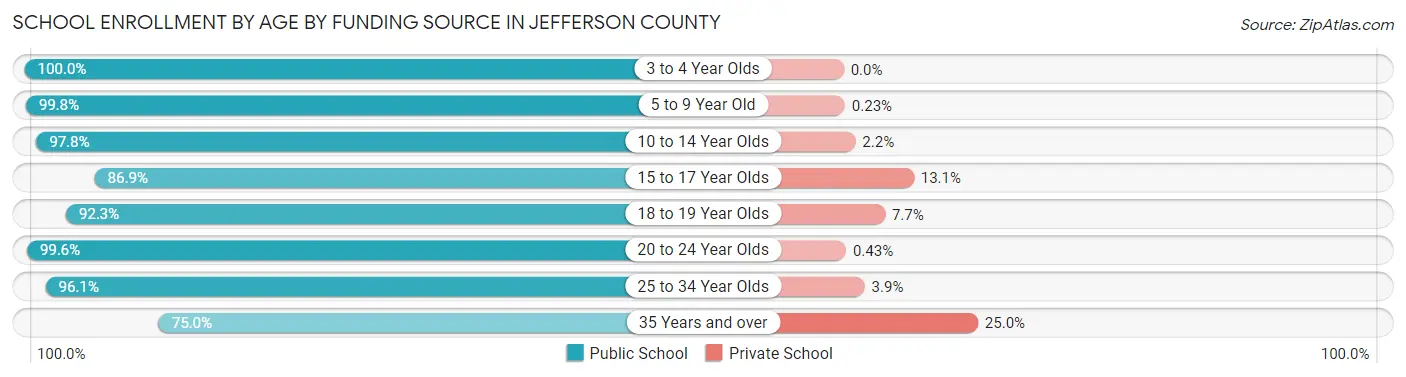
School Enrollment by Age by Funding Source in Jefferson County
Out of a total of 1,959 students who are enrolled in schools in Jefferson County, 94 (4.8%) attend a private institution, while the remaining 1,865 (95.2%) are enrolled in public schools. The age group of 35 years and over has the highest likelihood of being enrolled in private schools, with 31 (25.0% in the age bracket) enrolled. Conversely, the age group of 3 to 4 year olds has the lowest likelihood of being enrolled in a private school, with 167 (100.0% in the age bracket) attending a public institution.
| Age Bracket | Public School | Private School |
| 3 to 4 Year Olds | 167 (100.0%) | 0 (0.0%) |
| 5 to 9 Year Old | 427 (99.8%) | 1 (0.2%) |
| 10 to 14 Year Olds | 447 (97.8%) | 10 (2.2%) |
| 15 to 17 Year Olds | 233 (86.9%) | 35 (13.1%) |
| 18 to 19 Year Olds | 144 (92.3%) | 12 (7.7%) |
| 20 to 24 Year Olds | 230 (99.6%) | 1 (0.4%) |
| 25 to 34 Year Olds | 123 (96.1%) | 5 (3.9%) |
| 35 Years and over | 93 (75.0%) | 31 (25.0%) |
| Total | 1,865 (95.2%) | 94 (4.8%) |
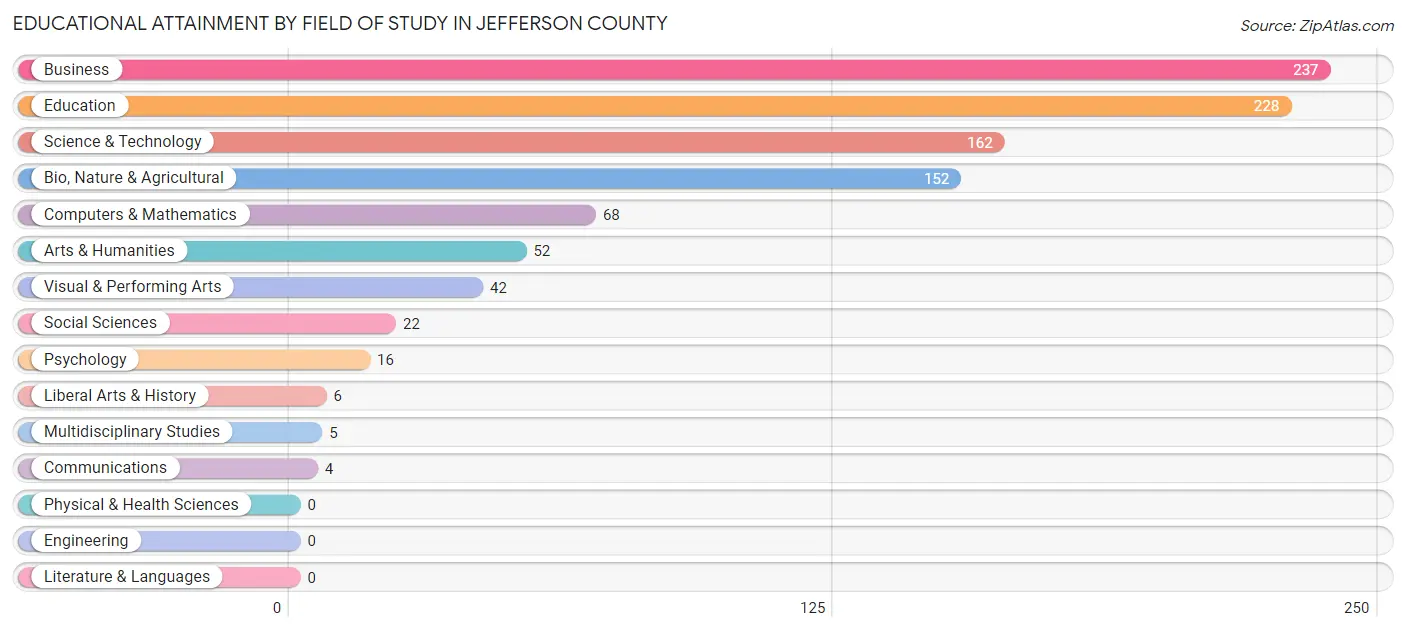
Educational Attainment by Field of Study in Jefferson County
Business (237 | 23.8%), education (228 | 22.9%), science & technology (162 | 16.3%), bio, nature & agricultural (152 | 15.3%), and computers & mathematics (68 | 6.8%) are the most common fields of study among 994 individuals in Jefferson County who have obtained a bachelor's degree or higher.
| Field of Study | # Graduates | % Graduates |
| Computers & Mathematics | 68 | 6.8% |
| Bio, Nature & Agricultural | 152 | 15.3% |
| Physical & Health Sciences | 0 | 0.0% |
| Psychology | 16 | 1.6% |
| Social Sciences | 22 | 2.2% |
| Engineering | 0 | 0.0% |
| Multidisciplinary Studies | 5 | 0.5% |
| Science & Technology | 162 | 16.3% |
| Business | 237 | 23.8% |
| Education | 228 | 22.9% |
| Literature & Languages | 0 | 0.0% |
| Liberal Arts & History | 6 | 0.6% |
| Visual & Performing Arts | 42 | 4.2% |
| Communications | 4 | 0.4% |
| Arts & Humanities | 52 | 5.2% |
| Total | 994 | 100.0% |
Transportation & Commute in Jefferson County
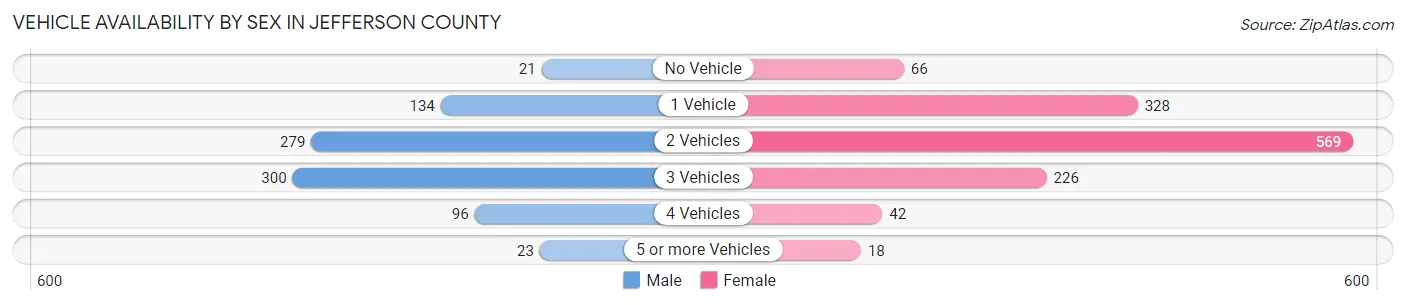
Vehicle Availability by Sex in Jefferson County
The most prevalent vehicle ownership categories in Jefferson County are males with 3 vehicles (300, accounting for 35.2%) and females with 3 vehicles (226, making up 24.0%).
| Vehicles Available | Male | Female |
| No Vehicle | 21 (2.5%) | 66 (5.3%) |
| 1 Vehicle | 134 (15.7%) | 328 (26.3%) |
| 2 Vehicles | 279 (32.7%) | 569 (45.6%) |
| 3 Vehicles | 300 (35.2%) | 226 (18.1%) |
| 4 Vehicles | 96 (11.3%) | 42 (3.4%) |
| 5 or more Vehicles | 23 (2.7%) | 18 (1.4%) |
| Total | 853 (100.0%) | 1,249 (100.0%) |
Commute Time in Jefferson County
The most frequently occuring commute durations in Jefferson County are less than 5 minutes (310 commuters, 14.9%), 5 to 9 minutes (264 commuters, 12.7%), and 30 to 34 minutes (235 commuters, 11.3%).
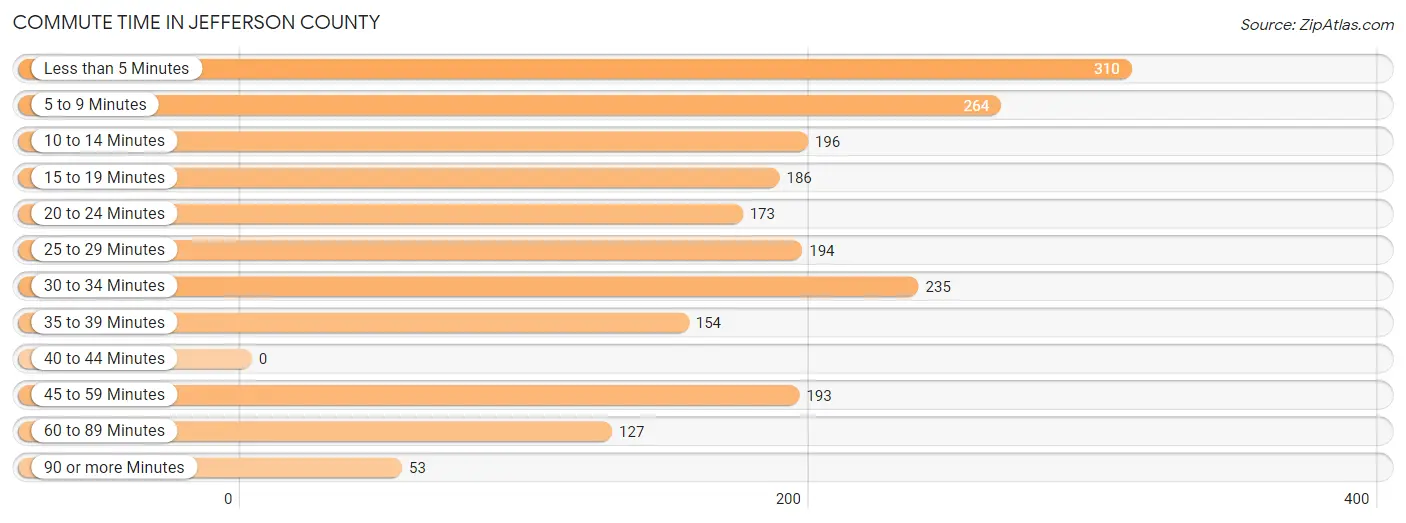
| Commute Time | # Commuters | % Commuters |
| Less than 5 Minutes | 310 | 14.9% |
| 5 to 9 Minutes | 264 | 12.7% |
| 10 to 14 Minutes | 196 | 9.4% |
| 15 to 19 Minutes | 186 | 8.9% |
| 20 to 24 Minutes | 173 | 8.3% |
| 25 to 29 Minutes | 194 | 9.3% |
| 30 to 34 Minutes | 235 | 11.3% |
| 35 to 39 Minutes | 154 | 7.4% |
| 40 to 44 Minutes | 0 | 0.0% |
| 45 to 59 Minutes | 193 | 9.3% |
| 60 to 89 Minutes | 127 | 6.1% |
| 90 or more Minutes | 53 | 2.5% |
Commute Time by Sex in Jefferson County
The most common commute times in Jefferson County are 25 to 29 minutes (124 commuters, 14.8%) for males and 5 to 9 minutes (217 commuters, 17.4%) for females.
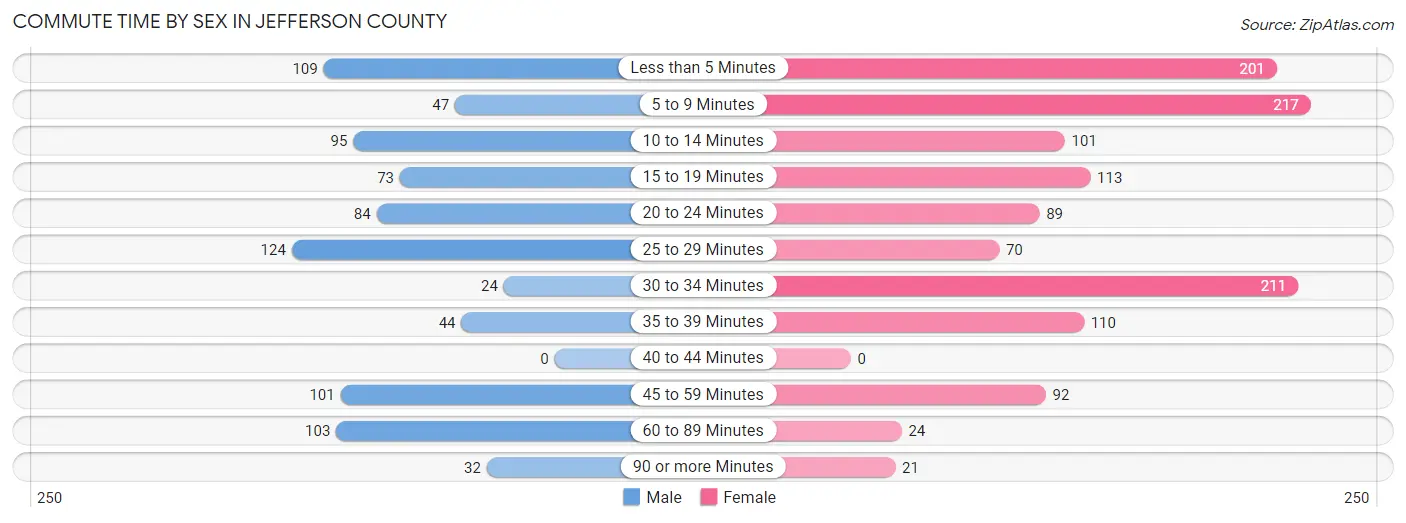
| Commute Time | Male | Female |
| Less than 5 Minutes | 109 (13.0%) | 201 (16.1%) |
| 5 to 9 Minutes | 47 (5.6%) | 217 (17.4%) |
| 10 to 14 Minutes | 95 (11.4%) | 101 (8.1%) |
| 15 to 19 Minutes | 73 (8.7%) | 113 (9.0%) |
| 20 to 24 Minutes | 84 (10.1%) | 89 (7.1%) |
| 25 to 29 Minutes | 124 (14.8%) | 70 (5.6%) |
| 30 to 34 Minutes | 24 (2.9%) | 211 (16.9%) |
| 35 to 39 Minutes | 44 (5.3%) | 110 (8.8%) |
| 40 to 44 Minutes | 0 (0.0%) | 0 (0.0%) |
| 45 to 59 Minutes | 101 (12.1%) | 92 (7.4%) |
| 60 to 89 Minutes | 103 (12.3%) | 24 (1.9%) |
| 90 or more Minutes | 32 (3.8%) | 21 (1.7%) |
Time of Departure to Work by Sex in Jefferson County
The most frequent times of departure to work in Jefferson County are 5:00 AM to 5:29 AM (175, 20.9%) for males and 6:00 AM to 6:29 AM (325, 26.0%) for females.
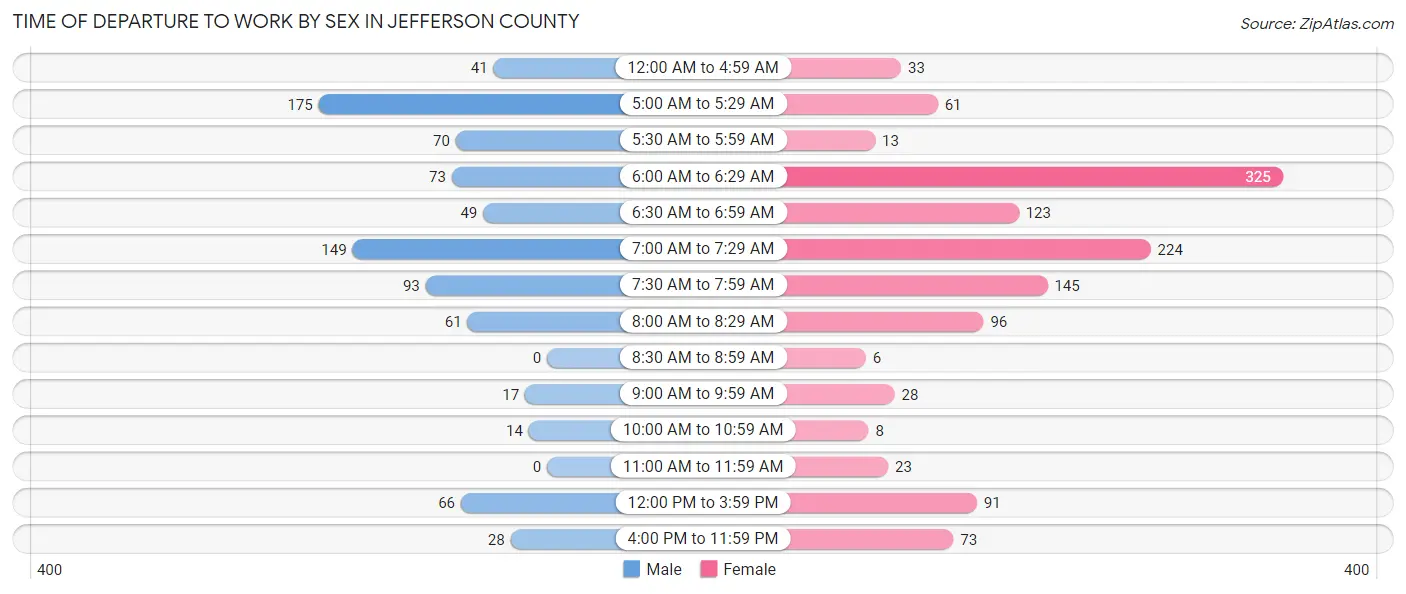
| Time of Departure | Male | Female |
| 12:00 AM to 4:59 AM | 41 (4.9%) | 33 (2.6%) |
| 5:00 AM to 5:29 AM | 175 (20.9%) | 61 (4.9%) |
| 5:30 AM to 5:59 AM | 70 (8.4%) | 13 (1.0%) |
| 6:00 AM to 6:29 AM | 73 (8.7%) | 325 (26.0%) |
| 6:30 AM to 6:59 AM | 49 (5.9%) | 123 (9.9%) |
| 7:00 AM to 7:29 AM | 149 (17.8%) | 224 (17.9%) |
| 7:30 AM to 7:59 AM | 93 (11.1%) | 145 (11.6%) |
| 8:00 AM to 8:29 AM | 61 (7.3%) | 96 (7.7%) |
| 8:30 AM to 8:59 AM | 0 (0.0%) | 6 (0.5%) |
| 9:00 AM to 9:59 AM | 17 (2.0%) | 28 (2.2%) |
| 10:00 AM to 10:59 AM | 14 (1.7%) | 8 (0.6%) |
| 11:00 AM to 11:59 AM | 0 (0.0%) | 23 (1.8%) |
| 12:00 PM to 3:59 PM | 66 (7.9%) | 91 (7.3%) |
| 4:00 PM to 11:59 PM | 28 (3.4%) | 73 (5.8%) |
| Total | 836 (100.0%) | 1,249 (100.0%) |
Housing Occupancy in Jefferson County
Occupancy by Ownership in Jefferson County
Of the total 2,530 dwellings in Jefferson County, owner-occupied units account for 1,828 (72.3%), while renter-occupied units make up 702 (27.8%).
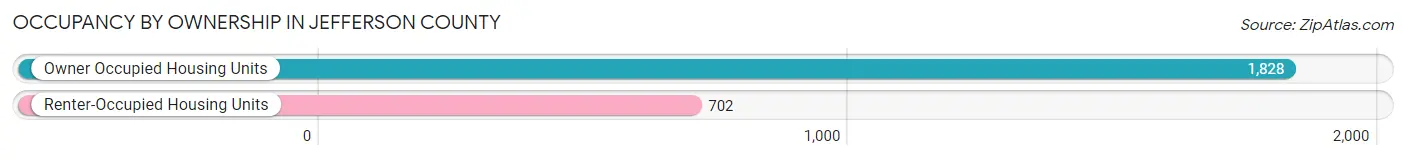
| Occupancy | # Housing Units | % Housing Units |
| Owner Occupied Housing Units | 1,828 | 72.3% |
| Renter-Occupied Housing Units | 702 | 27.8% |
| Total Occupied Housing Units | 2,530 | 100.0% |
Occupancy by Household Size in Jefferson County
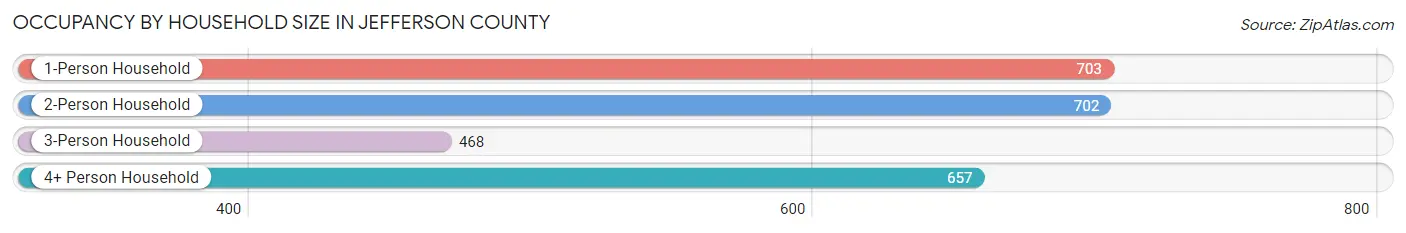
| Household Size | # Housing Units | % Housing Units |
| 1-Person Household | 703 | 27.8% |
| 2-Person Household | 702 | 27.8% |
| 3-Person Household | 468 | 18.5% |
| 4+ Person Household | 657 | 26.0% |
| Total Housing Units | 2,530 | 100.0% |
Occupancy by Ownership by Household Size in Jefferson County
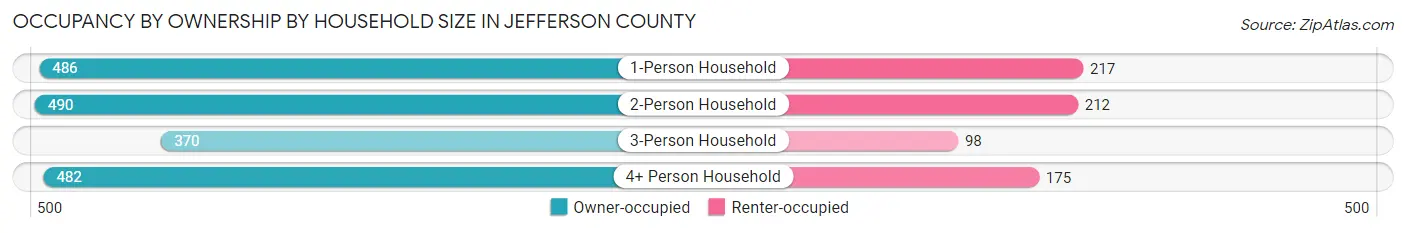
| Household Size | Owner-occupied | Renter-occupied |
| 1-Person Household | 486 (69.1%) | 217 (30.9%) |
| 2-Person Household | 490 (69.8%) | 212 (30.2%) |
| 3-Person Household | 370 (79.1%) | 98 (20.9%) |
| 4+ Person Household | 482 (73.4%) | 175 (26.6%) |
| Total Housing Units | 1,828 (72.3%) | 702 (27.8%) |
Occupancy by Educational Attainment in Jefferson County
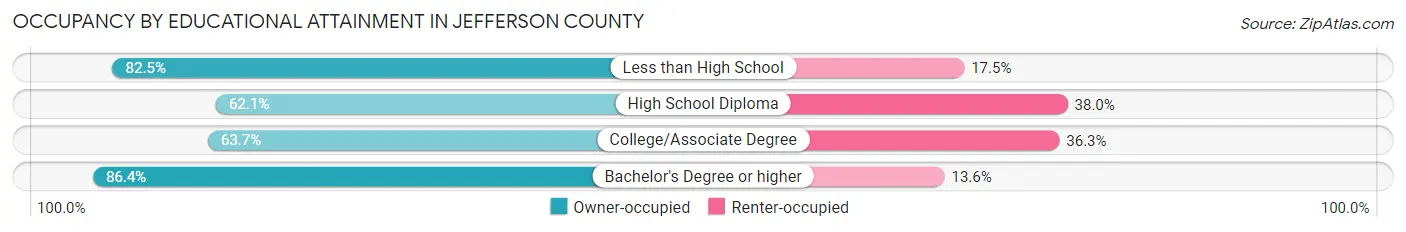
| Household Size | Owner-occupied | Renter-occupied |
| Less than High School | 468 (82.5%) | 99 (17.5%) |
| High School Diploma | 417 (62.1%) | 255 (38.0%) |
| College/Associate Degree | 484 (63.7%) | 276 (36.3%) |
| Bachelor's Degree or higher | 459 (86.4%) | 72 (13.6%) |
Occupancy by Age of Householder in Jefferson County
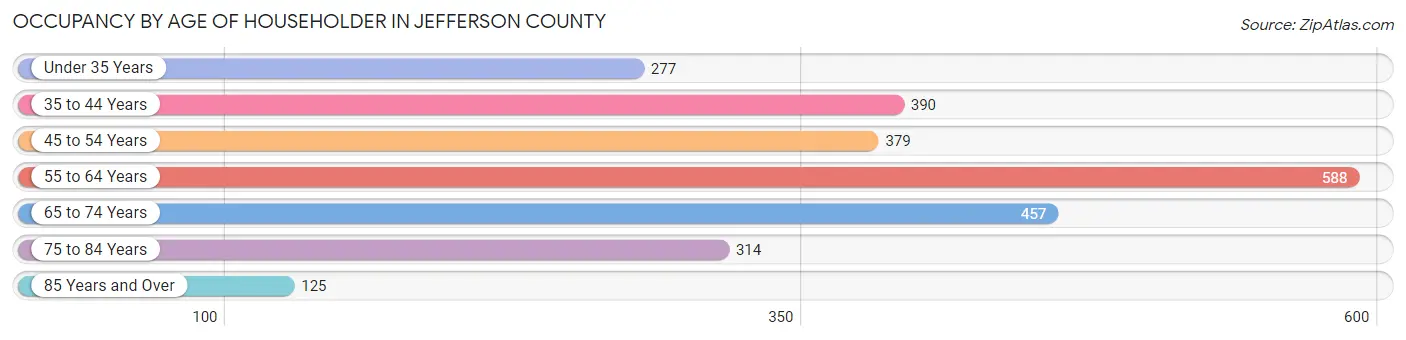
| Age Bracket | # Households | % Households |
| Under 35 Years | 277 | 11.0% |
| 35 to 44 Years | 390 | 15.4% |
| 45 to 54 Years | 379 | 15.0% |
| 55 to 64 Years | 588 | 23.2% |
| 65 to 74 Years | 457 | 18.1% |
| 75 to 84 Years | 314 | 12.4% |
| 85 Years and Over | 125 | 4.9% |
| Total | 2,530 | 100.0% |
Housing Finances in Jefferson County
Median Income by Occupancy in Jefferson County
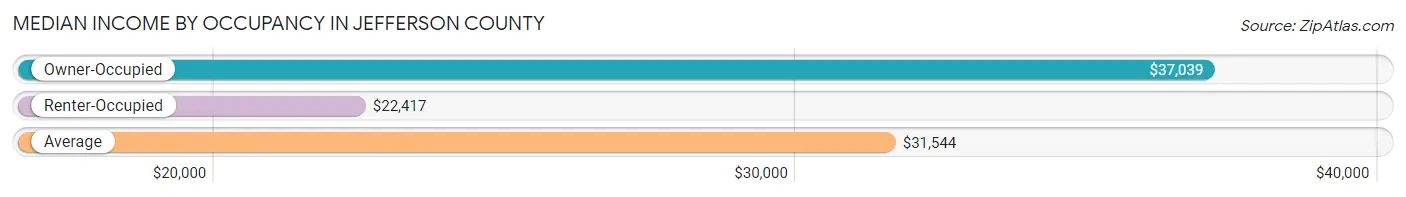
| Occupancy Type | # Households | Median Income |
| Owner-Occupied | 1,828 (72.3%) | $37,039 |
| Renter-Occupied | 702 (27.8%) | $22,417 |
| Average | 2,530 (100.0%) | $31,544 |
Occupancy by Householder Income Bracket in Jefferson County
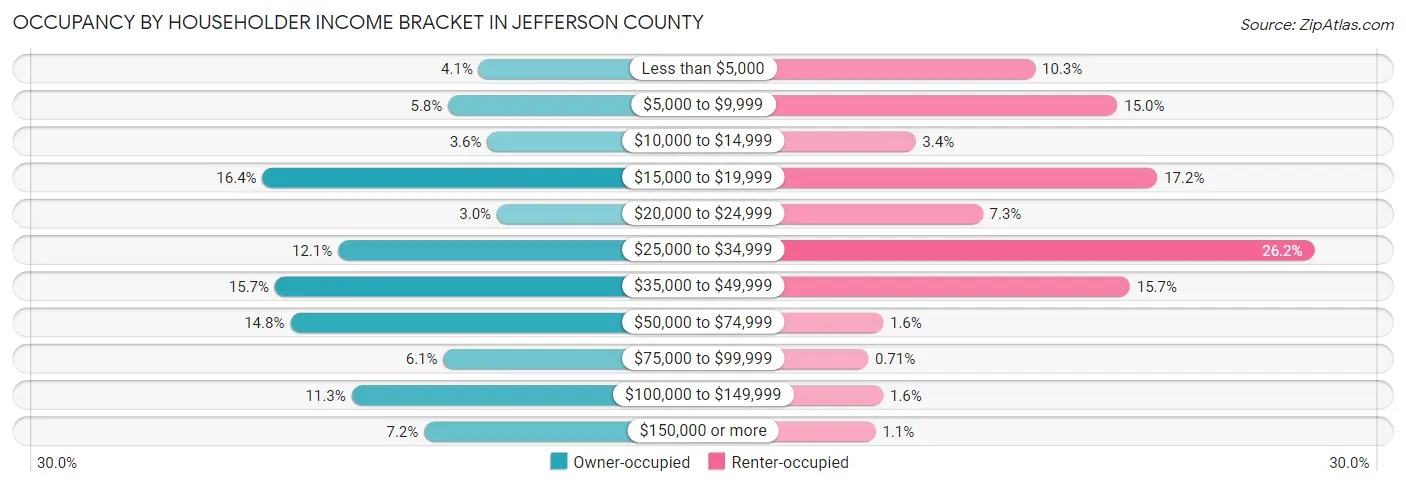
| Income Bracket | Owner-occupied | Renter-occupied |
| Less than $5,000 | 74 (4.1%) | 72 (10.3%) |
| $5,000 to $9,999 | 106 (5.8%) | 105 (15.0%) |
| $10,000 to $14,999 | 65 (3.6%) | 24 (3.4%) |
| $15,000 to $19,999 | 300 (16.4%) | 121 (17.2%) |
| $20,000 to $24,999 | 55 (3.0%) | 51 (7.3%) |
| $25,000 to $34,999 | 221 (12.1%) | 184 (26.2%) |
| $35,000 to $49,999 | 287 (15.7%) | 110 (15.7%) |
| $50,000 to $74,999 | 271 (14.8%) | 11 (1.6%) |
| $75,000 to $99,999 | 111 (6.1%) | 5 (0.7%) |
| $100,000 to $149,999 | 207 (11.3%) | 11 (1.6%) |
| $150,000 or more | 131 (7.2%) | 8 (1.1%) |
| Total | 1,828 (100.0%) | 702 (100.0%) |
Monthly Housing Cost Tiers in Jefferson County
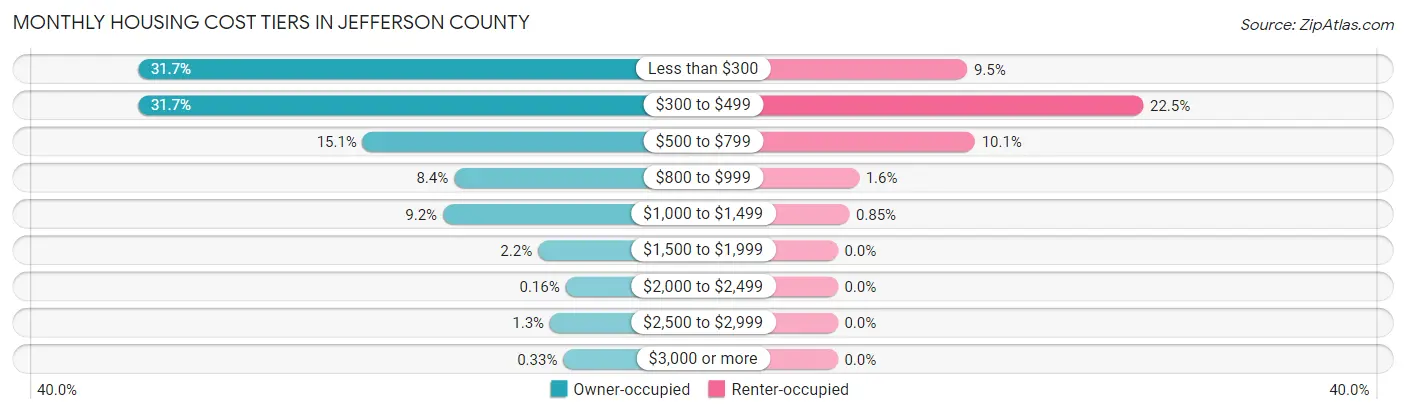
| Monthly Cost | Owner-occupied | Renter-occupied |
| Less than $300 | 579 (31.7%) | 67 (9.5%) |
| $300 to $499 | 579 (31.7%) | 158 (22.5%) |
| $500 to $799 | 276 (15.1%) | 71 (10.1%) |
| $800 to $999 | 153 (8.4%) | 11 (1.6%) |
| $1,000 to $1,499 | 168 (9.2%) | 6 (0.9%) |
| $1,500 to $1,999 | 40 (2.2%) | 0 (0.0%) |
| $2,000 to $2,499 | 3 (0.2%) | 0 (0.0%) |
| $2,500 to $2,999 | 24 (1.3%) | 0 (0.0%) |
| $3,000 or more | 6 (0.3%) | 0 (0.0%) |
| Total | 1,828 (100.0%) | 702 (100.0%) |
Physical Housing Characteristics in Jefferson County
Housing Structures in Jefferson County
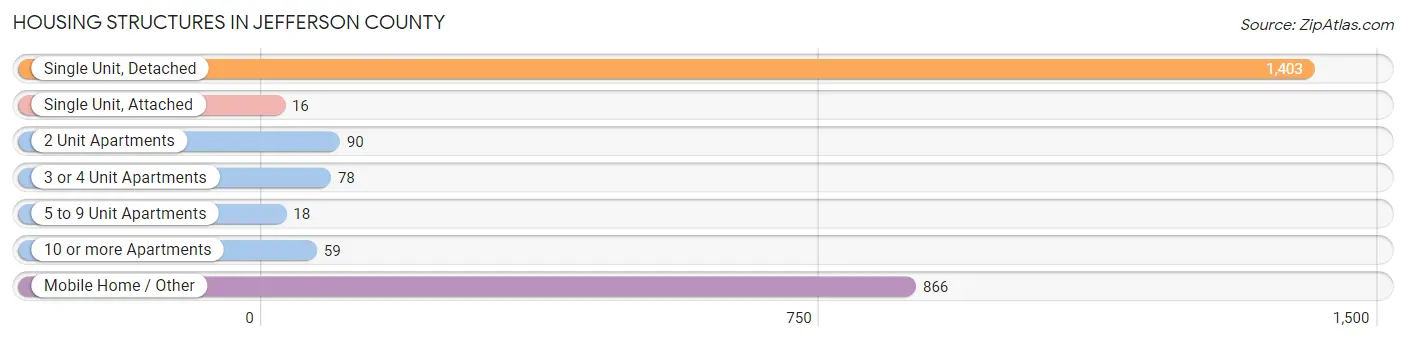
| Structure Type | # Housing Units | % Housing Units |
| Single Unit, Detached | 1,403 | 55.4% |
| Single Unit, Attached | 16 | 0.6% |
| 2 Unit Apartments | 90 | 3.6% |
| 3 or 4 Unit Apartments | 78 | 3.1% |
| 5 to 9 Unit Apartments | 18 | 0.7% |
| 10 or more Apartments | 59 | 2.3% |
| Mobile Home / Other | 866 | 34.2% |
| Total | 2,530 | 100.0% |
Housing Structures by Occupancy in Jefferson County
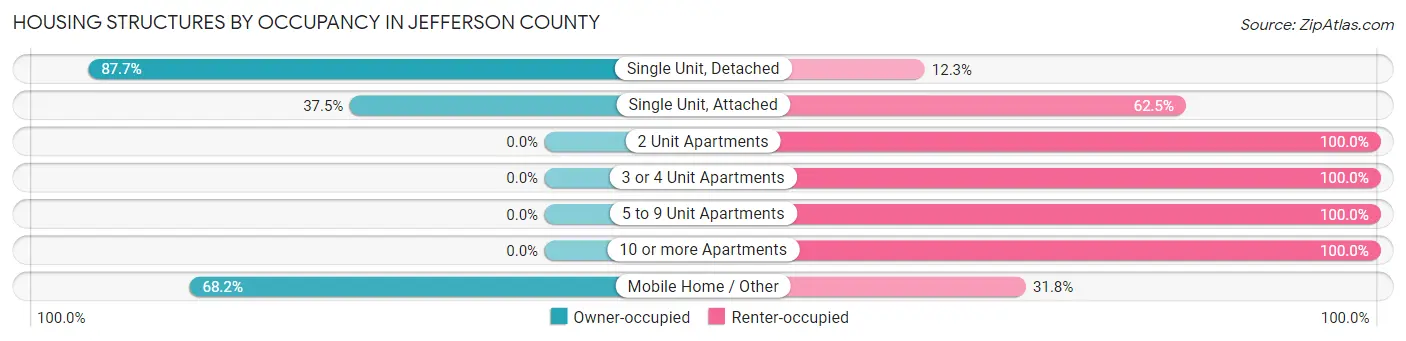
| Structure Type | Owner-occupied | Renter-occupied |
| Single Unit, Detached | 1,231 (87.7%) | 172 (12.3%) |
| Single Unit, Attached | 6 (37.5%) | 10 (62.5%) |
| 2 Unit Apartments | 0 (0.0%) | 90 (100.0%) |
| 3 or 4 Unit Apartments | 0 (0.0%) | 78 (100.0%) |
| 5 to 9 Unit Apartments | 0 (0.0%) | 18 (100.0%) |
| 10 or more Apartments | 0 (0.0%) | 59 (100.0%) |
| Mobile Home / Other | 591 (68.2%) | 275 (31.8%) |
| Total | 1,828 (72.3%) | 702 (27.8%) |
Housing Structures by Number of Rooms in Jefferson County
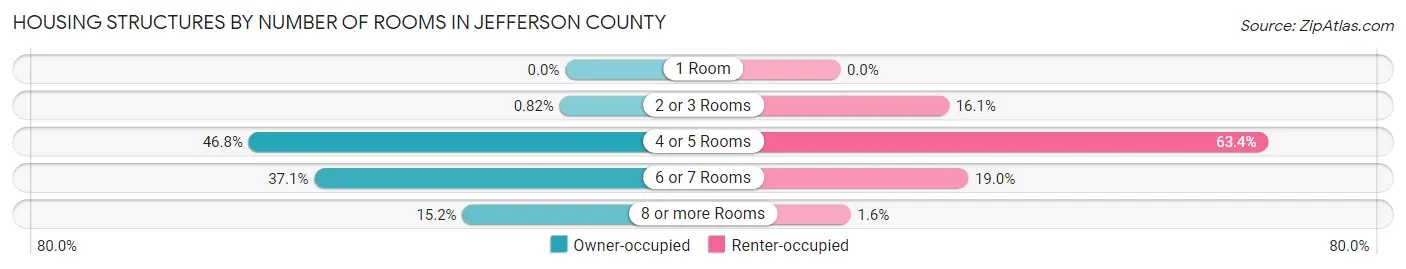
| Number of Rooms | Owner-occupied | Renter-occupied |
| 1 Room | 0 (0.0%) | 0 (0.0%) |
| 2 or 3 Rooms | 15 (0.8%) | 113 (16.1%) |
| 4 or 5 Rooms | 856 (46.8%) | 445 (63.4%) |
| 6 or 7 Rooms | 679 (37.1%) | 133 (19.0%) |
| 8 or more Rooms | 278 (15.2%) | 11 (1.6%) |
| Total | 1,828 (100.0%) | 702 (100.0%) |
Housing Structure by Heating Type in Jefferson County
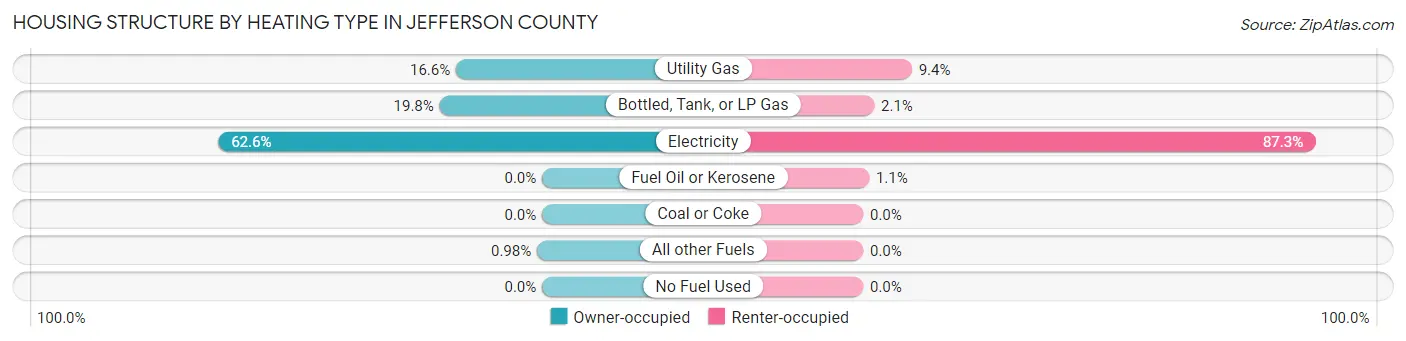
| Heating Type | Owner-occupied | Renter-occupied |
| Utility Gas | 304 (16.6%) | 66 (9.4%) |
| Bottled, Tank, or LP Gas | 362 (19.8%) | 15 (2.1%) |
| Electricity | 1,144 (62.6%) | 613 (87.3%) |
| Fuel Oil or Kerosene | 0 (0.0%) | 8 (1.1%) |
| Coal or Coke | 0 (0.0%) | 0 (0.0%) |
| All other Fuels | 18 (1.0%) | 0 (0.0%) |
| No Fuel Used | 0 (0.0%) | 0 (0.0%) |
| Total | 1,828 (100.0%) | 702 (100.0%) |
Household Vehicle Usage in Jefferson County
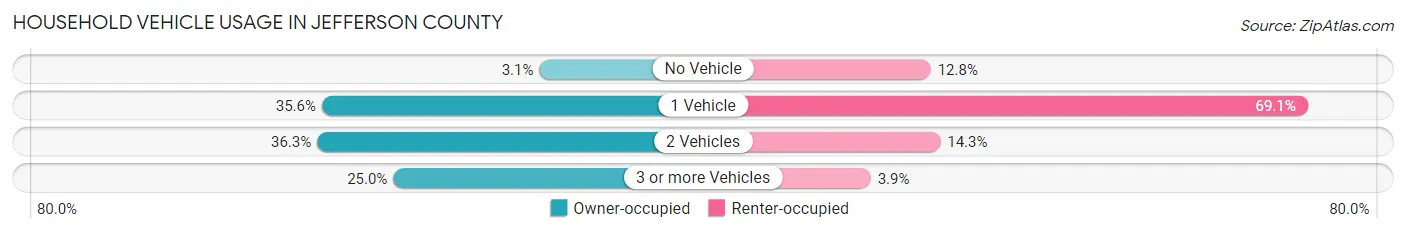
| Vehicles per Household | Owner-occupied | Renter-occupied |
| No Vehicle | 57 (3.1%) | 90 (12.8%) |
| 1 Vehicle | 651 (35.6%) | 485 (69.1%) |
| 2 Vehicles | 664 (36.3%) | 100 (14.2%) |
| 3 or more Vehicles | 456 (24.9%) | 27 (3.8%) |
| Total | 1,828 (100.0%) | 702 (100.0%) |
Real Estate & Mortgages in Jefferson County
Real Estate and Mortgage Overview in Jefferson County
| Characteristic | Without Mortgage | With Mortgage |
| Housing Units | 1,488 | 340 |
| Median Property Value | $72,700 | $82,100 |
| Median Household Income | $36,667 | $28 |
| Monthly Housing Costs | $360 | $0 |
| Real Estate Taxes | $874 | $97 |
Property Value by Mortgage Status in Jefferson County
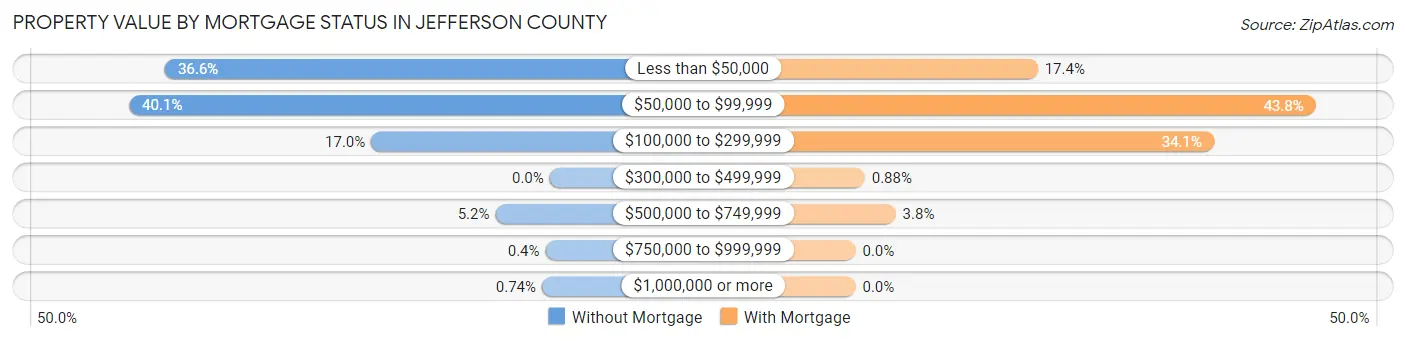
| Property Value | Without Mortgage | With Mortgage |
| Less than $50,000 | 545 (36.6%) | 59 (17.3%) |
| $50,000 to $99,999 | 596 (40.1%) | 149 (43.8%) |
| $100,000 to $299,999 | 253 (17.0%) | 116 (34.1%) |
| $300,000 to $499,999 | 0 (0.0%) | 3 (0.9%) |
| $500,000 to $749,999 | 77 (5.2%) | 13 (3.8%) |
| $750,000 to $999,999 | 6 (0.4%) | 0 (0.0%) |
| $1,000,000 or more | 11 (0.7%) | 0 (0.0%) |
| Total | 1,488 (100.0%) | 340 (100.0%) |
Household Income by Mortgage Status in Jefferson County
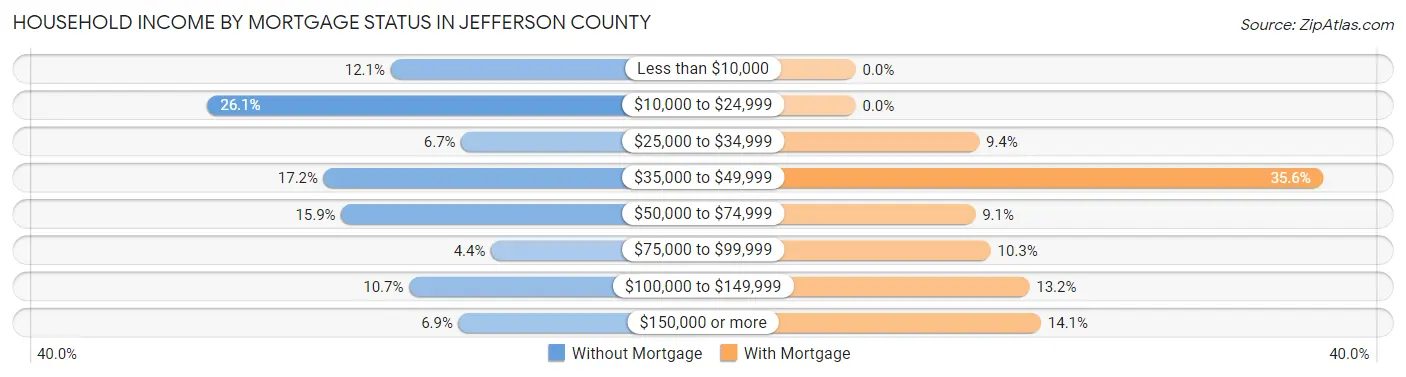
| Household Income | Without Mortgage | With Mortgage |
| Less than $10,000 | 180 (12.1%) | 0 (0.0%) |
| $10,000 to $24,999 | 388 (26.1%) | 0 (0.0%) |
| $25,000 to $34,999 | 100 (6.7%) | 32 (9.4%) |
| $35,000 to $49,999 | 256 (17.2%) | 121 (35.6%) |
| $50,000 to $74,999 | 236 (15.9%) | 31 (9.1%) |
| $75,000 to $99,999 | 66 (4.4%) | 35 (10.3%) |
| $100,000 to $149,999 | 159 (10.7%) | 45 (13.2%) |
| $150,000 or more | 103 (6.9%) | 48 (14.1%) |
| Total | 1,488 (100.0%) | 340 (100.0%) |
Property Value to Household Income Ratio in Jefferson County
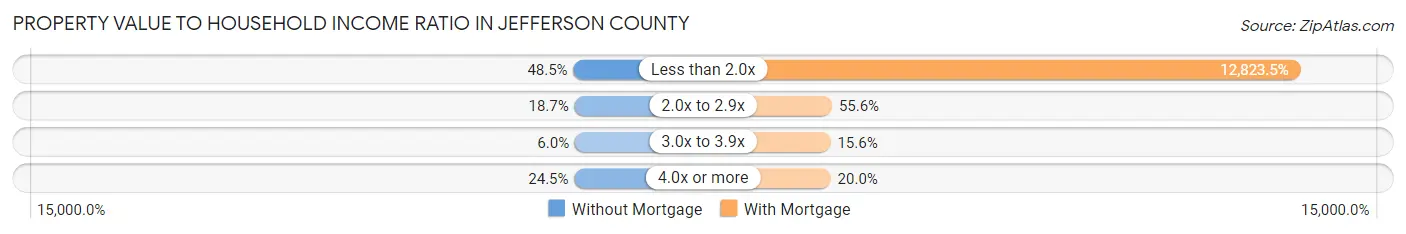
| Value-to-Income Ratio | Without Mortgage | With Mortgage |
| Less than 2.0x | 722 (48.5%) | 43,600 (12,823.5%) |
| 2.0x to 2.9x | 278 (18.7%) | 189 (55.6%) |
| 3.0x to 3.9x | 89 (6.0%) | 53 (15.6%) |
| 4.0x or more | 364 (24.5%) | 68 (20.0%) |
| Total | 1,488 (100.0%) | 340 (100.0%) |
Real Estate Taxes by Mortgage Status in Jefferson County
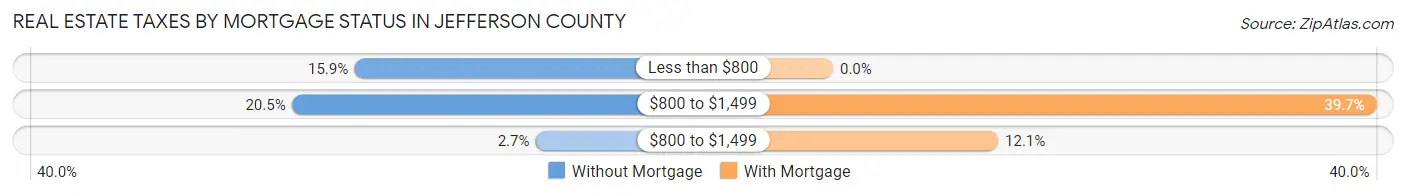
| Property Taxes | Without Mortgage | With Mortgage |
| Less than $800 | 237 (15.9%) | 0 (0.0%) |
| $800 to $1,499 | 305 (20.5%) | 135 (39.7%) |
| $800 to $1,499 | 40 (2.7%) | 41 (12.1%) |
| Total | 1,488 (100.0%) | 340 (100.0%) |
Health & Disability in Jefferson County
Health Insurance Coverage by Age in Jefferson County
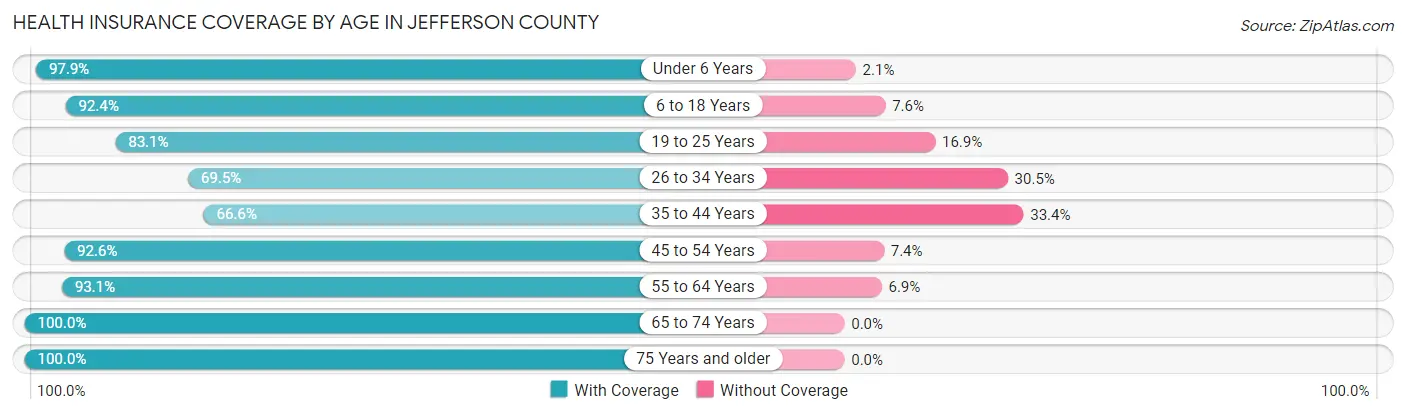
| Age Bracket | With Coverage | Without Coverage |
| Under 6 Years | 415 (97.9%) | 9 (2.1%) |
| 6 to 18 Years | 1,187 (92.4%) | 98 (7.6%) |
| 19 to 25 Years | 442 (83.1%) | 90 (16.9%) |
| 26 to 34 Years | 379 (69.5%) | 166 (30.5%) |
| 35 to 44 Years | 523 (66.6%) | 262 (33.4%) |
| 45 to 54 Years | 818 (92.6%) | 65 (7.4%) |
| 55 to 64 Years | 952 (93.1%) | 71 (6.9%) |
| 65 to 74 Years | 687 (100.0%) | 0 (0.0%) |
| 75 Years and older | 575 (100.0%) | 0 (0.0%) |
| Total | 5,978 (88.7%) | 761 (11.3%) |
Health Insurance Coverage by Citizenship Status in Jefferson County
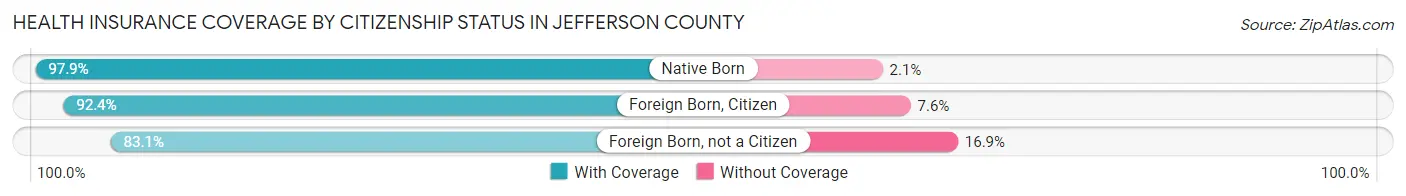
| Citizenship Status | With Coverage | Without Coverage |
| Native Born | 415 (97.9%) | 9 (2.1%) |
| Foreign Born, Citizen | 1,187 (92.4%) | 98 (7.6%) |
| Foreign Born, not a Citizen | 442 (83.1%) | 90 (16.9%) |
Health Insurance Coverage by Household Income in Jefferson County
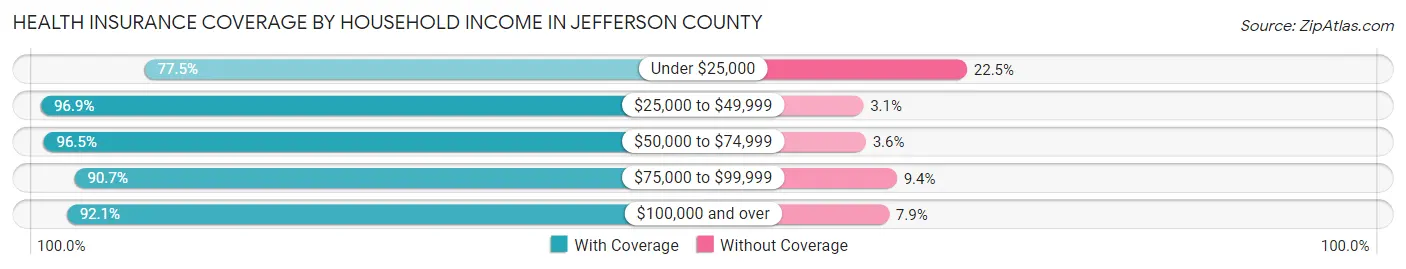
| Household Income | With Coverage | Without Coverage |
| Under $25,000 | 1,863 (77.5%) | 541 (22.5%) |
| $25,000 to $49,999 | 1,825 (96.9%) | 58 (3.1%) |
| $50,000 to $74,999 | 788 (96.5%) | 29 (3.5%) |
| $75,000 to $99,999 | 252 (90.6%) | 26 (9.3%) |
| $100,000 and over | 1,250 (92.1%) | 107 (7.9%) |
Public vs Private Health Insurance Coverage by Age in Jefferson County
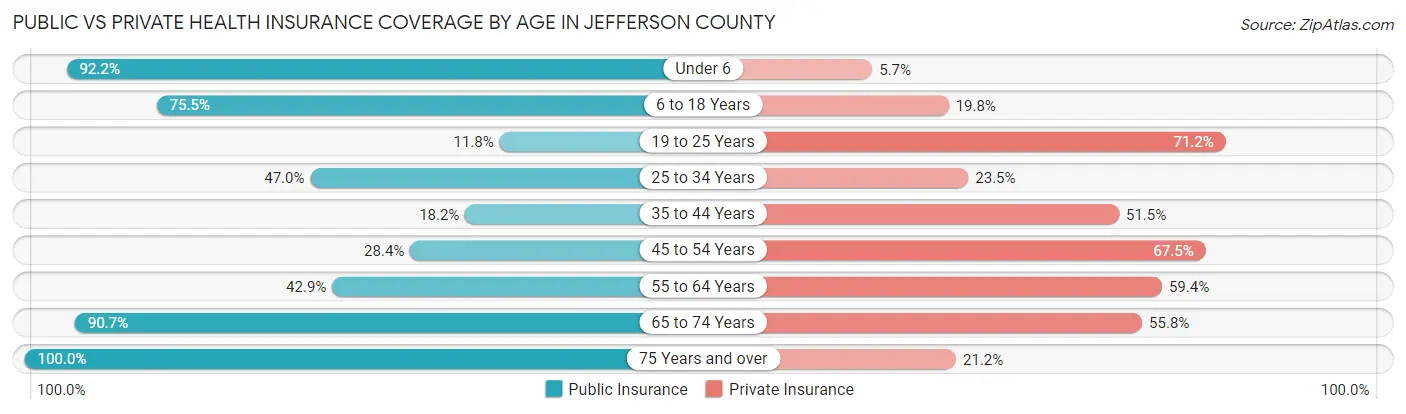
| Age Bracket | Public Insurance | Private Insurance |
| Under 6 | 391 (92.2%) | 24 (5.7%) |
| 6 to 18 Years | 970 (75.5%) | 255 (19.8%) |
| 19 to 25 Years | 63 (11.8%) | 379 (71.2%) |
| 25 to 34 Years | 256 (47.0%) | 128 (23.5%) |
| 35 to 44 Years | 143 (18.2%) | 404 (51.5%) |
| 45 to 54 Years | 251 (28.4%) | 596 (67.5%) |
| 55 to 64 Years | 439 (42.9%) | 608 (59.4%) |
| 65 to 74 Years | 623 (90.7%) | 383 (55.7%) |
| 75 Years and over | 575 (100.0%) | 122 (21.2%) |
| Total | 3,711 (55.1%) | 2,899 (43.0%) |
Disability Status by Sex by Age in Jefferson County
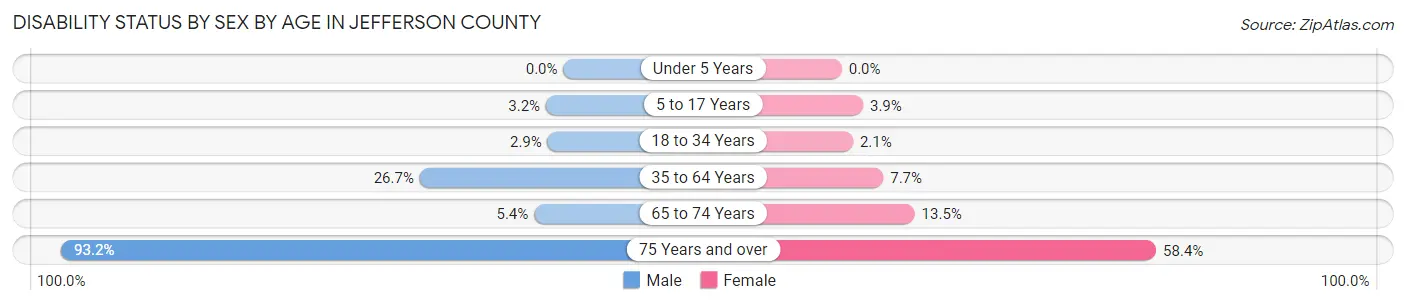
| Age Bracket | Male | Female |
| Under 5 Years | 0 (0.0%) | 0 (0.0%) |
| 5 to 17 Years | 18 (3.2%) | 24 (3.9%) |
| 18 to 34 Years | 16 (2.9%) | 14 (2.1%) |
| 35 to 64 Years | 333 (26.7%) | 111 (7.7%) |
| 65 to 74 Years | 18 (5.4%) | 48 (13.5%) |
| 75 Years and over | 151 (93.2%) | 241 (58.4%) |
Disability Class by Sex by Age in Jefferson County
Disability Class: Hearing Difficulty
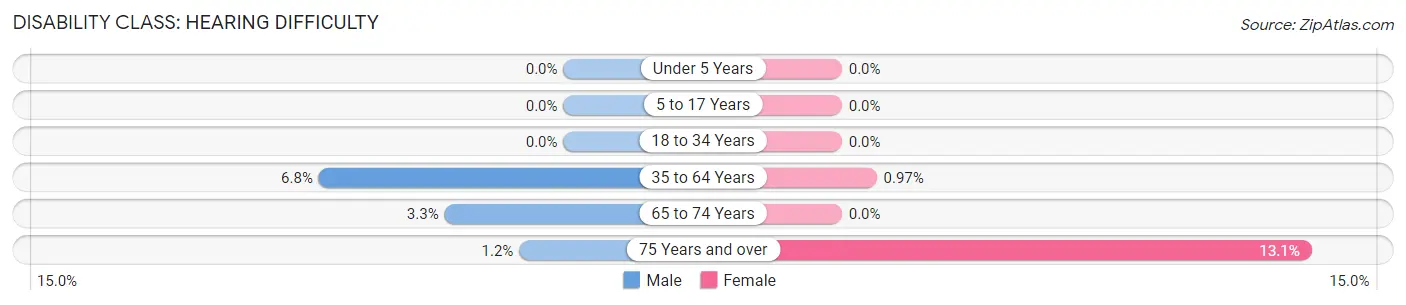
| Age Bracket | Male | Female |
| Under 5 Years | 0 (0.0%) | 0 (0.0%) |
| 5 to 17 Years | 0 (0.0%) | 0 (0.0%) |
| 18 to 34 Years | 0 (0.0%) | 0 (0.0%) |
| 35 to 64 Years | 85 (6.8%) | 14 (1.0%) |
| 65 to 74 Years | 11 (3.3%) | 0 (0.0%) |
| 75 Years and over | 2 (1.2%) | 54 (13.1%) |
Disability Class: Vision Difficulty
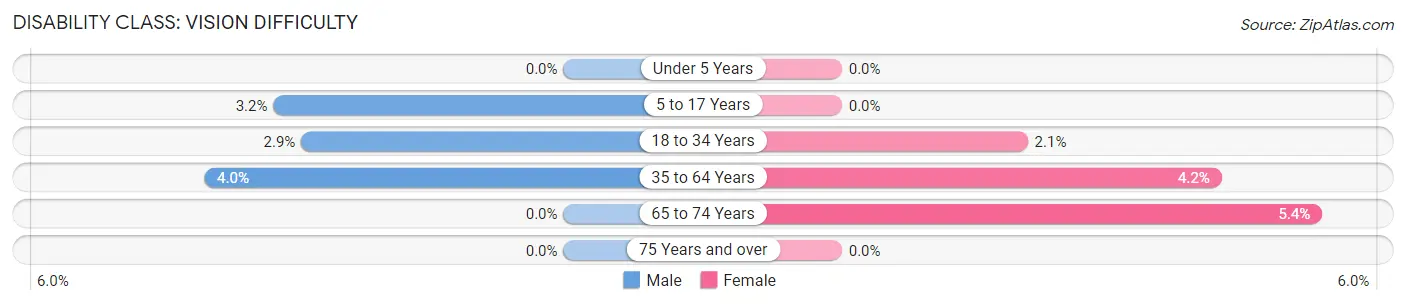
| Age Bracket | Male | Female |
| Under 5 Years | 0 (0.0%) | 0 (0.0%) |
| 5 to 17 Years | 18 (3.2%) | 0 (0.0%) |
| 18 to 34 Years | 16 (2.9%) | 14 (2.1%) |
| 35 to 64 Years | 50 (4.0%) | 61 (4.2%) |
| 65 to 74 Years | 0 (0.0%) | 19 (5.3%) |
| 75 Years and over | 0 (0.0%) | 0 (0.0%) |
Disability Class: Cognitive Difficulty
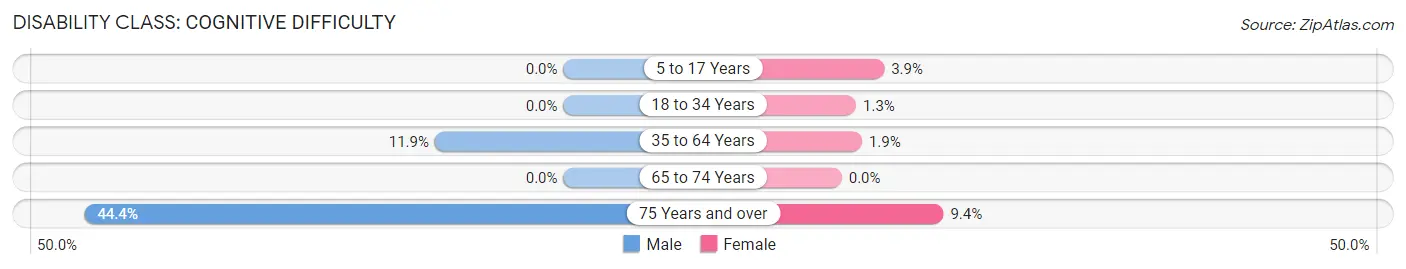
| Age Bracket | Male | Female |
| 5 to 17 Years | 0 (0.0%) | 24 (3.9%) |
| 18 to 34 Years | 0 (0.0%) | 9 (1.3%) |
| 35 to 64 Years | 149 (11.9%) | 27 (1.9%) |
| 65 to 74 Years | 0 (0.0%) | 0 (0.0%) |
| 75 Years and over | 72 (44.4%) | 39 (9.4%) |
Disability Class: Ambulatory Difficulty
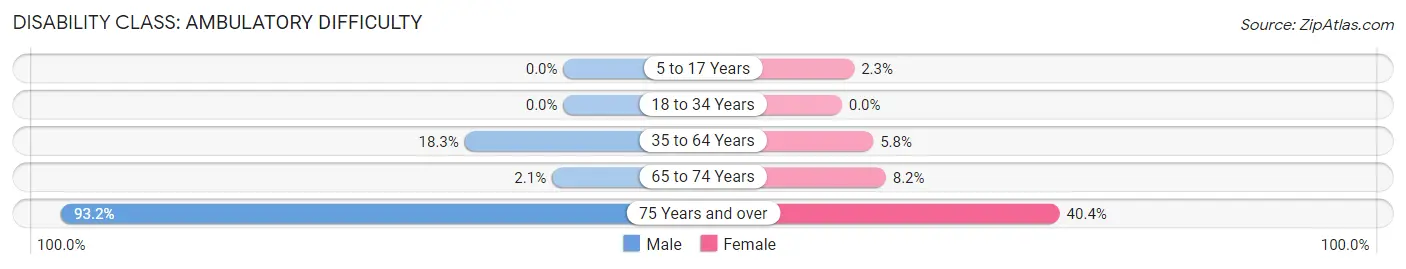
| Age Bracket | Male | Female |
| 5 to 17 Years | 0 (0.0%) | 14 (2.3%) |
| 18 to 34 Years | 0 (0.0%) | 0 (0.0%) |
| 35 to 64 Years | 229 (18.3%) | 84 (5.8%) |
| 65 to 74 Years | 7 (2.1%) | 29 (8.2%) |
| 75 Years and over | 151 (93.2%) | 167 (40.4%) |
Disability Class: Self-Care Difficulty
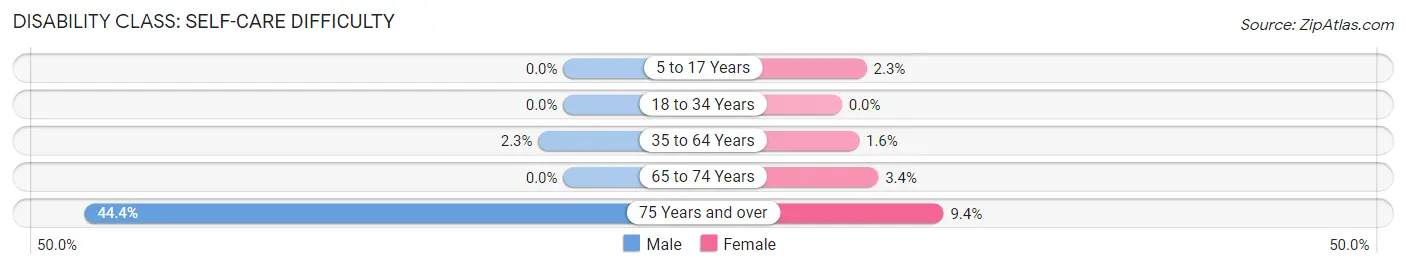
| Age Bracket | Male | Female |
| 5 to 17 Years | 0 (0.0%) | 14 (2.3%) |
| 18 to 34 Years | 0 (0.0%) | 0 (0.0%) |
| 35 to 64 Years | 29 (2.3%) | 23 (1.6%) |
| 65 to 74 Years | 0 (0.0%) | 12 (3.4%) |
| 75 Years and over | 72 (44.4%) | 39 (9.4%) |
Technology Access in Jefferson County
Computing Device Access in Jefferson County
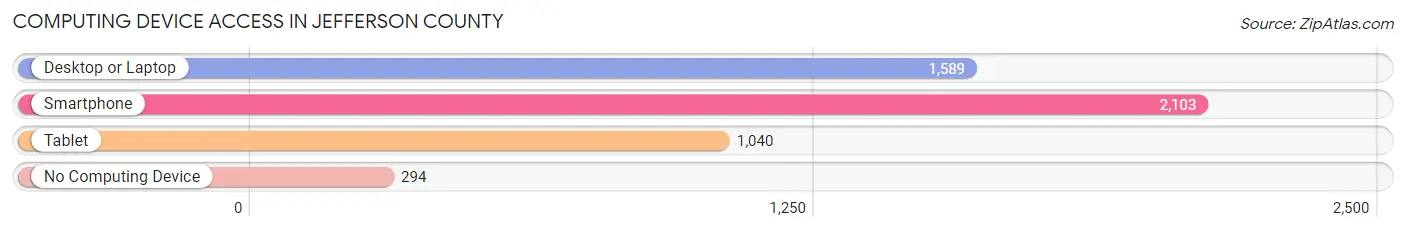
| Device Type | # Households | % Households |
| Desktop or Laptop | 1,589 | 62.8% |
| Smartphone | 2,103 | 83.1% |
| Tablet | 1,040 | 41.1% |
| No Computing Device | 294 | 11.6% |
| Total | 2,530 | 100.0% |
Internet Access in Jefferson County
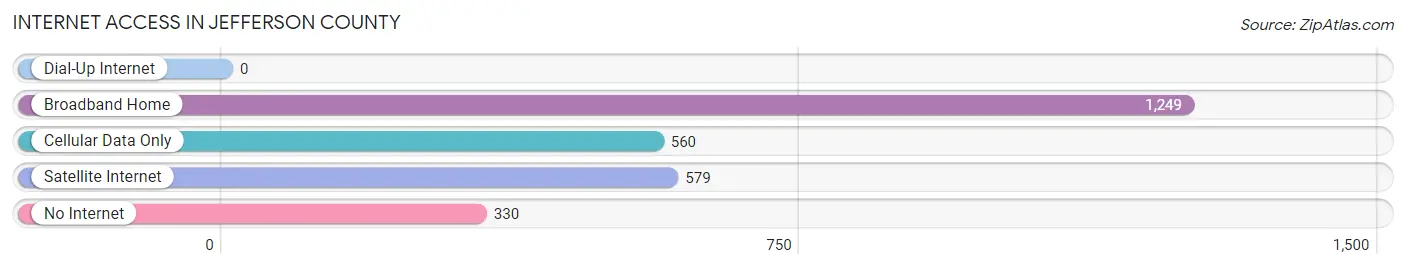
| Internet Type | # Households | % Households |
| Dial-Up Internet | 0 | 0.0% |
| Broadband Home | 1,249 | 49.4% |
| Cellular Data Only | 560 | 22.1% |
| Satellite Internet | 579 | 22.9% |
| No Internet | 330 | 13.0% |
| Total | 2,530 | 100.0% |
Jefferson County Summary
Jefferson County is located in the southeastern corner of Mississippi, and is bordered by the states of Louisiana and Arkansas. It is part of the Mississippi Delta region, and is known for its rich agricultural heritage. The county was established in 1802, and is named after Thomas Jefferson, the third President of the United States.
Geography
Jefferson County covers an area of 845 square miles, and is located in the southeastern corner of Mississippi. It is bordered by the states of Louisiana and Arkansas, and is part of the Mississippi Delta region. The county is mostly flat, with some rolling hills in the northern part. The terrain is mostly covered in forests and swamps, with some open fields and pastures. The county is drained by the Big Black River, which flows through the county from north to south.
The climate of Jefferson County is humid subtropical, with hot, humid summers and mild winters. The average annual temperature is around 70°F, and the average annual precipitation is around 50 inches.
Economy
The economy of Jefferson County is largely based on agriculture. The county is known for its rich agricultural heritage, and is home to many farms and ranches. The main crops grown in the county are cotton, soybeans, corn, and wheat. Livestock production is also important, with cattle, hogs, and poultry being the main animals raised.
In addition to agriculture, Jefferson County also has a growing manufacturing sector. The county is home to several factories that produce a variety of products, including furniture, clothing, and electronics. The county also has a growing tourism industry, with many visitors coming to the area to enjoy its natural beauty and outdoor activities.
Demographics
As of the 2010 census, Jefferson County had a population of 7,726. The population is mostly African American, making up around 70% of the total population. The median household income in the county is around $30,000, and the median home value is around $90,000.
Education
Jefferson County is served by the Jefferson County School District, which operates several elementary, middle, and high schools. The county also has several private schools, as well as a community college.
Conclusion
Jefferson County is a rural county located in the southeastern corner of Mississippi. It is known for its rich agricultural heritage, and is home to many farms and ranches. The county also has a growing manufacturing sector, and a growing tourism industry. The population is mostly African American, and the median household income is around $30,000. The county is served by the Jefferson County School District, which operates several elementary, middle, and high schools.
Common Questions
What is Per Capita Income in Jefferson County?
Per Capita income in Jefferson County is $19,366.
What is the Median Family Income in Jefferson County?
Median Family Income in Jefferson County is $37,130.
What is the Median Household income in Jefferson County?
Median Household Income in Jefferson County is $31,544.
What is Income or Wage Gap in Jefferson County?
Income or Wage Gap in Jefferson County is 11.8%.
Women in Jefferson County earn 88.2 cents for every dollar earned by a man.
What is Family Income Deficit in Jefferson County?
Family Income Deficit in Jefferson County is $14,760.
Families that are below poverty line in Jefferson County earn $14,760 less on average than the poverty threshold level.
What is Inequality or Gini Index in Jefferson County?
Inequality or Gini Index in Jefferson County is 0.51.
What is the Total Population of Jefferson County?
Total Population of Jefferson County is 7,207.
What is the Total Male Population of Jefferson County?
Total Male Population of Jefferson County is 3,448.
What is the Total Female Population of Jefferson County?
Total Female Population of Jefferson County is 3,759.
What is the Ratio of Males per 100 Females in Jefferson County?
There are 91.73 Males per 100 Females in Jefferson County.
What is the Ratio of Females per 100 Males in Jefferson County?
There are 109.02 Females per 100 Males in Jefferson County.
What is the Median Population Age in Jefferson County?
Median Population Age in Jefferson County is 41.3 Years.
What is the Average Family Size in Jefferson County
Average Family Size in Jefferson County is 3.2 People.
What is the Average Household Size in Jefferson County
Average Household Size in Jefferson County is 2.7 People.
How Large is the Labor Force in Jefferson County?
There are 2,283 People in the Labor Forcein in Jefferson County.
What is the Percentage of People in the Labor Force in Jefferson County?
39.2% of People are in the Labor Force in Jefferson County.
What is the Unemployment Rate in Jefferson County?
Unemployment Rate in Jefferson County is 5.4%.