Issaquena County, MS Map & Demographics
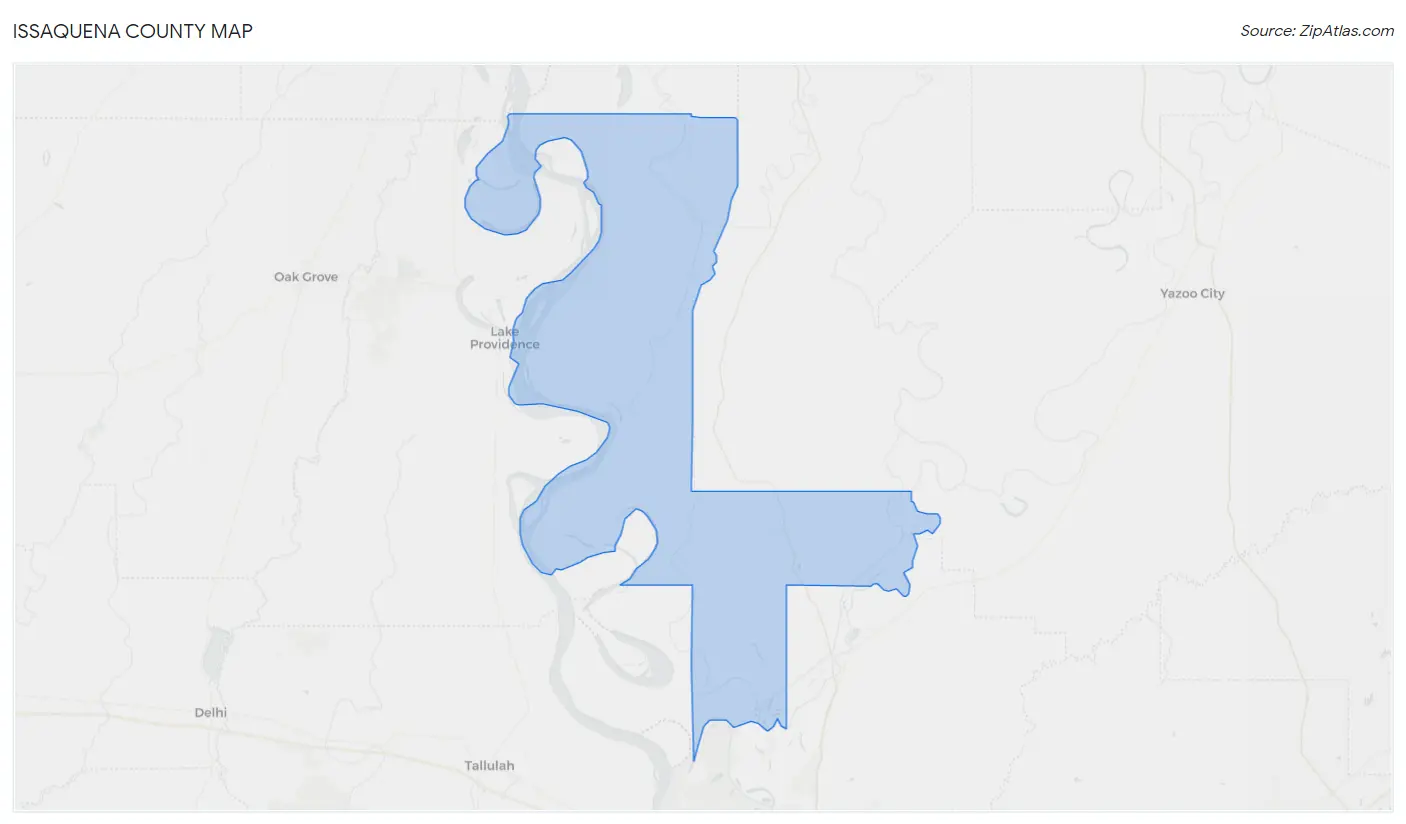
Issaquena County Map
Issaquena County Overview
$13,539
PER CAPITA INCOME
$63,688
AVG FAMILY INCOME
$17,900
AVG HOUSEHOLD INCOME
9.9%
WAGE / INCOME GAP [ % ]
90.1¢/ $1
WAGE / INCOME GAP [ $ ]
$11,413
FAMILY INCOME DEFICIT
0.49
INEQUALITY / GINI INDEX
1,206
TOTAL POPULATION
773
MALE POPULATION
433
FEMALE POPULATION
178.52
MALES / 100 FEMALES
56.02
FEMALES / 100 MALES
43.1
MEDIAN AGE
4.4
AVG FAMILY SIZE
2.2
AVG HOUSEHOLD SIZE
206
LABOR FORCE [ PEOPLE ]
18.6%
PERCENT IN LABOR FORCE
12.1%
UNEMPLOYMENT RATE
Issaquena County Area Codes
Income in Issaquena County
Income Overview in Issaquena County
Per Capita Income in Issaquena County is $13,539, while median incomes of families and households are $63,688 and $17,900 respectively.
| Characteristic | Number | Measure |
| Per Capita Income | 1,206 | $13,539 |
| Median Family Income | 131 | $63,688 |
| Mean Family Income | 131 | $65,718 |
| Median Household Income | 392 | $17,900 |
| Mean Household Income | 392 | $36,134 |
| Income Deficit | 131 | $11,413 |
| Wage / Income Gap (%) | 1,206 | 9.91% |
| Wage / Income Gap ($) | 1,206 | 90.09¢ per $1 |
| Gini / Inequality Index | 1,206 | 0.49 |
Earnings by Sex in Issaquena County
Average Earnings in Issaquena County are $21,632, $20,833 for men and $23,125 for women, a difference of 9.9%.
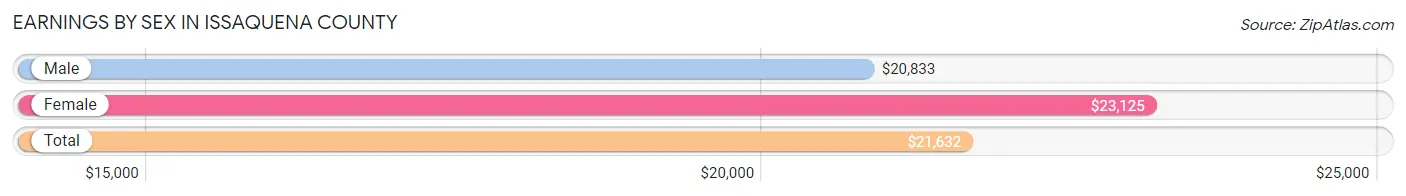
| Sex | Number | Average Earnings |
| Male | 194 (66.7%) | $20,833 |
| Female | 97 (33.3%) | $23,125 |
| Total | 291 (100.0%) | $21,632 |
Earnings by Sex by Income Bracket in Issaquena County
The most common earnings brackets in Issaquena County are $17,500 to $19,999 for men (28 | 14.4%) and $20,000 to $22,499 for women (15 | 15.5%).
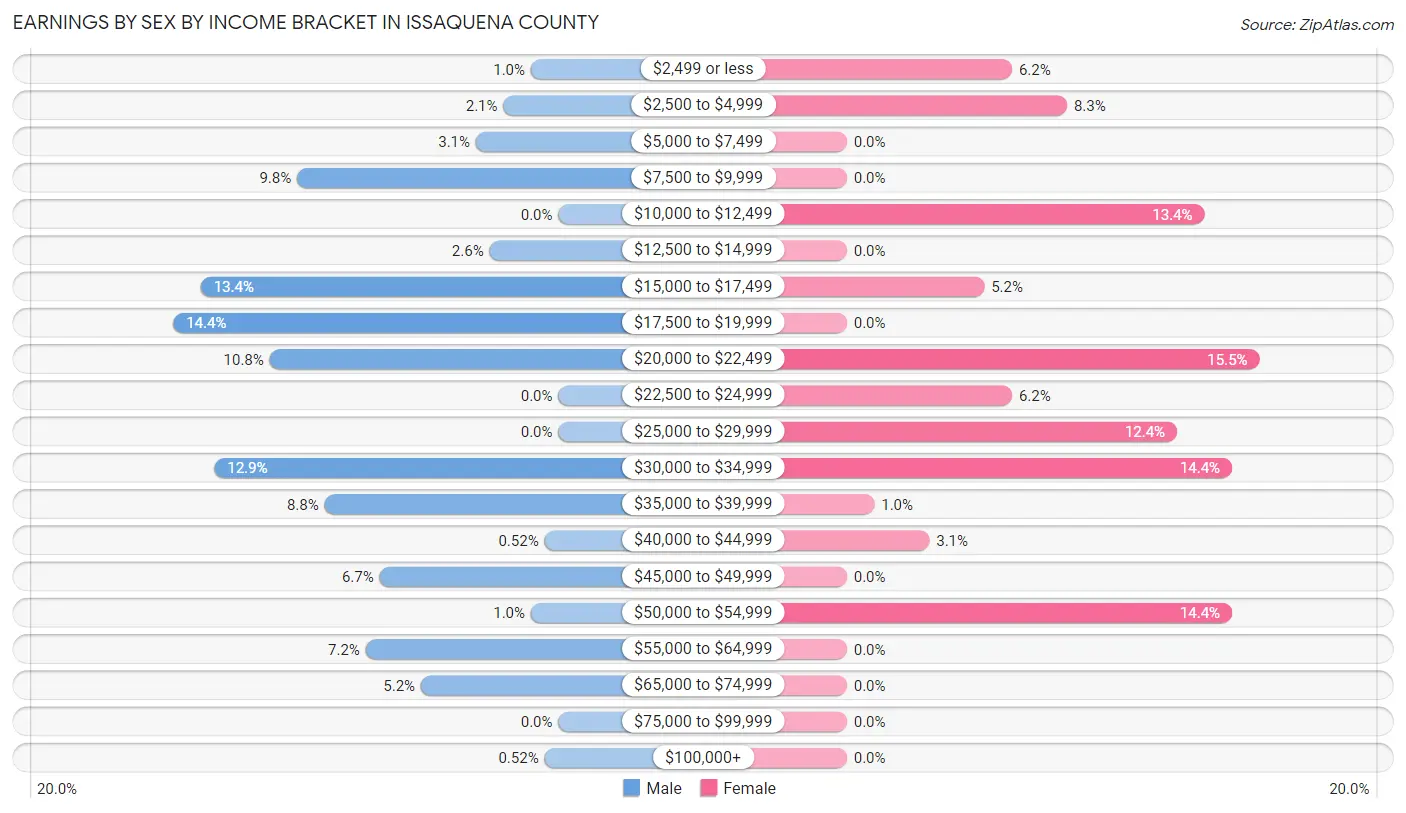
| Income | Male | Female |
| $2,499 or less | 2 (1.0%) | 6 (6.2%) |
| $2,500 to $4,999 | 4 (2.1%) | 8 (8.3%) |
| $5,000 to $7,499 | 6 (3.1%) | 0 (0.0%) |
| $7,500 to $9,999 | 19 (9.8%) | 0 (0.0%) |
| $10,000 to $12,499 | 0 (0.0%) | 13 (13.4%) |
| $12,500 to $14,999 | 5 (2.6%) | 0 (0.0%) |
| $15,000 to $17,499 | 26 (13.4%) | 5 (5.1%) |
| $17,500 to $19,999 | 28 (14.4%) | 0 (0.0%) |
| $20,000 to $22,499 | 21 (10.8%) | 15 (15.5%) |
| $22,500 to $24,999 | 0 (0.0%) | 6 (6.2%) |
| $25,000 to $29,999 | 0 (0.0%) | 12 (12.4%) |
| $30,000 to $34,999 | 25 (12.9%) | 14 (14.4%) |
| $35,000 to $39,999 | 17 (8.8%) | 1 (1.0%) |
| $40,000 to $44,999 | 1 (0.5%) | 3 (3.1%) |
| $45,000 to $49,999 | 13 (6.7%) | 0 (0.0%) |
| $50,000 to $54,999 | 2 (1.0%) | 14 (14.4%) |
| $55,000 to $64,999 | 14 (7.2%) | 0 (0.0%) |
| $65,000 to $74,999 | 10 (5.1%) | 0 (0.0%) |
| $75,000 to $99,999 | 0 (0.0%) | 0 (0.0%) |
| $100,000+ | 1 (0.5%) | 0 (0.0%) |
| Total | 194 (100.0%) | 97 (100.0%) |
Earnings by Sex by Educational Attainment in Issaquena County
Average earnings in Issaquena County are $21,488 for men and $23,125 for women, a difference of 7.1%. Men with an educational attainment of college or associate's degree enjoy the highest average annual earnings of $47,708, while those with less than high school education earn the least with $19,432. Women with an educational attainment of college or associate's degree earn the most with the average annual earnings of $27,813, while those with college or associate's degree education have the smallest earnings of $27,813.
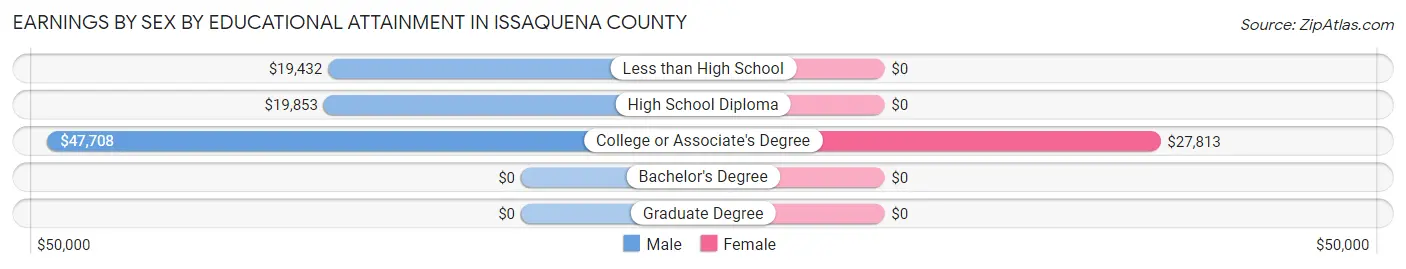
| Educational Attainment | Male Income | Female Income |
| Less than High School | $19,432 | $0 |
| High School Diploma | $19,853 | $0 |
| College or Associate's Degree | $47,708 | $27,813 |
| Bachelor's Degree | - | - |
| Graduate Degree | - | - |
| Total | $21,488 | $23,125 |
Family Income in Issaquena County
Family Income Brackets in Issaquena County
According to the Issaquena County family income data, there are 69 families falling into the $50,000 to $74,999 income range, which is the most common income bracket and makes up 52.7% of all families.
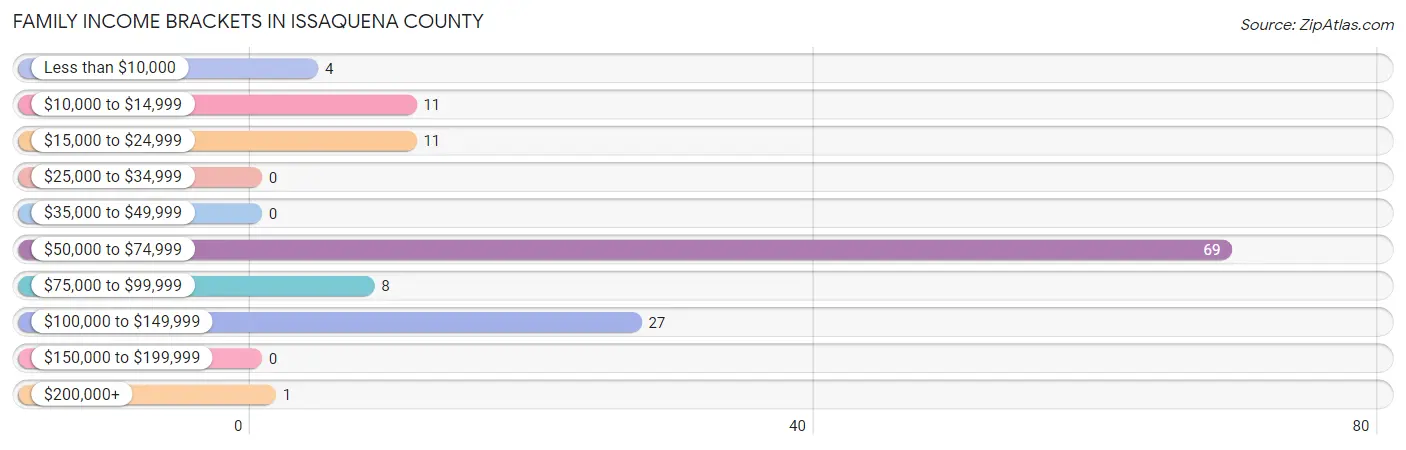
| Income Bracket | # Families | % Families |
| Less than $10,000 | 4 | 3.1% |
| $10,000 to $14,999 | 11 | 8.4% |
| $15,000 to $24,999 | 11 | 8.4% |
| $25,000 to $34,999 | 0 | 0.0% |
| $35,000 to $49,999 | 0 | 0.0% |
| $50,000 to $74,999 | 69 | 52.7% |
| $75,000 to $99,999 | 8 | 6.1% |
| $100,000 to $149,999 | 27 | 20.6% |
| $150,000 to $199,999 | 0 | 0.0% |
| $200,000+ | 1 | 0.8% |
Family Income by Famaliy Size in Issaquena County
2-person families (67 | 51.1%) account for the highest median family income in Issaquena County with $61,250 per family, while 2-person families (67 | 51.1%) have the highest median income of $30,625 per family member.
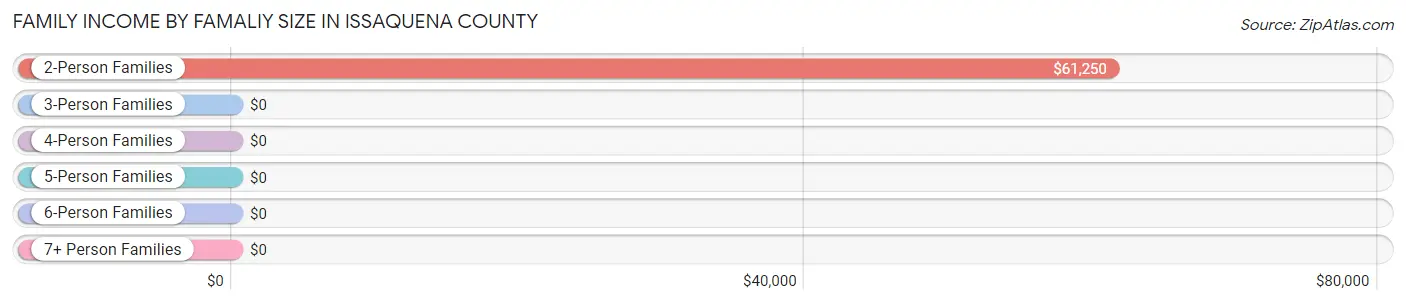
| Income Bracket | # Families | Median Income |
| 2-Person Families | 67 (51.1%) | $61,250 |
| 3-Person Families | 14 (10.7%) | $0 |
| 4-Person Families | 15 (11.5%) | $0 |
| 5-Person Families | 0 (0.0%) | $0 |
| 6-Person Families | 8 (6.1%) | $0 |
| 7+ Person Families | 27 (20.6%) | $0 |
| Total | 131 (100.0%) | $63,688 |
Family Income by Number of Earners in Issaquena County
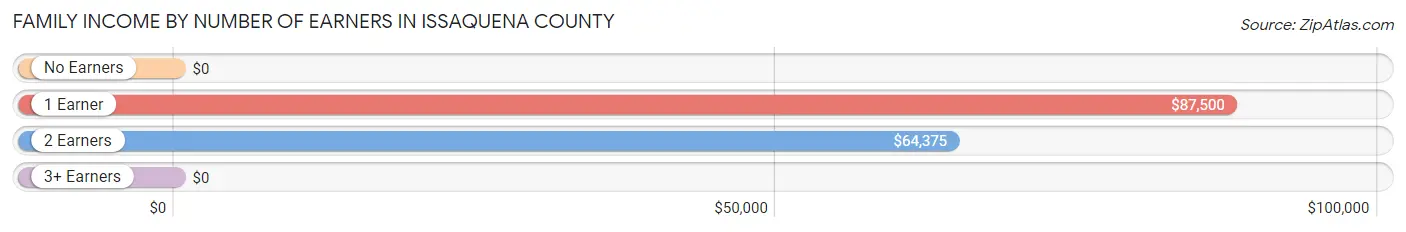
| Number of Earners | # Families | Median Income |
| No Earners | 46 (35.1%) | $0 |
| 1 Earner | 38 (29.0%) | $87,500 |
| 2 Earners | 39 (29.8%) | $64,375 |
| 3+ Earners | 8 (6.1%) | $0 |
| Total | 131 (100.0%) | $63,688 |
Household Income in Issaquena County
Household Income Brackets in Issaquena County
With 99 households falling in the category, the $50,000 to $74,999 income range is the most frequent in Issaquena County, accounting for 25.3% of all households.
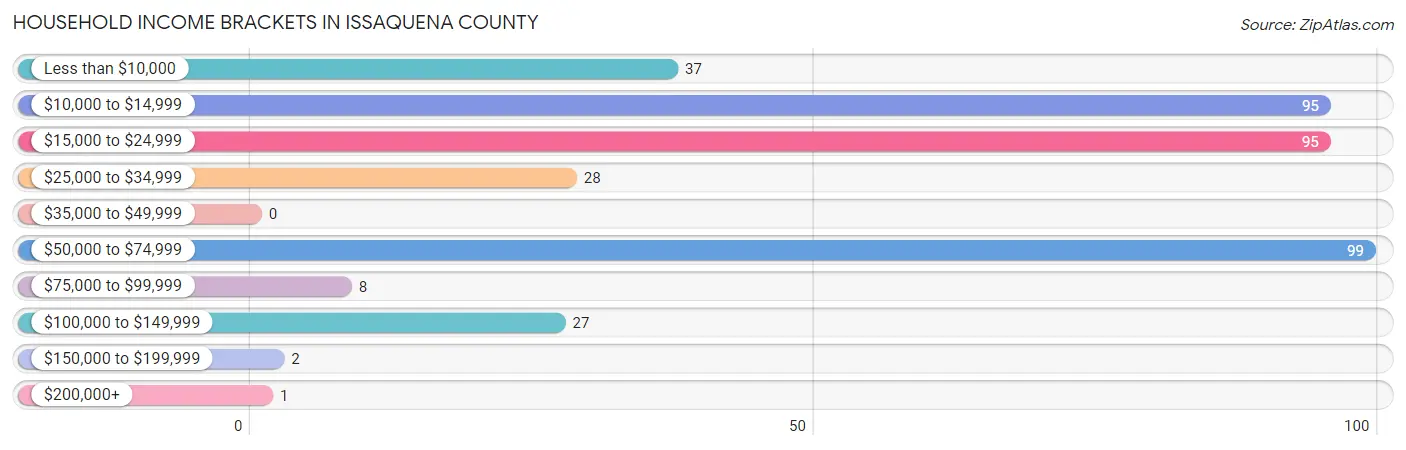
| Income Bracket | # Households | % Households |
| Less than $10,000 | 37 | 9.4% |
| $10,000 to $14,999 | 95 | 24.2% |
| $15,000 to $24,999 | 95 | 24.2% |
| $25,000 to $34,999 | 28 | 7.1% |
| $35,000 to $49,999 | 0 | 0.0% |
| $50,000 to $74,999 | 99 | 25.3% |
| $75,000 to $99,999 | 8 | 2.0% |
| $100,000 to $149,999 | 27 | 6.9% |
| $150,000 to $199,999 | 2 | 0.5% |
| $200,000+ | 1 | 0.3% |
Household Income by Householder Age in Issaquena County
The median household income in Issaquena County is $17,900, with the highest median household income of $29,625 found in the 45 to 64 years age bracket for the primary householder. A total of 127 households (32.4%) fall into this category.
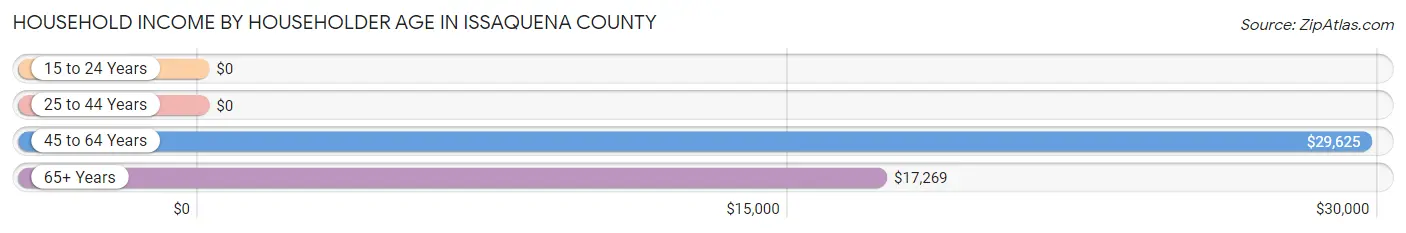
| Income Bracket | # Households | Median Income |
| 15 to 24 Years | 0 (0.0%) | $0 |
| 25 to 44 Years | 75 (19.1%) | $0 |
| 45 to 64 Years | 127 (32.4%) | $29,625 |
| 65+ Years | 190 (48.5%) | $17,269 |
| Total | 392 (100.0%) | $17,900 |
Poverty in Issaquena County
Income Below Poverty by Sex and Age in Issaquena County
With 28.1% poverty level for males and 13.4% for females among the residents of Issaquena County, 25 to 34 year old males and 35 to 44 year old females are the most vulnerable to poverty, with 16 males (94.1%) and 15 females (35.7%) in their respective age groups living below the poverty level.
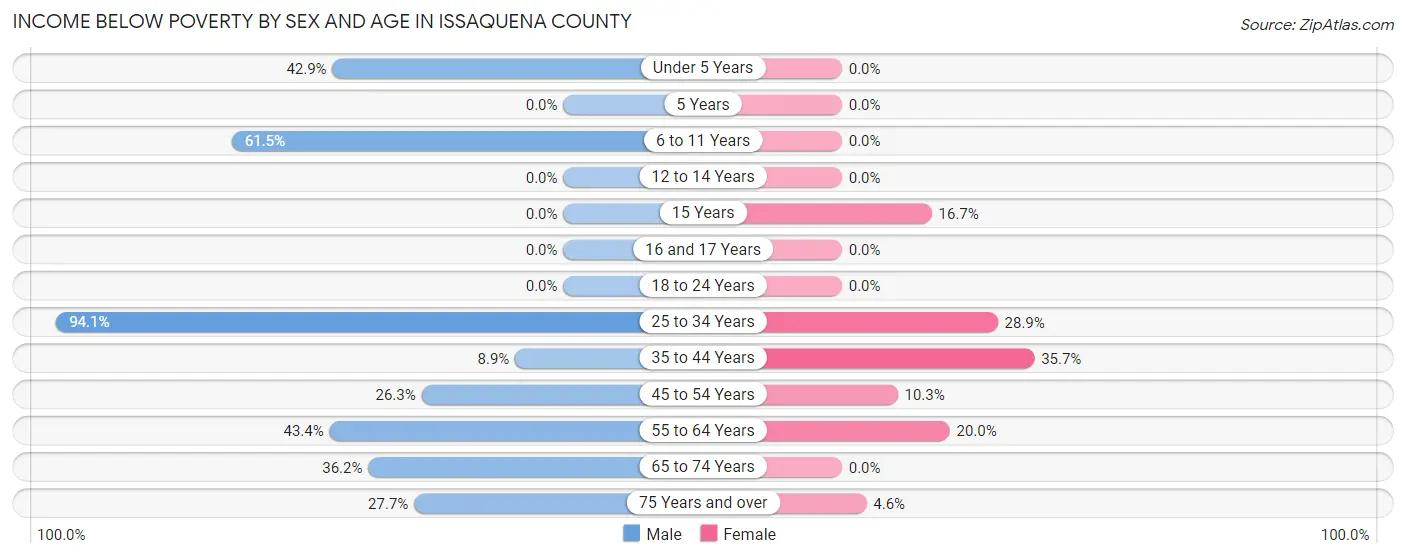
| Age Bracket | Male | Female |
| Under 5 Years | 6 (42.9%) | 0 (0.0%) |
| 5 Years | 0 (0.0%) | 0 (0.0%) |
| 6 to 11 Years | 8 (61.5%) | 0 (0.0%) |
| 12 to 14 Years | 0 (0.0%) | 0 (0.0%) |
| 15 Years | 0 (0.0%) | 1 (16.7%) |
| 16 and 17 Years | 0 (0.0%) | 0 (0.0%) |
| 18 to 24 Years | 0 (0.0%) | 0 (0.0%) |
| 25 to 34 Years | 16 (94.1%) | 24 (28.9%) |
| 35 to 44 Years | 11 (8.9%) | 15 (35.7%) |
| 45 to 54 Years | 15 (26.3%) | 6 (10.3%) |
| 55 to 64 Years | 23 (43.4%) | 10 (20.0%) |
| 65 to 74 Years | 21 (36.2%) | 0 (0.0%) |
| 75 Years and over | 18 (27.7%) | 2 (4.5%) |
| Total | 118 (28.1%) | 58 (13.4%) |
Income Above Poverty by Sex and Age in Issaquena County
According to the poverty statistics in Issaquena County, males aged 16 and 17 years and females aged under 5 years are the age groups that are most secure financially, with 100.0% of males and 100.0% of females in these age groups living above the poverty line.
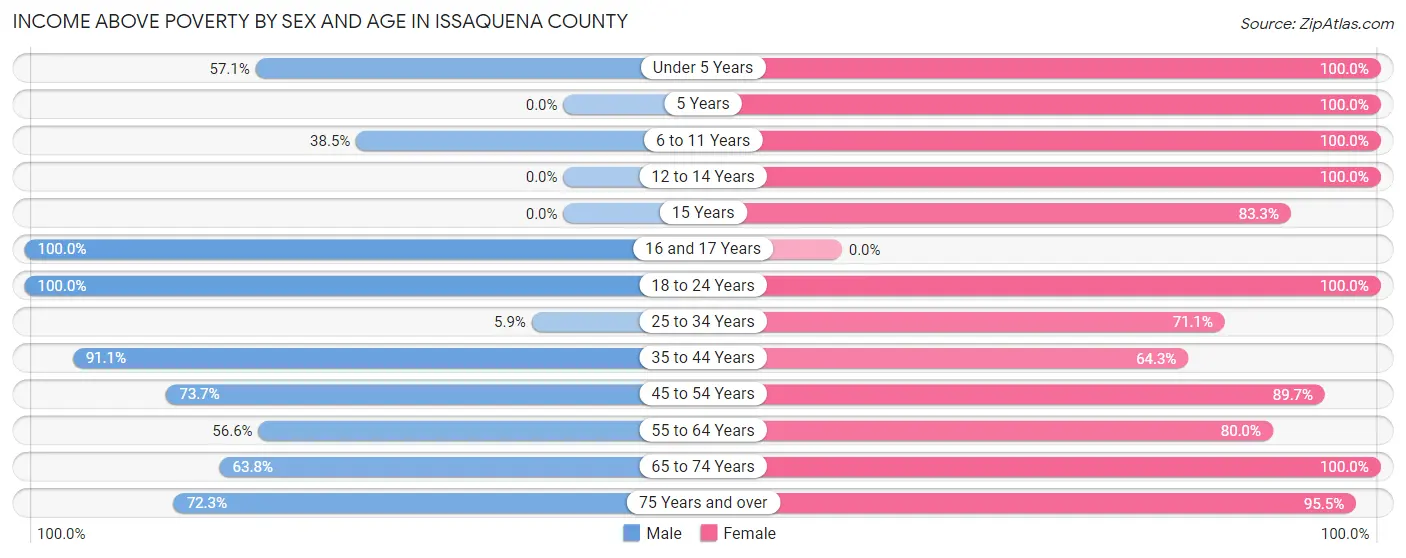
| Age Bracket | Male | Female |
| Under 5 Years | 8 (57.1%) | 8 (100.0%) |
| 5 Years | 0 (0.0%) | 7 (100.0%) |
| 6 to 11 Years | 5 (38.5%) | 34 (100.0%) |
| 12 to 14 Years | 0 (0.0%) | 18 (100.0%) |
| 15 Years | 0 (0.0%) | 5 (83.3%) |
| 16 and 17 Years | 14 (100.0%) | 0 (0.0%) |
| 18 to 24 Years | 6 (100.0%) | 11 (100.0%) |
| 25 to 34 Years | 1 (5.9%) | 59 (71.1%) |
| 35 to 44 Years | 112 (91.1%) | 27 (64.3%) |
| 45 to 54 Years | 42 (73.7%) | 52 (89.7%) |
| 55 to 64 Years | 30 (56.6%) | 40 (80.0%) |
| 65 to 74 Years | 37 (63.8%) | 72 (100.0%) |
| 75 Years and over | 47 (72.3%) | 42 (95.5%) |
| Total | 302 (71.9%) | 375 (86.6%) |
Income Below Poverty Among Married-Couple Families in Issaquena County
The poverty statistics for married-couple families in Issaquena County show that 16.9% or 15 of the total 89 families live below the poverty line. Families with 1 or 2 children have the highest poverty rate of 26.1%, comprising of 6 families. On the other hand, families with 3 or 4 children have the lowest poverty rate of 0.0%, which includes 0 families.
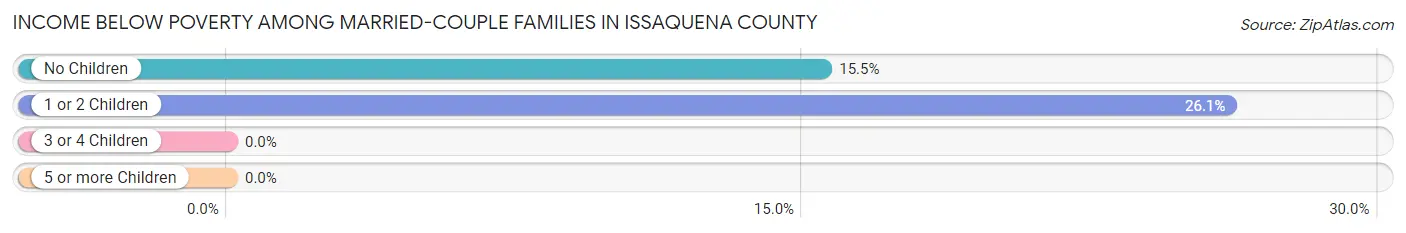
| Children | Above Poverty | Below Poverty |
| No Children | 49 (84.5%) | 9 (15.5%) |
| 1 or 2 Children | 17 (73.9%) | 6 (26.1%) |
| 3 or 4 Children | 8 (100.0%) | 0 (0.0%) |
| 5 or more Children | 0 (0.0%) | 0 (0.0%) |
| Total | 74 (83.2%) | 15 (16.9%) |
Income Below Poverty Among Single-Parent Households in Issaquena County
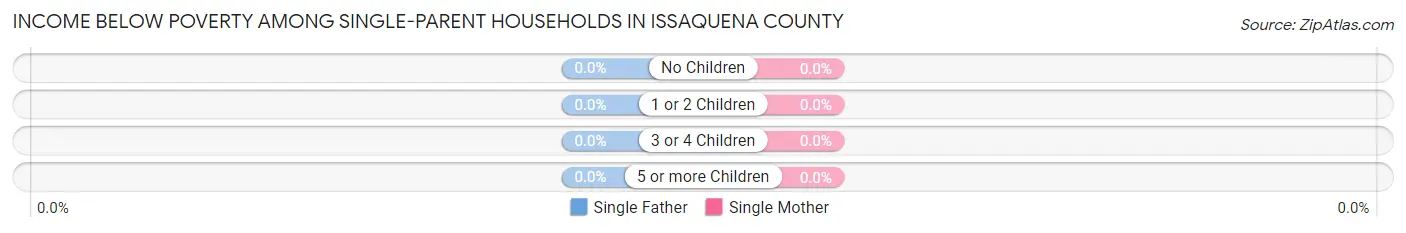
| Children | Single Father | Single Mother |
| No Children | 0 (0.0%) | 0 (0.0%) |
| 1 or 2 Children | 0 (0.0%) | 0 (0.0%) |
| 3 or 4 Children | 0 (0.0%) | 0 (0.0%) |
| 5 or more Children | 0 (0.0%) | 0 (0.0%) |
| Total | 0 (0.0%) | 0 (0.0%) |
Income Below Poverty Among Married-Couple vs Single-Parent Households in Issaquena County
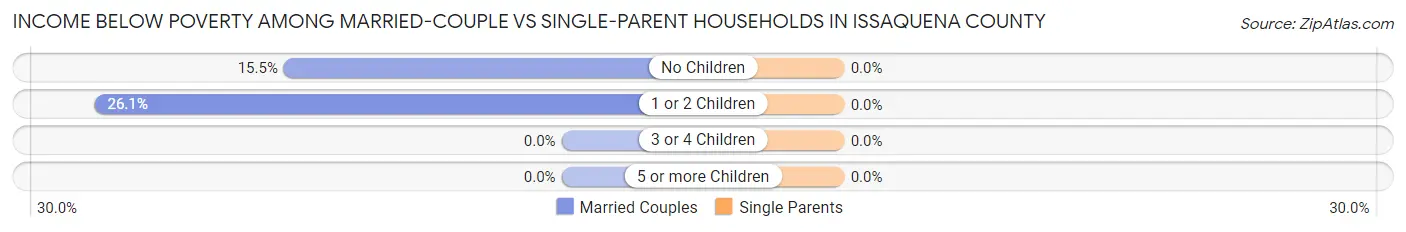
| Children | Married-Couple Families | Single-Parent Households |
| No Children | 9 (15.5%) | 0 (0.0%) |
| 1 or 2 Children | 6 (26.1%) | 0 (0.0%) |
| 3 or 4 Children | 0 (0.0%) | 0 (0.0%) |
| 5 or more Children | 0 (0.0%) | 0 (0.0%) |
| Total | 15 (16.9%) | 0 (0.0%) |
Race in Issaquena County
The most populous races in Issaquena County are Black / African American (849 | 70.4%), White / Caucasian (332 | 27.5%), and Two or more Races (13 | 1.1%).
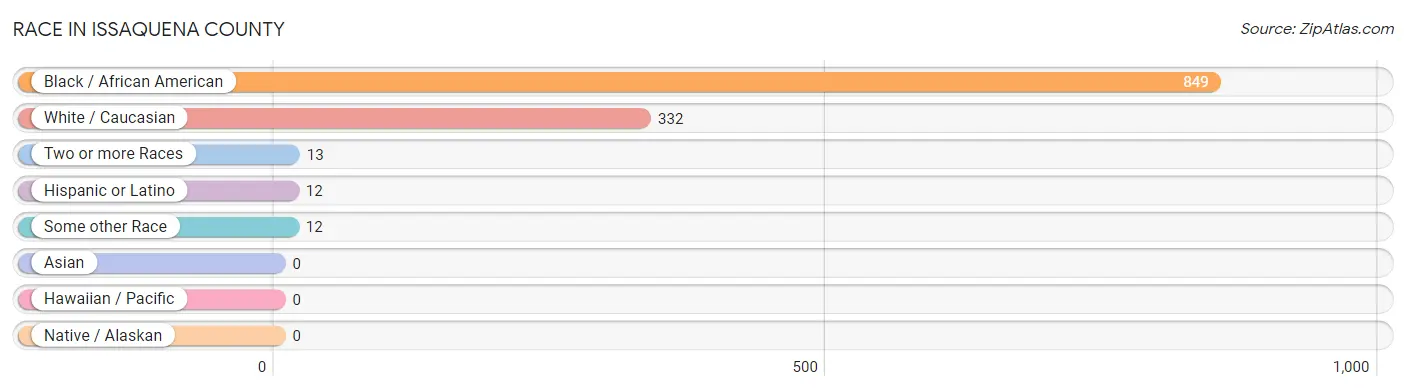
| Race | # Population | % Population |
| Asian | 0 | 0.0% |
| Black / African American | 849 | 70.4% |
| Hawaiian / Pacific | 0 | 0.0% |
| Hispanic or Latino | 12 | 1.0% |
| Native / Alaskan | 0 | 0.0% |
| White / Caucasian | 332 | 27.5% |
| Two or more Races | 13 | 1.1% |
| Some other Race | 12 | 1.0% |
| Total | 1,206 | 100.0% |
Ancestry in Issaquena County
The most populous ancestries reported in Issaquena County are American (76 | 6.3%), English (36 | 3.0%), German (27 | 2.2%), Irish (17 | 1.4%), and Scotch-Irish (14 | 1.2%), together accounting for 14.1% of all Issaquena County residents.
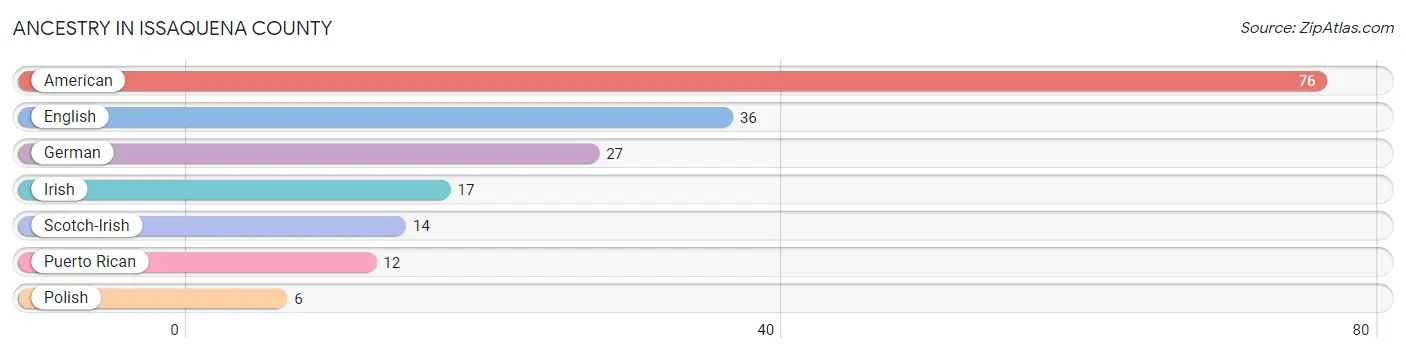
| Ancestry | # Population | % Population |
| American | 76 | 6.3% |
| English | 36 | 3.0% |
| German | 27 | 2.2% |
| Irish | 17 | 1.4% |
| Polish | 6 | 0.5% |
| Puerto Rican | 12 | 1.0% |
| Scotch-Irish | 14 | 1.2% | View All 7 Rows |
Immigrants in Issaquena County

| Immigration Origin | # Population | % Population | View All 0 Rows |
Sex and Age in Issaquena County
Sex and Age in Issaquena County
The most populous age groups in Issaquena County are 40 to 44 Years (118 | 15.3%) for men and 30 to 34 Years (58 | 13.4%) for women.
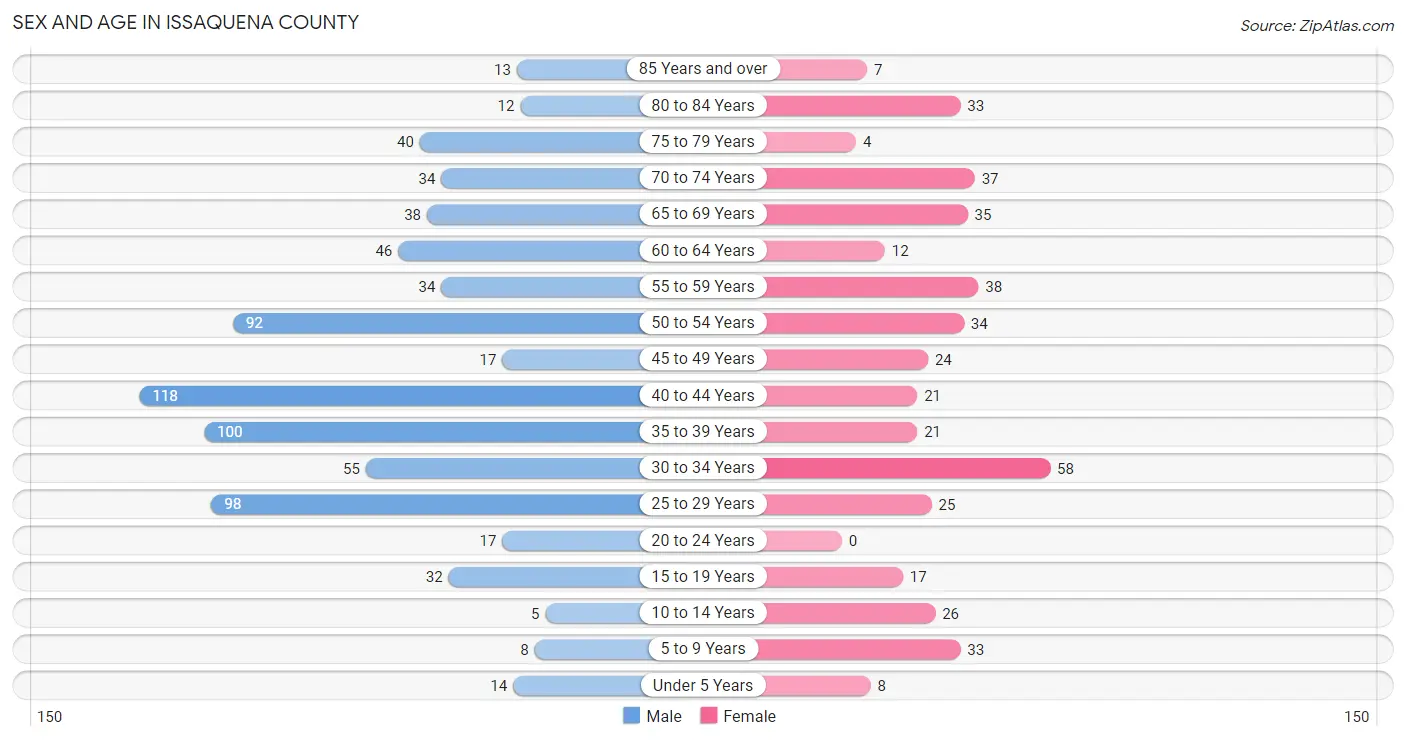
| Age Bracket | Male | Female |
| Under 5 Years | 14 (1.8%) | 8 (1.8%) |
| 5 to 9 Years | 8 (1.0%) | 33 (7.6%) |
| 10 to 14 Years | 5 (0.6%) | 26 (6.0%) |
| 15 to 19 Years | 32 (4.1%) | 17 (3.9%) |
| 20 to 24 Years | 17 (2.2%) | 0 (0.0%) |
| 25 to 29 Years | 98 (12.7%) | 25 (5.8%) |
| 30 to 34 Years | 55 (7.1%) | 58 (13.4%) |
| 35 to 39 Years | 100 (12.9%) | 21 (4.9%) |
| 40 to 44 Years | 118 (15.3%) | 21 (4.9%) |
| 45 to 49 Years | 17 (2.2%) | 24 (5.5%) |
| 50 to 54 Years | 92 (11.9%) | 34 (7.9%) |
| 55 to 59 Years | 34 (4.4%) | 38 (8.8%) |
| 60 to 64 Years | 46 (5.9%) | 12 (2.8%) |
| 65 to 69 Years | 38 (4.9%) | 35 (8.1%) |
| 70 to 74 Years | 34 (4.4%) | 37 (8.6%) |
| 75 to 79 Years | 40 (5.2%) | 4 (0.9%) |
| 80 to 84 Years | 12 (1.5%) | 33 (7.6%) |
| 85 Years and over | 13 (1.7%) | 7 (1.6%) |
| Total | 773 (100.0%) | 433 (100.0%) |
Families and Households in Issaquena County
Median Family Size in Issaquena County
The median family size in Issaquena County is 4.44 persons per family, with single female/mother families (38 | 29.0%) accounting for the largest median family size of 7.61 persons per family. On the other hand, single male/father families (4 | 3.0%) represent the smallest median family size with 2.00 persons per family.
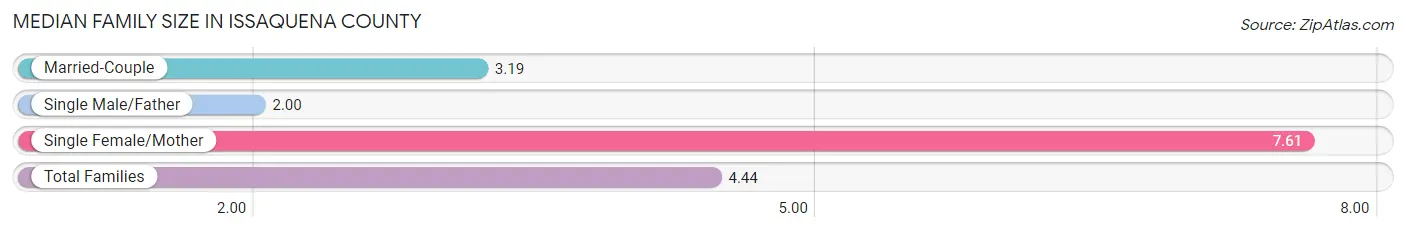
| Family Type | # Families | Family Size |
| Married-Couple | 89 (67.9%) | 3.19 |
| Single Male/Father | 4 (3.0%) | 2.00 |
| Single Female/Mother | 38 (29.0%) | 7.61 |
| Total Families | 131 (100.0%) | 4.44 |
Median Household Size in Issaquena County
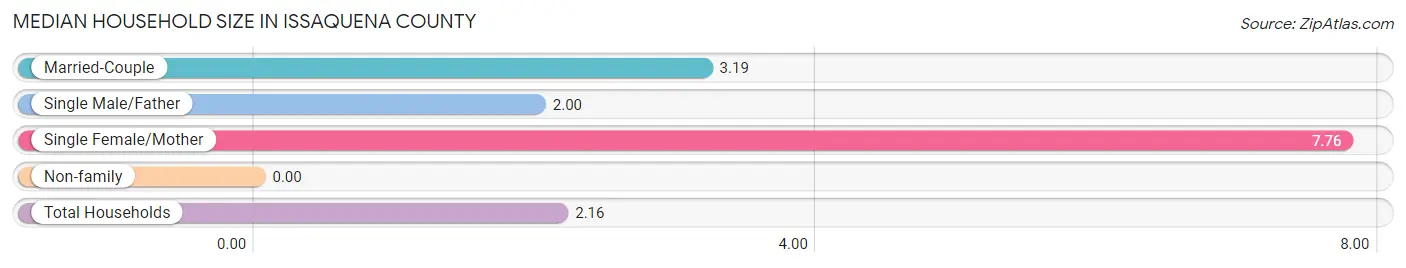
| Household Type | # Households | Household Size |
| Married-Couple | 89 (22.7%) | 3.19 |
| Single Male/Father | 4 (1.0%) | 2.00 |
| Single Female/Mother | 38 (9.7%) | 7.76 |
| Non-family | 261 (66.6%) | - |
| Total Households | 392 (100.0%) | 2.16 |
Household Size by Marriage Status in Issaquena County
Out of a total of 392 households in Issaquena County, 131 (33.4%) are family households, while 261 (66.6%) are nonfamily households. The most numerous type of family households are 2-person households, comprising 60, and the most common type of nonfamily households are 1-person households, comprising 261.
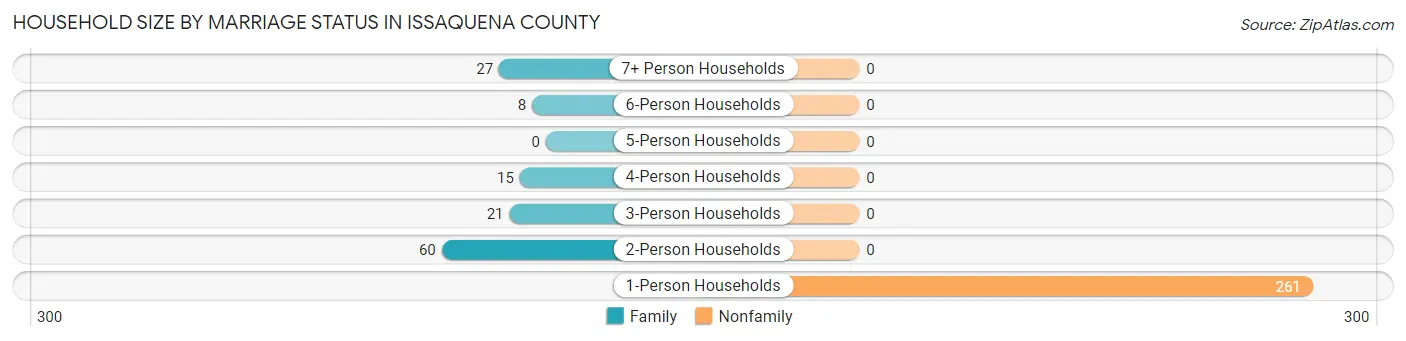
| Household Size | Family Households | Nonfamily Households |
| 1-Person Households | - | 261 (66.6%) |
| 2-Person Households | 60 (15.3%) | 0 (0.0%) |
| 3-Person Households | 21 (5.4%) | 0 (0.0%) |
| 4-Person Households | 15 (3.8%) | 0 (0.0%) |
| 5-Person Households | 0 (0.0%) | 0 (0.0%) |
| 6-Person Households | 8 (2.0%) | 0 (0.0%) |
| 7+ Person Households | 27 (6.9%) | 0 (0.0%) |
| Total | 131 (33.4%) | 261 (66.6%) |
Female Fertility in Issaquena County
Fertility by Age in Issaquena County
Average fertility rate in Issaquena County is 86.0 births per 1,000 women. Women in the age bracket of 20 to 34 years have the highest fertility rate with 96.0 births per 1,000 women. Women in the age bracket of 20 to 34 years acount for 50.0% of all women with births.
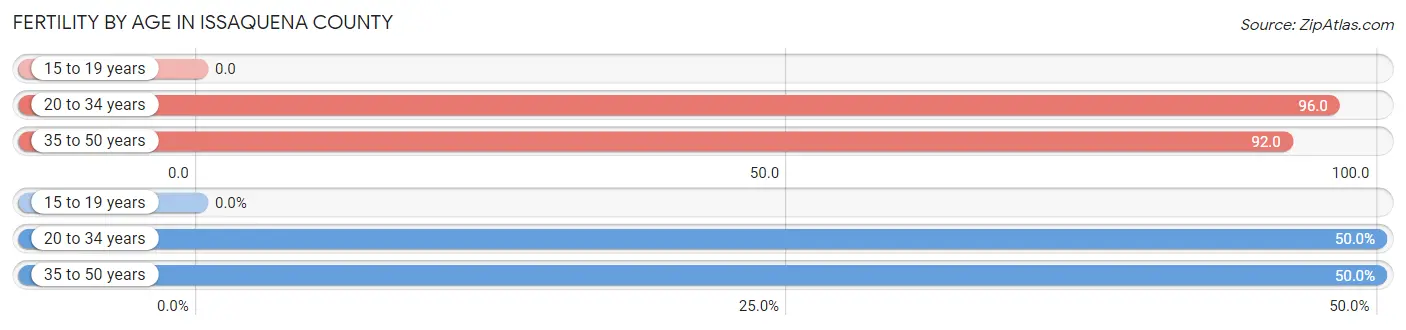
| Age Bracket | Women with Births | Births / 1,000 Women |
| 15 to 19 years | 0 (0.0%) | 0.0 |
| 20 to 34 years | 8 (50.0%) | 96.0 |
| 35 to 50 years | 8 (50.0%) | 92.0 |
| Total | 16 (100.0%) | 86.0 |
Fertility by Age by Marriage Status in Issaquena County
50.0% of women with births (16) in Issaquena County are married. The highest percentage of unmarried women with births falls into 20 to 34 years age bracket with 100.0% of them unmarried at the time of birth, while the lowest percentage of unmarried women with births belong to 35 to 50 years age bracket with 0.0% of them unmarried.
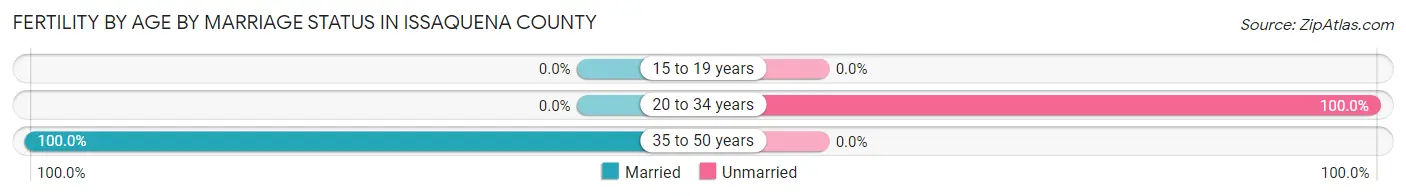
| Age Bracket | Married | Unmarried |
| 15 to 19 years | 0 (0.0%) | 0 (0.0%) |
| 20 to 34 years | 0 (0.0%) | 8 (100.0%) |
| 35 to 50 years | 8 (100.0%) | 0 (0.0%) |
| Total | 8 (50.0%) | 8 (50.0%) |
Fertility by Education in Issaquena County
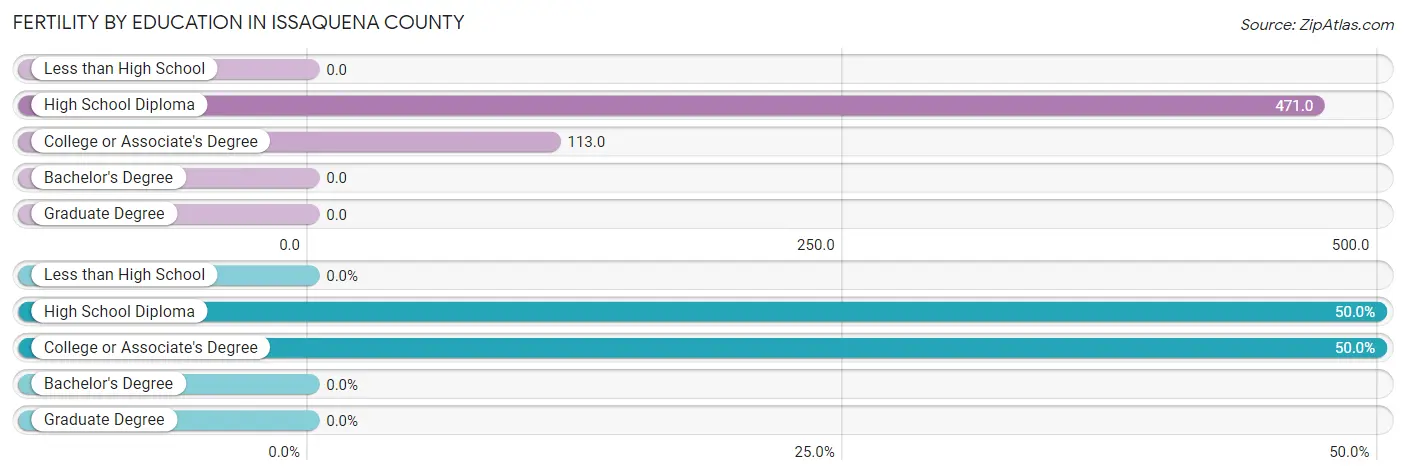
| Educational Attainment | Women with Births | Births / 1,000 Women |
| Less than High School | 0 (0.0%) | 0.0 |
| High School Diploma | 8 (50.0%) | 471.0 |
| College or Associate's Degree | 8 (50.0%) | 113.0 |
| Bachelor's Degree | 0 (0.0%) | 0.0 |
| Graduate Degree | 0 (0.0%) | 0.0 |
| Total | 16 (100.0%) | 86.0 |
Fertility by Education by Marriage Status in Issaquena County
50.0% of women with births in Issaquena County are unmarried. Women with the educational attainment of high school diploma are most likely to be married with 100.0% of them married at childbirth, while women with the educational attainment of college or associate's degree are least likely to be married with 100.0% of them unmarried at childbirth.
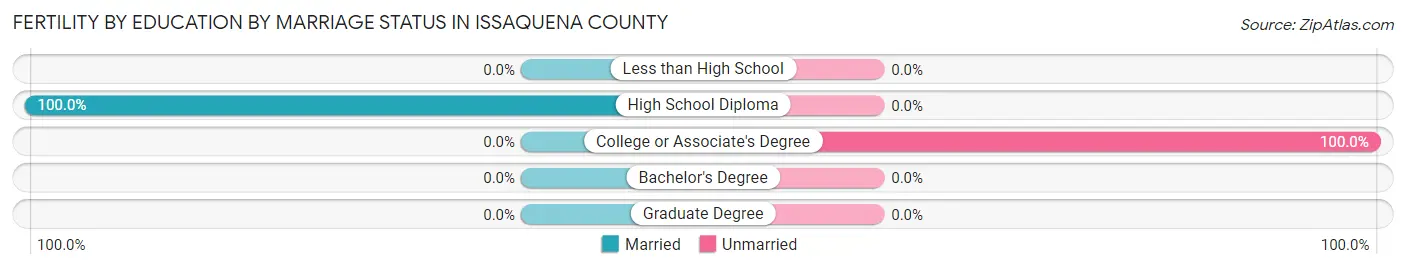
| Educational Attainment | Married | Unmarried |
| Less than High School | 0 (0.0%) | 0 (0.0%) |
| High School Diploma | 8 (100.0%) | 0 (0.0%) |
| College or Associate's Degree | 0 (0.0%) | 8 (100.0%) |
| Bachelor's Degree | 0 (0.0%) | 0 (0.0%) |
| Graduate Degree | 0 (0.0%) | 0 (0.0%) |
| Total | 8 (50.0%) | 8 (50.0%) |
Employment Characteristics in Issaquena County
Employment by Class of Employer in Issaquena County
Among the 174 employed individuals in Issaquena County, private company employees (145 | 83.3%), state government employees (11 | 6.3%), and local government employees (8 | 4.6%) make up the most common classes of employment.
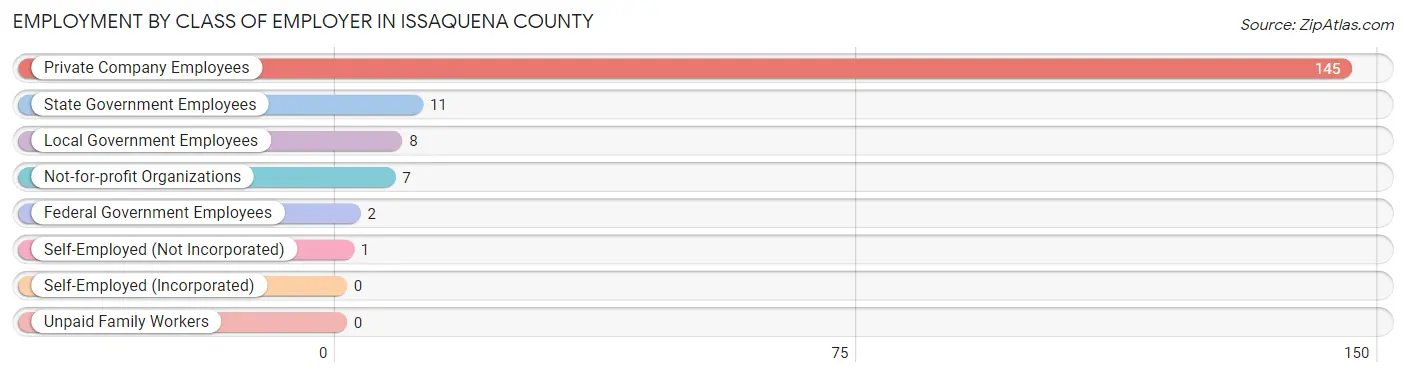
| Employer Class | # Employees | % Employees |
| Private Company Employees | 145 | 83.3% |
| Self-Employed (Incorporated) | 0 | 0.0% |
| Self-Employed (Not Incorporated) | 1 | 0.6% |
| Not-for-profit Organizations | 7 | 4.0% |
| Local Government Employees | 8 | 4.6% |
| State Government Employees | 11 | 6.3% |
| Federal Government Employees | 2 | 1.1% |
| Unpaid Family Workers | 0 | 0.0% |
| Total | 174 | 100.0% |
Employment Status by Age in Issaquena County
According to the labor force statistics for Issaquena County, out of the total population over 16 years of age (1,106), 18.6% or 206 individuals are in the labor force, with 12.1% or 25 of them unemployed. The age group with the highest labor force participation rate is 60 to 64 years, with 34.5% or 20 individuals in the labor force. Within the labor force, the 25 to 29 years age range has the highest percentage of unemployed individuals, with 60.0% or 15 of them being unemployed.
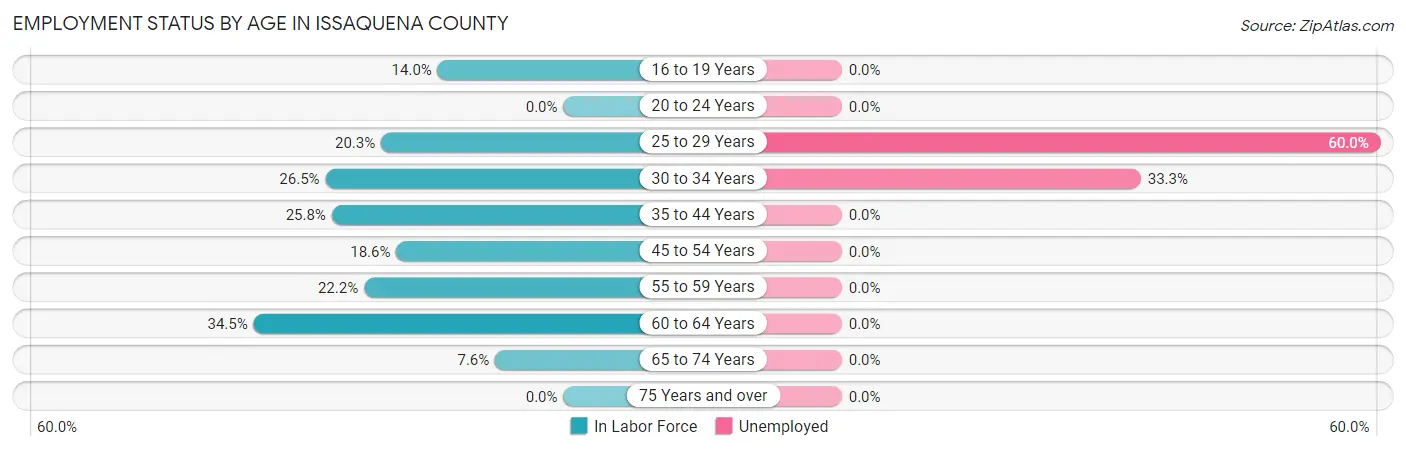
| Age Bracket | In Labor Force | Unemployed |
| 16 to 19 Years | 6 (14.0%) | 0 (0.0%) |
| 20 to 24 Years | 0 (0.0%) | 0 (0.0%) |
| 25 to 29 Years | 25 (20.3%) | 15 (60.0%) |
| 30 to 34 Years | 30 (26.5%) | 10 (33.3%) |
| 35 to 44 Years | 67 (25.8%) | 0 (0.0%) |
| 45 to 54 Years | 31 (18.6%) | 0 (0.0%) |
| 55 to 59 Years | 16 (22.2%) | 0 (0.0%) |
| 60 to 64 Years | 20 (34.5%) | 0 (0.0%) |
| 65 to 74 Years | 11 (7.6%) | 0 (0.0%) |
| 75 Years and over | 0 (0.0%) | 0 (0.0%) |
| Total | 206 (18.6%) | 25 (12.1%) |
Employment Status by Educational Attainment in Issaquena County
According to labor force statistics for Issaquena County, 23.8% of individuals (189) out of the total population between 25 and 64 years of age (793) are in the labor force, with 13.2% or 25 of them being unemployed. The group with the highest labor force participation rate are those with the educational attainment of college / associate degree, with 45.4% or 69 individuals in the labor force. Within the labor force, individuals with high school diploma education have the highest percentage of unemployment, with 23.4% or 15 of them being unemployed.
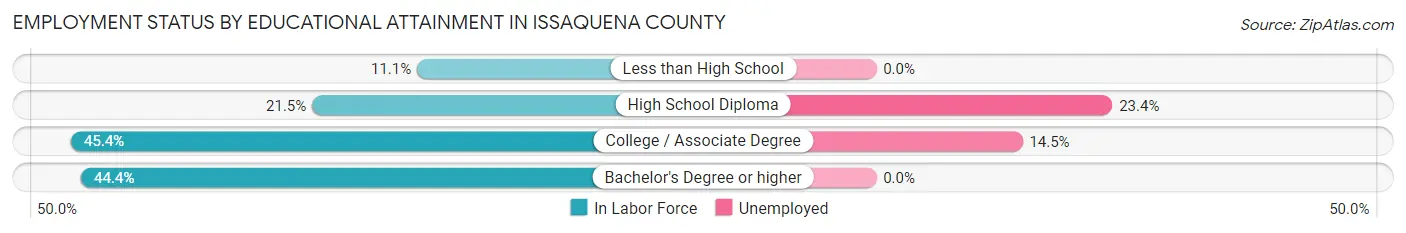
| Educational Attainment | In Labor Force | Unemployed |
| Less than High School | 32 (11.1%) | 0 (0.0%) |
| High School Diploma | 64 (21.5%) | 70 (23.4%) |
| College / Associate Degree | 69 (45.4%) | 22 (14.5%) |
| Bachelor's Degree or higher | 24 (44.4%) | 0 (0.0%) |
| Total | 189 (23.8%) | 105 (13.2%) |
Employment Occupations by Sex in Issaquena County
Management, Business, Science and Arts Occupations
The most common Management, Business, Science and Arts occupations in Issaquena County are Community & Social Service (28 | 15.5%), Education Instruction & Library (28 | 15.5%), Management (7 | 3.9%), and Business & Financial (6 | 3.3%).
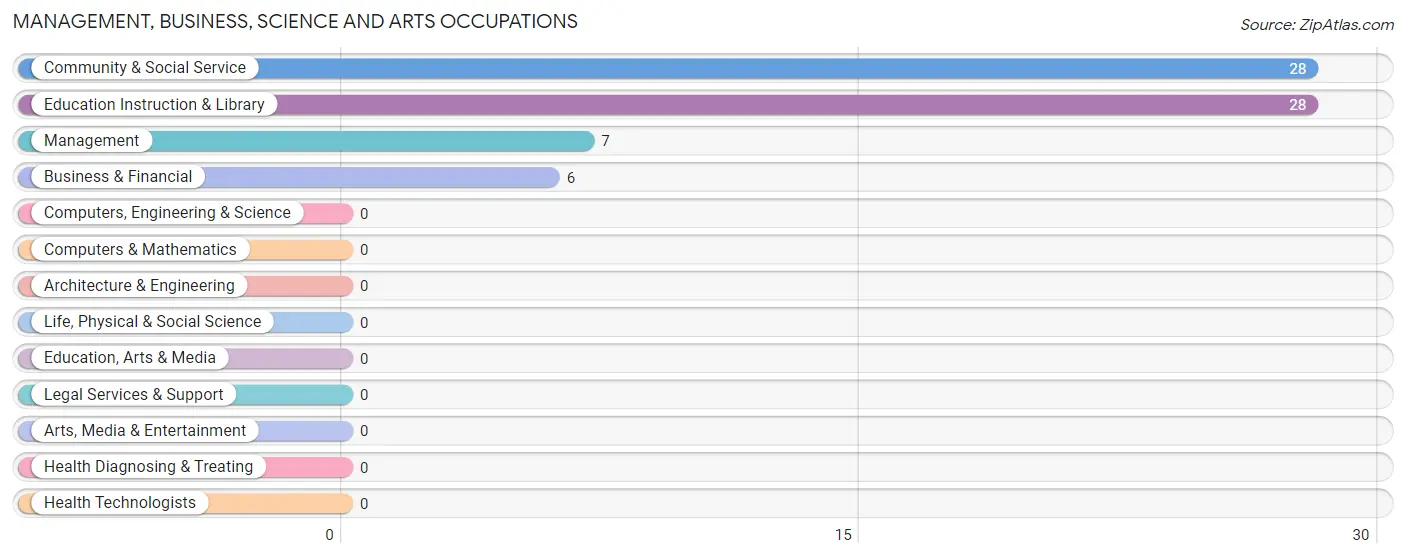
Management, Business, Science and Arts Occupations by Sex
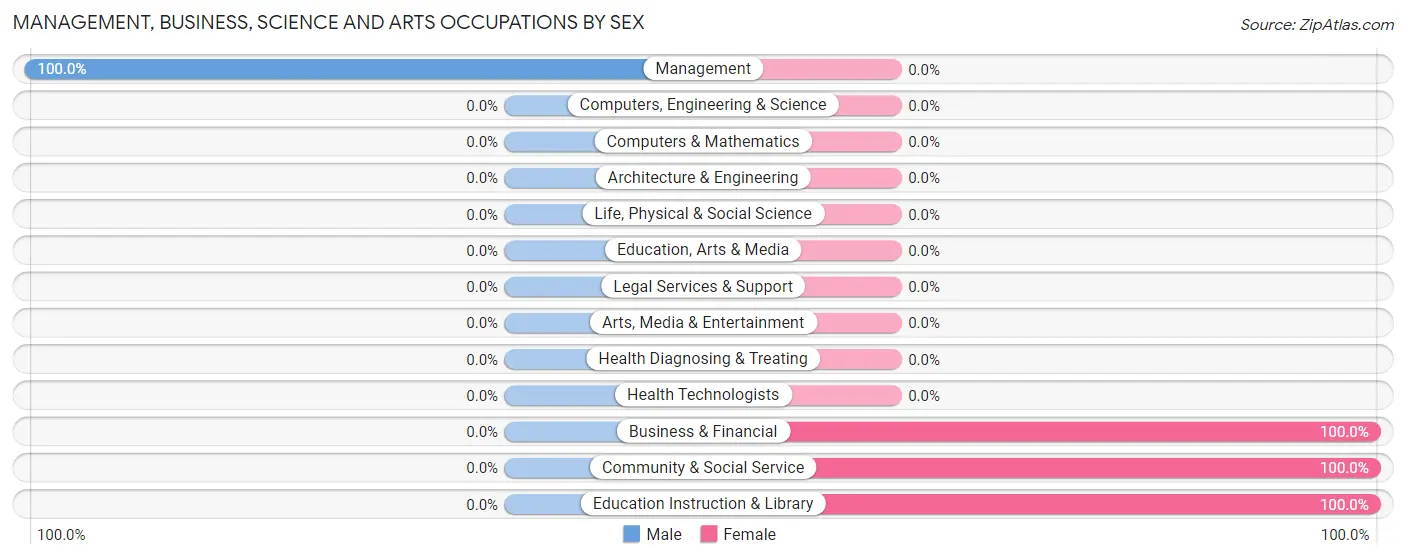
| Occupation | Male | Female |
| Management | 7 (100.0%) | 0 (0.0%) |
| Business & Financial | 0 (0.0%) | 6 (100.0%) |
| Computers, Engineering & Science | 0 (0.0%) | 0 (0.0%) |
| Computers & Mathematics | 0 (0.0%) | 0 (0.0%) |
| Architecture & Engineering | 0 (0.0%) | 0 (0.0%) |
| Life, Physical & Social Science | 0 (0.0%) | 0 (0.0%) |
| Community & Social Service | 0 (0.0%) | 28 (100.0%) |
| Education, Arts & Media | 0 (0.0%) | 0 (0.0%) |
| Legal Services & Support | 0 (0.0%) | 0 (0.0%) |
| Education Instruction & Library | 0 (0.0%) | 28 (100.0%) |
| Arts, Media & Entertainment | 0 (0.0%) | 0 (0.0%) |
| Health Diagnosing & Treating | 0 (0.0%) | 0 (0.0%) |
| Health Technologists | 0 (0.0%) | 0 (0.0%) |
| Total (Category) | 7 (17.1%) | 34 (82.9%) |
| Total (Overall) | 104 (57.5%) | 77 (42.5%) |
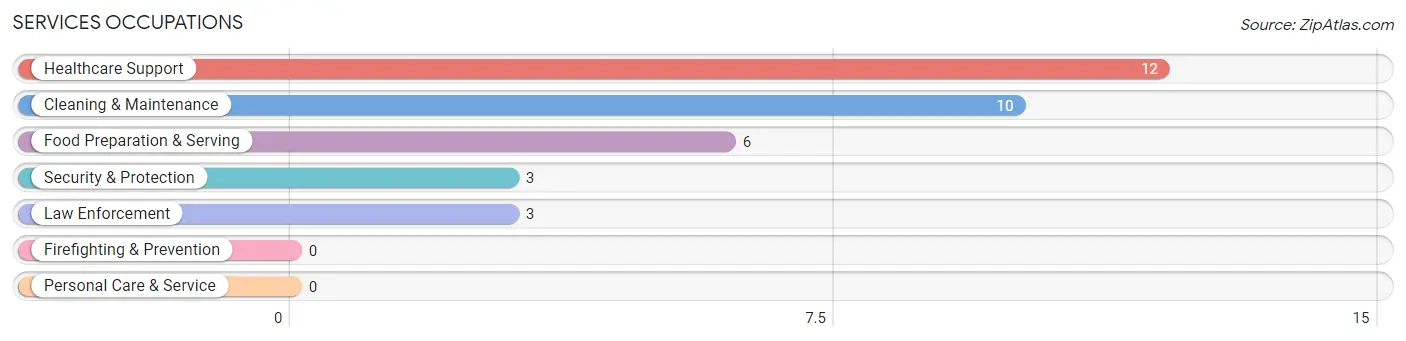
Services Occupations
The most common Services occupations in Issaquena County are Healthcare Support (12 | 6.6%), Cleaning & Maintenance (10 | 5.5%), Food Preparation & Serving (6 | 3.3%), Security & Protection (3 | 1.7%), and Law Enforcement (3 | 1.7%).
Services Occupations by Sex
Within the Services occupations in Issaquena County, the most male-oriented occupations are Security & Protection (100.0%), Law Enforcement (100.0%), and Cleaning & Maintenance (100.0%), while the most female-oriented occupations are Healthcare Support (100.0%), and Food Preparation & Serving (100.0%).
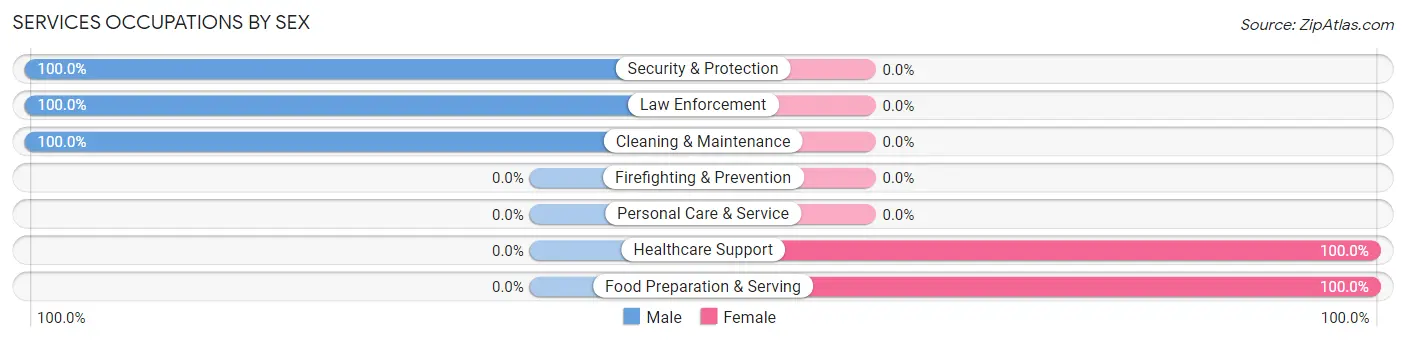
| Occupation | Male | Female |
| Healthcare Support | 0 (0.0%) | 12 (100.0%) |
| Security & Protection | 3 (100.0%) | 0 (0.0%) |
| Firefighting & Prevention | 0 (0.0%) | 0 (0.0%) |
| Law Enforcement | 3 (100.0%) | 0 (0.0%) |
| Food Preparation & Serving | 0 (0.0%) | 6 (100.0%) |
| Cleaning & Maintenance | 10 (100.0%) | 0 (0.0%) |
| Personal Care & Service | 0 (0.0%) | 0 (0.0%) |
| Total (Category) | 13 (41.9%) | 18 (58.1%) |
| Total (Overall) | 104 (57.5%) | 77 (42.5%) |
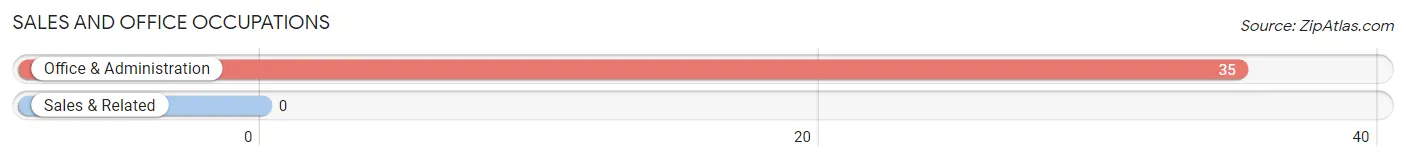
Sales and Office Occupations
The most common Sales and Office occupations in Issaquena County are , and Office & Administration (35 | 19.3%).
Sales and Office Occupations by Sex
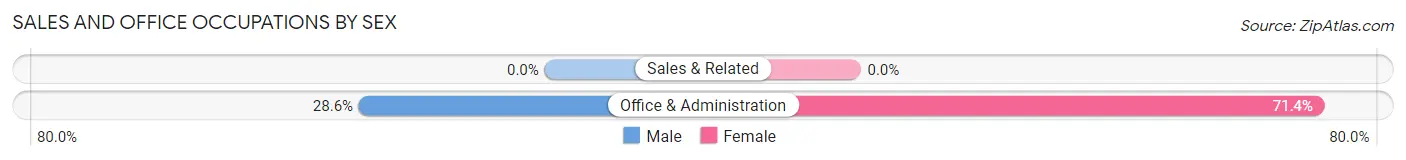
| Occupation | Male | Female |
| Sales & Related | 0 (0.0%) | 0 (0.0%) |
| Office & Administration | 10 (28.6%) | 25 (71.4%) |
| Total (Category) | 10 (28.6%) | 25 (71.4%) |
| Total (Overall) | 104 (57.5%) | 77 (42.5%) |
Natural Resources, Construction and Maintenance Occupations
The most common Natural Resources, Construction and Maintenance occupations in Issaquena County are Construction & Extraction (28 | 15.5%), Farming, Fishing & Forestry (23 | 12.7%), and Installation, Maintenance & Repair (4 | 2.2%).
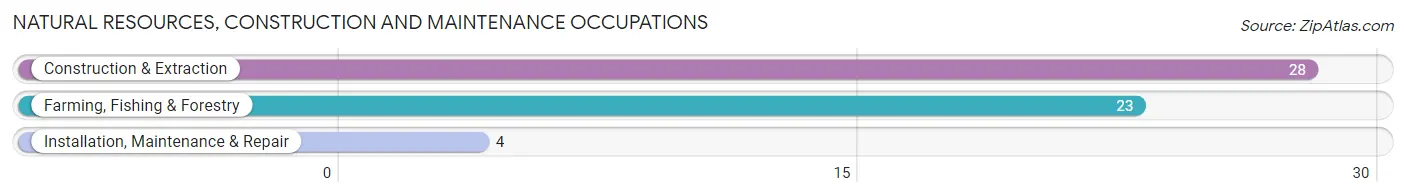
Natural Resources, Construction and Maintenance Occupations by Sex
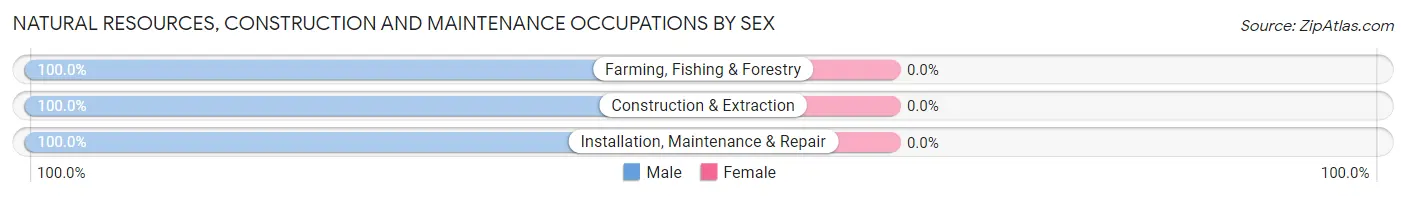
| Occupation | Male | Female |
| Farming, Fishing & Forestry | 23 (100.0%) | 0 (0.0%) |
| Construction & Extraction | 28 (100.0%) | 0 (0.0%) |
| Installation, Maintenance & Repair | 4 (100.0%) | 0 (0.0%) |
| Total (Category) | 55 (100.0%) | 0 (0.0%) |
| Total (Overall) | 104 (57.5%) | 77 (42.5%) |
Production, Transportation and Moving Occupations
The most common Production, Transportation and Moving occupations in Issaquena County are Production (11 | 6.1%), Material Moving (6 | 3.3%), and Transportation (2 | 1.1%).
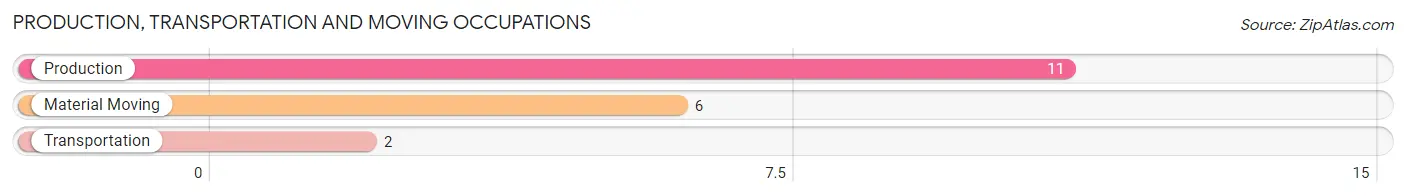
Production, Transportation and Moving Occupations by Sex
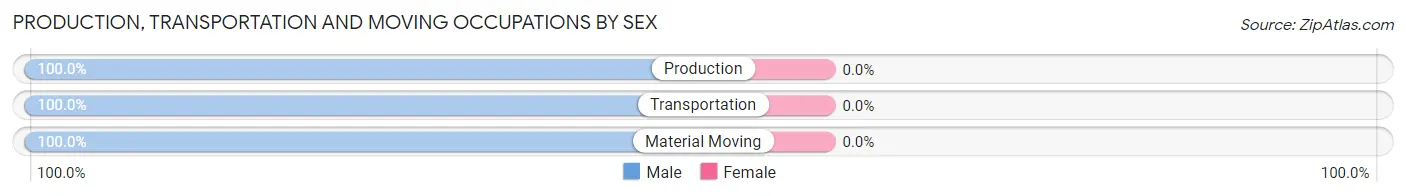
| Occupation | Male | Female |
| Production | 11 (100.0%) | 0 (0.0%) |
| Transportation | 2 (100.0%) | 0 (0.0%) |
| Material Moving | 6 (100.0%) | 0 (0.0%) |
| Total (Category) | 19 (100.0%) | 0 (0.0%) |
| Total (Overall) | 104 (57.5%) | 77 (42.5%) |
Employment Industries by Sex in Issaquena County
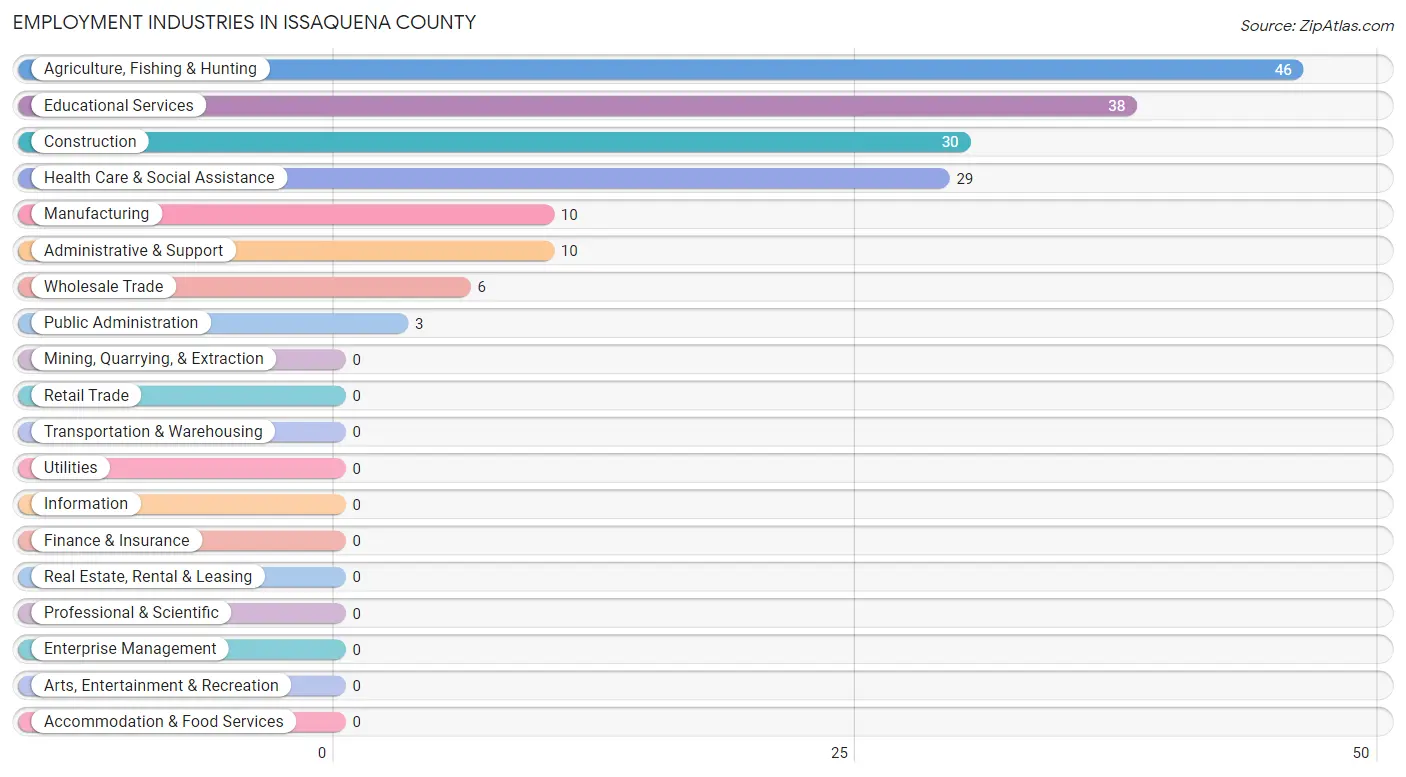
Employment Industries in Issaquena County
The major employment industries in Issaquena County include Agriculture, Fishing & Hunting (46 | 25.4%), Educational Services (38 | 21.0%), Construction (30 | 16.6%), Health Care & Social Assistance (29 | 16.0%), and Manufacturing (10 | 5.5%).
Employment Industries by Sex in Issaquena County
The Issaquena County industries that see more men than women are Construction (100.0%), Manufacturing (100.0%), and Wholesale Trade (100.0%), whereas the industries that tend to have a higher number of women are Health Care & Social Assistance (100.0%), Educational Services (89.5%), and Agriculture, Fishing & Hunting (10.9%).
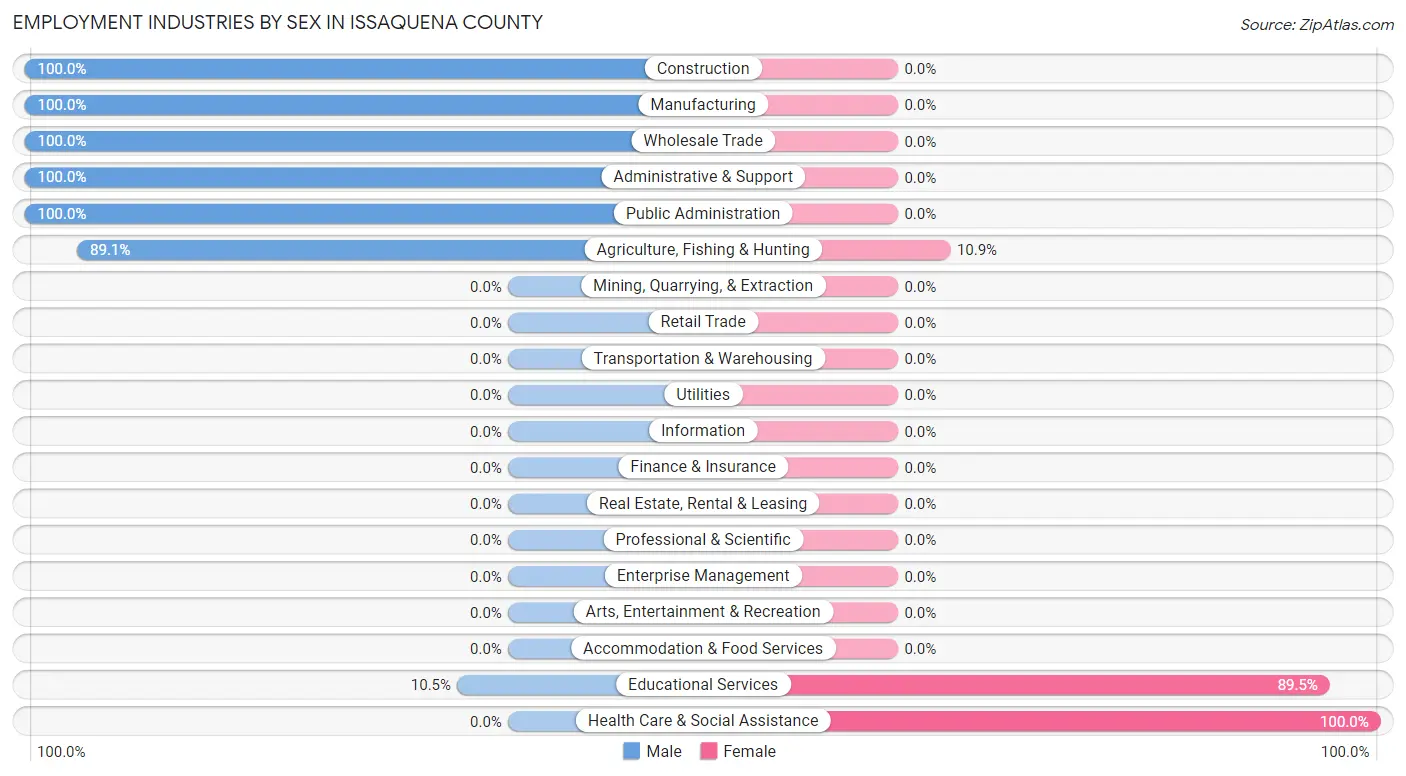
| Industry | Male | Female |
| Agriculture, Fishing & Hunting | 41 (89.1%) | 5 (10.9%) |
| Mining, Quarrying, & Extraction | 0 (0.0%) | 0 (0.0%) |
| Construction | 30 (100.0%) | 0 (0.0%) |
| Manufacturing | 10 (100.0%) | 0 (0.0%) |
| Wholesale Trade | 6 (100.0%) | 0 (0.0%) |
| Retail Trade | 0 (0.0%) | 0 (0.0%) |
| Transportation & Warehousing | 0 (0.0%) | 0 (0.0%) |
| Utilities | 0 (0.0%) | 0 (0.0%) |
| Information | 0 (0.0%) | 0 (0.0%) |
| Finance & Insurance | 0 (0.0%) | 0 (0.0%) |
| Real Estate, Rental & Leasing | 0 (0.0%) | 0 (0.0%) |
| Professional & Scientific | 0 (0.0%) | 0 (0.0%) |
| Enterprise Management | 0 (0.0%) | 0 (0.0%) |
| Administrative & Support | 10 (100.0%) | 0 (0.0%) |
| Educational Services | 4 (10.5%) | 34 (89.5%) |
| Health Care & Social Assistance | 0 (0.0%) | 29 (100.0%) |
| Arts, Entertainment & Recreation | 0 (0.0%) | 0 (0.0%) |
| Accommodation & Food Services | 0 (0.0%) | 0 (0.0%) |
| Public Administration | 3 (100.0%) | 0 (0.0%) |
| Total | 104 (57.5%) | 77 (42.5%) |
Education in Issaquena County
School Enrollment in Issaquena County
The most common levels of schooling among the 129 students in Issaquena County are elementary school (34 | 26.4%), middle school (31 | 24.0%), and high school (31 | 24.0%).
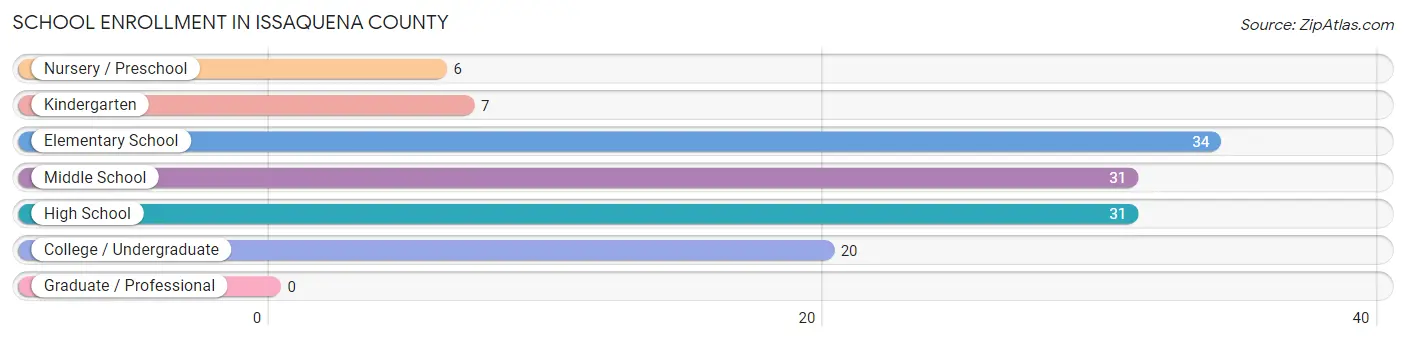
| School Level | # Students | % Students |
| Nursery / Preschool | 6 | 4.6% |
| Kindergarten | 7 | 5.4% |
| Elementary School | 34 | 26.4% |
| Middle School | 31 | 24.0% |
| High School | 31 | 24.0% |
| College / Undergraduate | 20 | 15.5% |
| Graduate / Professional | 0 | 0.0% |
| Total | 129 | 100.0% |
School Enrollment by Age by Funding Source in Issaquena County
Out of a total of 129 students who are enrolled in schools in Issaquena County, 47 (36.4%) attend a private institution, while the remaining 82 (63.6%) are enrolled in public schools. The age group of 35 years and over has the highest likelihood of being enrolled in private schools, with 14 (100.0% in the age bracket) enrolled. Conversely, the age group of 3 to 4 year olds has the lowest likelihood of being enrolled in a private school, with 6 (100.0% in the age bracket) attending a public institution.
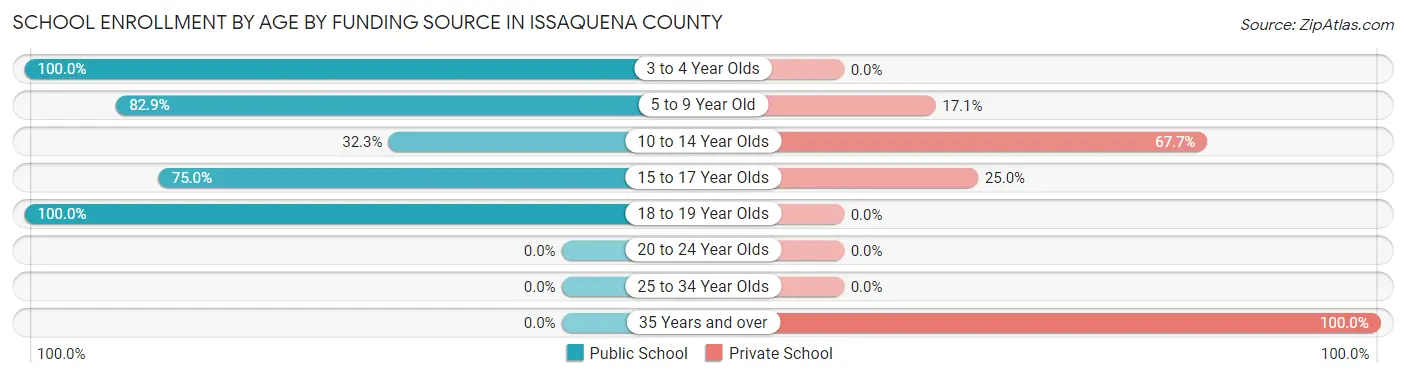
| Age Bracket | Public School | Private School |
| 3 to 4 Year Olds | 6 (100.0%) | 0 (0.0%) |
| 5 to 9 Year Old | 34 (82.9%) | 7 (17.1%) |
| 10 to 14 Year Olds | 10 (32.3%) | 21 (67.7%) |
| 15 to 17 Year Olds | 15 (75.0%) | 5 (25.0%) |
| 18 to 19 Year Olds | 17 (100.0%) | 0 (0.0%) |
| 20 to 24 Year Olds | 0 (0.0%) | 0 (0.0%) |
| 25 to 34 Year Olds | 0 (0.0%) | 0 (0.0%) |
| 35 Years and over | 0 (0.0%) | 14 (100.0%) |
| Total | 82 (63.6%) | 47 (36.4%) |
Educational Attainment by Field of Study in Issaquena County
Education (23 | 42.6%), business (17 | 31.5%), social sciences (8 | 14.8%), bio, nature & agricultural (5 | 9.3%), and science & technology (1 | 1.8%) are the most common fields of study among 54 individuals in Issaquena County who have obtained a bachelor's degree or higher.
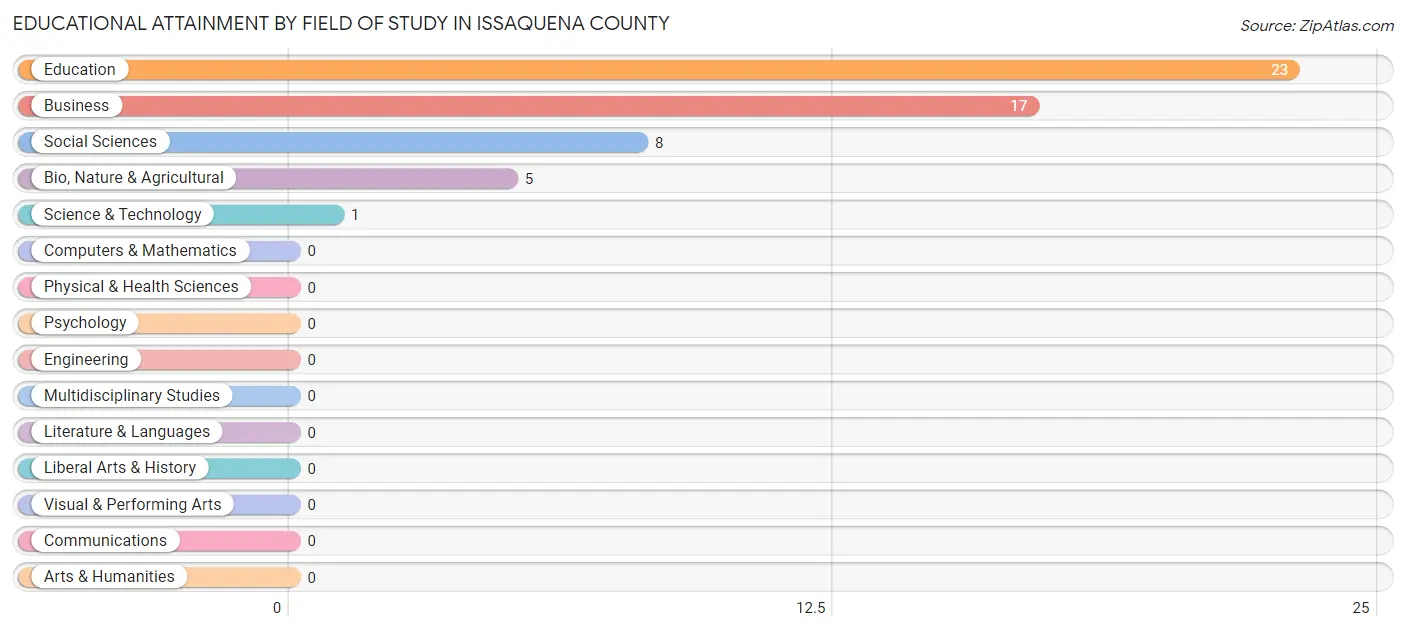
| Field of Study | # Graduates | % Graduates |
| Computers & Mathematics | 0 | 0.0% |
| Bio, Nature & Agricultural | 5 | 9.3% |
| Physical & Health Sciences | 0 | 0.0% |
| Psychology | 0 | 0.0% |
| Social Sciences | 8 | 14.8% |
| Engineering | 0 | 0.0% |
| Multidisciplinary Studies | 0 | 0.0% |
| Science & Technology | 1 | 1.8% |
| Business | 17 | 31.5% |
| Education | 23 | 42.6% |
| Literature & Languages | 0 | 0.0% |
| Liberal Arts & History | 0 | 0.0% |
| Visual & Performing Arts | 0 | 0.0% |
| Communications | 0 | 0.0% |
| Arts & Humanities | 0 | 0.0% |
| Total | 54 | 100.0% |
Transportation & Commute in Issaquena County
Vehicle Availability by Sex in Issaquena County
The most prevalent vehicle ownership categories in Issaquena County are males with 2 vehicles (65, accounting for 63.1%) and females with 2 vehicles (35, making up 91.5%).
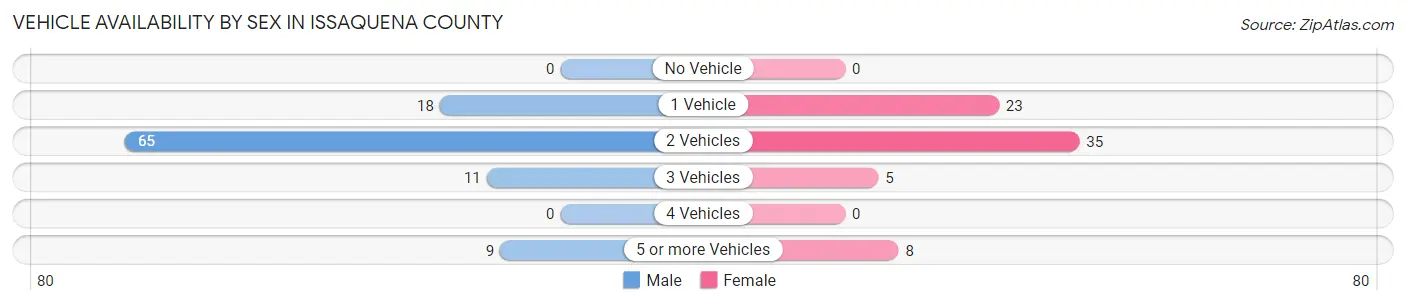
| Vehicles Available | Male | Female |
| No Vehicle | 0 (0.0%) | 0 (0.0%) |
| 1 Vehicle | 18 (17.5%) | 23 (32.4%) |
| 2 Vehicles | 65 (63.1%) | 35 (49.3%) |
| 3 Vehicles | 11 (10.7%) | 5 (7.0%) |
| 4 Vehicles | 0 (0.0%) | 0 (0.0%) |
| 5 or more Vehicles | 9 (8.7%) | 8 (11.3%) |
| Total | 103 (100.0%) | 71 (100.0%) |
Commute Time in Issaquena County
The most frequently occuring commute durations in Issaquena County are 10 to 14 minutes (32 commuters, 18.5%), 15 to 19 minutes (29 commuters, 16.8%), and 20 to 24 minutes (24 commuters, 13.9%).
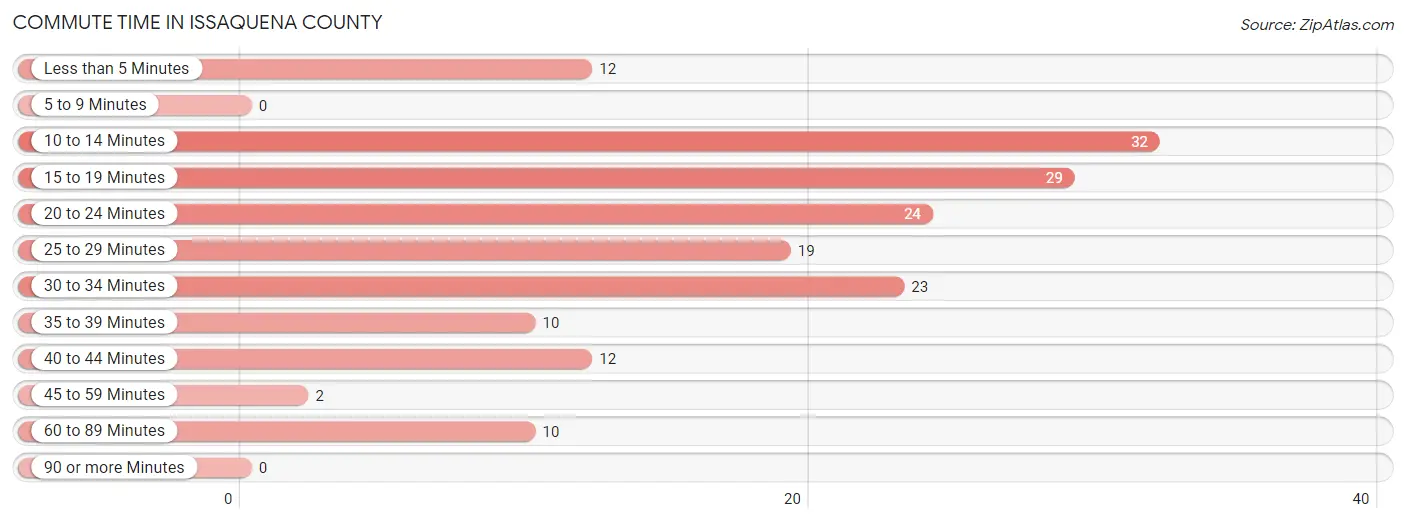
| Commute Time | # Commuters | % Commuters |
| Less than 5 Minutes | 12 | 6.9% |
| 5 to 9 Minutes | 0 | 0.0% |
| 10 to 14 Minutes | 32 | 18.5% |
| 15 to 19 Minutes | 29 | 16.8% |
| 20 to 24 Minutes | 24 | 13.9% |
| 25 to 29 Minutes | 19 | 11.0% |
| 30 to 34 Minutes | 23 | 13.3% |
| 35 to 39 Minutes | 10 | 5.8% |
| 40 to 44 Minutes | 12 | 6.9% |
| 45 to 59 Minutes | 2 | 1.2% |
| 60 to 89 Minutes | 10 | 5.8% |
| 90 or more Minutes | 0 | 0.0% |
Commute Time by Sex in Issaquena County
The most common commute times in Issaquena County are 10 to 14 minutes (32 commuters, 31.1%) for males and 30 to 34 minutes (23 commuters, 32.9%) for females.
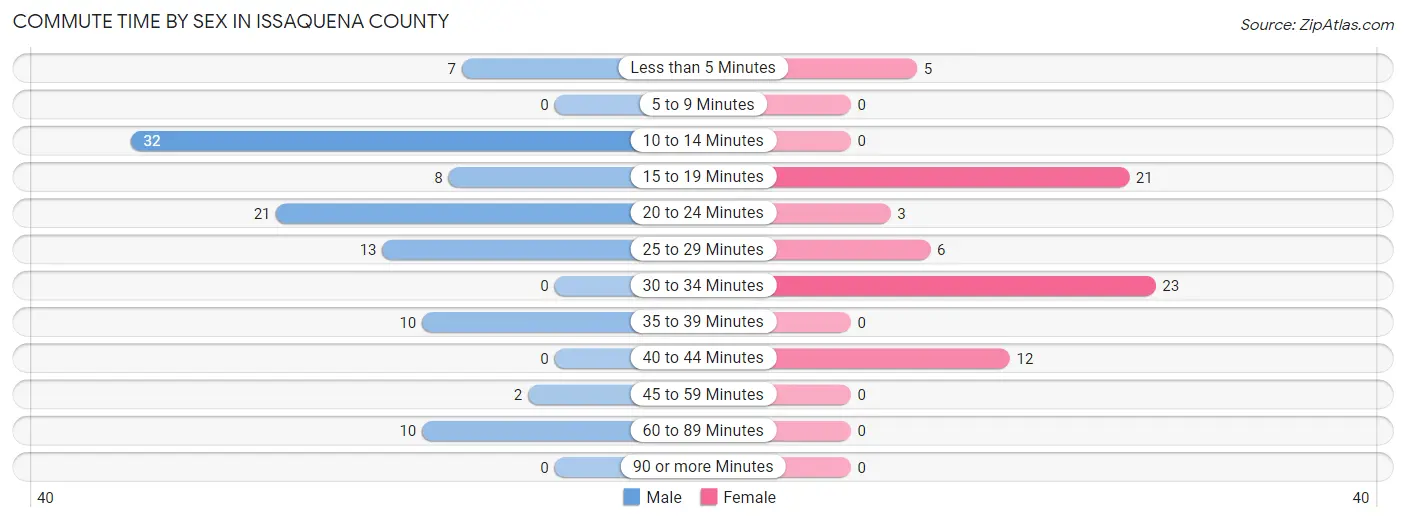
| Commute Time | Male | Female |
| Less than 5 Minutes | 7 (6.8%) | 5 (7.1%) |
| 5 to 9 Minutes | 0 (0.0%) | 0 (0.0%) |
| 10 to 14 Minutes | 32 (31.1%) | 0 (0.0%) |
| 15 to 19 Minutes | 8 (7.8%) | 21 (30.0%) |
| 20 to 24 Minutes | 21 (20.4%) | 3 (4.3%) |
| 25 to 29 Minutes | 13 (12.6%) | 6 (8.6%) |
| 30 to 34 Minutes | 0 (0.0%) | 23 (32.9%) |
| 35 to 39 Minutes | 10 (9.7%) | 0 (0.0%) |
| 40 to 44 Minutes | 0 (0.0%) | 12 (17.1%) |
| 45 to 59 Minutes | 2 (1.9%) | 0 (0.0%) |
| 60 to 89 Minutes | 10 (9.7%) | 0 (0.0%) |
| 90 or more Minutes | 0 (0.0%) | 0 (0.0%) |
Time of Departure to Work by Sex in Issaquena County
The most frequent times of departure to work in Issaquena County are 6:00 AM to 6:29 AM (28, 27.2%) for males and 7:00 AM to 7:29 AM (34, 48.6%) for females.
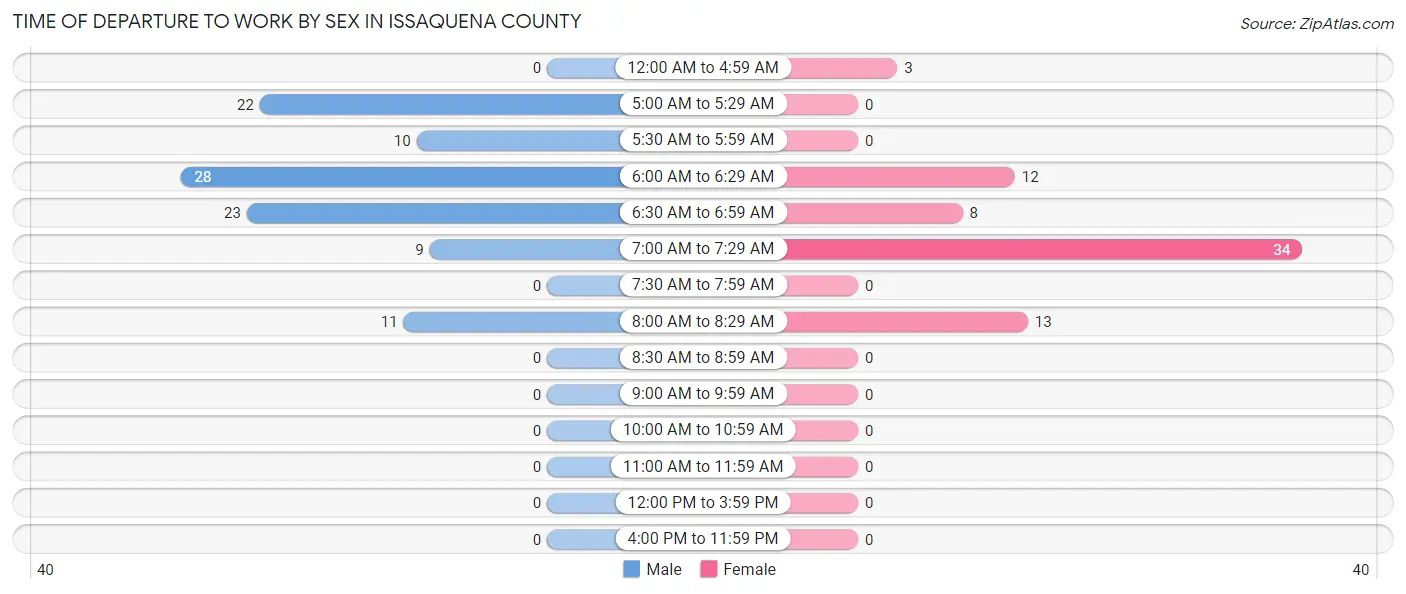
| Time of Departure | Male | Female |
| 12:00 AM to 4:59 AM | 0 (0.0%) | 3 (4.3%) |
| 5:00 AM to 5:29 AM | 22 (21.4%) | 0 (0.0%) |
| 5:30 AM to 5:59 AM | 10 (9.7%) | 0 (0.0%) |
| 6:00 AM to 6:29 AM | 28 (27.2%) | 12 (17.1%) |
| 6:30 AM to 6:59 AM | 23 (22.3%) | 8 (11.4%) |
| 7:00 AM to 7:29 AM | 9 (8.7%) | 34 (48.6%) |
| 7:30 AM to 7:59 AM | 0 (0.0%) | 0 (0.0%) |
| 8:00 AM to 8:29 AM | 11 (10.7%) | 13 (18.6%) |
| 8:30 AM to 8:59 AM | 0 (0.0%) | 0 (0.0%) |
| 9:00 AM to 9:59 AM | 0 (0.0%) | 0 (0.0%) |
| 10:00 AM to 10:59 AM | 0 (0.0%) | 0 (0.0%) |
| 11:00 AM to 11:59 AM | 0 (0.0%) | 0 (0.0%) |
| 12:00 PM to 3:59 PM | 0 (0.0%) | 0 (0.0%) |
| 4:00 PM to 11:59 PM | 0 (0.0%) | 0 (0.0%) |
| Total | 103 (100.0%) | 70 (100.0%) |
Housing Occupancy in Issaquena County
Occupancy by Ownership in Issaquena County
Of the total 392 dwellings in Issaquena County, owner-occupied units account for 199 (50.8%), while renter-occupied units make up 193 (49.2%).
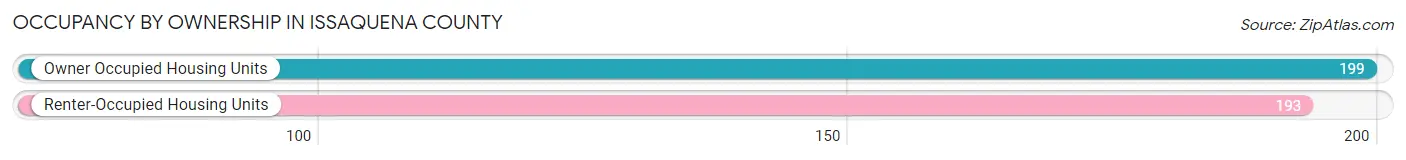
| Occupancy | # Housing Units | % Housing Units |
| Owner Occupied Housing Units | 199 | 50.8% |
| Renter-Occupied Housing Units | 193 | 49.2% |
| Total Occupied Housing Units | 392 | 100.0% |
Occupancy by Household Size in Issaquena County
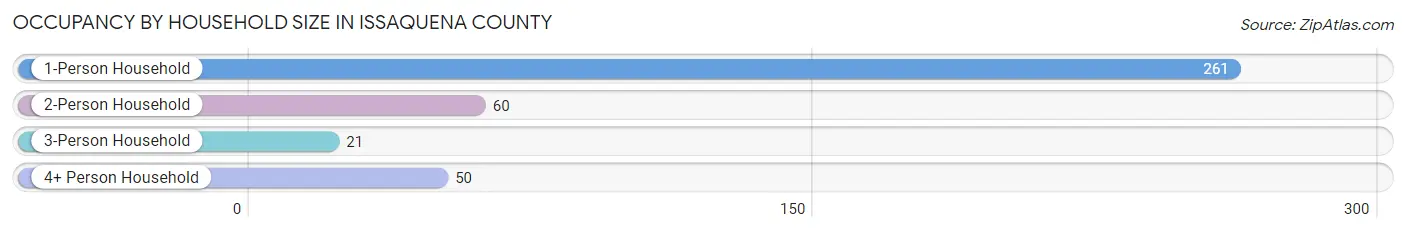
| Household Size | # Housing Units | % Housing Units |
| 1-Person Household | 261 | 66.6% |
| 2-Person Household | 60 | 15.3% |
| 3-Person Household | 21 | 5.4% |
| 4+ Person Household | 50 | 12.8% |
| Total Housing Units | 392 | 100.0% |
Occupancy by Ownership by Household Size in Issaquena County
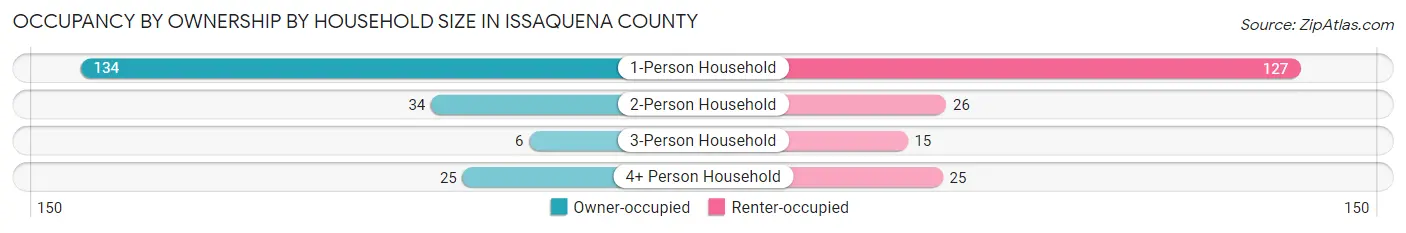
| Household Size | Owner-occupied | Renter-occupied |
| 1-Person Household | 134 (51.3%) | 127 (48.7%) |
| 2-Person Household | 34 (56.7%) | 26 (43.3%) |
| 3-Person Household | 6 (28.6%) | 15 (71.4%) |
| 4+ Person Household | 25 (50.0%) | 25 (50.0%) |
| Total Housing Units | 199 (50.8%) | 193 (49.2%) |
Occupancy by Educational Attainment in Issaquena County
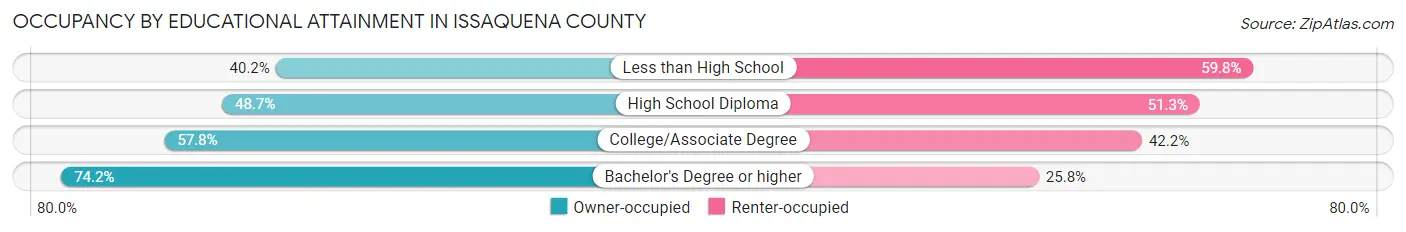
| Household Size | Owner-occupied | Renter-occupied |
| Less than High School | 43 (40.2%) | 64 (59.8%) |
| High School Diploma | 74 (48.7%) | 78 (51.3%) |
| College/Associate Degree | 59 (57.8%) | 43 (42.2%) |
| Bachelor's Degree or higher | 23 (74.2%) | 8 (25.8%) |
Occupancy by Age of Householder in Issaquena County
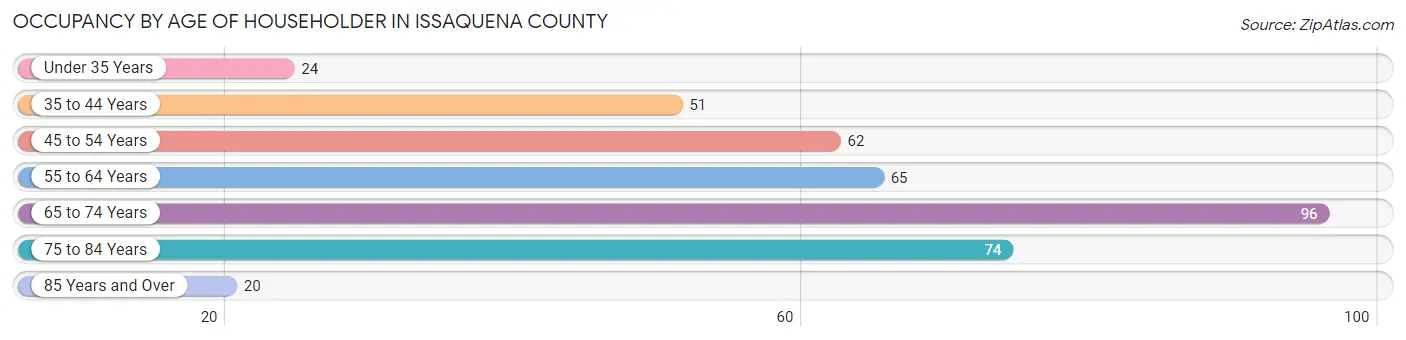
| Age Bracket | # Households | % Households |
| Under 35 Years | 24 | 6.1% |
| 35 to 44 Years | 51 | 13.0% |
| 45 to 54 Years | 62 | 15.8% |
| 55 to 64 Years | 65 | 16.6% |
| 65 to 74 Years | 96 | 24.5% |
| 75 to 84 Years | 74 | 18.9% |
| 85 Years and Over | 20 | 5.1% |
| Total | 392 | 100.0% |
Housing Finances in Issaquena County
Median Income by Occupancy in Issaquena County
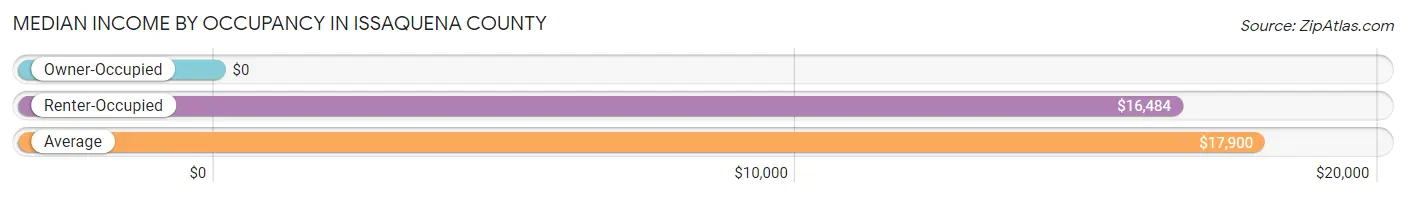
| Occupancy Type | # Households | Median Income |
| Owner-Occupied | 199 (50.8%) | $0 |
| Renter-Occupied | 193 (49.2%) | $16,484 |
| Average | 392 (100.0%) | $17,900 |
Occupancy by Householder Income Bracket in Issaquena County
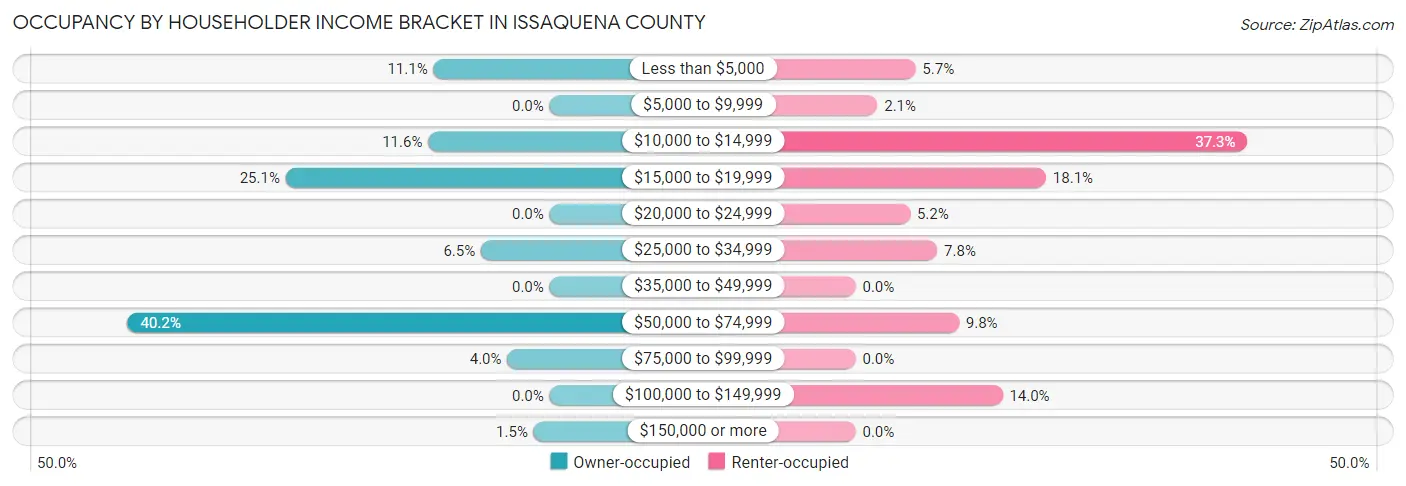
| Income Bracket | Owner-occupied | Renter-occupied |
| Less than $5,000 | 22 (11.1%) | 11 (5.7%) |
| $5,000 to $9,999 | 0 (0.0%) | 4 (2.1%) |
| $10,000 to $14,999 | 23 (11.6%) | 72 (37.3%) |
| $15,000 to $19,999 | 50 (25.1%) | 35 (18.1%) |
| $20,000 to $24,999 | 0 (0.0%) | 10 (5.2%) |
| $25,000 to $34,999 | 13 (6.5%) | 15 (7.8%) |
| $35,000 to $49,999 | 0 (0.0%) | 0 (0.0%) |
| $50,000 to $74,999 | 80 (40.2%) | 19 (9.8%) |
| $75,000 to $99,999 | 8 (4.0%) | 0 (0.0%) |
| $100,000 to $149,999 | 0 (0.0%) | 27 (14.0%) |
| $150,000 or more | 3 (1.5%) | 0 (0.0%) |
| Total | 199 (100.0%) | 193 (100.0%) |
Monthly Housing Cost Tiers in Issaquena County
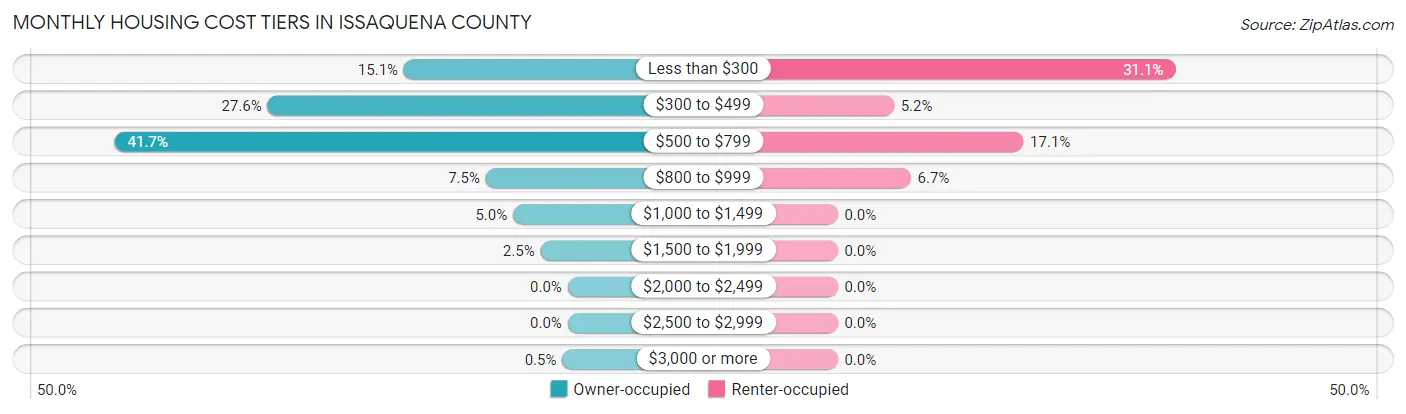
| Monthly Cost | Owner-occupied | Renter-occupied |
| Less than $300 | 30 (15.1%) | 60 (31.1%) |
| $300 to $499 | 55 (27.6%) | 10 (5.2%) |
| $500 to $799 | 83 (41.7%) | 33 (17.1%) |
| $800 to $999 | 15 (7.5%) | 13 (6.7%) |
| $1,000 to $1,499 | 10 (5.0%) | 0 (0.0%) |
| $1,500 to $1,999 | 5 (2.5%) | 0 (0.0%) |
| $2,000 to $2,499 | 0 (0.0%) | 0 (0.0%) |
| $2,500 to $2,999 | 0 (0.0%) | 0 (0.0%) |
| $3,000 or more | 1 (0.5%) | 0 (0.0%) |
| Total | 199 (100.0%) | 193 (100.0%) |
Physical Housing Characteristics in Issaquena County
Housing Structures in Issaquena County
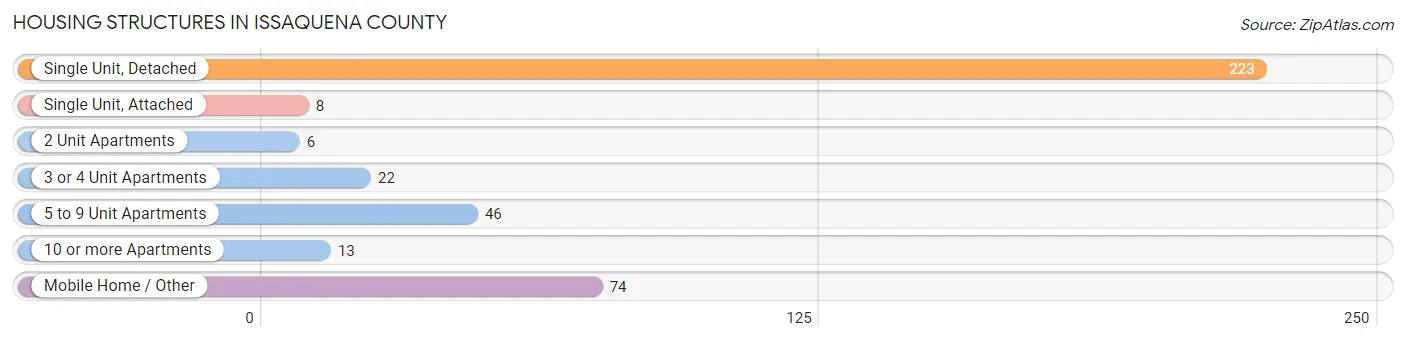
| Structure Type | # Housing Units | % Housing Units |
| Single Unit, Detached | 223 | 56.9% |
| Single Unit, Attached | 8 | 2.0% |
| 2 Unit Apartments | 6 | 1.5% |
| 3 or 4 Unit Apartments | 22 | 5.6% |
| 5 to 9 Unit Apartments | 46 | 11.7% |
| 10 or more Apartments | 13 | 3.3% |
| Mobile Home / Other | 74 | 18.9% |
| Total | 392 | 100.0% |
Housing Structures by Occupancy in Issaquena County
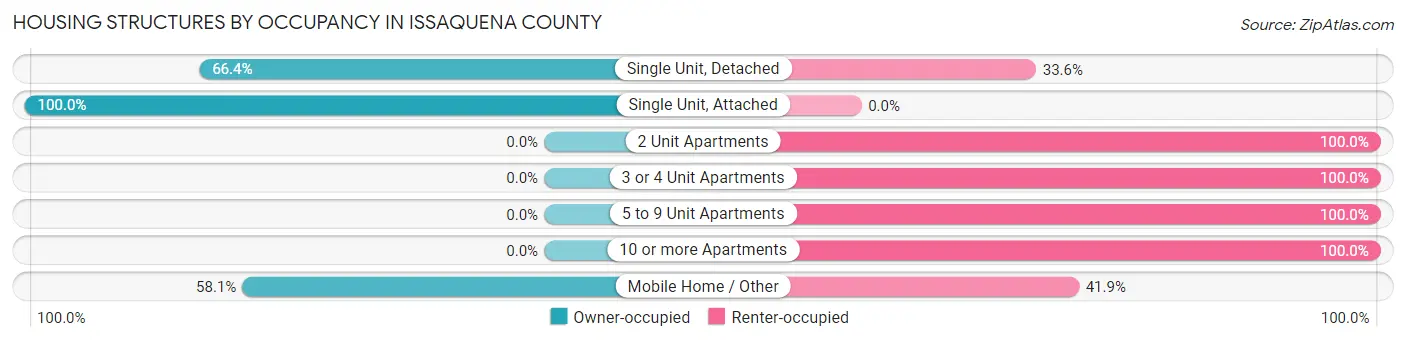
| Structure Type | Owner-occupied | Renter-occupied |
| Single Unit, Detached | 148 (66.4%) | 75 (33.6%) |
| Single Unit, Attached | 8 (100.0%) | 0 (0.0%) |
| 2 Unit Apartments | 0 (0.0%) | 6 (100.0%) |
| 3 or 4 Unit Apartments | 0 (0.0%) | 22 (100.0%) |
| 5 to 9 Unit Apartments | 0 (0.0%) | 46 (100.0%) |
| 10 or more Apartments | 0 (0.0%) | 13 (100.0%) |
| Mobile Home / Other | 43 (58.1%) | 31 (41.9%) |
| Total | 199 (50.8%) | 193 (49.2%) |
Housing Structures by Number of Rooms in Issaquena County
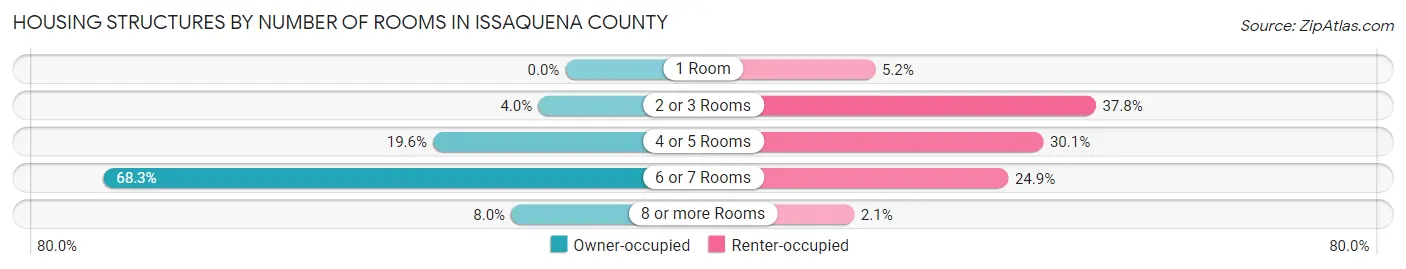
| Number of Rooms | Owner-occupied | Renter-occupied |
| 1 Room | 0 (0.0%) | 10 (5.2%) |
| 2 or 3 Rooms | 8 (4.0%) | 73 (37.8%) |
| 4 or 5 Rooms | 39 (19.6%) | 58 (30.0%) |
| 6 or 7 Rooms | 136 (68.3%) | 48 (24.9%) |
| 8 or more Rooms | 16 (8.0%) | 4 (2.1%) |
| Total | 199 (100.0%) | 193 (100.0%) |
Housing Structure by Heating Type in Issaquena County
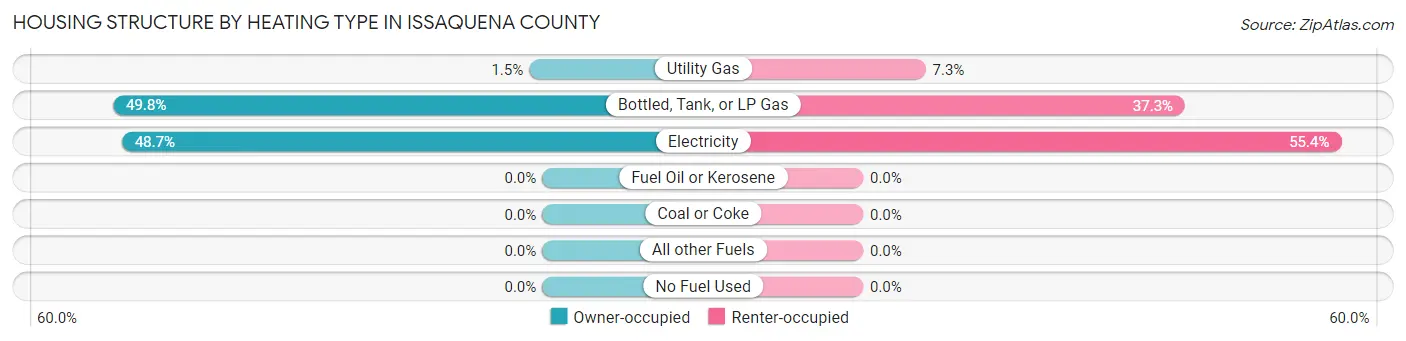
| Heating Type | Owner-occupied | Renter-occupied |
| Utility Gas | 3 (1.5%) | 14 (7.2%) |
| Bottled, Tank, or LP Gas | 99 (49.7%) | 72 (37.3%) |
| Electricity | 97 (48.7%) | 107 (55.4%) |
| Fuel Oil or Kerosene | 0 (0.0%) | 0 (0.0%) |
| Coal or Coke | 0 (0.0%) | 0 (0.0%) |
| All other Fuels | 0 (0.0%) | 0 (0.0%) |
| No Fuel Used | 0 (0.0%) | 0 (0.0%) |
| Total | 199 (100.0%) | 193 (100.0%) |
Household Vehicle Usage in Issaquena County
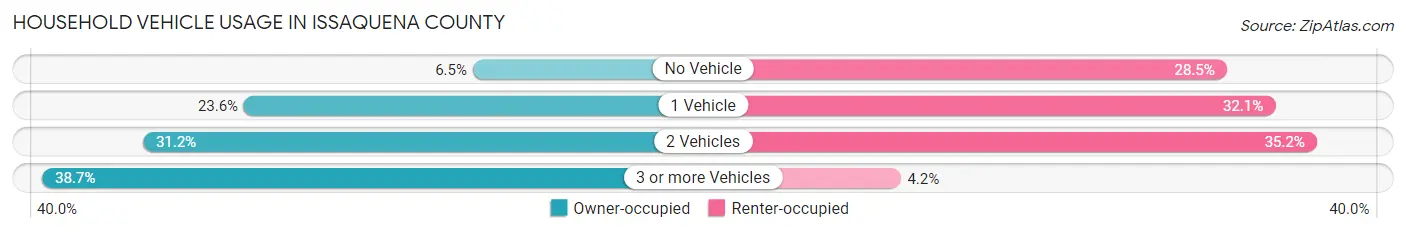
| Vehicles per Household | Owner-occupied | Renter-occupied |
| No Vehicle | 13 (6.5%) | 55 (28.5%) |
| 1 Vehicle | 47 (23.6%) | 62 (32.1%) |
| 2 Vehicles | 62 (31.2%) | 68 (35.2%) |
| 3 or more Vehicles | 77 (38.7%) | 8 (4.2%) |
| Total | 199 (100.0%) | 193 (100.0%) |
Real Estate & Mortgages in Issaquena County
Real Estate and Mortgage Overview in Issaquena County
| Characteristic | Without Mortgage | With Mortgage |
| Housing Units | 175 | 24 |
| Median Property Value | $88,300 | $129,500 |
| Median Household Income | - | - |
| Monthly Housing Costs | $504 | $1 |
| Real Estate Taxes | $400 | $8 |
Property Value by Mortgage Status in Issaquena County
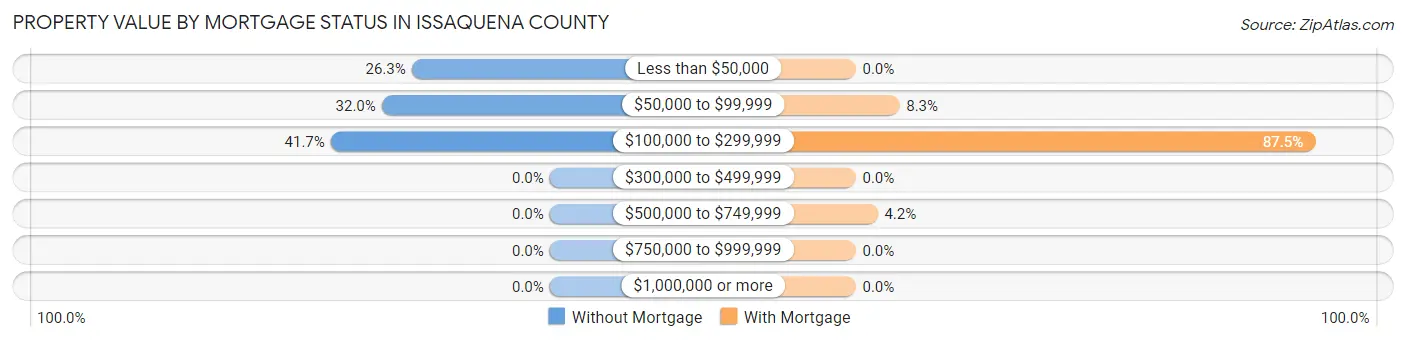
| Property Value | Without Mortgage | With Mortgage |
| Less than $50,000 | 46 (26.3%) | 0 (0.0%) |
| $50,000 to $99,999 | 56 (32.0%) | 2 (8.3%) |
| $100,000 to $299,999 | 73 (41.7%) | 21 (87.5%) |
| $300,000 to $499,999 | 0 (0.0%) | 0 (0.0%) |
| $500,000 to $749,999 | 0 (0.0%) | 1 (4.2%) |
| $750,000 to $999,999 | 0 (0.0%) | 0 (0.0%) |
| $1,000,000 or more | 0 (0.0%) | 0 (0.0%) |
| Total | 175 (100.0%) | 24 (100.0%) |
Household Income by Mortgage Status in Issaquena County
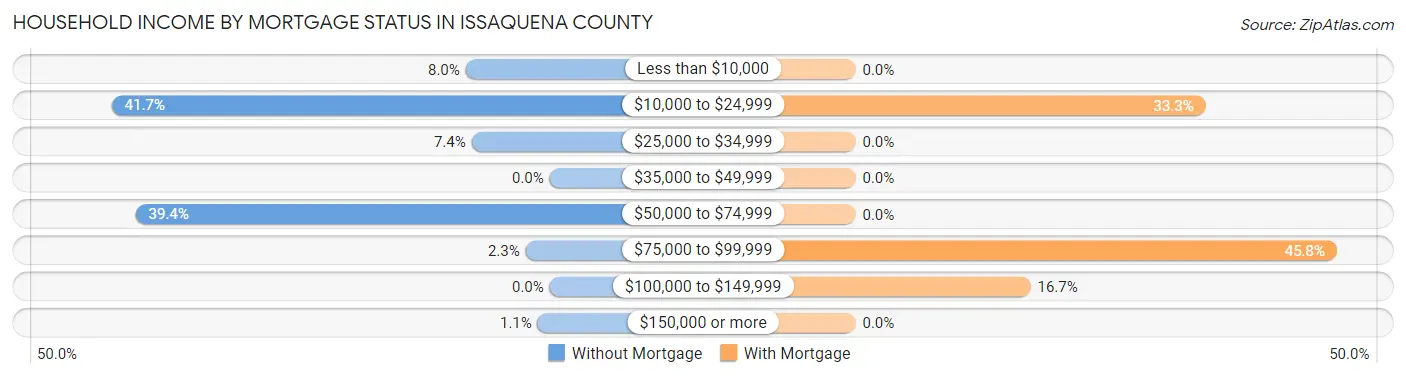
| Household Income | Without Mortgage | With Mortgage |
| Less than $10,000 | 14 (8.0%) | 0 (0.0%) |
| $10,000 to $24,999 | 73 (41.7%) | 8 (33.3%) |
| $25,000 to $34,999 | 13 (7.4%) | 0 (0.0%) |
| $35,000 to $49,999 | 0 (0.0%) | 0 (0.0%) |
| $50,000 to $74,999 | 69 (39.4%) | 0 (0.0%) |
| $75,000 to $99,999 | 4 (2.3%) | 11 (45.8%) |
| $100,000 to $149,999 | 0 (0.0%) | 4 (16.7%) |
| $150,000 or more | 2 (1.1%) | 0 (0.0%) |
| Total | 175 (100.0%) | 24 (100.0%) |
Property Value to Household Income Ratio in Issaquena County
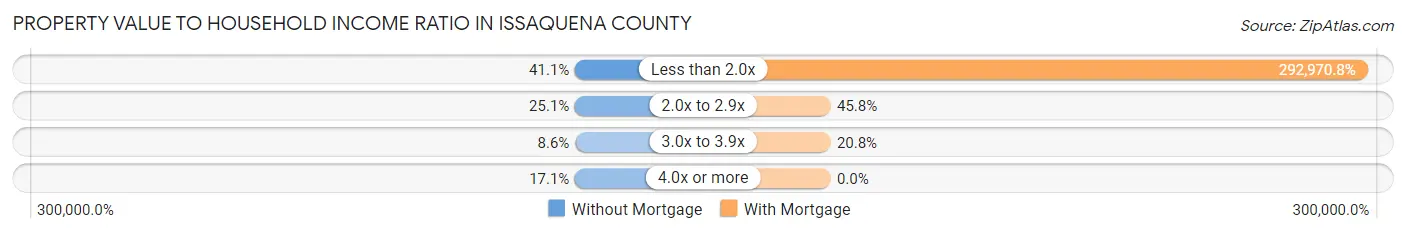
| Value-to-Income Ratio | Without Mortgage | With Mortgage |
| Less than 2.0x | 72 (41.1%) | 70,313 (292,970.8%) |
| 2.0x to 2.9x | 44 (25.1%) | 11 (45.8%) |
| 3.0x to 3.9x | 15 (8.6%) | 5 (20.8%) |
| 4.0x or more | 30 (17.1%) | 0 (0.0%) |
| Total | 175 (100.0%) | 24 (100.0%) |
Real Estate Taxes by Mortgage Status in Issaquena County
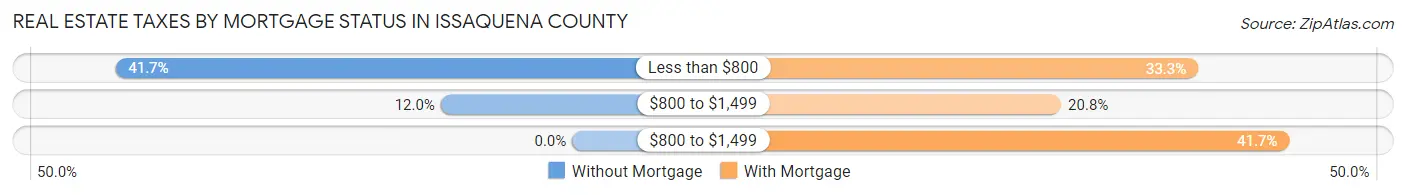
| Property Taxes | Without Mortgage | With Mortgage |
| Less than $800 | 73 (41.7%) | 8 (33.3%) |
| $800 to $1,499 | 21 (12.0%) | 5 (20.8%) |
| $800 to $1,499 | 0 (0.0%) | 10 (41.7%) |
| Total | 175 (100.0%) | 24 (100.0%) |
Health & Disability in Issaquena County
Health Insurance Coverage by Age in Issaquena County
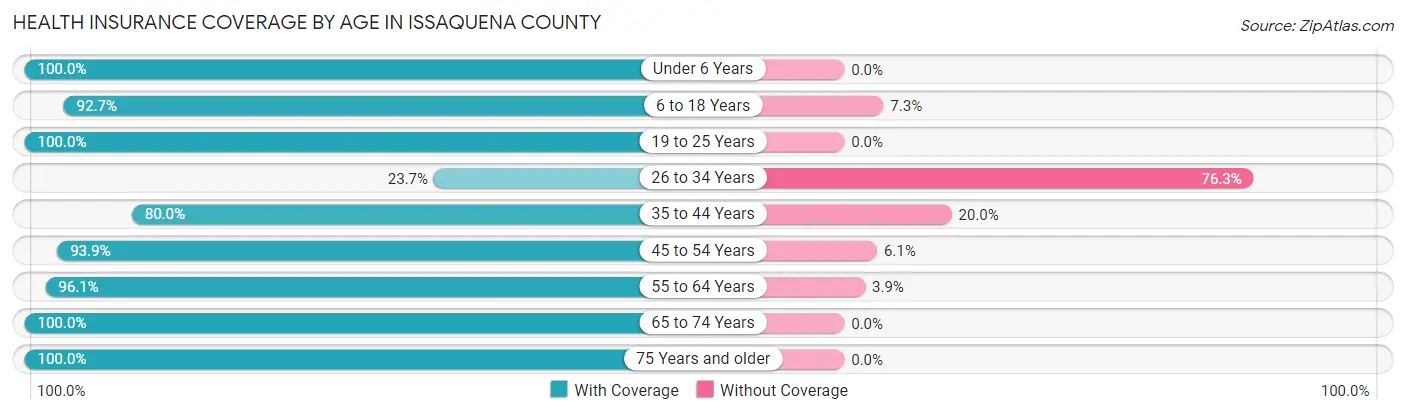
| Age Bracket | With Coverage | Without Coverage |
| Under 6 Years | 29 (100.0%) | 0 (0.0%) |
| 6 to 18 Years | 89 (92.7%) | 7 (7.3%) |
| 19 to 25 Years | 30 (100.0%) | 0 (0.0%) |
| 26 to 34 Years | 18 (23.7%) | 58 (76.3%) |
| 35 to 44 Years | 132 (80.0%) | 33 (20.0%) |
| 45 to 54 Years | 108 (93.9%) | 7 (6.1%) |
| 55 to 64 Years | 99 (96.1%) | 4 (3.9%) |
| 65 to 74 Years | 130 (100.0%) | 0 (0.0%) |
| 75 Years and older | 109 (100.0%) | 0 (0.0%) |
| Total | 744 (87.2%) | 109 (12.8%) |
Health Insurance Coverage by Citizenship Status in Issaquena County
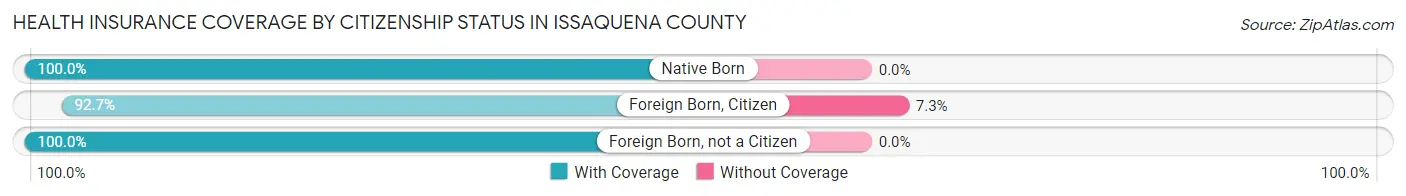
| Citizenship Status | With Coverage | Without Coverage |
| Native Born | 29 (100.0%) | 0 (0.0%) |
| Foreign Born, Citizen | 89 (92.7%) | 7 (7.3%) |
| Foreign Born, not a Citizen | 30 (100.0%) | 0 (0.0%) |
Health Insurance Coverage by Household Income in Issaquena County
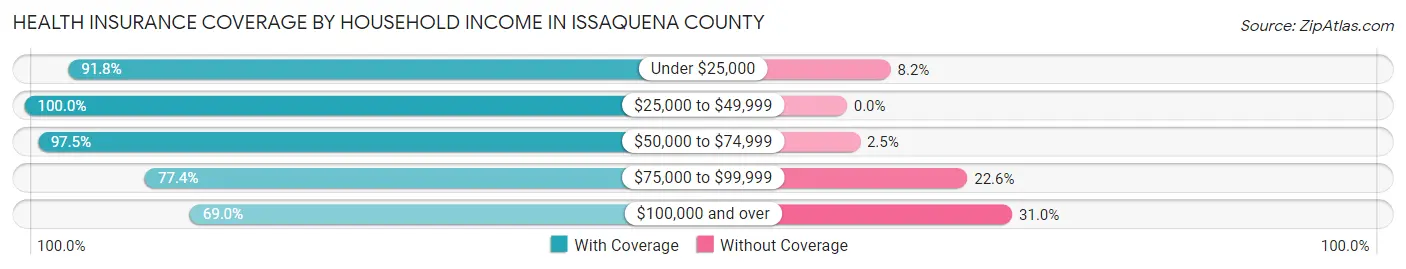
| Household Income | With Coverage | Without Coverage |
| Under $25,000 | 246 (91.8%) | 22 (8.2%) |
| $25,000 to $49,999 | 40 (100.0%) | 0 (0.0%) |
| $50,000 to $74,999 | 276 (97.5%) | 7 (2.5%) |
| $75,000 to $99,999 | 24 (77.4%) | 7 (22.6%) |
| $100,000 and over | 156 (69.0%) | 70 (31.0%) |
Public vs Private Health Insurance Coverage by Age in Issaquena County
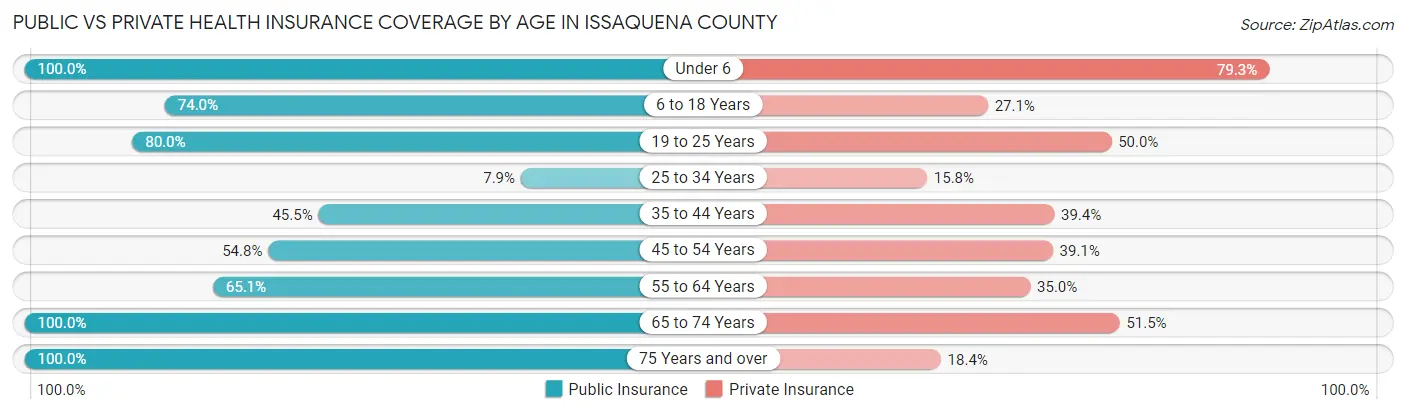
| Age Bracket | Public Insurance | Private Insurance |
| Under 6 | 29 (100.0%) | 23 (79.3%) |
| 6 to 18 Years | 71 (74.0%) | 26 (27.1%) |
| 19 to 25 Years | 24 (80.0%) | 15 (50.0%) |
| 25 to 34 Years | 6 (7.9%) | 12 (15.8%) |
| 35 to 44 Years | 75 (45.5%) | 65 (39.4%) |
| 45 to 54 Years | 63 (54.8%) | 45 (39.1%) |
| 55 to 64 Years | 67 (65.0%) | 36 (34.9%) |
| 65 to 74 Years | 130 (100.0%) | 67 (51.5%) |
| 75 Years and over | 109 (100.0%) | 20 (18.3%) |
| Total | 574 (67.3%) | 309 (36.2%) |
Disability Status by Sex by Age in Issaquena County
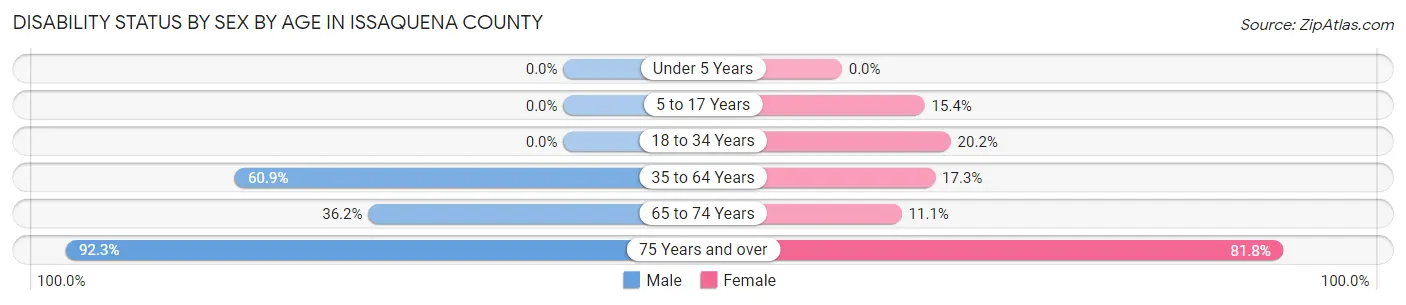
| Age Bracket | Male | Female |
| Under 5 Years | 0 (0.0%) | 0 (0.0%) |
| 5 to 17 Years | 0 (0.0%) | 10 (15.4%) |
| 18 to 34 Years | 0 (0.0%) | 19 (20.2%) |
| 35 to 64 Years | 142 (60.9%) | 26 (17.3%) |
| 65 to 74 Years | 21 (36.2%) | 8 (11.1%) |
| 75 Years and over | 60 (92.3%) | 36 (81.8%) |
Disability Class by Sex by Age in Issaquena County
Disability Class: Hearing Difficulty
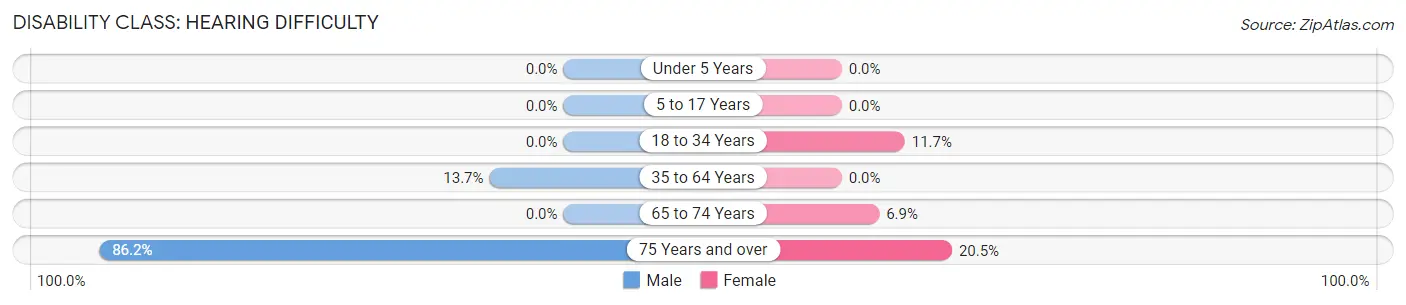
| Age Bracket | Male | Female |
| Under 5 Years | 0 (0.0%) | 0 (0.0%) |
| 5 to 17 Years | 0 (0.0%) | 0 (0.0%) |
| 18 to 34 Years | 0 (0.0%) | 11 (11.7%) |
| 35 to 64 Years | 32 (13.7%) | 0 (0.0%) |
| 65 to 74 Years | 0 (0.0%) | 5 (6.9%) |
| 75 Years and over | 56 (86.2%) | 9 (20.4%) |
Disability Class: Vision Difficulty
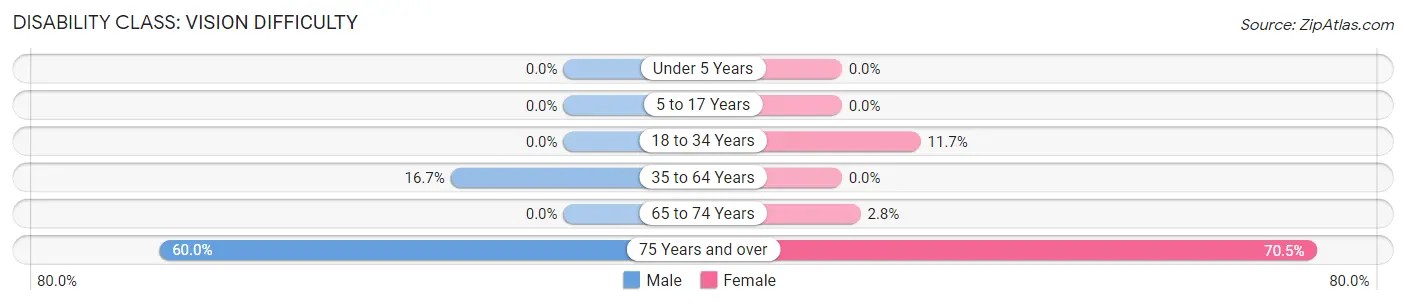
| Age Bracket | Male | Female |
| Under 5 Years | 0 (0.0%) | 0 (0.0%) |
| 5 to 17 Years | 0 (0.0%) | 0 (0.0%) |
| 18 to 34 Years | 0 (0.0%) | 11 (11.7%) |
| 35 to 64 Years | 39 (16.7%) | 0 (0.0%) |
| 65 to 74 Years | 0 (0.0%) | 2 (2.8%) |
| 75 Years and over | 39 (60.0%) | 31 (70.5%) |
Disability Class: Cognitive Difficulty
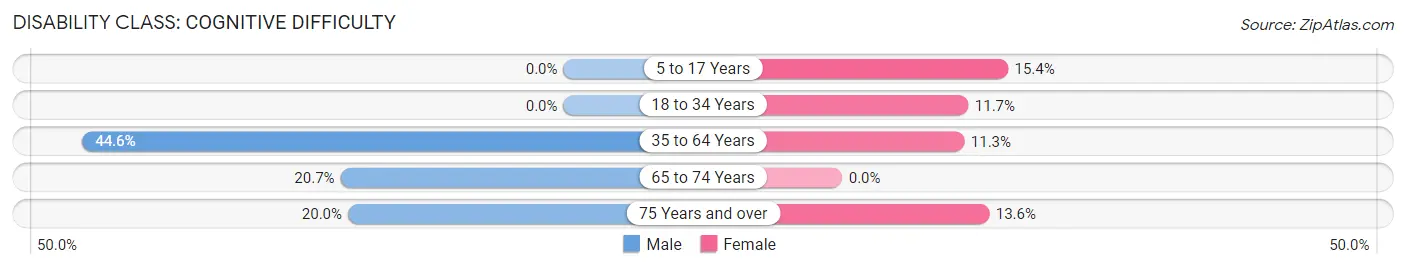
| Age Bracket | Male | Female |
| 5 to 17 Years | 0 (0.0%) | 10 (15.4%) |
| 18 to 34 Years | 0 (0.0%) | 11 (11.7%) |
| 35 to 64 Years | 104 (44.6%) | 17 (11.3%) |
| 65 to 74 Years | 12 (20.7%) | 0 (0.0%) |
| 75 Years and over | 13 (20.0%) | 6 (13.6%) |
Disability Class: Ambulatory Difficulty
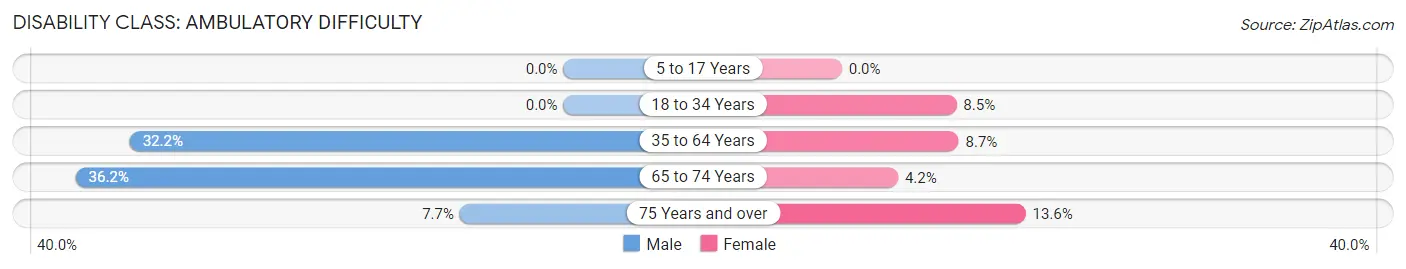
| Age Bracket | Male | Female |
| 5 to 17 Years | 0 (0.0%) | 0 (0.0%) |
| 18 to 34 Years | 0 (0.0%) | 8 (8.5%) |
| 35 to 64 Years | 75 (32.2%) | 13 (8.7%) |
| 65 to 74 Years | 21 (36.2%) | 3 (4.2%) |
| 75 Years and over | 5 (7.7%) | 6 (13.6%) |
Disability Class: Self-Care Difficulty
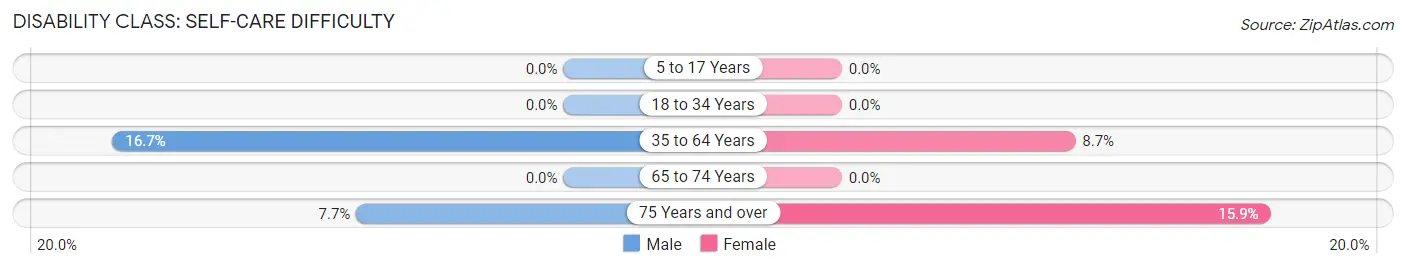
| Age Bracket | Male | Female |
| 5 to 17 Years | 0 (0.0%) | 0 (0.0%) |
| 18 to 34 Years | 0 (0.0%) | 0 (0.0%) |
| 35 to 64 Years | 39 (16.7%) | 13 (8.7%) |
| 65 to 74 Years | 0 (0.0%) | 0 (0.0%) |
| 75 Years and over | 5 (7.7%) | 7 (15.9%) |
Technology Access in Issaquena County
Computing Device Access in Issaquena County
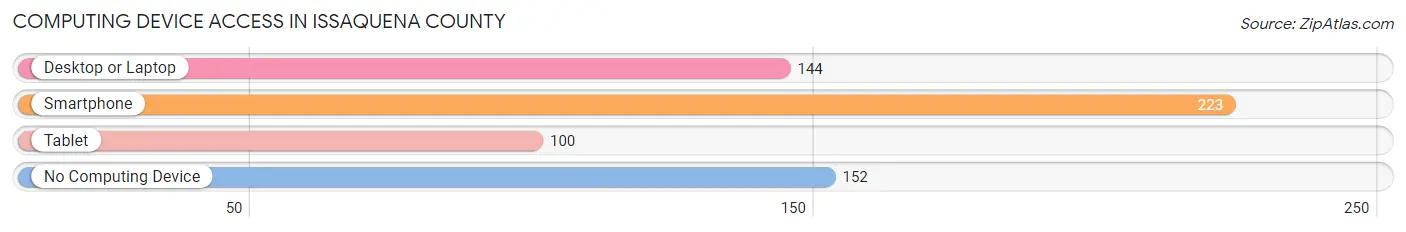
| Device Type | # Households | % Households |
| Desktop or Laptop | 144 | 36.7% |
| Smartphone | 223 | 56.9% |
| Tablet | 100 | 25.5% |
| No Computing Device | 152 | 38.8% |
| Total | 392 | 100.0% |
Internet Access in Issaquena County
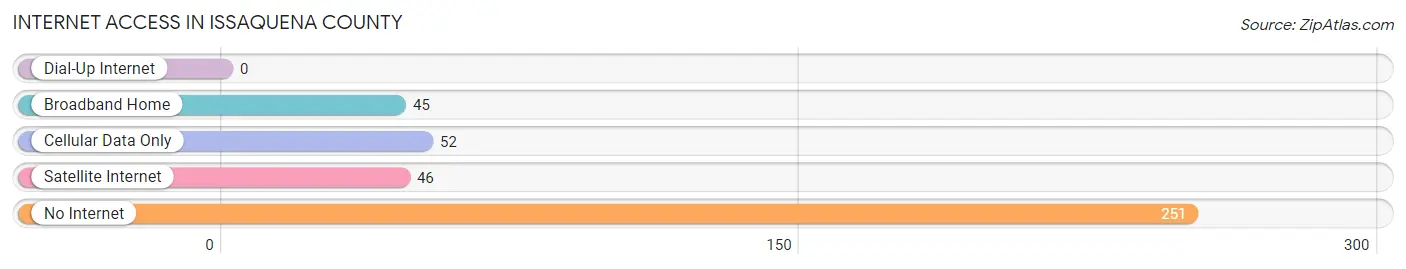
| Internet Type | # Households | % Households |
| Dial-Up Internet | 0 | 0.0% |
| Broadband Home | 45 | 11.5% |
| Cellular Data Only | 52 | 13.3% |
| Satellite Internet | 46 | 11.7% |
| No Internet | 251 | 64.0% |
| Total | 392 | 100.0% |
Issaquena County Summary
Issaquena County, Mississippi is located in the Mississippi Delta region of the state, and is bordered by the Mississippi River to the west, Sharkey County to the north, Washington County to the east, and Warren County to the south. The county seat is Mayersville, and the county has a total area of 441 square miles, of which 437 square miles is land and 4 square miles is water. As of the 2010 census, the population of Issaquena County was 1,406, making it the least populous county in Mississippi.
History
Issaquena County was established in 1844, and was named for the Choctaw word for “deer”. The county was originally part of Washington County, and was created to provide better access to the Mississippi River for the residents of the area. The county was largely agricultural, and the main crops were cotton, corn, and soybeans.
During the Civil War, the county was the site of several battles, including the Battle of Fort Pemberton in 1863. After the war, the county’s economy was largely based on cotton production, and the population grew steadily until the Great Depression. During the Great Depression, the population declined significantly, and the county’s economy was further weakened by the boll weevil infestation of the 1930s.
In the 1950s, the economy of the county began to diversify, and the population began to grow again. The county’s economy is still largely based on agriculture, but it has also become a popular destination for hunting and fishing.
Geography
Issaquena County is located in the Mississippi Delta region of the state, and is bordered by the Mississippi River to the west, Sharkey County to the north, Washington County to the east, and Warren County to the south. The county has a total area of 441 square miles, of which 437 square miles is land and 4 square miles is water. The county is mostly flat, with some rolling hills in the northern part of the county. The county is drained by the Yazoo River, which flows through the county from north to south.
The county is home to several state parks, including Panther Swamp National Wildlife Refuge, which is located in the northern part of the county. The refuge is home to a variety of wildlife, including deer, turkey, and waterfowl. The county is also home to several other wildlife management areas, including the Issaquena Wildlife Management Area, which is located in the southern part of the county.
Economy
The economy of Issaquena County is largely based on agriculture. The main crops grown in the county are cotton, corn, soybeans, and rice. The county is also home to several timber companies, which harvest timber from the county’s forests.
The county is also home to several manufacturing companies, including a furniture manufacturer and a paper mill. The county is also home to several small businesses, including restaurants, retail stores, and service providers.
Demographics
As of the 2010 census, the population of Issaquena County was 1,406, making it the least populous county in Mississippi. The population is spread out, with 48.3% of the population under the age of 18, and 51.7% of the population over the age of 18. The median age of the population is 37.7 years.
The racial makeup of the county is 79.2% African American, 19.3% White, 0.3% Native American, 0.2% Asian, and 0.9% from other races. The median household income in the county is $25,938, and the median family income is $31,250. The per capita income in the county is $13,845. The poverty rate in the county is 37.2%.
Common Questions
What is Per Capita Income in Issaquena County?
Per Capita income in Issaquena County is $13,539.
What is the Median Family Income in Issaquena County?
Median Family Income in Issaquena County is $63,688.
What is the Median Household income in Issaquena County?
Median Household Income in Issaquena County is $17,900.
What is Income or Wage Gap in Issaquena County?
Income or Wage Gap in Issaquena County is 9.9%.
Women in Issaquena County earn 90.1 cents for every dollar earned by a man.
What is Family Income Deficit in Issaquena County?
Family Income Deficit in Issaquena County is $11,413.
Families that are below poverty line in Issaquena County earn $11,413 less on average than the poverty threshold level.
What is Inequality or Gini Index in Issaquena County?
Inequality or Gini Index in Issaquena County is 0.49.
What is the Total Population of Issaquena County?
Total Population of Issaquena County is 1,206.
What is the Total Male Population of Issaquena County?
Total Male Population of Issaquena County is 773.
What is the Total Female Population of Issaquena County?
Total Female Population of Issaquena County is 433.
What is the Ratio of Males per 100 Females in Issaquena County?
There are 178.52 Males per 100 Females in Issaquena County.
What is the Ratio of Females per 100 Males in Issaquena County?
There are 56.02 Females per 100 Males in Issaquena County.
What is the Median Population Age in Issaquena County?
Median Population Age in Issaquena County is 43.1 Years.
What is the Average Family Size in Issaquena County
Average Family Size in Issaquena County is 4.4 People.
What is the Average Household Size in Issaquena County
Average Household Size in Issaquena County is 2.2 People.
How Large is the Labor Force in Issaquena County?
There are 206 People in the Labor Forcein in Issaquena County.
What is the Percentage of People in the Labor Force in Issaquena County?
18.6% of People are in the Labor Force in Issaquena County.
What is the Unemployment Rate in Issaquena County?
Unemployment Rate in Issaquena County is 12.1%.