Humphreys County, MS Map & Demographics
Humphreys County Map
Humphreys County Overview
$24,506
PER CAPITA INCOME
$34,909
AVG FAMILY INCOME
$31,907
AVG HOUSEHOLD INCOME
20.5%
WAGE / INCOME GAP [ % ]
79.5¢/ $1
WAGE / INCOME GAP [ $ ]
0.59
INEQUALITY / GINI INDEX
7,744
TOTAL POPULATION
3,538
MALE POPULATION
4,206
FEMALE POPULATION
84.12
MALES / 100 FEMALES
118.88
FEMALES / 100 MALES
38.4
MEDIAN AGE
3.2
AVG FAMILY SIZE
2.6
AVG HOUSEHOLD SIZE
2,980
LABOR FORCE [ PEOPLE ]
49.6%
PERCENT IN LABOR FORCE
13.7%
UNEMPLOYMENT RATE
Humphreys County Area Codes
Income in Humphreys County
Income Overview in Humphreys County
Per Capita Income in Humphreys County is $24,506, while median incomes of families and households are $34,909 and $31,907 respectively.
| Characteristic | Number | Measure |
| Per Capita Income | 7,744 | $24,506 |
| Median Family Income | 2,022 | $34,909 |
| Mean Family Income | 2,022 | $63,868 |
| Median Household Income | 2,991 | $31,907 |
| Mean Household Income | 2,991 | $61,023 |
| Income Deficit | 2,022 | $0 |
| Wage / Income Gap (%) | 7,744 | 20.51% |
| Wage / Income Gap ($) | 7,744 | 79.49¢ per $1 |
| Gini / Inequality Index | 7,744 | 0.59 |
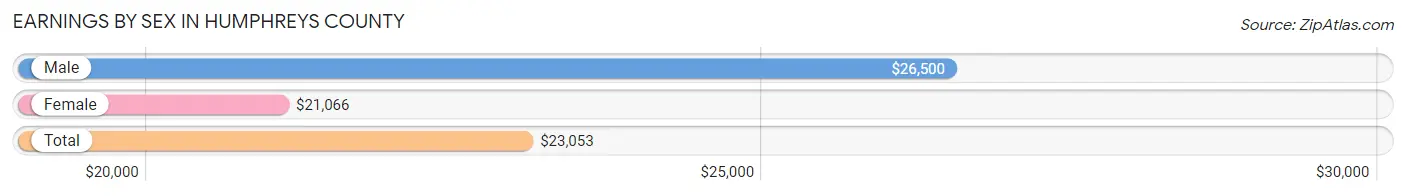
Earnings by Sex in Humphreys County
Average Earnings in Humphreys County are $23,053, $26,500 for men and $21,066 for women, a difference of 20.5%.
| Sex | Number | Average Earnings |
| Male | 1,528 (49.5%) | $26,500 |
| Female | 1,558 (50.5%) | $21,066 |
| Total | 3,086 (100.0%) | $23,053 |
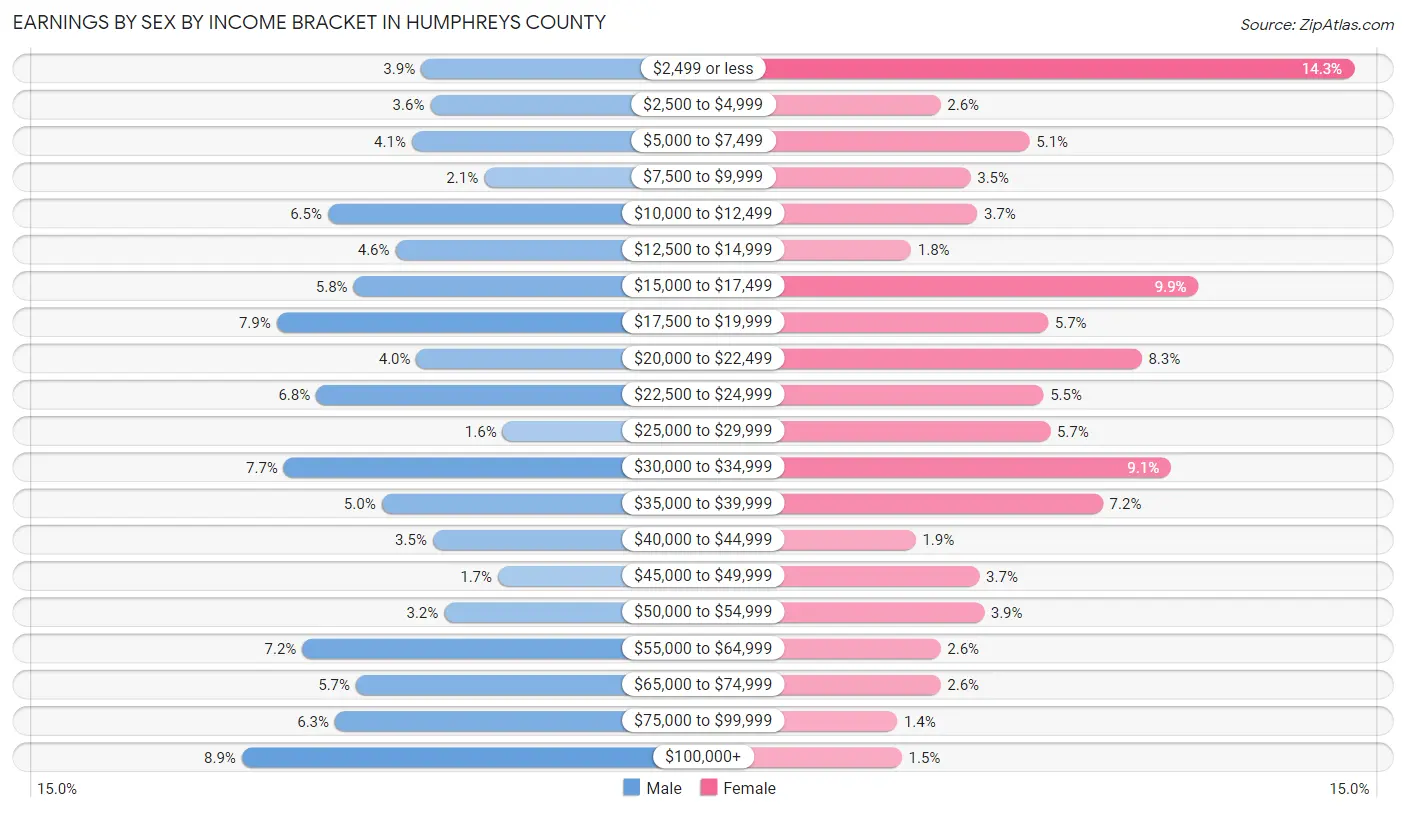
Earnings by Sex by Income Bracket in Humphreys County
The most common earnings brackets in Humphreys County are $100,000+ for men (136 | 8.9%) and $2,499 or less for women (222 | 14.2%).
| Income | Male | Female |
| $2,499 or less | 59 (3.9%) | 222 (14.2%) |
| $2,500 to $4,999 | 55 (3.6%) | 41 (2.6%) |
| $5,000 to $7,499 | 63 (4.1%) | 80 (5.1%) |
| $7,500 to $9,999 | 32 (2.1%) | 54 (3.5%) |
| $10,000 to $12,499 | 99 (6.5%) | 57 (3.7%) |
| $12,500 to $14,999 | 70 (4.6%) | 28 (1.8%) |
| $15,000 to $17,499 | 88 (5.8%) | 154 (9.9%) |
| $17,500 to $19,999 | 121 (7.9%) | 88 (5.7%) |
| $20,000 to $22,499 | 61 (4.0%) | 129 (8.3%) |
| $22,500 to $24,999 | 104 (6.8%) | 86 (5.5%) |
| $25,000 to $29,999 | 24 (1.6%) | 89 (5.7%) |
| $30,000 to $34,999 | 118 (7.7%) | 142 (9.1%) |
| $35,000 to $39,999 | 76 (5.0%) | 112 (7.2%) |
| $40,000 to $44,999 | 54 (3.5%) | 30 (1.9%) |
| $45,000 to $49,999 | 26 (1.7%) | 58 (3.7%) |
| $50,000 to $54,999 | 49 (3.2%) | 60 (3.8%) |
| $55,000 to $64,999 | 110 (7.2%) | 41 (2.6%) |
| $65,000 to $74,999 | 87 (5.7%) | 41 (2.6%) |
| $75,000 to $99,999 | 96 (6.3%) | 22 (1.4%) |
| $100,000+ | 136 (8.9%) | 24 (1.5%) |
| Total | 1,528 (100.0%) | 1,558 (100.0%) |
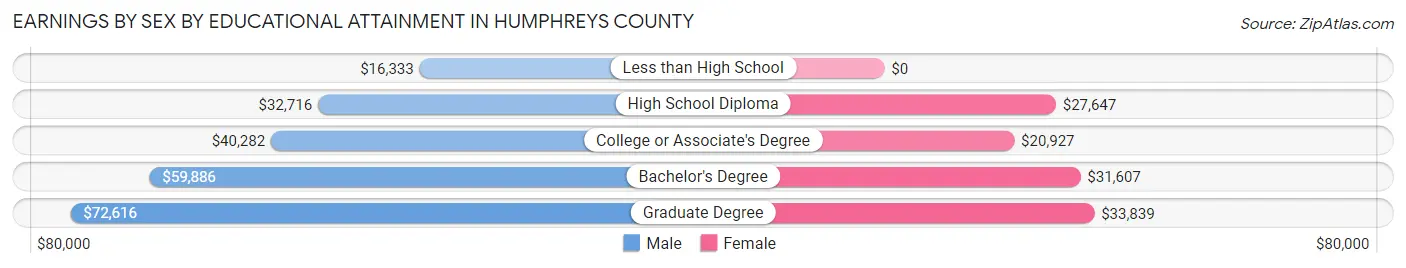
Earnings by Sex by Educational Attainment in Humphreys County
Average earnings in Humphreys County are $32,912 for men and $22,161 for women, a difference of 32.7%. Men with an educational attainment of graduate degree enjoy the highest average annual earnings of $72,616, while those with less than high school education earn the least with $16,333. Women with an educational attainment of graduate degree earn the most with the average annual earnings of $33,839, while those with college or associate's degree education have the smallest earnings of $20,927.
| Educational Attainment | Male Income | Female Income |
| Less than High School | $16,333 | $0 |
| High School Diploma | $32,716 | $27,647 |
| College or Associate's Degree | $40,282 | $20,927 |
| Bachelor's Degree | $59,886 | $31,607 |
| Graduate Degree | $72,616 | $33,839 |
| Total | $32,912 | $22,161 |
Family Income in Humphreys County
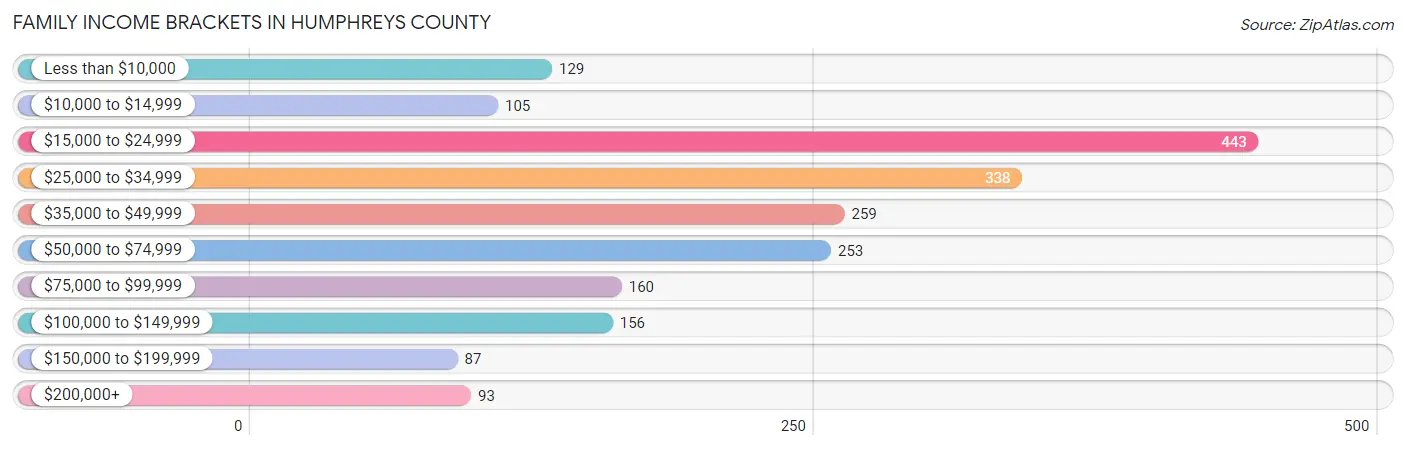
Family Income Brackets in Humphreys County
According to the Humphreys County family income data, there are 443 families falling into the $15,000 to $24,999 income range, which is the most common income bracket and makes up 21.9% of all families. Conversely, the $150,000 to $199,999 income bracket is the least frequent group with only 87 families (4.3%) belonging to this category.
| Income Bracket | # Families | % Families |
| Less than $10,000 | 129 | 6.4% |
| $10,000 to $14,999 | 105 | 5.2% |
| $15,000 to $24,999 | 443 | 21.9% |
| $25,000 to $34,999 | 338 | 16.7% |
| $35,000 to $49,999 | 259 | 12.8% |
| $50,000 to $74,999 | 253 | 12.5% |
| $75,000 to $99,999 | 160 | 7.9% |
| $100,000 to $149,999 | 156 | 7.7% |
| $150,000 to $199,999 | 87 | 4.3% |
| $200,000+ | 93 | 4.6% |
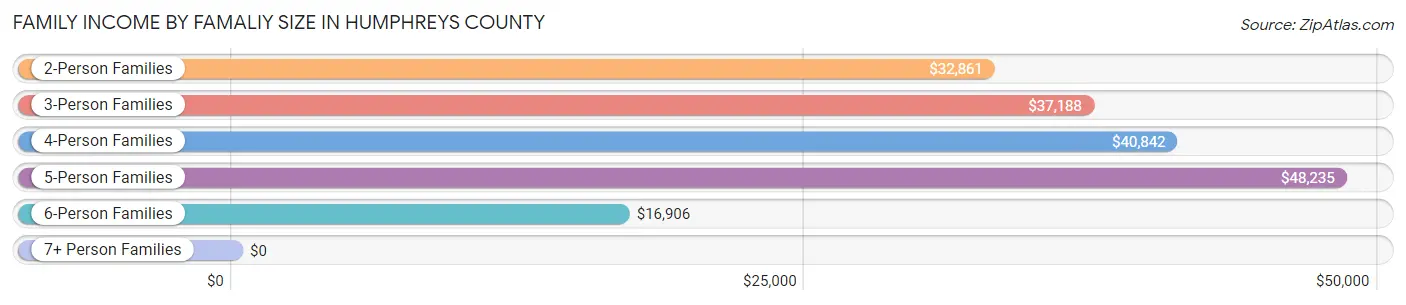
Family Income by Famaliy Size in Humphreys County
5-person families (104 | 5.1%) account for the highest median family income in Humphreys County with $48,235 per family, while 2-person families (1,221 | 60.4%) have the highest median income of $16,430 per family member.
| Income Bracket | # Families | Median Income |
| 2-Person Families | 1,221 (60.4%) | $32,861 |
| 3-Person Families | 328 (16.2%) | $37,188 |
| 4-Person Families | 289 (14.3%) | $40,842 |
| 5-Person Families | 104 (5.1%) | $48,235 |
| 6-Person Families | 61 (3.0%) | $16,906 |
| 7+ Person Families | 19 (0.9%) | $0 |
| Total | 2,022 (100.0%) | $34,909 |
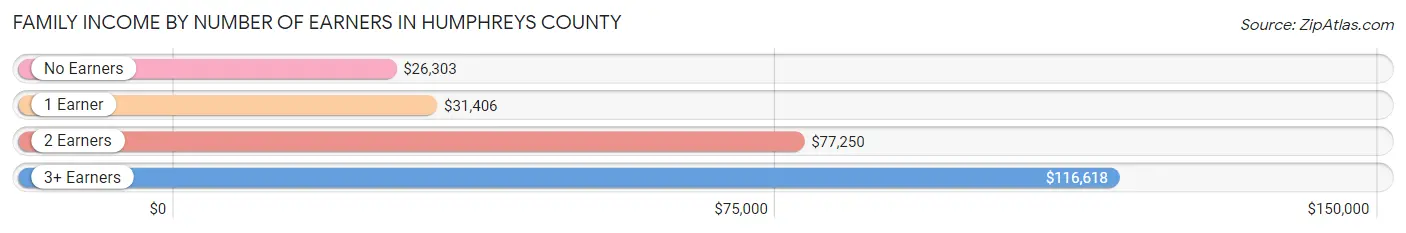
Family Income by Number of Earners in Humphreys County
The median family income in Humphreys County is $34,909, with families comprising 3+ earners (86) having the highest median family income of $116,618, while families with no earners (391) have the lowest median family income of $26,303, accounting for 4.3% and 19.3% of families, respectively.
| Number of Earners | # Families | Median Income |
| No Earners | 391 (19.3%) | $26,303 |
| 1 Earner | 1,064 (52.6%) | $31,406 |
| 2 Earners | 481 (23.8%) | $77,250 |
| 3+ Earners | 86 (4.3%) | $116,618 |
| Total | 2,022 (100.0%) | $34,909 |
Household Income in Humphreys County
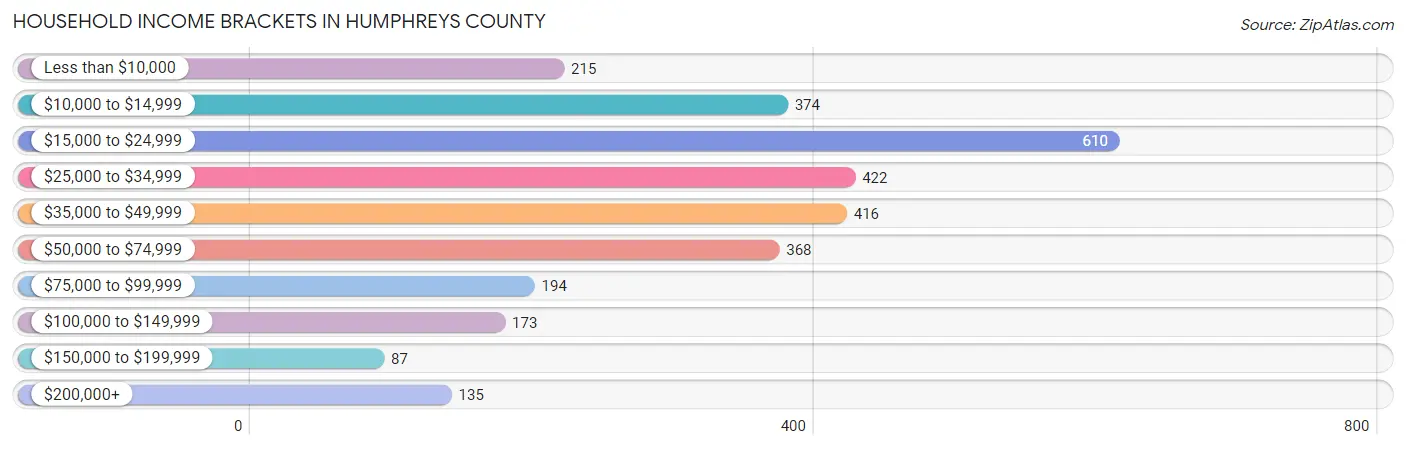
Household Income Brackets in Humphreys County
With 610 households falling in the category, the $15,000 to $24,999 income range is the most frequent in Humphreys County, accounting for 20.4% of all households. In contrast, only 87 households (2.9%) fall into the $150,000 to $199,999 income bracket, making it the least populous group.
| Income Bracket | # Households | % Households |
| Less than $10,000 | 215 | 7.2% |
| $10,000 to $14,999 | 374 | 12.5% |
| $15,000 to $24,999 | 610 | 20.4% |
| $25,000 to $34,999 | 422 | 14.1% |
| $35,000 to $49,999 | 416 | 13.9% |
| $50,000 to $74,999 | 368 | 12.3% |
| $75,000 to $99,999 | 194 | 6.5% |
| $100,000 to $149,999 | 173 | 5.8% |
| $150,000 to $199,999 | 87 | 2.9% |
| $200,000+ | 135 | 4.5% |
Household Income by Householder Age in Humphreys County
The median household income in Humphreys County is $31,907, with the highest median household income of $33,920 found in the 45 to 64 years age bracket for the primary householder. A total of 1,218 households (40.7%) fall into this category. Meanwhile, the 15 to 24 years age bracket for the primary householder has the lowest median household income of $0, with 16 households (0.5%) in this group.
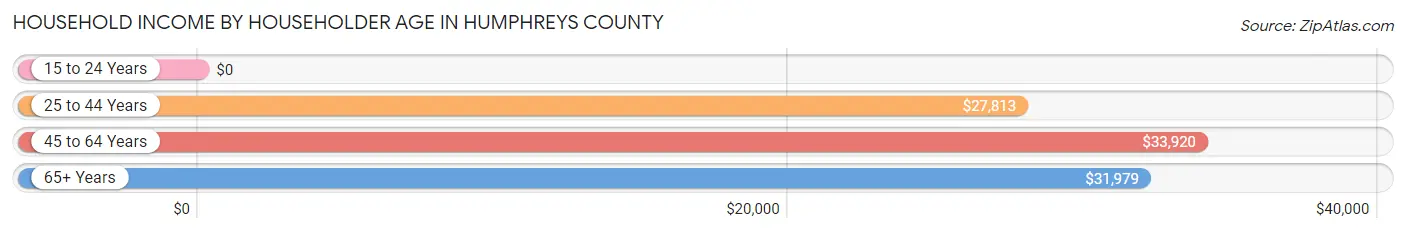
| Income Bracket | # Households | Median Income |
| 15 to 24 Years | 16 (0.5%) | $0 |
| 25 to 44 Years | 857 (28.6%) | $27,813 |
| 45 to 64 Years | 1,218 (40.7%) | $33,920 |
| 65+ Years | 900 (30.1%) | $31,979 |
| Total | 2,991 (100.0%) | $31,907 |
Poverty in Humphreys County
Income Below Poverty by Sex and Age in Humphreys County
With 28.7% poverty level for males and 34.8% for females among the residents of Humphreys County, 5 year old males and 16 and 17 year old females are the most vulnerable to poverty, with 68 males (100.0%) and 155 females (83.3%) in their respective age groups living below the poverty level.
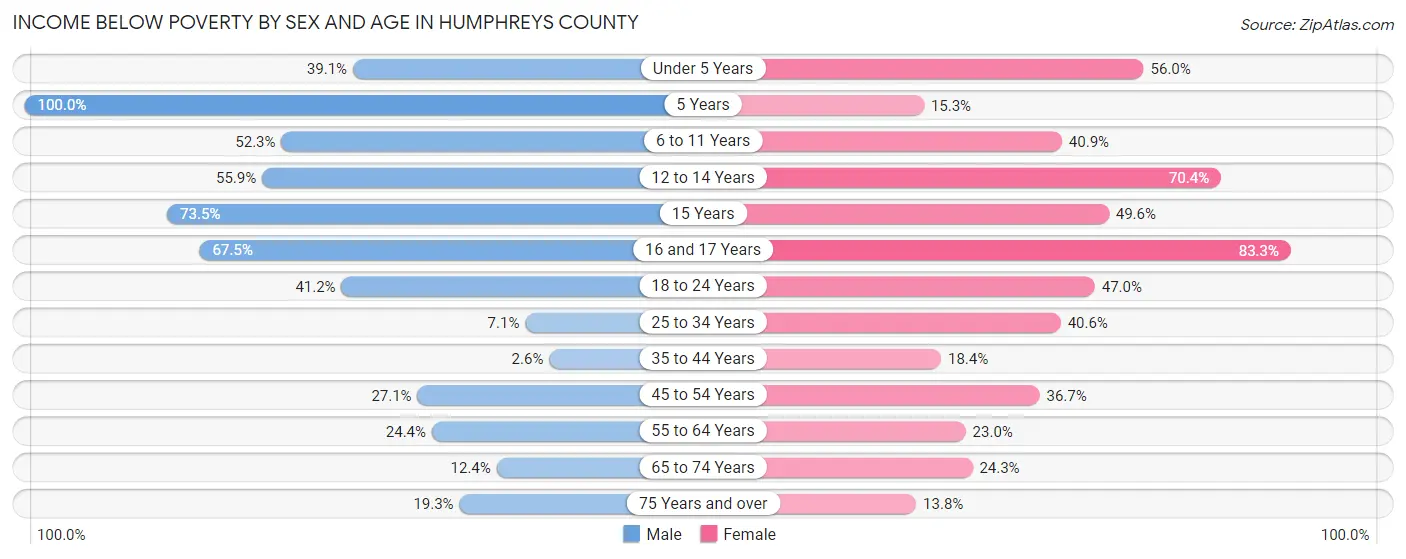
| Age Bracket | Male | Female |
| Under 5 Years | 75 (39.1%) | 121 (56.0%) |
| 5 Years | 68 (100.0%) | 9 (15.2%) |
| 6 to 11 Years | 246 (52.3%) | 152 (40.9%) |
| 12 to 14 Years | 33 (55.9%) | 107 (70.4%) |
| 15 Years | 25 (73.5%) | 56 (49.6%) |
| 16 and 17 Years | 52 (67.5%) | 155 (83.3%) |
| 18 to 24 Years | 145 (41.2%) | 139 (47.0%) |
| 25 to 34 Years | 27 (7.1%) | 141 (40.6%) |
| 35 to 44 Years | 10 (2.6%) | 110 (18.4%) |
| 45 to 54 Years | 114 (27.1%) | 178 (36.7%) |
| 55 to 64 Years | 124 (24.4%) | 137 (23.0%) |
| 65 to 74 Years | 41 (12.4%) | 105 (24.2%) |
| 75 Years and over | 38 (19.3%) | 45 (13.8%) |
| Total | 998 (28.7%) | 1,455 (34.8%) |
Income Above Poverty by Sex and Age in Humphreys County
According to the poverty statistics in Humphreys County, males aged 35 to 44 years and females aged 75 years and over are the age groups that are most secure financially, with 97.4% of males and 86.2% of females in these age groups living above the poverty line.
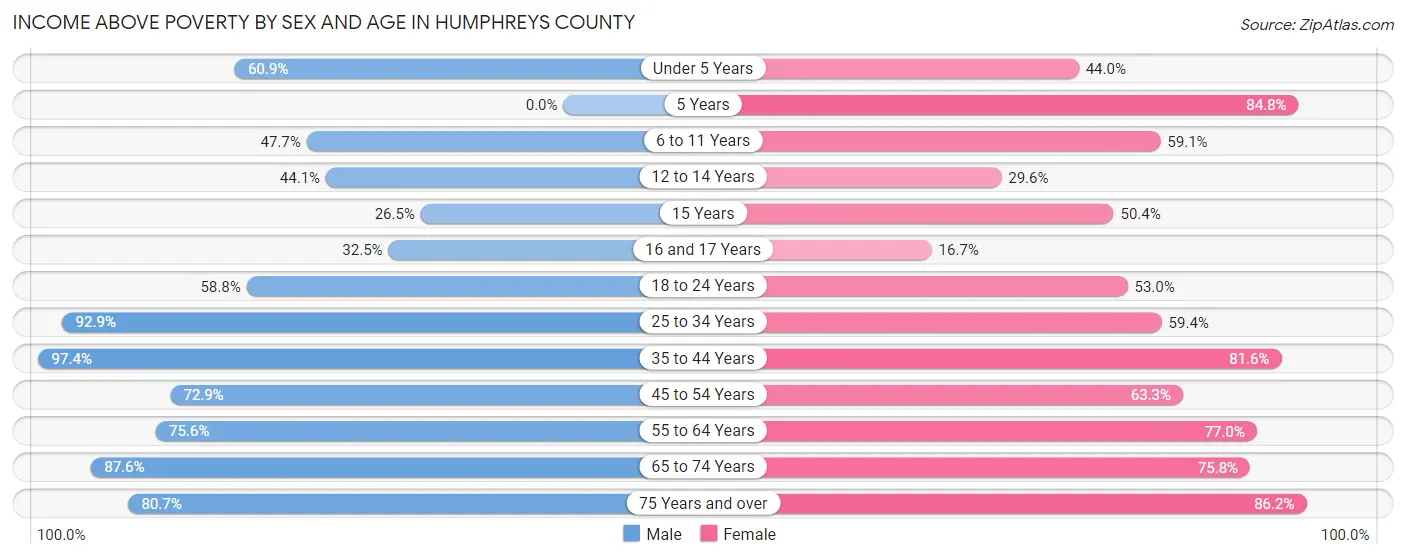
| Age Bracket | Male | Female |
| Under 5 Years | 117 (60.9%) | 95 (44.0%) |
| 5 Years | 0 (0.0%) | 50 (84.8%) |
| 6 to 11 Years | 224 (47.7%) | 220 (59.1%) |
| 12 to 14 Years | 26 (44.1%) | 45 (29.6%) |
| 15 Years | 9 (26.5%) | 57 (50.4%) |
| 16 and 17 Years | 25 (32.5%) | 31 (16.7%) |
| 18 to 24 Years | 207 (58.8%) | 157 (53.0%) |
| 25 to 34 Years | 355 (92.9%) | 206 (59.4%) |
| 35 to 44 Years | 372 (97.4%) | 487 (81.6%) |
| 45 to 54 Years | 307 (72.9%) | 307 (63.3%) |
| 55 to 64 Years | 384 (75.6%) | 459 (77.0%) |
| 65 to 74 Years | 290 (87.6%) | 328 (75.7%) |
| 75 Years and over | 159 (80.7%) | 281 (86.2%) |
| Total | 2,475 (71.3%) | 2,723 (65.2%) |
Income Below Poverty Among Married-Couple Families in Humphreys County
The poverty statistics for married-couple families in Humphreys County show that 5.2% or 38 of the total 731 families live below the poverty line. Families with no children have the highest poverty rate of 7.2%, comprising of 38 families. On the other hand, families with 1 or 2 children have the lowest poverty rate of 0.0%, which includes 0 families.
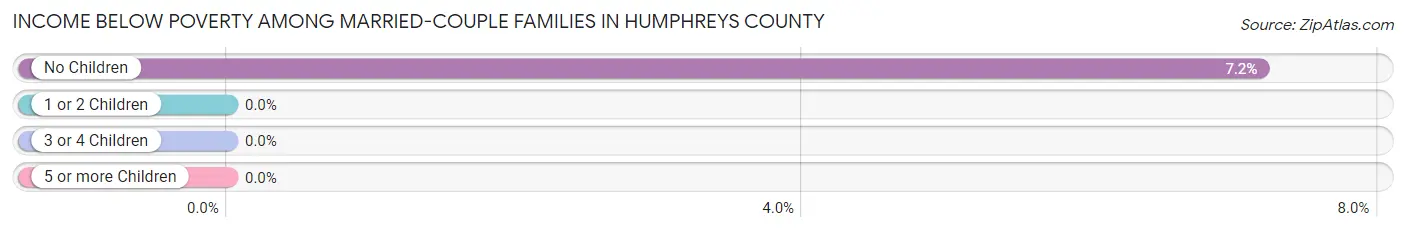
| Children | Above Poverty | Below Poverty |
| No Children | 491 (92.8%) | 38 (7.2%) |
| 1 or 2 Children | 191 (100.0%) | 0 (0.0%) |
| 3 or 4 Children | 11 (100.0%) | 0 (0.0%) |
| 5 or more Children | 0 (0.0%) | 0 (0.0%) |
| Total | 693 (94.8%) | 38 (5.2%) |
Income Below Poverty Among Single-Parent Households in Humphreys County
According to the poverty data in Humphreys County, 10.1% or 21 single-father households and 35.7% or 386 single-mother households are living below the poverty line. Among single-father households, those with 3 or 4 children have the highest poverty rate, with 15 households (100.0%) experiencing poverty. Likewise, among single-mother households, those with 5 or more children have the highest poverty rate, with 40 households (100.0%) falling below the poverty line.
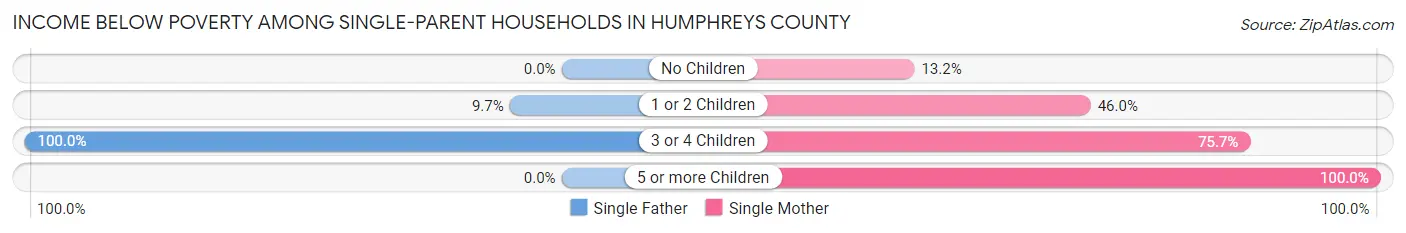
| Children | Single Father | Single Mother |
| No Children | 0 (0.0%) | 62 (13.2%) |
| 1 or 2 Children | 6 (9.7%) | 231 (46.0%) |
| 3 or 4 Children | 15 (100.0%) | 53 (75.7%) |
| 5 or more Children | 0 (0.0%) | 40 (100.0%) |
| Total | 21 (10.1%) | 386 (35.7%) |
Income Below Poverty Among Married-Couple vs Single-Parent Households in Humphreys County
The poverty data for Humphreys County shows that 38 of the married-couple family households (5.2%) and 407 of the single-parent households (31.5%) are living below the poverty level. Within the married-couple family households, those with no children have the highest poverty rate, with 38 households (7.2%) falling below the poverty line. Among the single-parent households, those with 5 or more children have the highest poverty rate, with 40 household (100.0%) living below poverty.
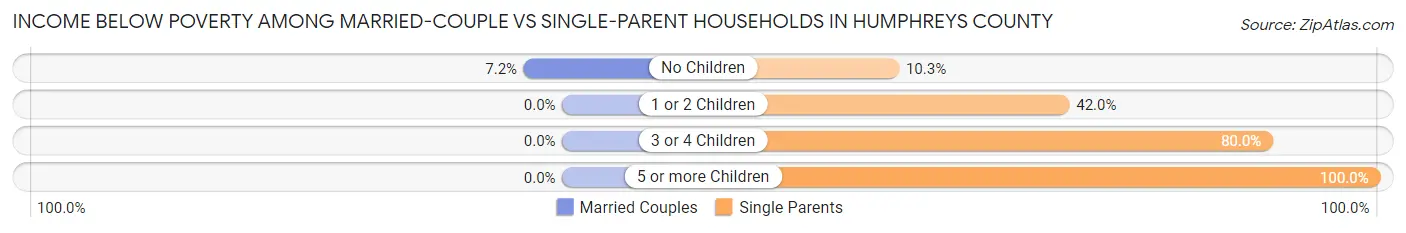
| Children | Married-Couple Families | Single-Parent Households |
| No Children | 38 (7.2%) | 62 (10.3%) |
| 1 or 2 Children | 0 (0.0%) | 237 (42.0%) |
| 3 or 4 Children | 0 (0.0%) | 68 (80.0%) |
| 5 or more Children | 0 (0.0%) | 40 (100.0%) |
| Total | 38 (5.2%) | 407 (31.5%) |
Race in Humphreys County
The most populous races in Humphreys County are Black / African American (6,103 | 78.8%), White / Caucasian (1,547 | 20.0%), and Two or more Races (52 | 0.7%).
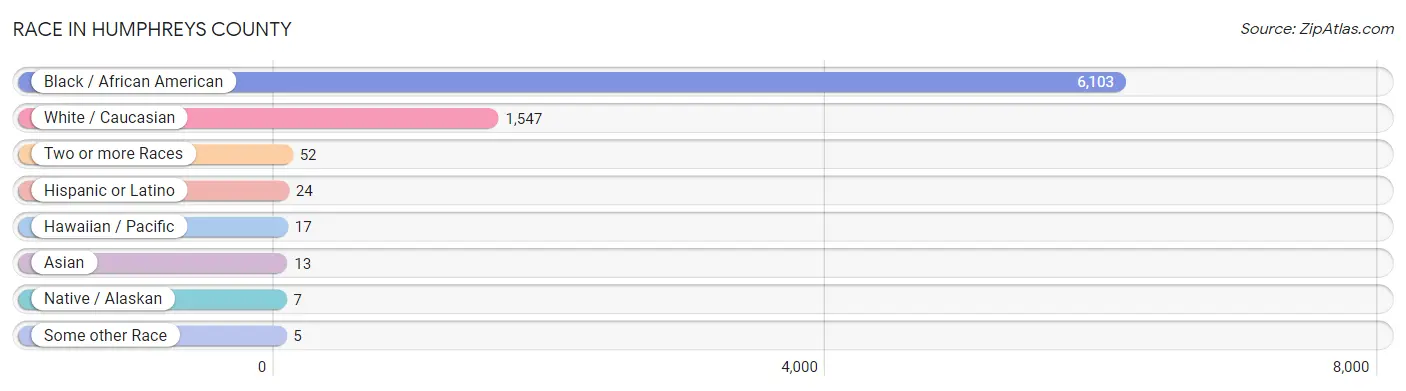
| Race | # Population | % Population |
| Asian | 13 | 0.2% |
| Black / African American | 6,103 | 78.8% |
| Hawaiian / Pacific | 17 | 0.2% |
| Hispanic or Latino | 24 | 0.3% |
| Native / Alaskan | 7 | 0.1% |
| White / Caucasian | 1,547 | 20.0% |
| Two or more Races | 52 | 0.7% |
| Some other Race | 5 | 0.1% |
| Total | 7,744 | 100.0% |
Ancestry in Humphreys County
The most populous ancestries reported in Humphreys County are English (325 | 4.2%), Irish (267 | 3.5%), American (232 | 3.0%), African (130 | 1.7%), and Subsaharan African (130 | 1.7%), together accounting for 14.0% of all Humphreys County residents.
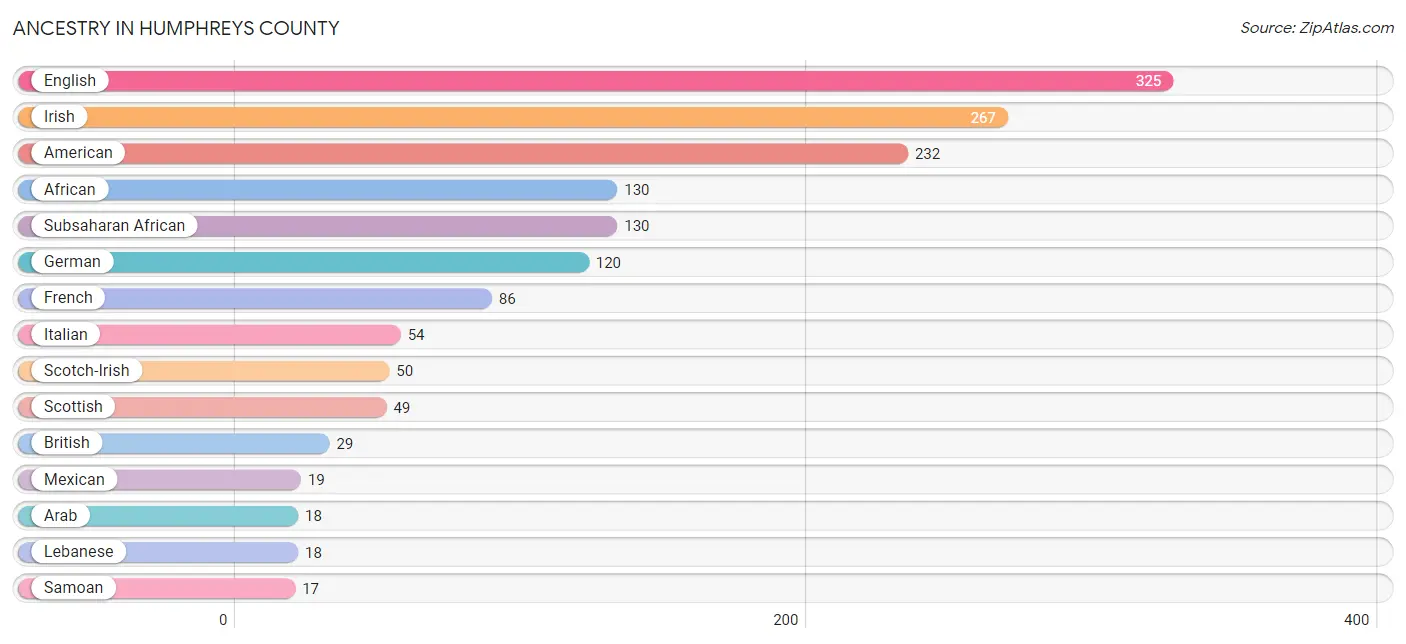
| Ancestry | # Population | % Population |
| African | 130 | 1.7% |
| American | 232 | 3.0% |
| Arab | 18 | 0.2% |
| British | 29 | 0.4% |
| Canadian | 11 | 0.1% |
| Choctaw | 7 | 0.1% |
| Croatian | 11 | 0.1% |
| Dutch | 1 | 0.0% |
| Eastern European | 1 | 0.0% |
| English | 325 | 4.2% |
| French | 86 | 1.1% |
| German | 120 | 1.5% |
| Irish | 267 | 3.5% |
| Italian | 54 | 0.7% |
| Lebanese | 18 | 0.2% |
| Mexican | 19 | 0.3% |
| Samoan | 17 | 0.2% |
| Scotch-Irish | 50 | 0.6% |
| Scottish | 49 | 0.6% |
| Subsaharan African | 130 | 1.7% |
| Swedish | 1 | 0.0% |
| Thai | 13 | 0.2% |
| Welsh | 5 | 0.1% | View All 23 Rows |
Immigrants in Humphreys County
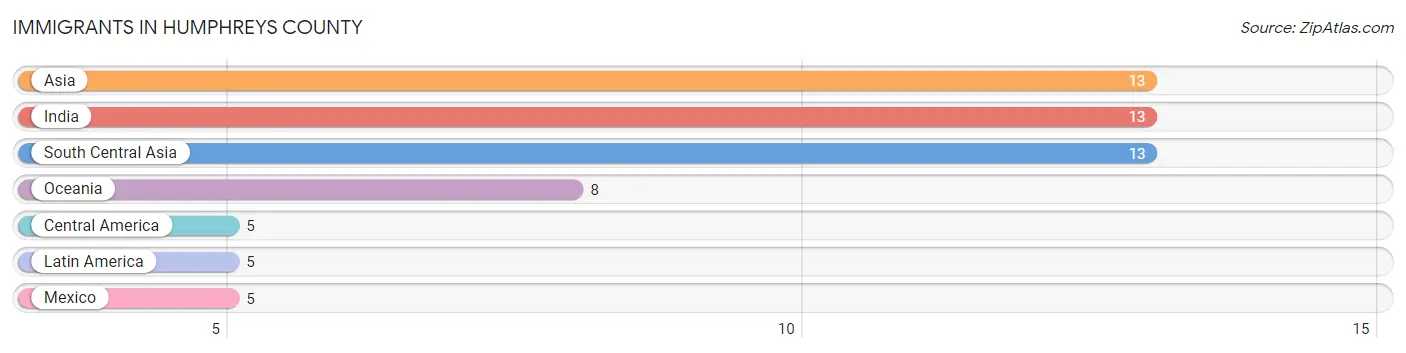
The most numerous immigrant groups reported in Humphreys County came from Asia (13 | 0.2%), India (13 | 0.2%), South Central Asia (13 | 0.2%), Oceania (8 | 0.1%), and Central America (5 | 0.1%), together accounting for 0.7% of all Humphreys County residents.
| Immigration Origin | # Population | % Population |
| Asia | 13 | 0.2% |
| Central America | 5 | 0.1% |
| India | 13 | 0.2% |
| Latin America | 5 | 0.1% |
| Mexico | 5 | 0.1% |
| Oceania | 8 | 0.1% |
| South Central Asia | 13 | 0.2% | View All 7 Rows |
Sex and Age in Humphreys County
Sex and Age in Humphreys County
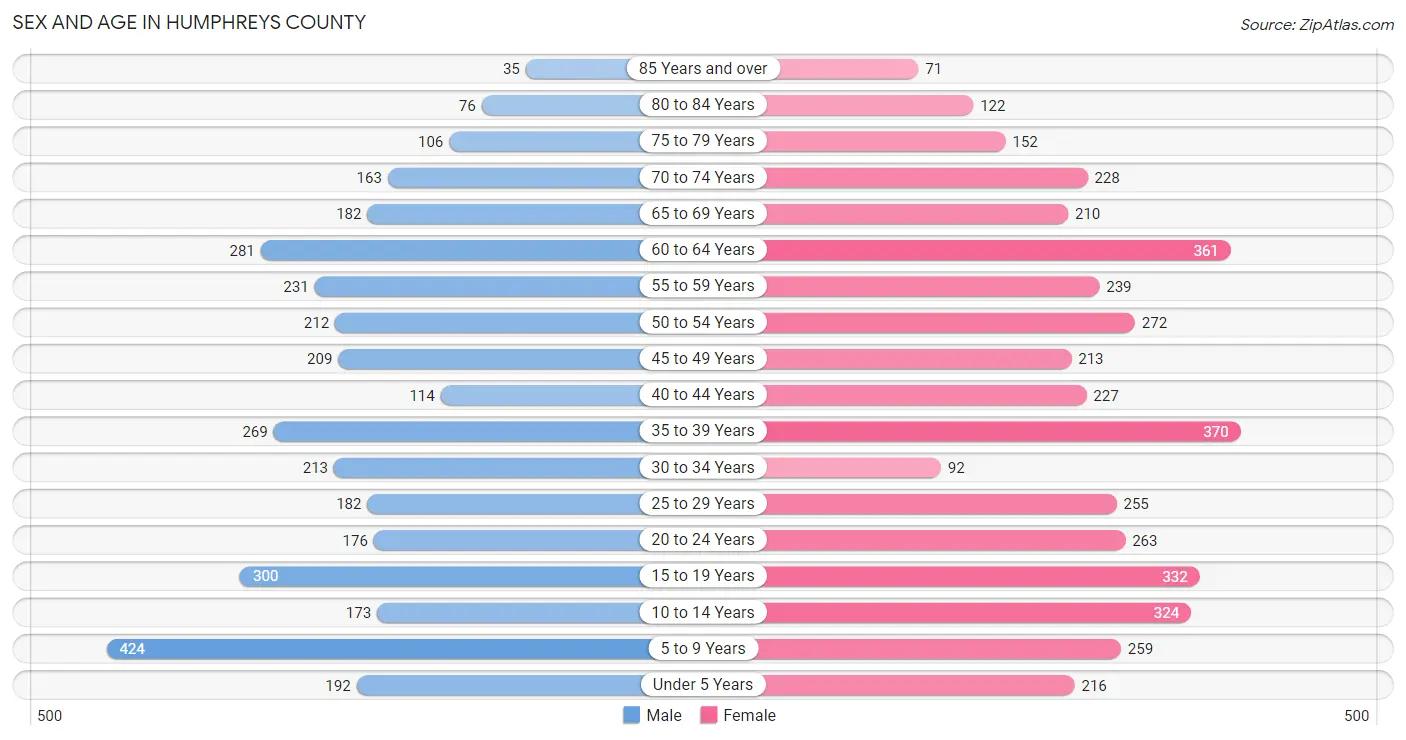
The most populous age groups in Humphreys County are 5 to 9 Years (424 | 12.0%) for men and 35 to 39 Years (370 | 8.8%) for women.
| Age Bracket | Male | Female |
| Under 5 Years | 192 (5.4%) | 216 (5.1%) |
| 5 to 9 Years | 424 (12.0%) | 259 (6.2%) |
| 10 to 14 Years | 173 (4.9%) | 324 (7.7%) |
| 15 to 19 Years | 300 (8.5%) | 332 (7.9%) |
| 20 to 24 Years | 176 (5.0%) | 263 (6.2%) |
| 25 to 29 Years | 182 (5.1%) | 255 (6.1%) |
| 30 to 34 Years | 213 (6.0%) | 92 (2.2%) |
| 35 to 39 Years | 269 (7.6%) | 370 (8.8%) |
| 40 to 44 Years | 114 (3.2%) | 227 (5.4%) |
| 45 to 49 Years | 209 (5.9%) | 213 (5.1%) |
| 50 to 54 Years | 212 (6.0%) | 272 (6.5%) |
| 55 to 59 Years | 231 (6.5%) | 239 (5.7%) |
| 60 to 64 Years | 281 (7.9%) | 361 (8.6%) |
| 65 to 69 Years | 182 (5.1%) | 210 (5.0%) |
| 70 to 74 Years | 163 (4.6%) | 228 (5.4%) |
| 75 to 79 Years | 106 (3.0%) | 152 (3.6%) |
| 80 to 84 Years | 76 (2.1%) | 122 (2.9%) |
| 85 Years and over | 35 (1.0%) | 71 (1.7%) |
| Total | 3,538 (100.0%) | 4,206 (100.0%) |
Families and Households in Humphreys County
Median Family Size in Humphreys County
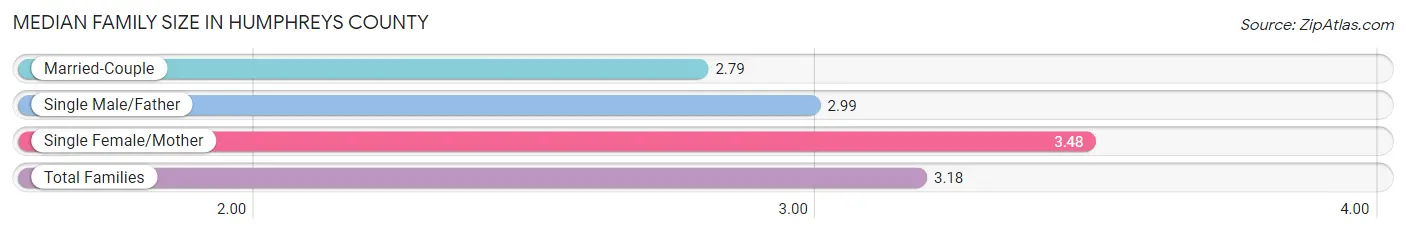
The median family size in Humphreys County is 3.18 persons per family, with single female/mother families (1,082 | 53.5%) accounting for the largest median family size of 3.48 persons per family. On the other hand, married-couple families (731 | 36.1%) represent the smallest median family size with 2.79 persons per family.
| Family Type | # Families | Family Size |
| Married-Couple | 731 (36.1%) | 2.79 |
| Single Male/Father | 209 (10.3%) | 2.99 |
| Single Female/Mother | 1,082 (53.5%) | 3.48 |
| Total Families | 2,022 (100.0%) | 3.18 |
Median Household Size in Humphreys County
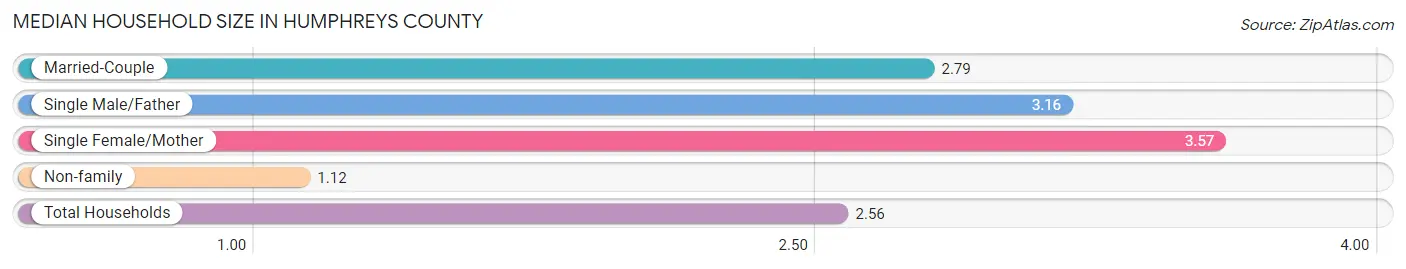
The median household size in Humphreys County is 2.56 persons per household, with single female/mother households (1,082 | 36.2%) accounting for the largest median household size of 3.57 persons per household. non-family households (969 | 32.4%) represent the smallest median household size with 1.12 persons per household.
| Household Type | # Households | Household Size |
| Married-Couple | 731 (24.4%) | 2.79 |
| Single Male/Father | 209 (7.0%) | 3.16 |
| Single Female/Mother | 1,082 (36.2%) | 3.57 |
| Non-family | 969 (32.4%) | 1.12 |
| Total Households | 2,991 (100.0%) | 2.56 |
Household Size by Marriage Status in Humphreys County
Out of a total of 2,991 households in Humphreys County, 2,022 (67.6%) are family households, while 969 (32.4%) are nonfamily households. The most numerous type of family households are 2-person households, comprising 1,141, and the most common type of nonfamily households are 1-person households, comprising 871.
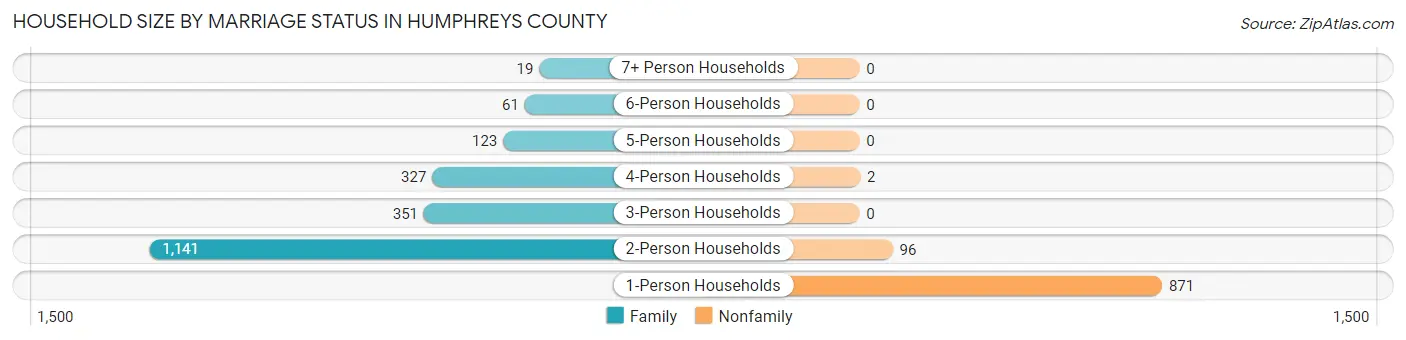
| Household Size | Family Households | Nonfamily Households |
| 1-Person Households | - | 871 (29.1%) |
| 2-Person Households | 1,141 (38.2%) | 96 (3.2%) |
| 3-Person Households | 351 (11.7%) | 0 (0.0%) |
| 4-Person Households | 327 (10.9%) | 2 (0.1%) |
| 5-Person Households | 123 (4.1%) | 0 (0.0%) |
| 6-Person Households | 61 (2.0%) | 0 (0.0%) |
| 7+ Person Households | 19 (0.6%) | 0 (0.0%) |
| Total | 2,022 (67.6%) | 969 (32.4%) |
Female Fertility in Humphreys County
Fertility by Age in Humphreys County
Average fertility rate in Humphreys County is 35.0 births per 1,000 women. Women in the age bracket of 35 to 50 years have the highest fertility rate with 70.0 births per 1,000 women. Women in the age bracket of 35 to 50 years acount for 95.2% of all women with births.
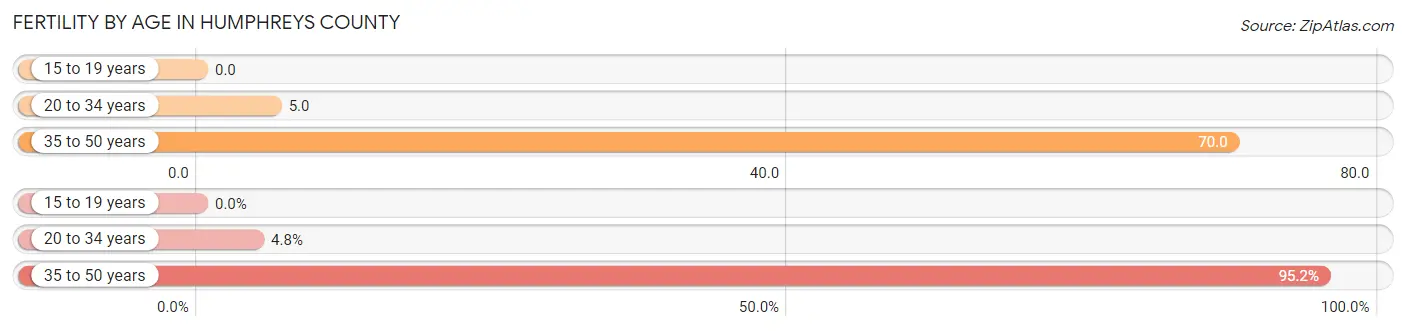
| Age Bracket | Women with Births | Births / 1,000 Women |
| 15 to 19 years | 0 (0.0%) | 0.0 |
| 20 to 34 years | 3 (4.8%) | 5.0 |
| 35 to 50 years | 60 (95.2%) | 70.0 |
| Total | 63 (100.0%) | 35.0 |
Fertility by Age by Marriage Status in Humphreys County
4.8% of women with births (63) in Humphreys County are married. The highest percentage of unmarried women with births falls into 20 to 34 years age bracket with 100.0% of them unmarried at the time of birth, while the lowest percentage of unmarried women with births belong to 35 to 50 years age bracket with 95.0% of them unmarried.
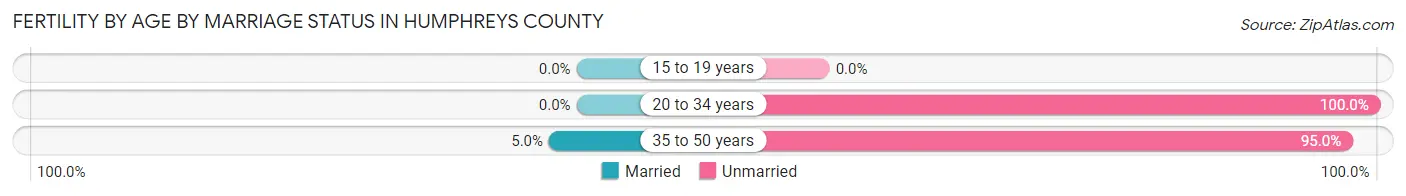
| Age Bracket | Married | Unmarried |
| 15 to 19 years | 0 (0.0%) | 0 (0.0%) |
| 20 to 34 years | 0 (0.0%) | 3 (100.0%) |
| 35 to 50 years | 3 (5.0%) | 57 (95.0%) |
| Total | 3 (4.8%) | 60 (95.2%) |
Fertility by Education in Humphreys County
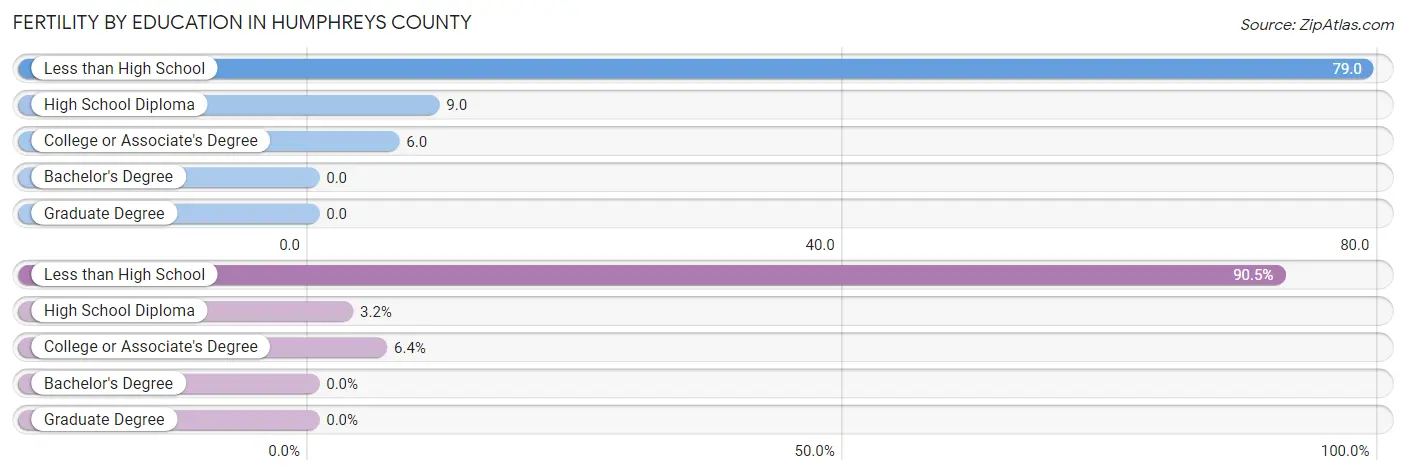
| Educational Attainment | Women with Births | Births / 1,000 Women |
| Less than High School | 57 (90.5%) | 79.0 |
| High School Diploma | 2 (3.2%) | 9.0 |
| College or Associate's Degree | 4 (6.4%) | 6.0 |
| Bachelor's Degree | 0 (0.0%) | 0.0 |
| Graduate Degree | 0 (0.0%) | 0.0 |
| Total | 63 (100.0%) | 35.0 |
Fertility by Education by Marriage Status in Humphreys County
95.2% of women with births in Humphreys County are unmarried. Women with the educational attainment of college or associate's degree are most likely to be married with 75.0% of them married at childbirth, while women with the educational attainment of less than high school are least likely to be married with 100.0% of them unmarried at childbirth.
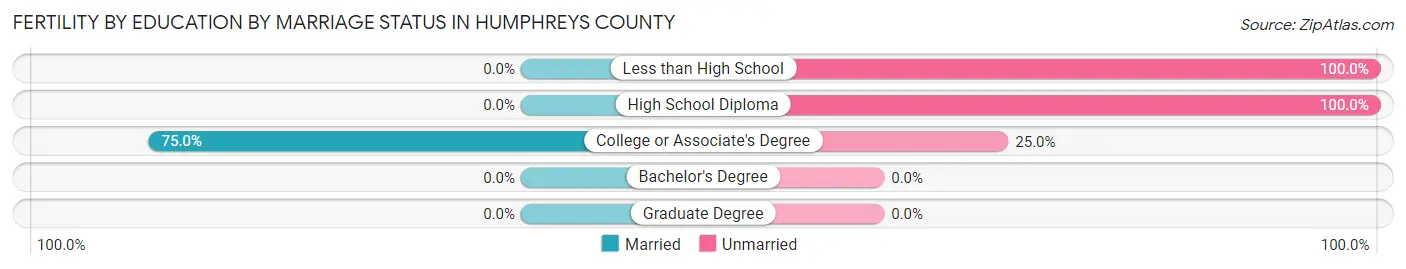
| Educational Attainment | Married | Unmarried |
| Less than High School | 0 (0.0%) | 57 (100.0%) |
| High School Diploma | 0 (0.0%) | 2 (100.0%) |
| College or Associate's Degree | 3 (75.0%) | 1 (25.0%) |
| Bachelor's Degree | 0 (0.0%) | 0 (0.0%) |
| Graduate Degree | 0 (0.0%) | 0 (0.0%) |
| Total | 3 (4.8%) | 60 (95.2%) |
Employment Characteristics in Humphreys County
Employment by Class of Employer in Humphreys County
Among the 2,518 employed individuals in Humphreys County, private company employees (1,568 | 62.3%), state government employees (273 | 10.8%), and federal government employees (200 | 7.9%) make up the most common classes of employment.
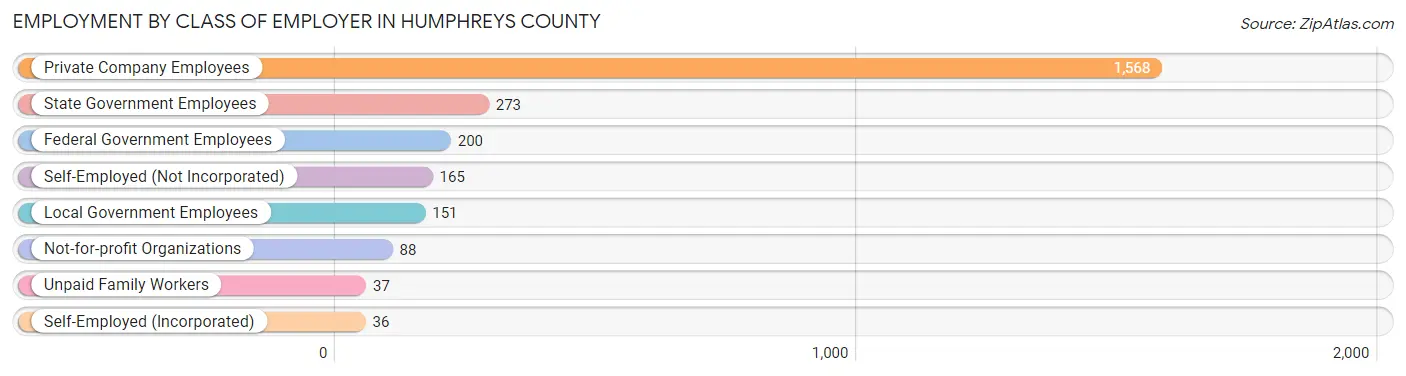
| Employer Class | # Employees | % Employees |
| Private Company Employees | 1,568 | 62.3% |
| Self-Employed (Incorporated) | 36 | 1.4% |
| Self-Employed (Not Incorporated) | 165 | 6.6% |
| Not-for-profit Organizations | 88 | 3.5% |
| Local Government Employees | 151 | 6.0% |
| State Government Employees | 273 | 10.8% |
| Federal Government Employees | 200 | 7.9% |
| Unpaid Family Workers | 37 | 1.5% |
| Total | 2,518 | 100.0% |
Employment Status by Age in Humphreys County
According to the labor force statistics for Humphreys County, out of the total population over 16 years of age (6,009), 49.6% or 2,980 individuals are in the labor force, with 13.7% or 408 of them unemployed. The age group with the highest labor force participation rate is 25 to 29 years, with 90.6% or 396 individuals in the labor force. Within the labor force, the 16 to 19 years age range has the highest percentage of unemployed individuals, with 65.5% or 97 of them being unemployed.
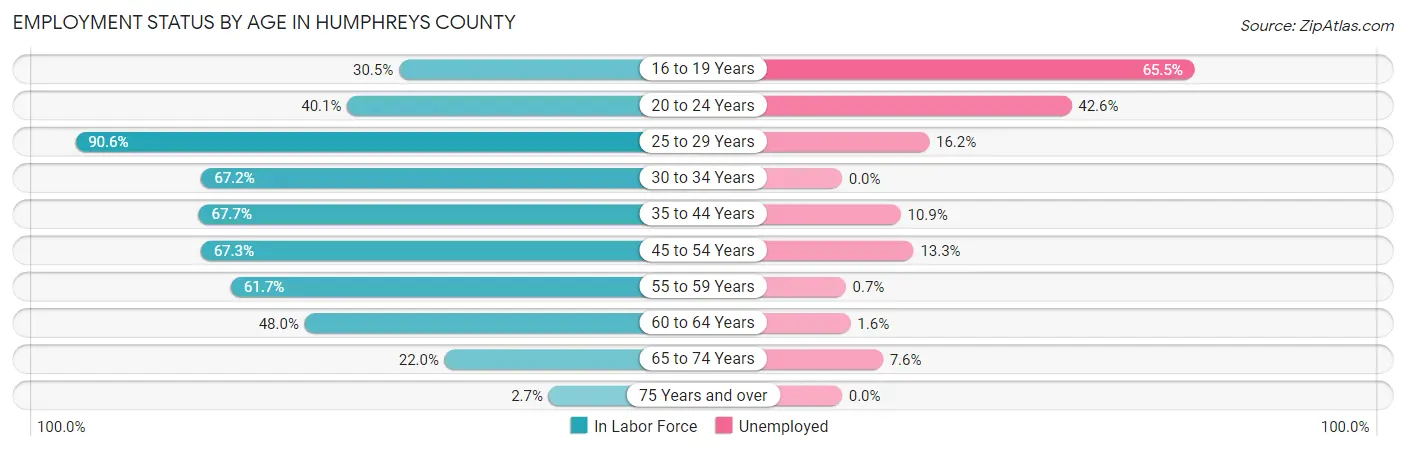
| Age Bracket | In Labor Force | Unemployed |
| 16 to 19 Years | 148 (30.5%) | 97 (65.5%) |
| 20 to 24 Years | 176 (40.1%) | 75 (42.6%) |
| 25 to 29 Years | 396 (90.6%) | 64 (16.2%) |
| 30 to 34 Years | 205 (67.2%) | 0 (0.0%) |
| 35 to 44 Years | 663 (67.7%) | 72 (10.9%) |
| 45 to 54 Years | 610 (67.3%) | 81 (13.3%) |
| 55 to 59 Years | 290 (61.7%) | 2 (0.7%) |
| 60 to 64 Years | 308 (48.0%) | 5 (1.6%) |
| 65 to 74 Years | 172 (22.0%) | 13 (7.6%) |
| 75 Years and over | 15 (2.7%) | 0 (0.0%) |
| Total | 2,980 (49.6%) | 408 (13.7%) |
Employment Status by Educational Attainment in Humphreys County
According to labor force statistics for Humphreys County, 66.1% of individuals (2,472) out of the total population between 25 and 64 years of age (3,740) are in the labor force, with 9.1% or 225 of them being unemployed. The group with the highest labor force participation rate are those with the educational attainment of bachelor's degree or higher, with 90.2% or 495 individuals in the labor force. Within the labor force, individuals with high school diploma education have the highest percentage of unemployment, with 19.3% or 122 of them being unemployed.
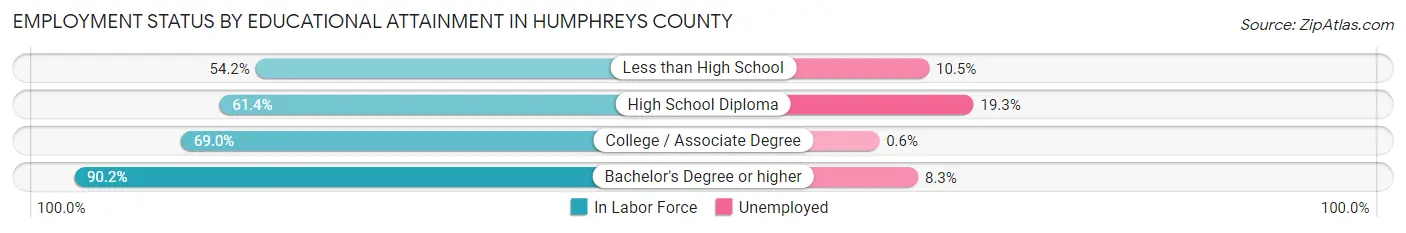
| Educational Attainment | In Labor Force | Unemployed |
| Less than High School | 534 (54.2%) | 103 (10.5%) |
| High School Diploma | 632 (61.4%) | 199 (19.3%) |
| College / Associate Degree | 811 (69.0%) | 7 (0.6%) |
| Bachelor's Degree or higher | 495 (90.2%) | 46 (8.3%) |
| Total | 2,472 (66.1%) | 340 (9.1%) |
Employment Occupations by Sex in Humphreys County
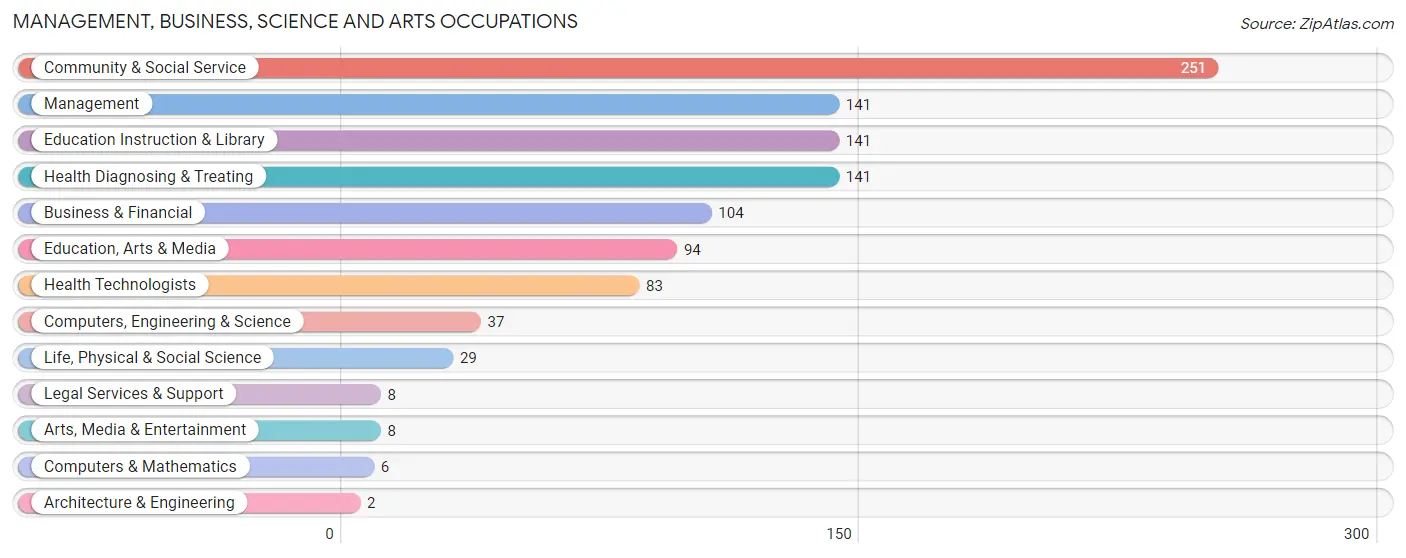
Management, Business, Science and Arts Occupations
The most common Management, Business, Science and Arts occupations in Humphreys County are Community & Social Service (251 | 9.8%), Management (141 | 5.5%), Education Instruction & Library (141 | 5.5%), Health Diagnosing & Treating (141 | 5.5%), and Business & Financial (104 | 4.0%).
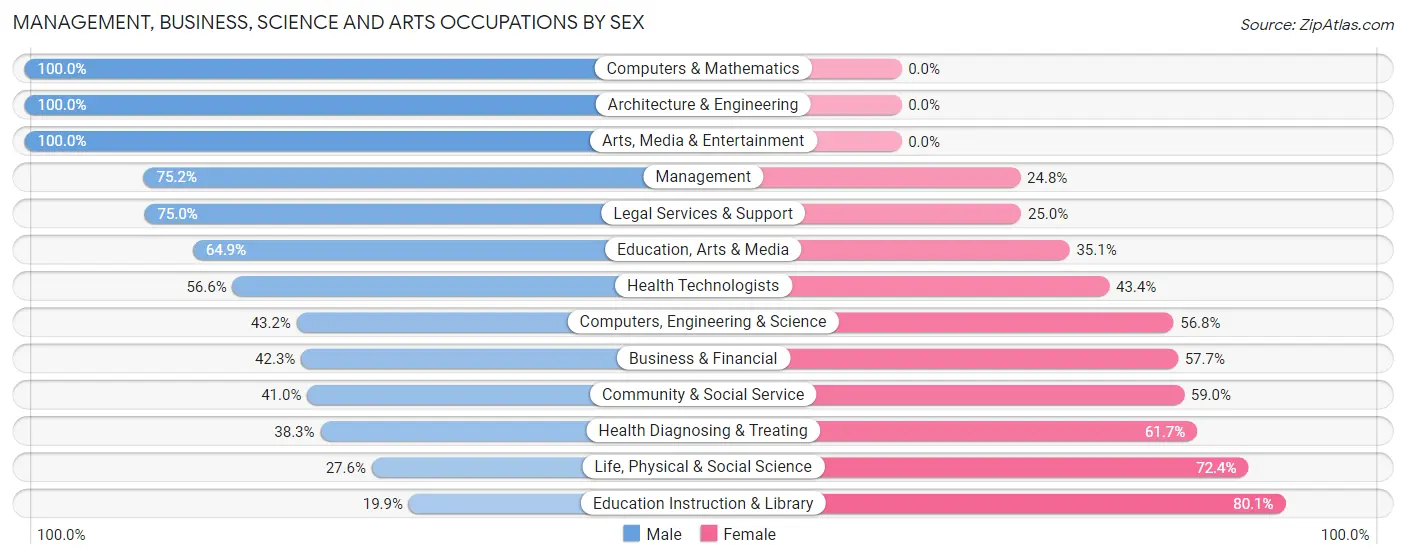
Management, Business, Science and Arts Occupations by Sex
Within the Management, Business, Science and Arts occupations in Humphreys County, the most male-oriented occupations are Computers & Mathematics (100.0%), Architecture & Engineering (100.0%), and Arts, Media & Entertainment (100.0%), while the most female-oriented occupations are Education Instruction & Library (80.1%), Life, Physical & Social Science (72.4%), and Health Diagnosing & Treating (61.7%).
| Occupation | Male | Female |
| Management | 106 (75.2%) | 35 (24.8%) |
| Business & Financial | 44 (42.3%) | 60 (57.7%) |
| Computers, Engineering & Science | 16 (43.2%) | 21 (56.8%) |
| Computers & Mathematics | 6 (100.0%) | 0 (0.0%) |
| Architecture & Engineering | 2 (100.0%) | 0 (0.0%) |
| Life, Physical & Social Science | 8 (27.6%) | 21 (72.4%) |
| Community & Social Service | 103 (41.0%) | 148 (59.0%) |
| Education, Arts & Media | 61 (64.9%) | 33 (35.1%) |
| Legal Services & Support | 6 (75.0%) | 2 (25.0%) |
| Education Instruction & Library | 28 (19.9%) | 113 (80.1%) |
| Arts, Media & Entertainment | 8 (100.0%) | 0 (0.0%) |
| Health Diagnosing & Treating | 54 (38.3%) | 87 (61.7%) |
| Health Technologists | 47 (56.6%) | 36 (43.4%) |
| Total (Category) | 323 (47.9%) | 351 (52.1%) |
| Total (Overall) | 1,247 (48.4%) | 1,327 (51.5%) |
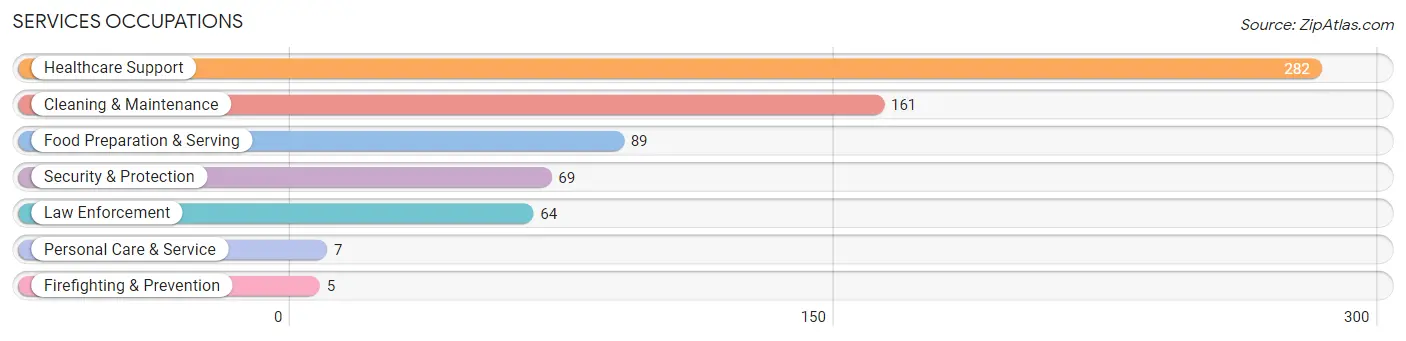
Services Occupations
The most common Services occupations in Humphreys County are Healthcare Support (282 | 11.0%), Cleaning & Maintenance (161 | 6.2%), Food Preparation & Serving (89 | 3.5%), Security & Protection (69 | 2.7%), and Law Enforcement (64 | 2.5%).
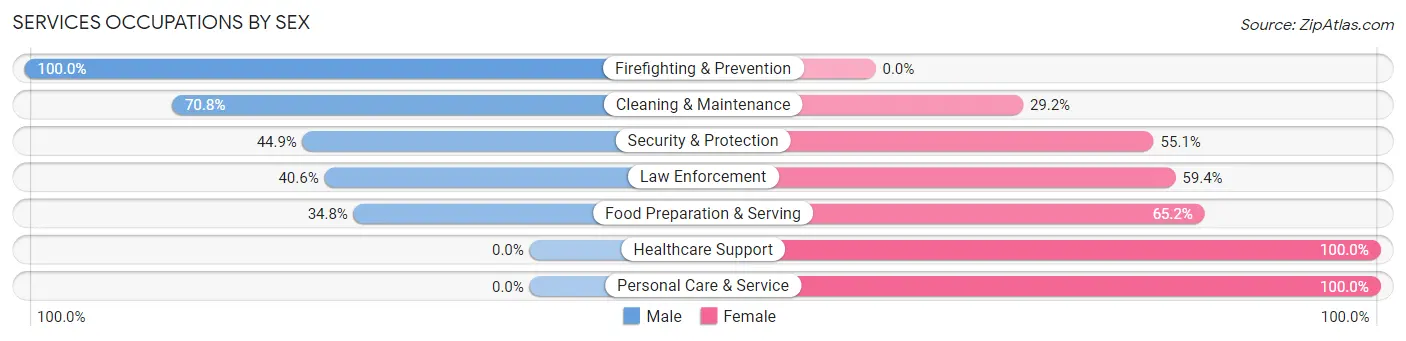
Services Occupations by Sex
Within the Services occupations in Humphreys County, the most male-oriented occupations are Firefighting & Prevention (100.0%), Cleaning & Maintenance (70.8%), and Security & Protection (44.9%), while the most female-oriented occupations are Healthcare Support (100.0%), Personal Care & Service (100.0%), and Food Preparation & Serving (65.2%).
| Occupation | Male | Female |
| Healthcare Support | 0 (0.0%) | 282 (100.0%) |
| Security & Protection | 31 (44.9%) | 38 (55.1%) |
| Firefighting & Prevention | 5 (100.0%) | 0 (0.0%) |
| Law Enforcement | 26 (40.6%) | 38 (59.4%) |
| Food Preparation & Serving | 31 (34.8%) | 58 (65.2%) |
| Cleaning & Maintenance | 114 (70.8%) | 47 (29.2%) |
| Personal Care & Service | 0 (0.0%) | 7 (100.0%) |
| Total (Category) | 176 (28.9%) | 432 (71.1%) |
| Total (Overall) | 1,247 (48.4%) | 1,327 (51.5%) |
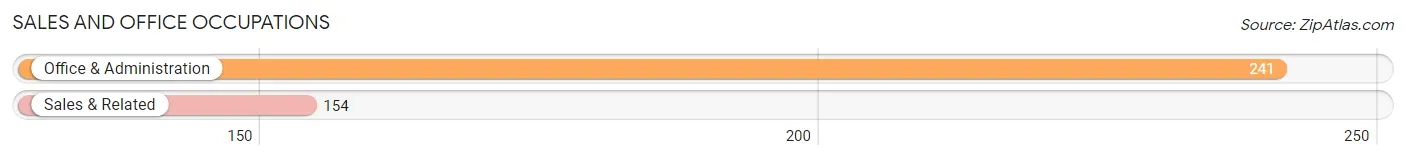
Sales and Office Occupations
The most common Sales and Office occupations in Humphreys County are Office & Administration (241 | 9.4%), and Sales & Related (154 | 6.0%).
Sales and Office Occupations by Sex
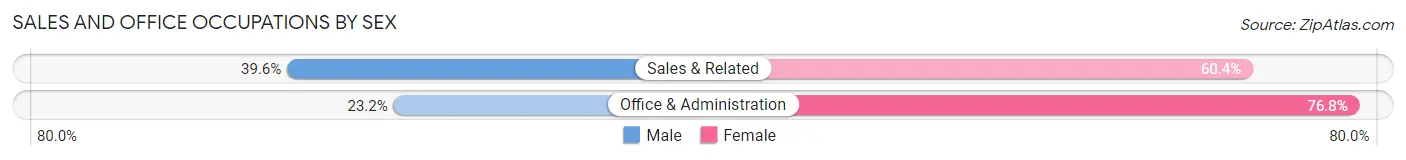
| Occupation | Male | Female |
| Sales & Related | 61 (39.6%) | 93 (60.4%) |
| Office & Administration | 56 (23.2%) | 185 (76.8%) |
| Total (Category) | 117 (29.6%) | 278 (70.4%) |
| Total (Overall) | 1,247 (48.4%) | 1,327 (51.5%) |
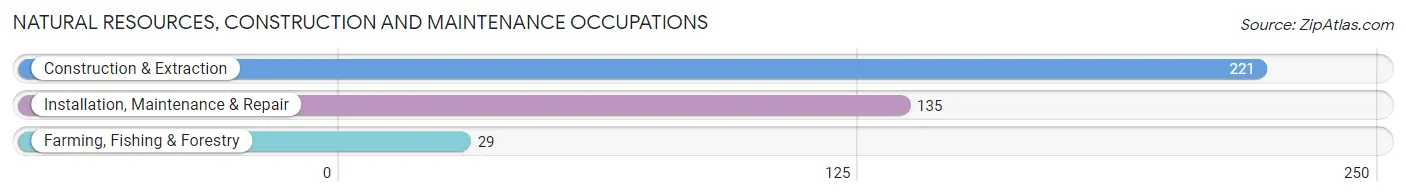
Natural Resources, Construction and Maintenance Occupations
The most common Natural Resources, Construction and Maintenance occupations in Humphreys County are Construction & Extraction (221 | 8.6%), Installation, Maintenance & Repair (135 | 5.2%), and Farming, Fishing & Forestry (29 | 1.1%).
Natural Resources, Construction and Maintenance Occupations by Sex
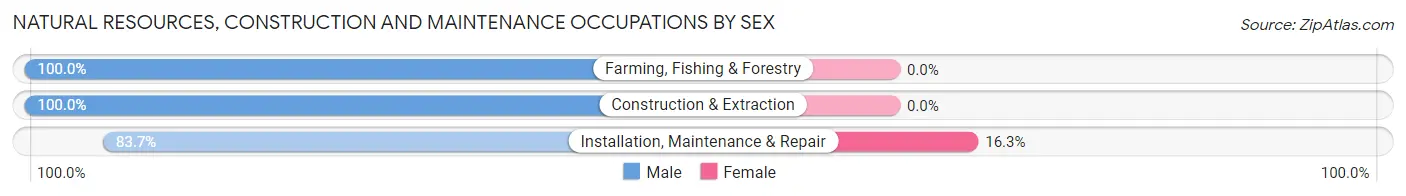
| Occupation | Male | Female |
| Farming, Fishing & Forestry | 29 (100.0%) | 0 (0.0%) |
| Construction & Extraction | 221 (100.0%) | 0 (0.0%) |
| Installation, Maintenance & Repair | 113 (83.7%) | 22 (16.3%) |
| Total (Category) | 363 (94.3%) | 22 (5.7%) |
| Total (Overall) | 1,247 (48.4%) | 1,327 (51.5%) |
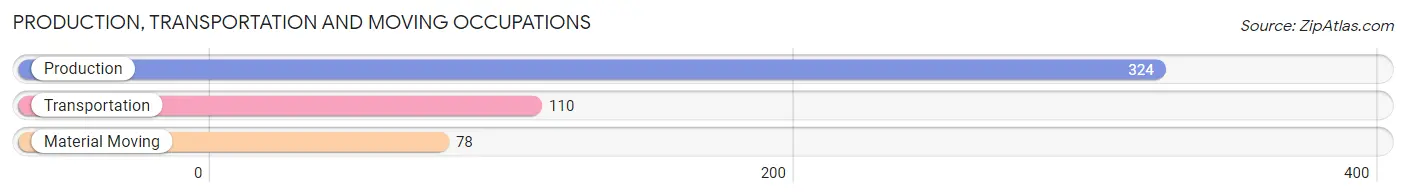
Production, Transportation and Moving Occupations
The most common Production, Transportation and Moving occupations in Humphreys County are Production (324 | 12.6%), Transportation (110 | 4.3%), and Material Moving (78 | 3.0%).
Production, Transportation and Moving Occupations by Sex
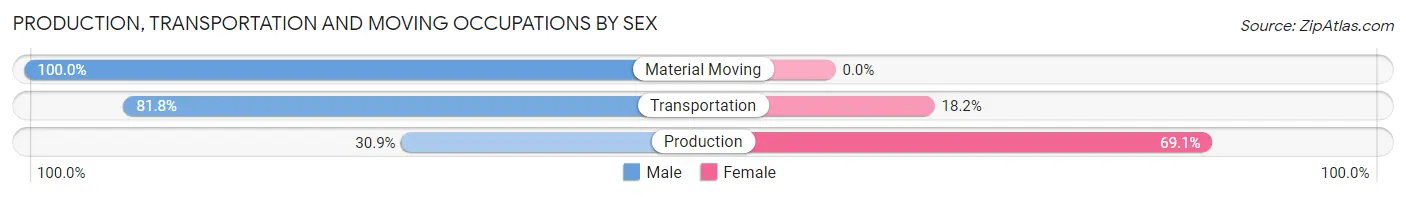
| Occupation | Male | Female |
| Production | 100 (30.9%) | 224 (69.1%) |
| Transportation | 90 (81.8%) | 20 (18.2%) |
| Material Moving | 78 (100.0%) | 0 (0.0%) |
| Total (Category) | 268 (52.3%) | 244 (47.7%) |
| Total (Overall) | 1,247 (48.4%) | 1,327 (51.5%) |
Employment Industries by Sex in Humphreys County
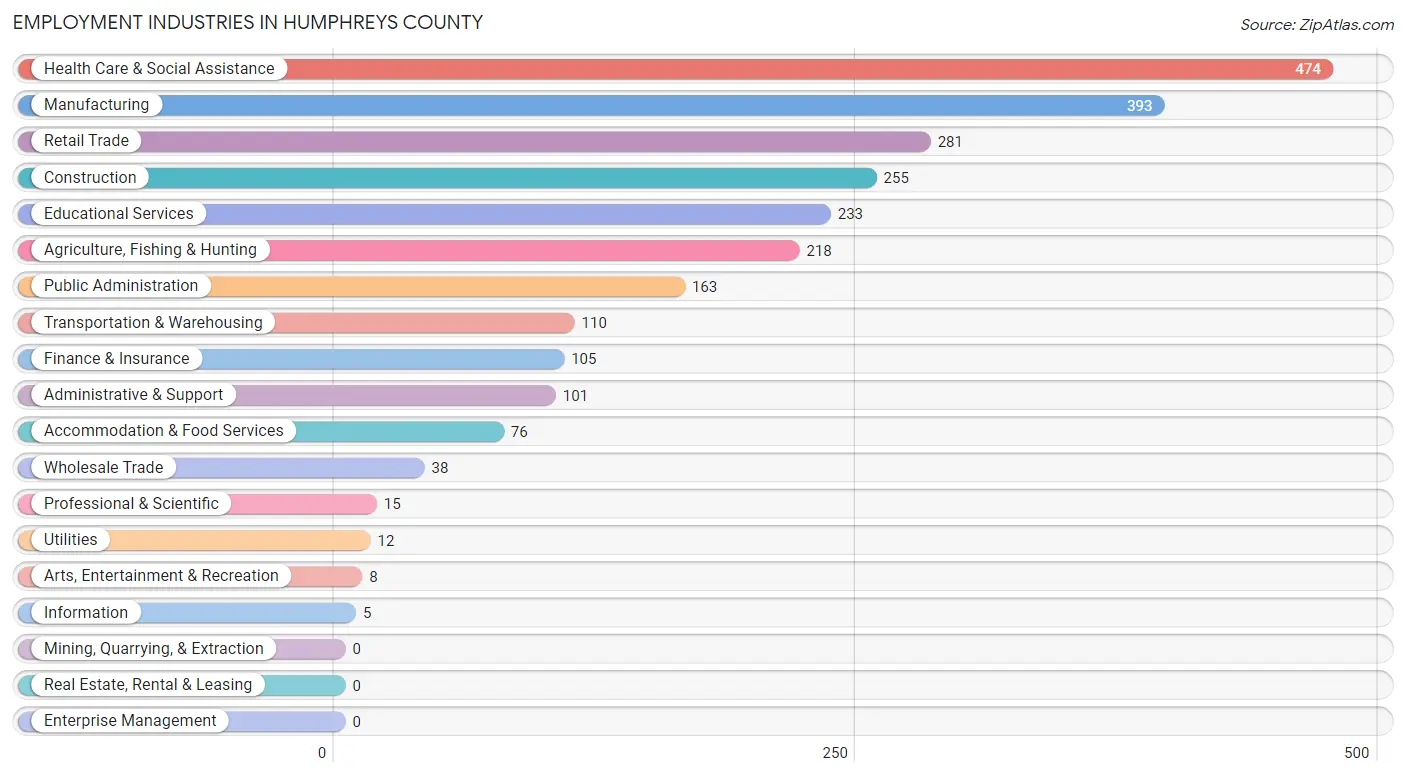
Employment Industries in Humphreys County
The major employment industries in Humphreys County include Health Care & Social Assistance (474 | 18.4%), Manufacturing (393 | 15.3%), Retail Trade (281 | 10.9%), Construction (255 | 9.9%), and Educational Services (233 | 9.0%).
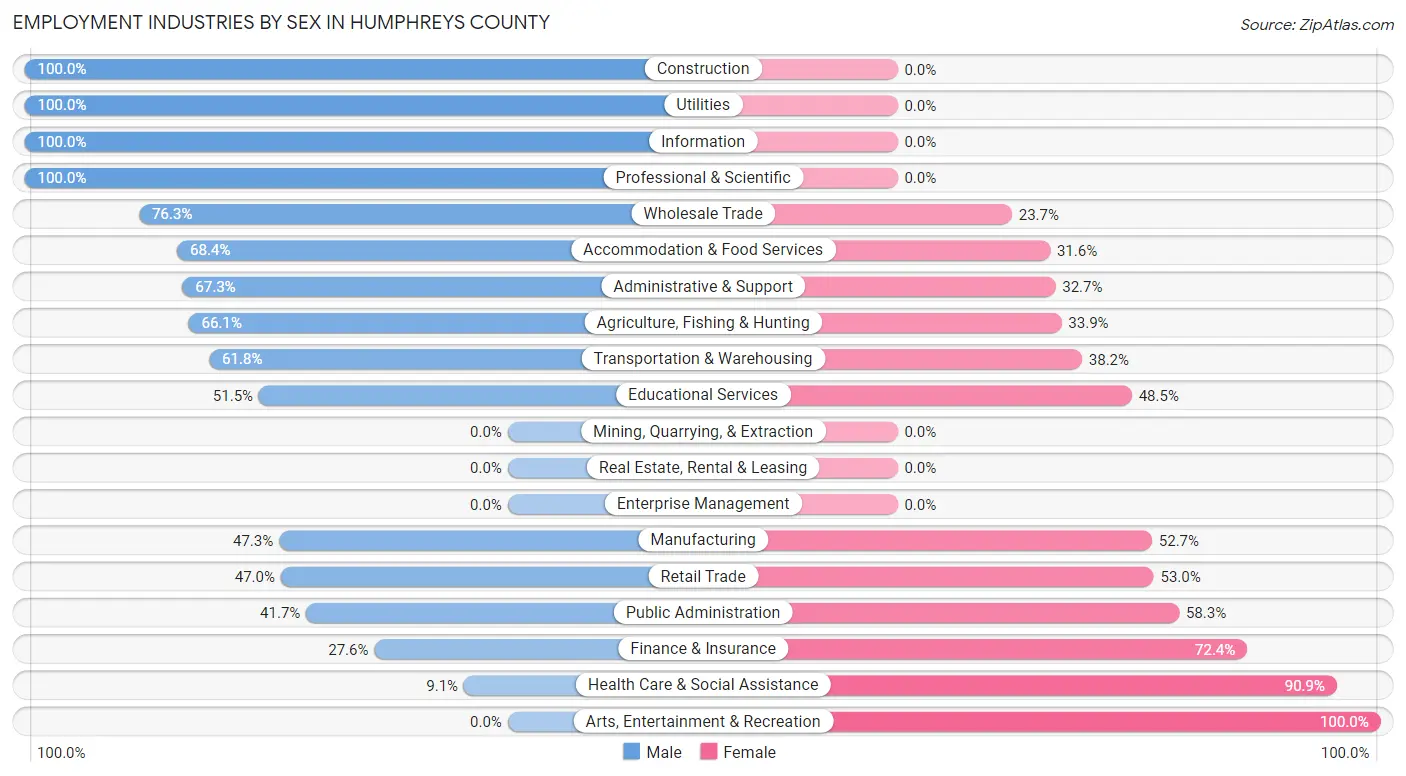
Employment Industries by Sex in Humphreys County
The Humphreys County industries that see more men than women are Construction (100.0%), Utilities (100.0%), and Information (100.0%), whereas the industries that tend to have a higher number of women are Arts, Entertainment & Recreation (100.0%), Health Care & Social Assistance (90.9%), and Finance & Insurance (72.4%).
| Industry | Male | Female |
| Agriculture, Fishing & Hunting | 144 (66.1%) | 74 (33.9%) |
| Mining, Quarrying, & Extraction | 0 (0.0%) | 0 (0.0%) |
| Construction | 255 (100.0%) | 0 (0.0%) |
| Manufacturing | 186 (47.3%) | 207 (52.7%) |
| Wholesale Trade | 29 (76.3%) | 9 (23.7%) |
| Retail Trade | 132 (47.0%) | 149 (53.0%) |
| Transportation & Warehousing | 68 (61.8%) | 42 (38.2%) |
| Utilities | 12 (100.0%) | 0 (0.0%) |
| Information | 5 (100.0%) | 0 (0.0%) |
| Finance & Insurance | 29 (27.6%) | 76 (72.4%) |
| Real Estate, Rental & Leasing | 0 (0.0%) | 0 (0.0%) |
| Professional & Scientific | 15 (100.0%) | 0 (0.0%) |
| Enterprise Management | 0 (0.0%) | 0 (0.0%) |
| Administrative & Support | 68 (67.3%) | 33 (32.7%) |
| Educational Services | 120 (51.5%) | 113 (48.5%) |
| Health Care & Social Assistance | 43 (9.1%) | 431 (90.9%) |
| Arts, Entertainment & Recreation | 0 (0.0%) | 8 (100.0%) |
| Accommodation & Food Services | 52 (68.4%) | 24 (31.6%) |
| Public Administration | 68 (41.7%) | 95 (58.3%) |
| Total | 1,247 (48.4%) | 1,327 (51.5%) |
Education in Humphreys County
School Enrollment in Humphreys County
The most common levels of schooling among the 2,150 students in Humphreys County are elementary school (668 | 31.1%), high school (504 | 23.4%), and middle school (416 | 19.4%).
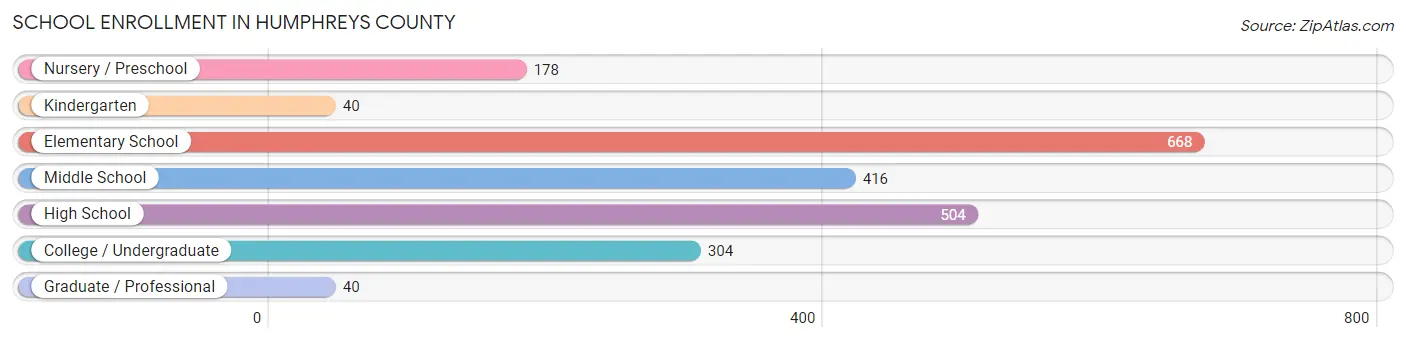
| School Level | # Students | % Students |
| Nursery / Preschool | 178 | 8.3% |
| Kindergarten | 40 | 1.9% |
| Elementary School | 668 | 31.1% |
| Middle School | 416 | 19.4% |
| High School | 504 | 23.4% |
| College / Undergraduate | 304 | 14.1% |
| Graduate / Professional | 40 | 1.9% |
| Total | 2,150 | 100.0% |
School Enrollment by Age by Funding Source in Humphreys County
Out of a total of 2,150 students who are enrolled in schools in Humphreys County, 273 (12.7%) attend a private institution, while the remaining 1,877 (87.3%) are enrolled in public schools. The age group of 25 to 34 year olds has the highest likelihood of being enrolled in private schools, with 28 (44.4% in the age bracket) enrolled. Conversely, the age group of 35 years and over has the lowest likelihood of being enrolled in a private school, with 116 (95.9% in the age bracket) attending a public institution.
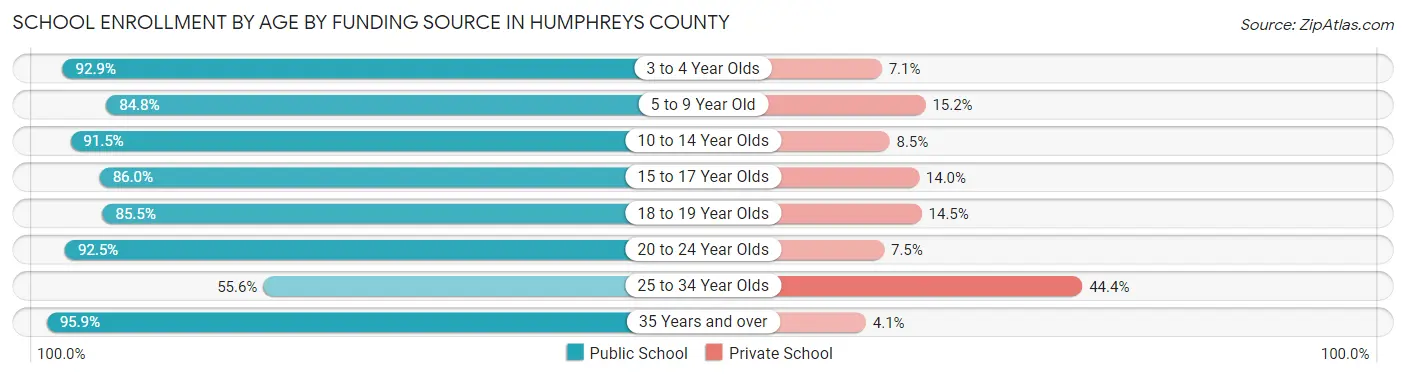
| Age Bracket | Public School | Private School |
| 3 to 4 Year Olds | 118 (92.9%) | 9 (7.1%) |
| 5 to 9 Year Old | 579 (84.8%) | 104 (15.2%) |
| 10 to 14 Year Olds | 450 (91.5%) | 42 (8.5%) |
| 15 to 17 Year Olds | 350 (86.0%) | 57 (14.0%) |
| 18 to 19 Year Olds | 106 (85.5%) | 18 (14.5%) |
| 20 to 24 Year Olds | 123 (92.5%) | 10 (7.5%) |
| 25 to 34 Year Olds | 35 (55.6%) | 28 (44.4%) |
| 35 Years and over | 116 (95.9%) | 5 (4.1%) |
| Total | 1,877 (87.3%) | 273 (12.7%) |
Educational Attainment by Field of Study in Humphreys County
Education (383 | 38.3%), arts & humanities (132 | 13.2%), business (128 | 12.8%), bio, nature & agricultural (73 | 7.3%), and computers & mathematics (63 | 6.3%) are the most common fields of study among 1,000 individuals in Humphreys County who have obtained a bachelor's degree or higher.
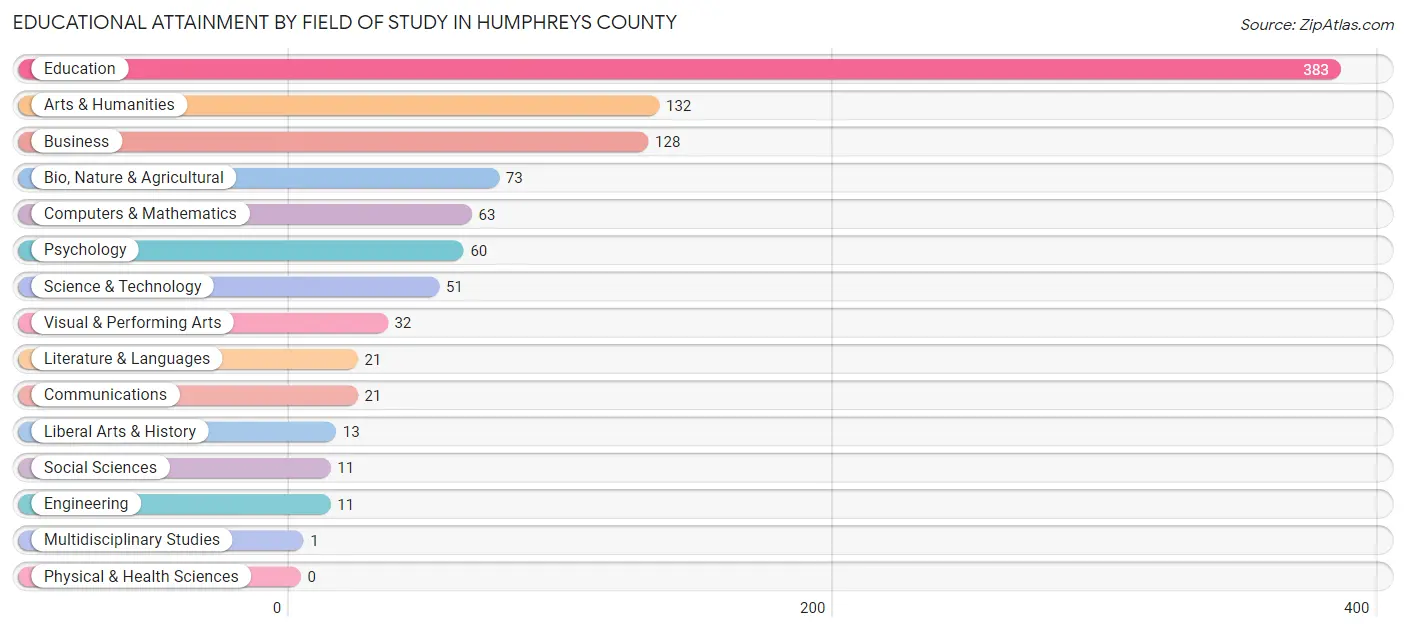
| Field of Study | # Graduates | % Graduates |
| Computers & Mathematics | 63 | 6.3% |
| Bio, Nature & Agricultural | 73 | 7.3% |
| Physical & Health Sciences | 0 | 0.0% |
| Psychology | 60 | 6.0% |
| Social Sciences | 11 | 1.1% |
| Engineering | 11 | 1.1% |
| Multidisciplinary Studies | 1 | 0.1% |
| Science & Technology | 51 | 5.1% |
| Business | 128 | 12.8% |
| Education | 383 | 38.3% |
| Literature & Languages | 21 | 2.1% |
| Liberal Arts & History | 13 | 1.3% |
| Visual & Performing Arts | 32 | 3.2% |
| Communications | 21 | 2.1% |
| Arts & Humanities | 132 | 13.2% |
| Total | 1,000 | 100.0% |
Transportation & Commute in Humphreys County
Vehicle Availability by Sex in Humphreys County
The most prevalent vehicle ownership categories in Humphreys County are males with 2 vehicles (446, accounting for 35.9%) and females with 2 vehicles (458, making up 34.9%).
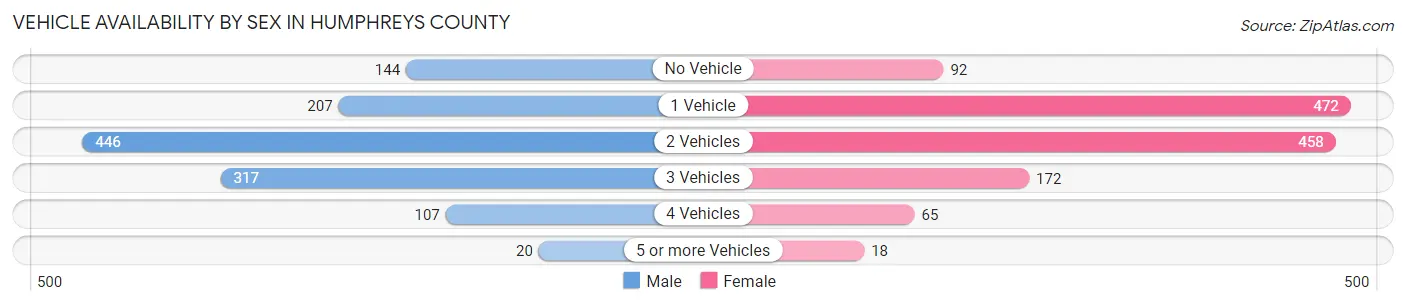
| Vehicles Available | Male | Female |
| No Vehicle | 144 (11.6%) | 92 (7.2%) |
| 1 Vehicle | 207 (16.7%) | 472 (37.0%) |
| 2 Vehicles | 446 (35.9%) | 458 (35.9%) |
| 3 Vehicles | 317 (25.5%) | 172 (13.5%) |
| 4 Vehicles | 107 (8.6%) | 65 (5.1%) |
| 5 or more Vehicles | 20 (1.6%) | 18 (1.4%) |
| Total | 1,241 (100.0%) | 1,277 (100.0%) |
Commute Time in Humphreys County
The most frequently occuring commute durations in Humphreys County are 10 to 14 minutes (543 commuters, 21.7%), 5 to 9 minutes (470 commuters, 18.8%), and 15 to 19 minutes (288 commuters, 11.5%).
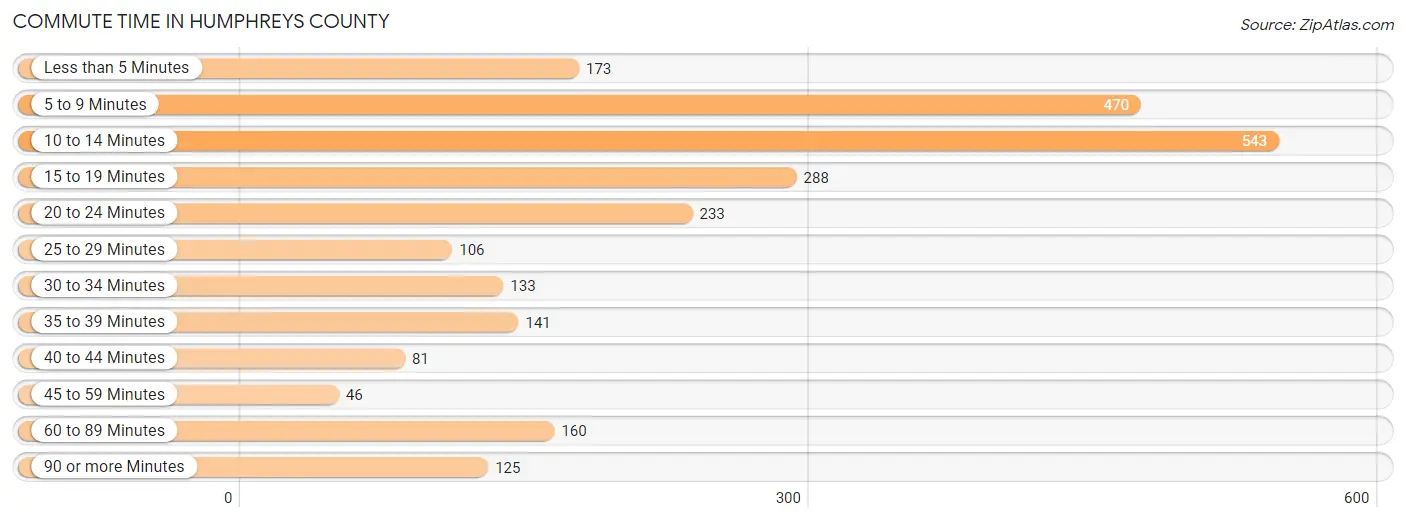
| Commute Time | # Commuters | % Commuters |
| Less than 5 Minutes | 173 | 6.9% |
| 5 to 9 Minutes | 470 | 18.8% |
| 10 to 14 Minutes | 543 | 21.7% |
| 15 to 19 Minutes | 288 | 11.5% |
| 20 to 24 Minutes | 233 | 9.3% |
| 25 to 29 Minutes | 106 | 4.2% |
| 30 to 34 Minutes | 133 | 5.3% |
| 35 to 39 Minutes | 141 | 5.6% |
| 40 to 44 Minutes | 81 | 3.2% |
| 45 to 59 Minutes | 46 | 1.8% |
| 60 to 89 Minutes | 160 | 6.4% |
| 90 or more Minutes | 125 | 5.0% |
Commute Time by Sex in Humphreys County
The most common commute times in Humphreys County are 10 to 14 minutes (273 commuters, 22.3%) for males and 10 to 14 minutes (270 commuters, 21.2%) for females.
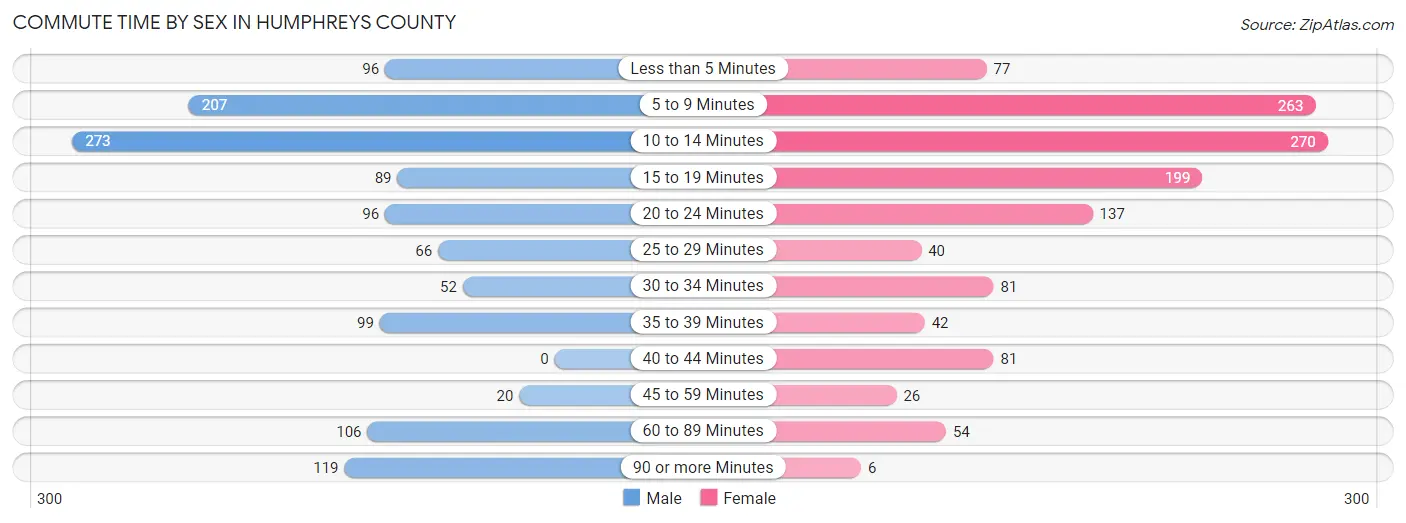
| Commute Time | Male | Female |
| Less than 5 Minutes | 96 (7.9%) | 77 (6.0%) |
| 5 to 9 Minutes | 207 (16.9%) | 263 (20.6%) |
| 10 to 14 Minutes | 273 (22.3%) | 270 (21.2%) |
| 15 to 19 Minutes | 89 (7.3%) | 199 (15.6%) |
| 20 to 24 Minutes | 96 (7.9%) | 137 (10.7%) |
| 25 to 29 Minutes | 66 (5.4%) | 40 (3.1%) |
| 30 to 34 Minutes | 52 (4.3%) | 81 (6.4%) |
| 35 to 39 Minutes | 99 (8.1%) | 42 (3.3%) |
| 40 to 44 Minutes | 0 (0.0%) | 81 (6.4%) |
| 45 to 59 Minutes | 20 (1.6%) | 26 (2.0%) |
| 60 to 89 Minutes | 106 (8.7%) | 54 (4.2%) |
| 90 or more Minutes | 119 (9.7%) | 6 (0.5%) |
Time of Departure to Work by Sex in Humphreys County
The most frequent times of departure to work in Humphreys County are 7:00 AM to 7:29 AM (215, 17.6%) for males and 7:30 AM to 7:59 AM (367, 28.8%) for females.
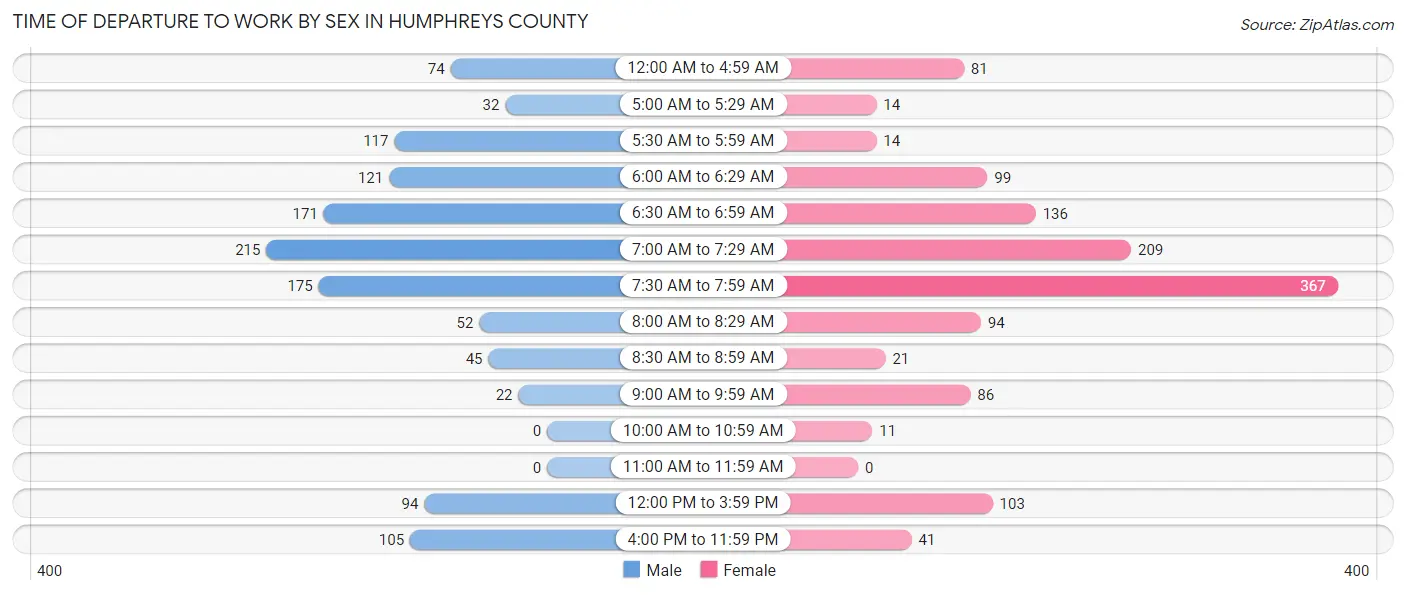
| Time of Departure | Male | Female |
| 12:00 AM to 4:59 AM | 74 (6.0%) | 81 (6.4%) |
| 5:00 AM to 5:29 AM | 32 (2.6%) | 14 (1.1%) |
| 5:30 AM to 5:59 AM | 117 (9.6%) | 14 (1.1%) |
| 6:00 AM to 6:29 AM | 121 (9.9%) | 99 (7.8%) |
| 6:30 AM to 6:59 AM | 171 (14.0%) | 136 (10.7%) |
| 7:00 AM to 7:29 AM | 215 (17.6%) | 209 (16.4%) |
| 7:30 AM to 7:59 AM | 175 (14.3%) | 367 (28.8%) |
| 8:00 AM to 8:29 AM | 52 (4.3%) | 94 (7.4%) |
| 8:30 AM to 8:59 AM | 45 (3.7%) | 21 (1.7%) |
| 9:00 AM to 9:59 AM | 22 (1.8%) | 86 (6.7%) |
| 10:00 AM to 10:59 AM | 0 (0.0%) | 11 (0.9%) |
| 11:00 AM to 11:59 AM | 0 (0.0%) | 0 (0.0%) |
| 12:00 PM to 3:59 PM | 94 (7.7%) | 103 (8.1%) |
| 4:00 PM to 11:59 PM | 105 (8.6%) | 41 (3.2%) |
| Total | 1,223 (100.0%) | 1,276 (100.0%) |
Housing Occupancy in Humphreys County
Occupancy by Ownership in Humphreys County
Of the total 2,991 dwellings in Humphreys County, owner-occupied units account for 1,793 (60.0%), while renter-occupied units make up 1,198 (40.1%).
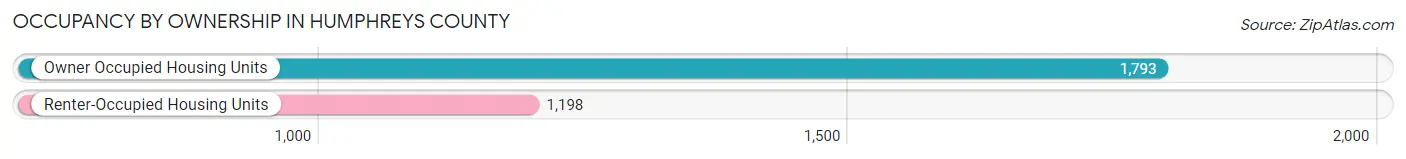
| Occupancy | # Housing Units | % Housing Units |
| Owner Occupied Housing Units | 1,793 | 60.0% |
| Renter-Occupied Housing Units | 1,198 | 40.1% |
| Total Occupied Housing Units | 2,991 | 100.0% |
Occupancy by Household Size in Humphreys County
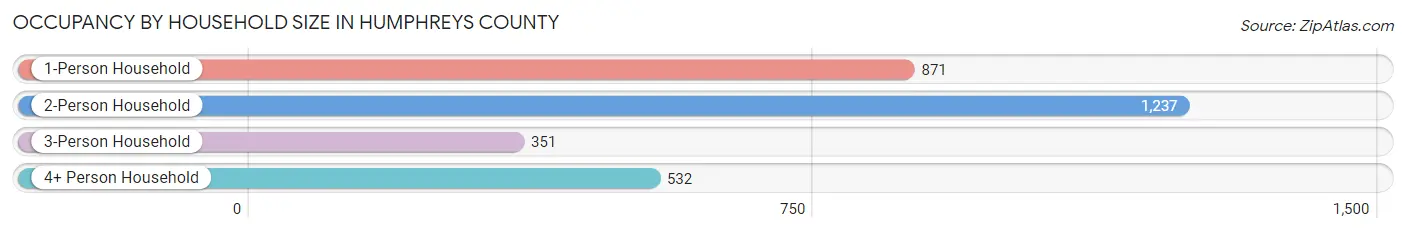
| Household Size | # Housing Units | % Housing Units |
| 1-Person Household | 871 | 29.1% |
| 2-Person Household | 1,237 | 41.4% |
| 3-Person Household | 351 | 11.7% |
| 4+ Person Household | 532 | 17.8% |
| Total Housing Units | 2,991 | 100.0% |
Occupancy by Ownership by Household Size in Humphreys County
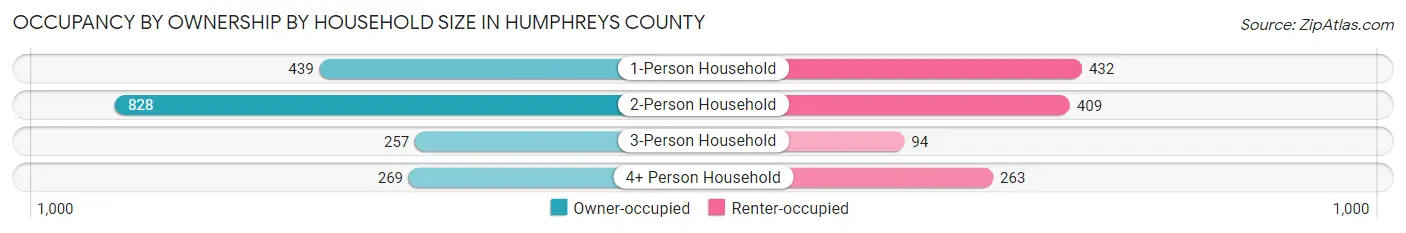
| Household Size | Owner-occupied | Renter-occupied |
| 1-Person Household | 439 (50.4%) | 432 (49.6%) |
| 2-Person Household | 828 (66.9%) | 409 (33.1%) |
| 3-Person Household | 257 (73.2%) | 94 (26.8%) |
| 4+ Person Household | 269 (50.6%) | 263 (49.4%) |
| Total Housing Units | 1,793 (60.0%) | 1,198 (40.1%) |
Occupancy by Educational Attainment in Humphreys County
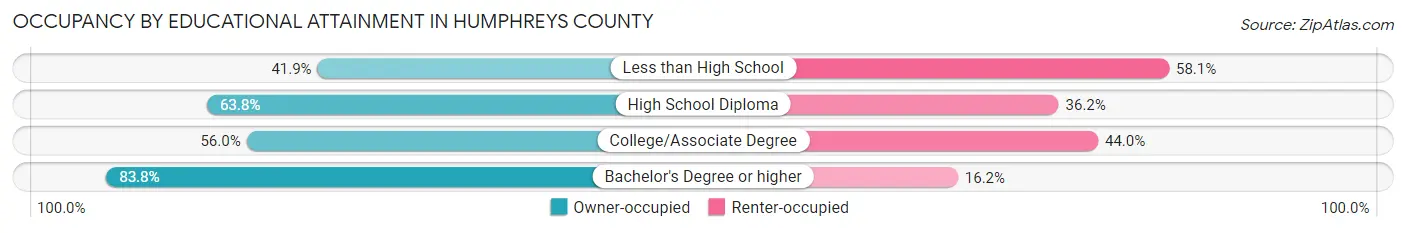
| Household Size | Owner-occupied | Renter-occupied |
| Less than High School | 328 (41.9%) | 454 (58.1%) |
| High School Diploma | 473 (63.8%) | 268 (36.2%) |
| College/Associate Degree | 480 (56.0%) | 377 (44.0%) |
| Bachelor's Degree or higher | 512 (83.8%) | 99 (16.2%) |
Occupancy by Age of Householder in Humphreys County
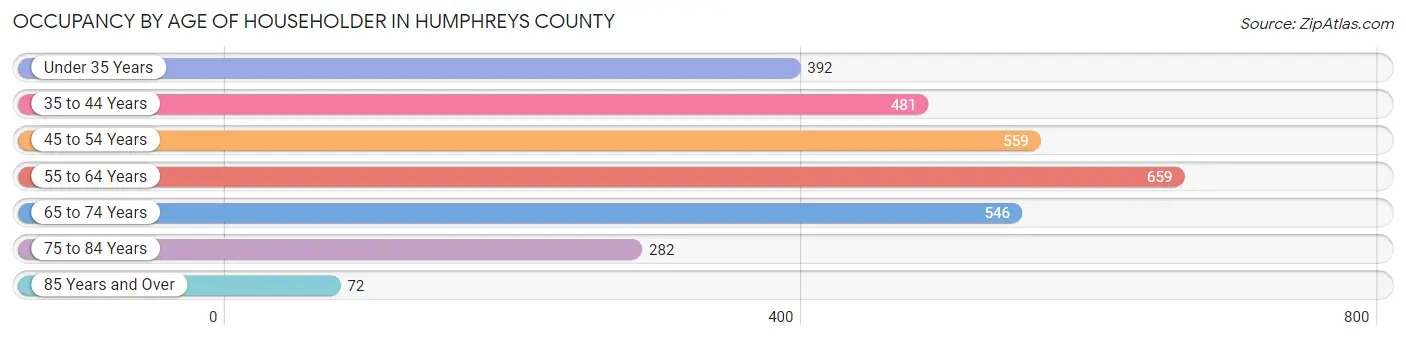
| Age Bracket | # Households | % Households |
| Under 35 Years | 392 | 13.1% |
| 35 to 44 Years | 481 | 16.1% |
| 45 to 54 Years | 559 | 18.7% |
| 55 to 64 Years | 659 | 22.0% |
| 65 to 74 Years | 546 | 18.2% |
| 75 to 84 Years | 282 | 9.4% |
| 85 Years and Over | 72 | 2.4% |
| Total | 2,991 | 100.0% |
Housing Finances in Humphreys County
Median Income by Occupancy in Humphreys County
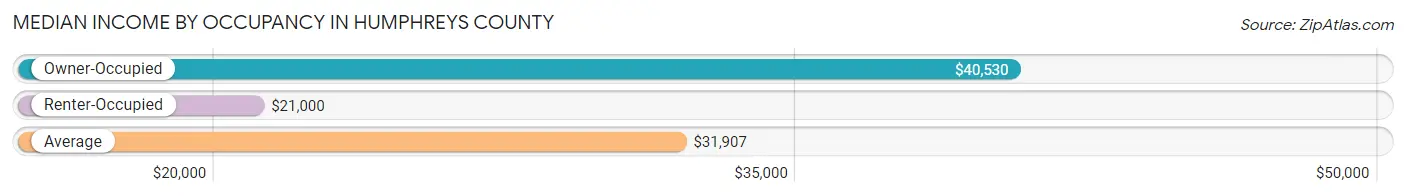
| Occupancy Type | # Households | Median Income |
| Owner-Occupied | 1,793 (60.0%) | $40,530 |
| Renter-Occupied | 1,198 (40.1%) | $21,000 |
| Average | 2,991 (100.0%) | $31,907 |
Occupancy by Householder Income Bracket in Humphreys County
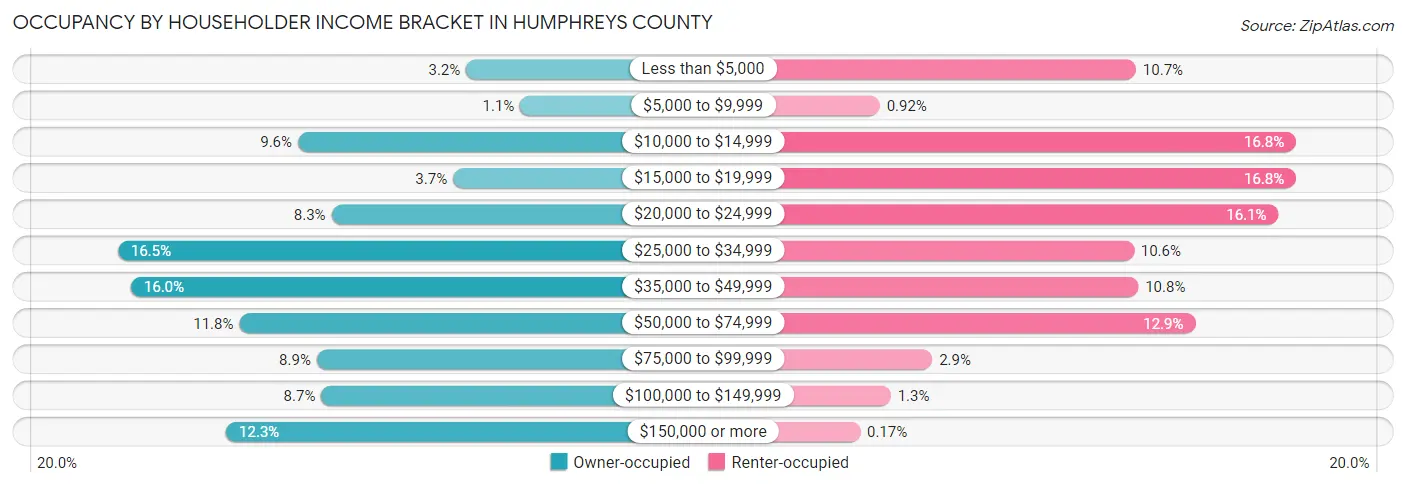
| Income Bracket | Owner-occupied | Renter-occupied |
| Less than $5,000 | 57 (3.2%) | 128 (10.7%) |
| $5,000 to $9,999 | 20 (1.1%) | 11 (0.9%) |
| $10,000 to $14,999 | 172 (9.6%) | 201 (16.8%) |
| $15,000 to $19,999 | 66 (3.7%) | 201 (16.8%) |
| $20,000 to $24,999 | 149 (8.3%) | 193 (16.1%) |
| $25,000 to $34,999 | 295 (16.5%) | 127 (10.6%) |
| $35,000 to $49,999 | 286 (16.0%) | 129 (10.8%) |
| $50,000 to $74,999 | 212 (11.8%) | 155 (12.9%) |
| $75,000 to $99,999 | 159 (8.9%) | 35 (2.9%) |
| $100,000 to $149,999 | 156 (8.7%) | 16 (1.3%) |
| $150,000 or more | 221 (12.3%) | 2 (0.2%) |
| Total | 1,793 (100.0%) | 1,198 (100.0%) |
Monthly Housing Cost Tiers in Humphreys County
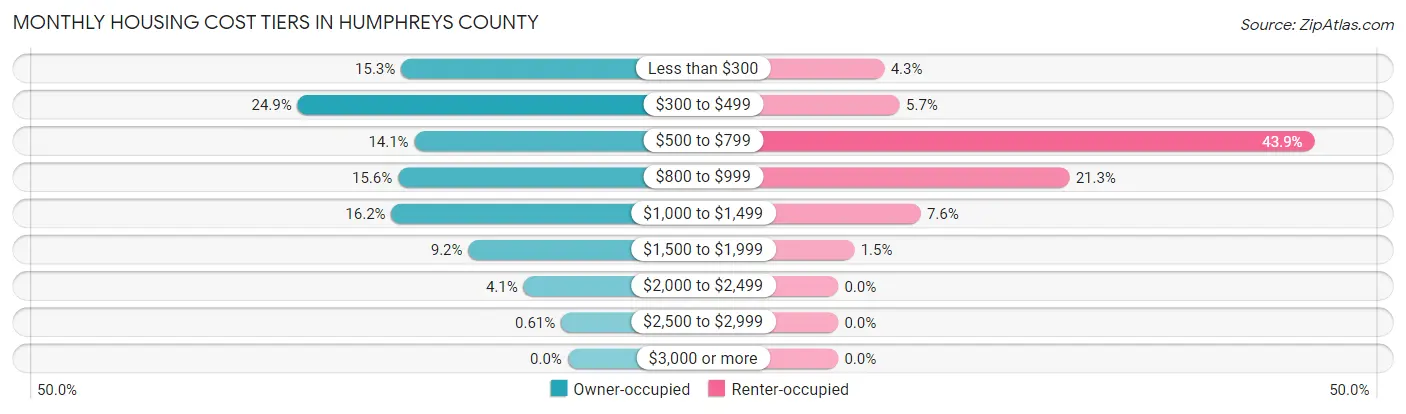
| Monthly Cost | Owner-occupied | Renter-occupied |
| Less than $300 | 275 (15.3%) | 51 (4.3%) |
| $300 to $499 | 446 (24.9%) | 68 (5.7%) |
| $500 to $799 | 253 (14.1%) | 526 (43.9%) |
| $800 to $999 | 280 (15.6%) | 255 (21.3%) |
| $1,000 to $1,499 | 291 (16.2%) | 91 (7.6%) |
| $1,500 to $1,999 | 164 (9.1%) | 18 (1.5%) |
| $2,000 to $2,499 | 73 (4.1%) | 0 (0.0%) |
| $2,500 to $2,999 | 11 (0.6%) | 0 (0.0%) |
| $3,000 or more | 0 (0.0%) | 0 (0.0%) |
| Total | 1,793 (100.0%) | 1,198 (100.0%) |
Physical Housing Characteristics in Humphreys County
Housing Structures in Humphreys County
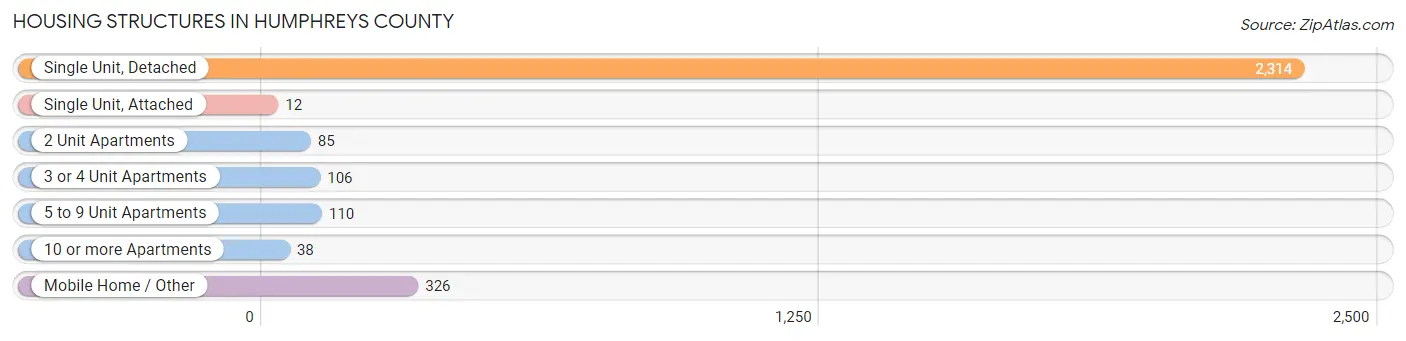
| Structure Type | # Housing Units | % Housing Units |
| Single Unit, Detached | 2,314 | 77.4% |
| Single Unit, Attached | 12 | 0.4% |
| 2 Unit Apartments | 85 | 2.8% |
| 3 or 4 Unit Apartments | 106 | 3.5% |
| 5 to 9 Unit Apartments | 110 | 3.7% |
| 10 or more Apartments | 38 | 1.3% |
| Mobile Home / Other | 326 | 10.9% |
| Total | 2,991 | 100.0% |
Housing Structures by Occupancy in Humphreys County
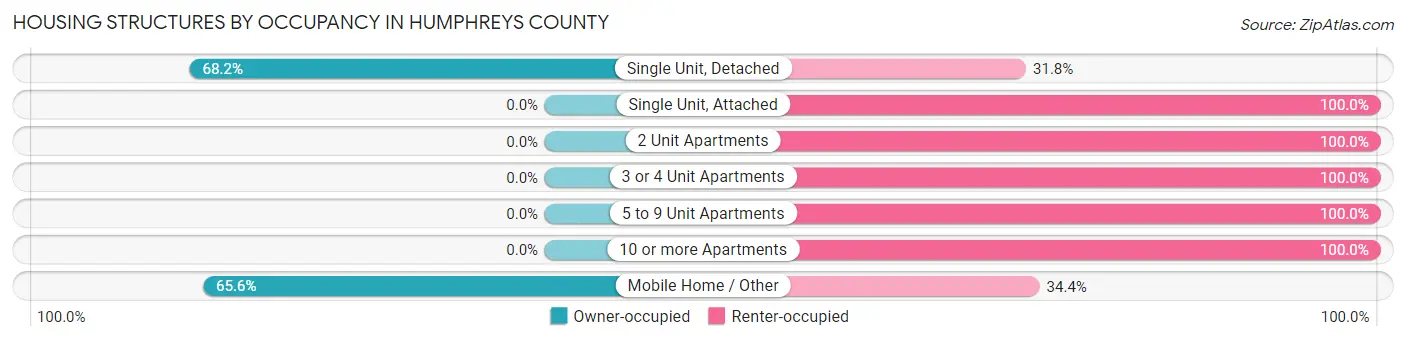
| Structure Type | Owner-occupied | Renter-occupied |
| Single Unit, Detached | 1,579 (68.2%) | 735 (31.8%) |
| Single Unit, Attached | 0 (0.0%) | 12 (100.0%) |
| 2 Unit Apartments | 0 (0.0%) | 85 (100.0%) |
| 3 or 4 Unit Apartments | 0 (0.0%) | 106 (100.0%) |
| 5 to 9 Unit Apartments | 0 (0.0%) | 110 (100.0%) |
| 10 or more Apartments | 0 (0.0%) | 38 (100.0%) |
| Mobile Home / Other | 214 (65.6%) | 112 (34.4%) |
| Total | 1,793 (60.0%) | 1,198 (40.1%) |
Housing Structures by Number of Rooms in Humphreys County
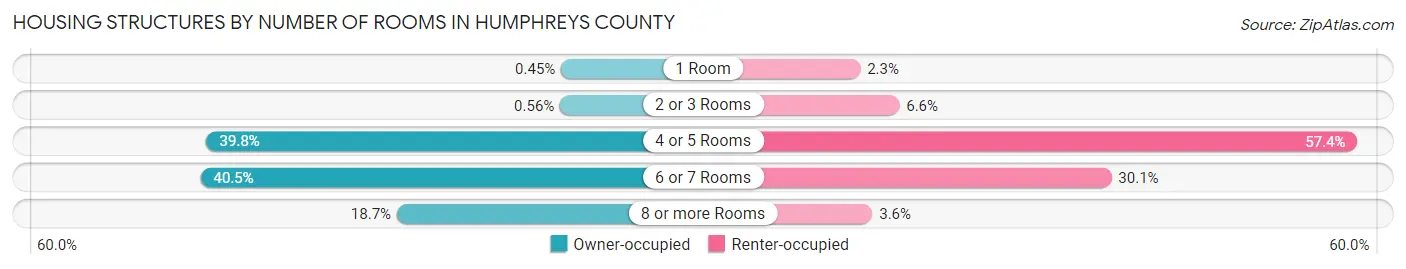
| Number of Rooms | Owner-occupied | Renter-occupied |
| 1 Room | 8 (0.4%) | 27 (2.2%) |
| 2 or 3 Rooms | 10 (0.6%) | 79 (6.6%) |
| 4 or 5 Rooms | 714 (39.8%) | 688 (57.4%) |
| 6 or 7 Rooms | 726 (40.5%) | 361 (30.1%) |
| 8 or more Rooms | 335 (18.7%) | 43 (3.6%) |
| Total | 1,793 (100.0%) | 1,198 (100.0%) |
Housing Structure by Heating Type in Humphreys County
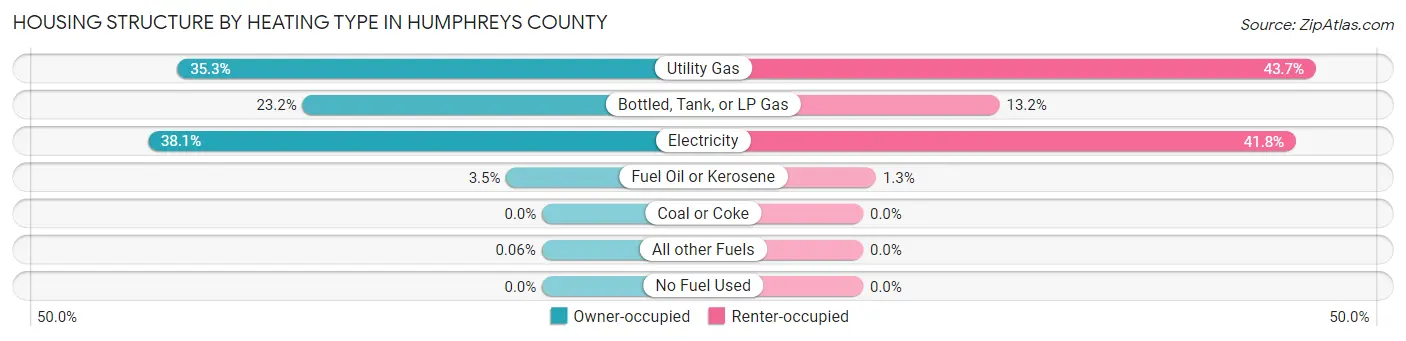
| Heating Type | Owner-occupied | Renter-occupied |
| Utility Gas | 632 (35.2%) | 524 (43.7%) |
| Bottled, Tank, or LP Gas | 415 (23.2%) | 158 (13.2%) |
| Electricity | 683 (38.1%) | 501 (41.8%) |
| Fuel Oil or Kerosene | 62 (3.5%) | 15 (1.3%) |
| Coal or Coke | 0 (0.0%) | 0 (0.0%) |
| All other Fuels | 1 (0.1%) | 0 (0.0%) |
| No Fuel Used | 0 (0.0%) | 0 (0.0%) |
| Total | 1,793 (100.0%) | 1,198 (100.0%) |
Household Vehicle Usage in Humphreys County
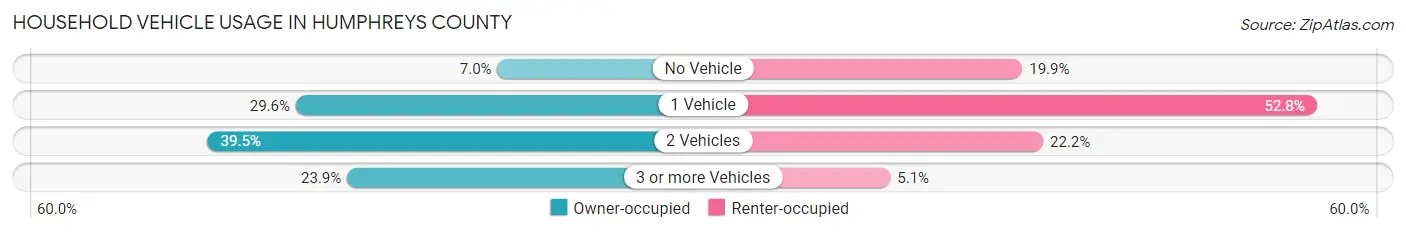
| Vehicles per Household | Owner-occupied | Renter-occupied |
| No Vehicle | 126 (7.0%) | 238 (19.9%) |
| 1 Vehicle | 531 (29.6%) | 633 (52.8%) |
| 2 Vehicles | 708 (39.5%) | 266 (22.2%) |
| 3 or more Vehicles | 428 (23.9%) | 61 (5.1%) |
| Total | 1,793 (100.0%) | 1,198 (100.0%) |
Real Estate & Mortgages in Humphreys County
Real Estate and Mortgage Overview in Humphreys County
| Characteristic | Without Mortgage | With Mortgage |
| Housing Units | 1,042 | 751 |
| Median Property Value | $71,800 | $87,500 |
| Median Household Income | $33,043 | $111 |
| Monthly Housing Costs | $415 | $0 |
| Real Estate Taxes | $496 | $153 |
Property Value by Mortgage Status in Humphreys County
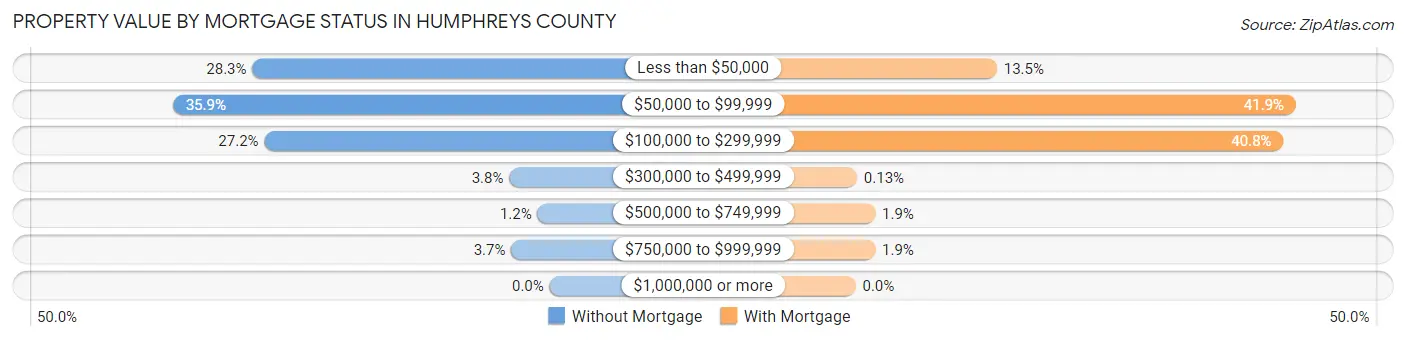
| Property Value | Without Mortgage | With Mortgage |
| Less than $50,000 | 295 (28.3%) | 101 (13.5%) |
| $50,000 to $99,999 | 374 (35.9%) | 315 (41.9%) |
| $100,000 to $299,999 | 283 (27.2%) | 306 (40.7%) |
| $300,000 to $499,999 | 40 (3.8%) | 1 (0.1%) |
| $500,000 to $749,999 | 12 (1.1%) | 14 (1.9%) |
| $750,000 to $999,999 | 38 (3.6%) | 14 (1.9%) |
| $1,000,000 or more | 0 (0.0%) | 0 (0.0%) |
| Total | 1,042 (100.0%) | 751 (100.0%) |
Household Income by Mortgage Status in Humphreys County
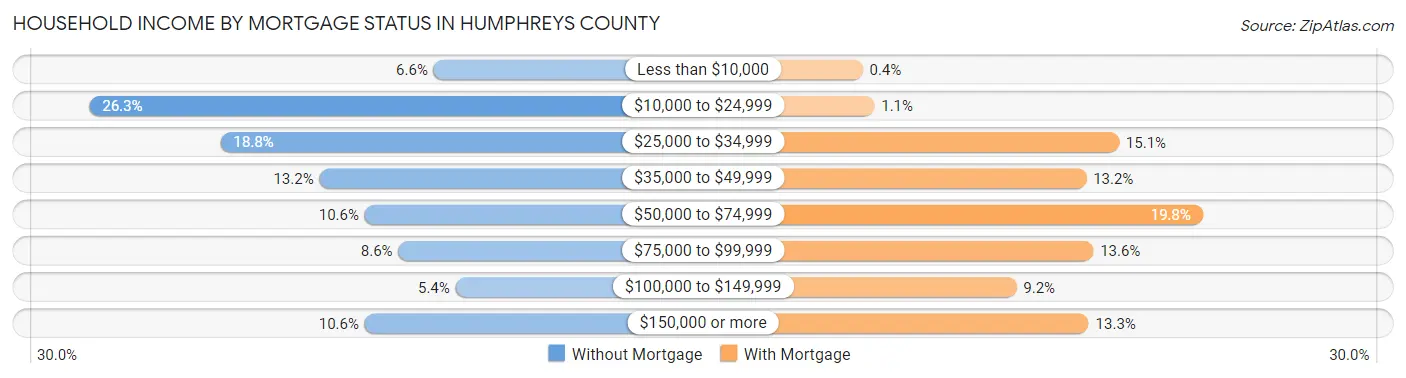
| Household Income | Without Mortgage | With Mortgage |
| Less than $10,000 | 69 (6.6%) | 3 (0.4%) |
| $10,000 to $24,999 | 274 (26.3%) | 8 (1.1%) |
| $25,000 to $34,999 | 196 (18.8%) | 113 (15.0%) |
| $35,000 to $49,999 | 137 (13.2%) | 99 (13.2%) |
| $50,000 to $74,999 | 110 (10.6%) | 149 (19.8%) |
| $75,000 to $99,999 | 90 (8.6%) | 102 (13.6%) |
| $100,000 to $149,999 | 56 (5.4%) | 69 (9.2%) |
| $150,000 or more | 110 (10.6%) | 100 (13.3%) |
| Total | 1,042 (100.0%) | 751 (100.0%) |
Property Value to Household Income Ratio in Humphreys County
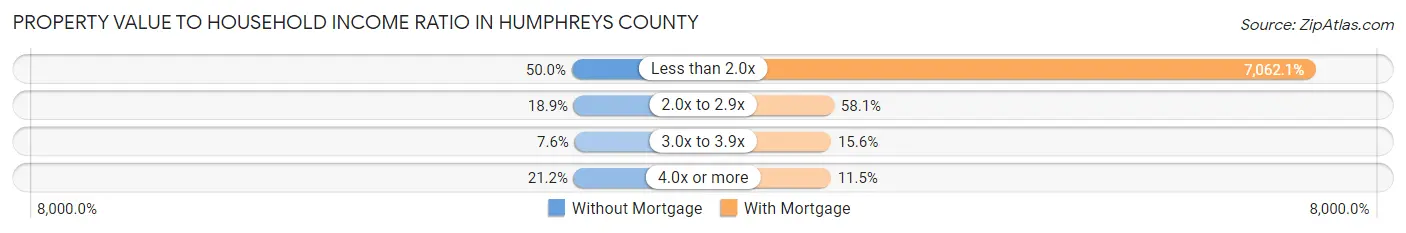
| Value-to-Income Ratio | Without Mortgage | With Mortgage |
| Less than 2.0x | 521 (50.0%) | 53,036 (7,062.1%) |
| 2.0x to 2.9x | 197 (18.9%) | 436 (58.1%) |
| 3.0x to 3.9x | 79 (7.6%) | 117 (15.6%) |
| 4.0x or more | 221 (21.2%) | 86 (11.5%) |
| Total | 1,042 (100.0%) | 751 (100.0%) |
Real Estate Taxes by Mortgage Status in Humphreys County
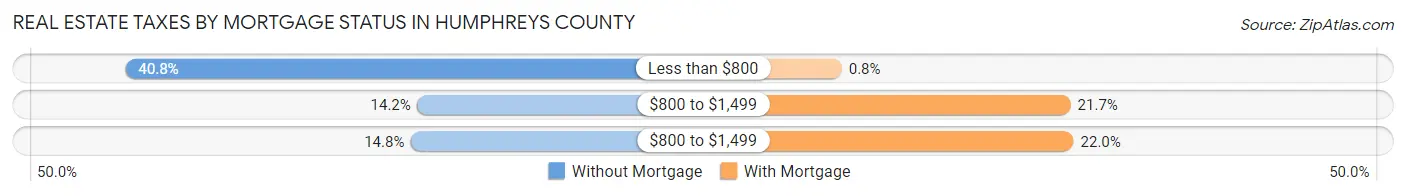
| Property Taxes | Without Mortgage | With Mortgage |
| Less than $800 | 425 (40.8%) | 6 (0.8%) |
| $800 to $1,499 | 148 (14.2%) | 163 (21.7%) |
| $800 to $1,499 | 154 (14.8%) | 165 (22.0%) |
| Total | 1,042 (100.0%) | 751 (100.0%) |
Health & Disability in Humphreys County
Health Insurance Coverage by Age in Humphreys County
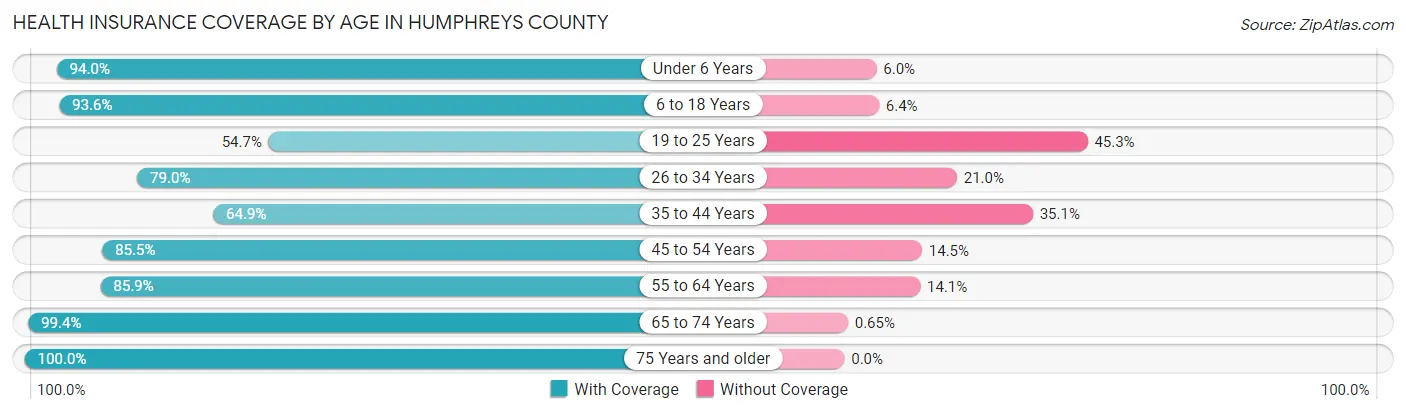
| Age Bracket | With Coverage | Without Coverage |
| Under 6 Years | 503 (94.0%) | 32 (6.0%) |
| 6 to 18 Years | 1,439 (93.6%) | 99 (6.4%) |
| 19 to 25 Years | 334 (54.7%) | 277 (45.3%) |
| 26 to 34 Years | 546 (79.0%) | 145 (21.0%) |
| 35 to 44 Years | 635 (64.9%) | 344 (35.1%) |
| 45 to 54 Years | 775 (85.5%) | 131 (14.5%) |
| 55 to 64 Years | 948 (85.9%) | 156 (14.1%) |
| 65 to 74 Years | 759 (99.4%) | 5 (0.6%) |
| 75 Years and older | 523 (100.0%) | 0 (0.0%) |
| Total | 6,462 (84.5%) | 1,189 (15.5%) |
Health Insurance Coverage by Citizenship Status in Humphreys County
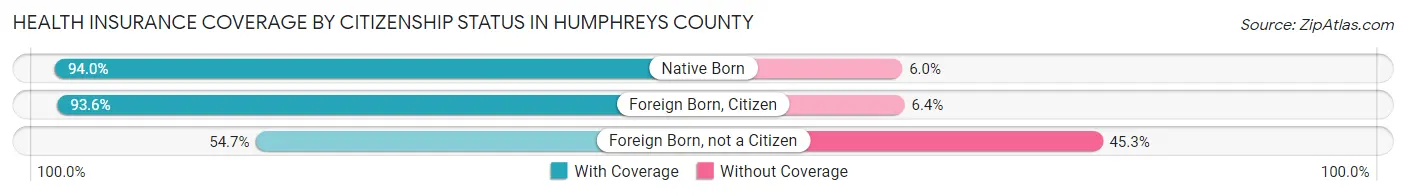
| Citizenship Status | With Coverage | Without Coverage |
| Native Born | 503 (94.0%) | 32 (6.0%) |
| Foreign Born, Citizen | 1,439 (93.6%) | 99 (6.4%) |
| Foreign Born, not a Citizen | 334 (54.7%) | 277 (45.3%) |
Health Insurance Coverage by Household Income in Humphreys County
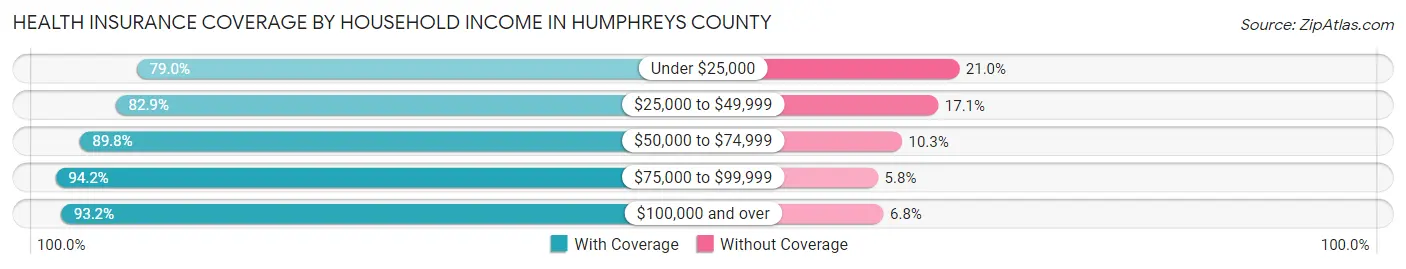
| Household Income | With Coverage | Without Coverage |
| Under $25,000 | 2,325 (79.0%) | 618 (21.0%) |
| $25,000 to $49,999 | 1,809 (82.9%) | 372 (17.1%) |
| $50,000 to $74,999 | 858 (89.7%) | 98 (10.2%) |
| $75,000 to $99,999 | 538 (94.2%) | 33 (5.8%) |
| $100,000 and over | 932 (93.2%) | 68 (6.8%) |
Public vs Private Health Insurance Coverage by Age in Humphreys County
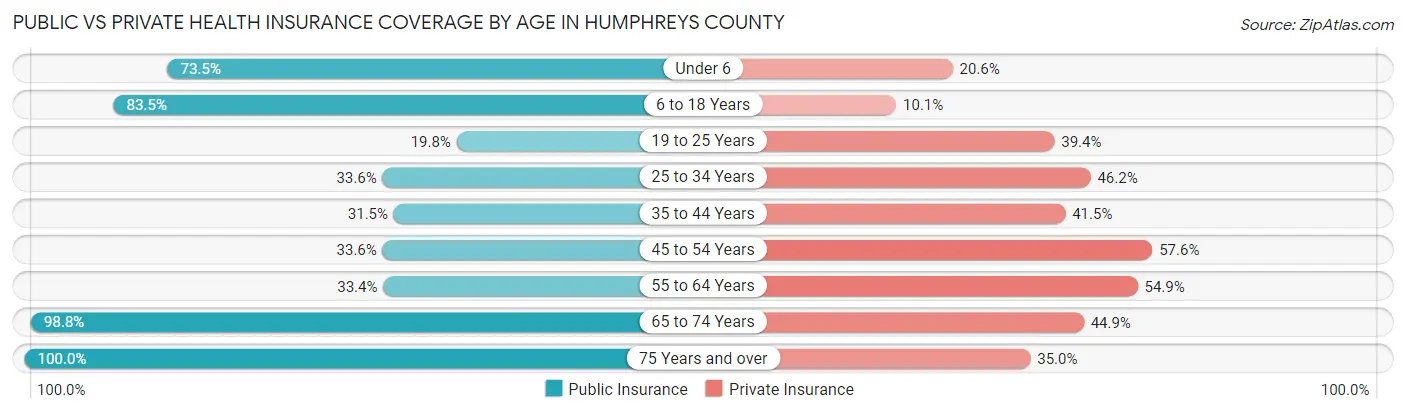
| Age Bracket | Public Insurance | Private Insurance |
| Under 6 | 393 (73.5%) | 110 (20.6%) |
| 6 to 18 Years | 1,284 (83.5%) | 155 (10.1%) |
| 19 to 25 Years | 121 (19.8%) | 241 (39.4%) |
| 25 to 34 Years | 232 (33.6%) | 319 (46.2%) |
| 35 to 44 Years | 308 (31.5%) | 406 (41.5%) |
| 45 to 54 Years | 304 (33.6%) | 522 (57.6%) |
| 55 to 64 Years | 369 (33.4%) | 606 (54.9%) |
| 65 to 74 Years | 755 (98.8%) | 343 (44.9%) |
| 75 Years and over | 523 (100.0%) | 183 (35.0%) |
| Total | 4,289 (56.1%) | 2,885 (37.7%) |
Disability Status by Sex by Age in Humphreys County
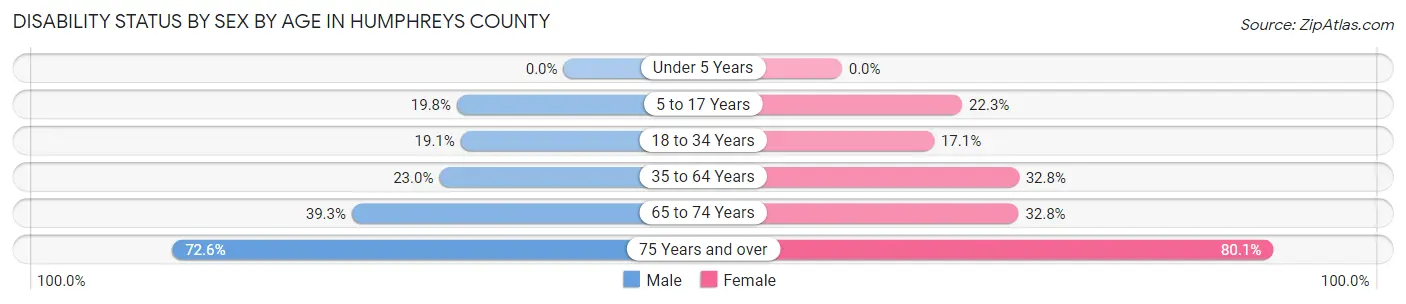
| Age Bracket | Male | Female |
| Under 5 Years | 0 (0.0%) | 0 (0.0%) |
| 5 to 17 Years | 140 (19.8%) | 197 (22.3%) |
| 18 to 34 Years | 140 (19.1%) | 110 (17.1%) |
| 35 to 64 Years | 302 (23.0%) | 551 (32.8%) |
| 65 to 74 Years | 130 (39.3%) | 142 (32.8%) |
| 75 Years and over | 143 (72.6%) | 261 (80.1%) |
Disability Class by Sex by Age in Humphreys County
Disability Class: Hearing Difficulty
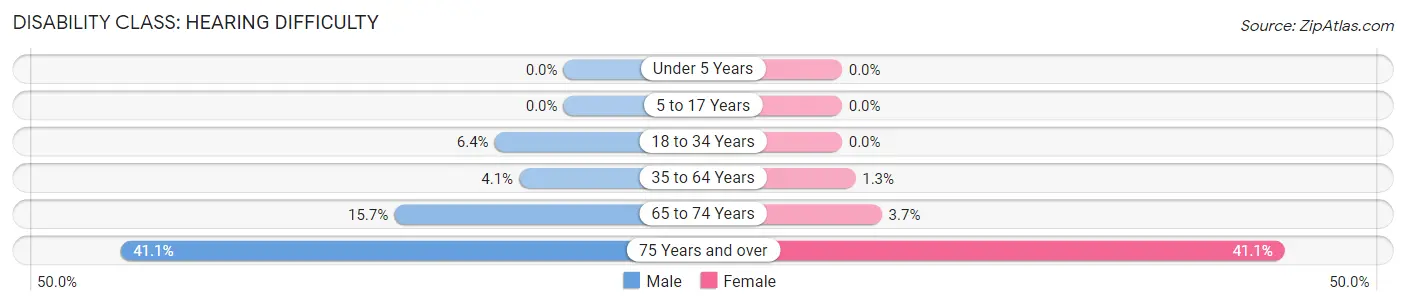
| Age Bracket | Male | Female |
| Under 5 Years | 0 (0.0%) | 0 (0.0%) |
| 5 to 17 Years | 0 (0.0%) | 0 (0.0%) |
| 18 to 34 Years | 47 (6.4%) | 0 (0.0%) |
| 35 to 64 Years | 54 (4.1%) | 21 (1.3%) |
| 65 to 74 Years | 52 (15.7%) | 16 (3.7%) |
| 75 Years and over | 81 (41.1%) | 134 (41.1%) |
Disability Class: Vision Difficulty
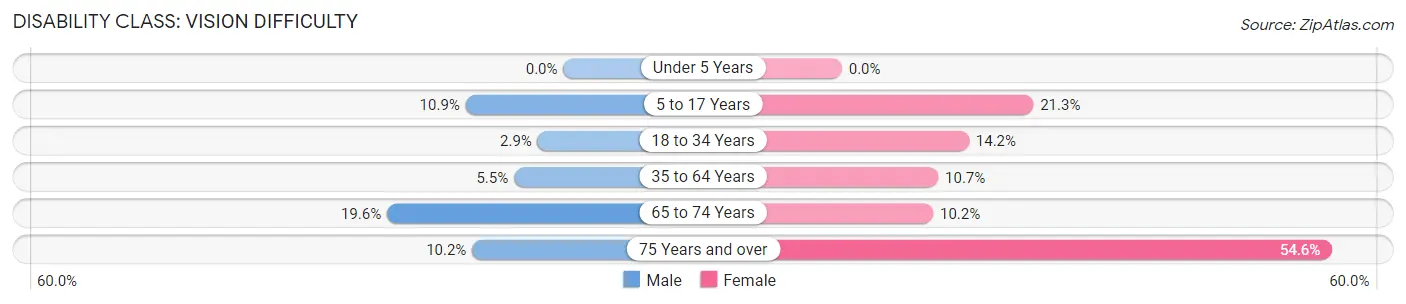
| Age Bracket | Male | Female |
| Under 5 Years | 0 (0.0%) | 0 (0.0%) |
| 5 to 17 Years | 77 (10.9%) | 188 (21.3%) |
| 18 to 34 Years | 21 (2.9%) | 91 (14.1%) |
| 35 to 64 Years | 72 (5.5%) | 180 (10.7%) |
| 65 to 74 Years | 65 (19.6%) | 44 (10.2%) |
| 75 Years and over | 20 (10.2%) | 178 (54.6%) |
Disability Class: Cognitive Difficulty
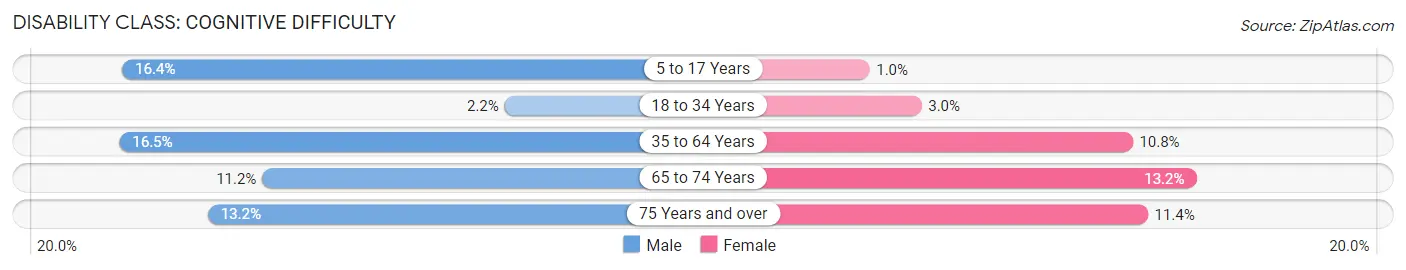
| Age Bracket | Male | Female |
| 5 to 17 Years | 116 (16.4%) | 9 (1.0%) |
| 18 to 34 Years | 16 (2.2%) | 19 (2.9%) |
| 35 to 64 Years | 216 (16.5%) | 181 (10.8%) |
| 65 to 74 Years | 37 (11.2%) | 57 (13.2%) |
| 75 Years and over | 26 (13.2%) | 37 (11.4%) |
Disability Class: Ambulatory Difficulty
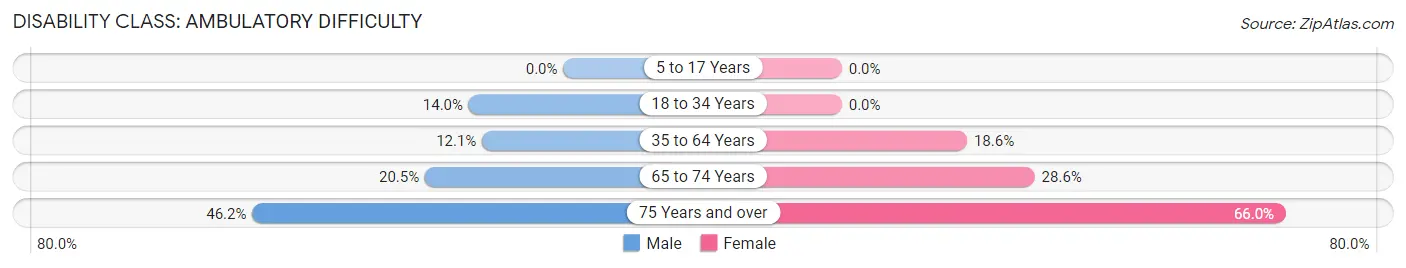
| Age Bracket | Male | Female |
| 5 to 17 Years | 0 (0.0%) | 0 (0.0%) |
| 18 to 34 Years | 103 (14.0%) | 0 (0.0%) |
| 35 to 64 Years | 158 (12.0%) | 312 (18.6%) |
| 65 to 74 Years | 68 (20.5%) | 124 (28.6%) |
| 75 Years and over | 91 (46.2%) | 215 (65.9%) |
Disability Class: Self-Care Difficulty
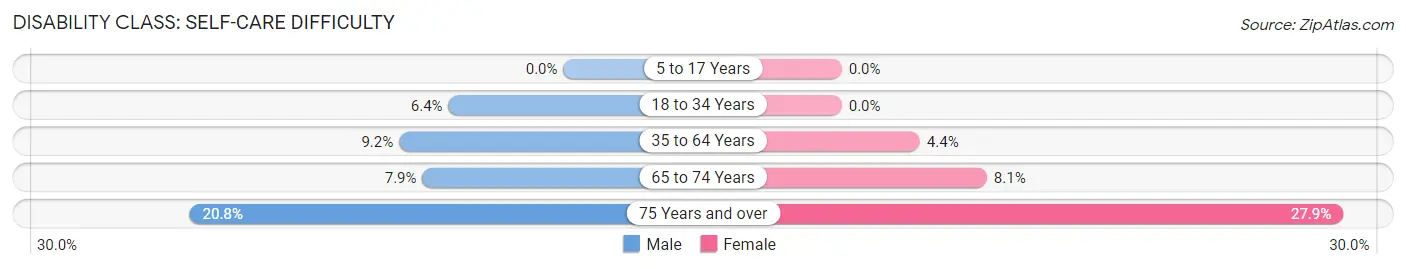
| Age Bracket | Male | Female |
| 5 to 17 Years | 0 (0.0%) | 0 (0.0%) |
| 18 to 34 Years | 47 (6.4%) | 0 (0.0%) |
| 35 to 64 Years | 120 (9.1%) | 73 (4.3%) |
| 65 to 74 Years | 26 (7.9%) | 35 (8.1%) |
| 75 Years and over | 41 (20.8%) | 91 (27.9%) |
Technology Access in Humphreys County
Computing Device Access in Humphreys County
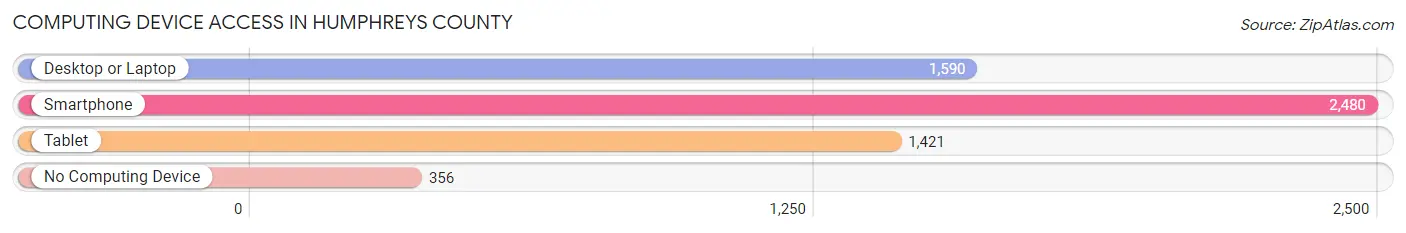
| Device Type | # Households | % Households |
| Desktop or Laptop | 1,590 | 53.2% |
| Smartphone | 2,480 | 82.9% |
| Tablet | 1,421 | 47.5% |
| No Computing Device | 356 | 11.9% |
| Total | 2,991 | 100.0% |
Internet Access in Humphreys County
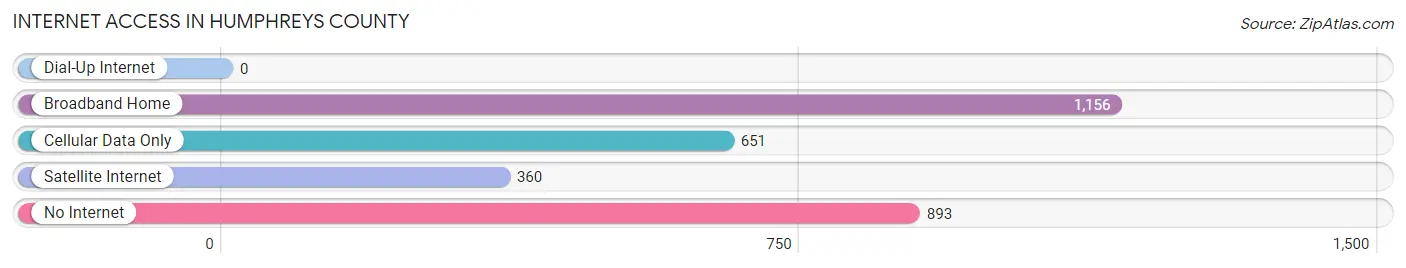
| Internet Type | # Households | % Households |
| Dial-Up Internet | 0 | 0.0% |
| Broadband Home | 1,156 | 38.7% |
| Cellular Data Only | 651 | 21.8% |
| Satellite Internet | 360 | 12.0% |
| No Internet | 893 | 29.9% |
| Total | 2,991 | 100.0% |
Humphreys County Summary
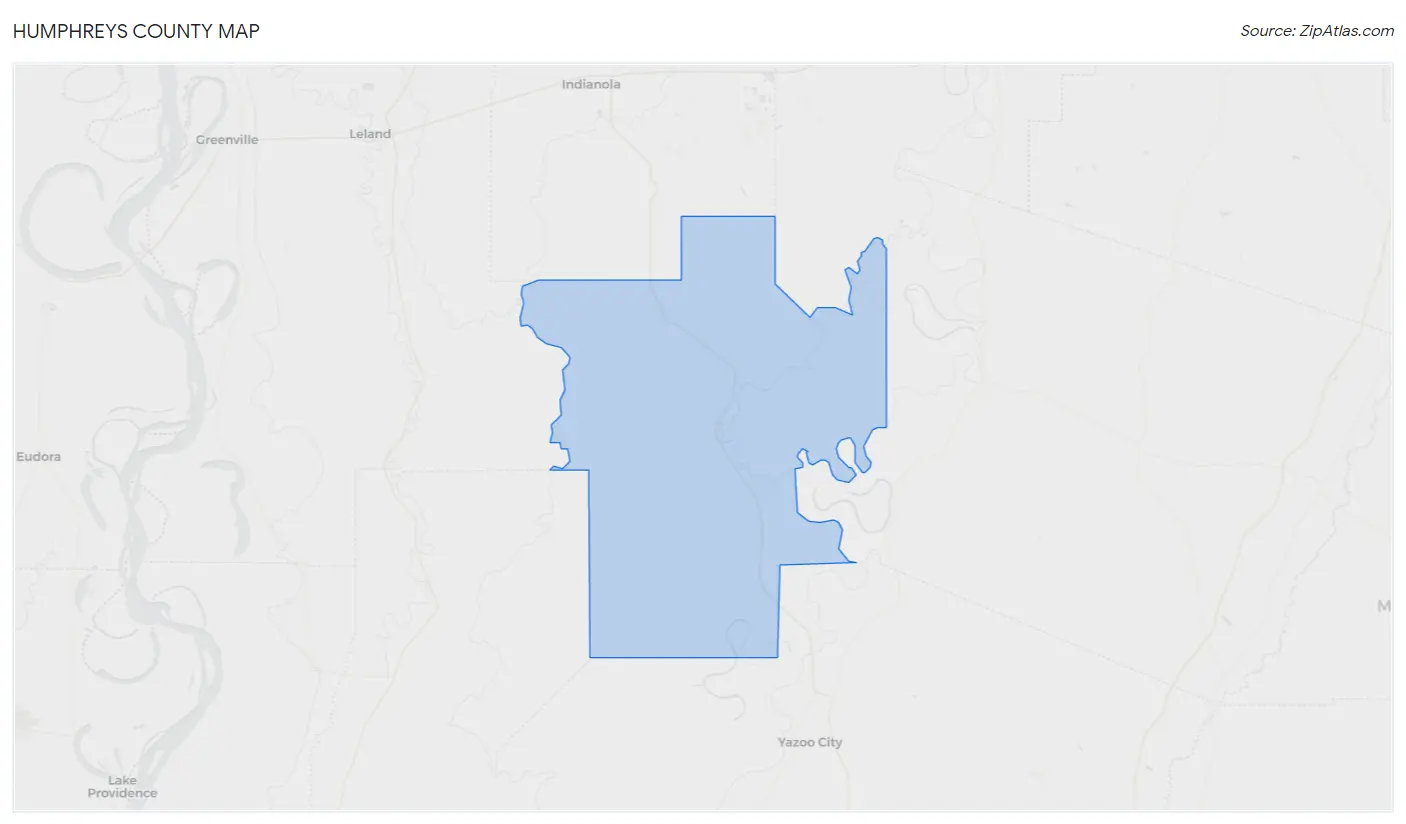
Humphreys County is located in the Mississippi Delta region of the state of Mississippi. It is bordered by Yazoo County to the north, Holmes County to the east, Sharkey County to the south, and Sunflower County to the west. The county seat is Belzoni, and the county has a total area of 576 square miles.
History
Humphreys County was established in 1823 and named for Benjamin G. Humphreys, a former governor of Mississippi. The county was originally part of Yazoo County, but was split off in 1823. The county was largely agricultural, with cotton being the main crop. The county was also home to several Native American tribes, including the Choctaw, Chickasaw, and Natchez.
In the late 19th century, the county was home to several large plantations, and the population was largely African American. During the Civil War, the county was the site of several battles, including the Battle of Belzoni. After the war, the county was largely agricultural, with cotton being the main crop.
In the early 20th century, the county was home to several large lumber mills, and the population began to grow. The county was also home to several large African American churches, and the county was a center of the civil rights movement in the 1960s.
Geography
Humphreys County is located in the Mississippi Delta region of the state of Mississippi. It is bordered by Yazoo County to the north, Holmes County to the east, Sharkey County to the south, and Sunflower County to the west. The county has a total area of 576 square miles, and is mostly flat, with some rolling hills in the northern part of the county. The county is drained by the Yazoo River, which flows through the county from north to south.
The county is home to several state parks, including the Belzoni State Wildlife Management Area, the Humphreys County State Wildlife Management Area, and the Humphreys County State Park. The county is also home to several lakes, including Lake Humphreys, Lake Belzoni, and Lake Sharkey.
Economy
Humphreys County is largely agricultural, with cotton being the main crop. The county is also home to several large lumber mills, and the county is a major producer of timber. The county is also home to several manufacturing plants, including a paper mill and a furniture factory.
The county is home to several large employers, including the Belzoni-Humphreys County Hospital, the Belzoni-Humphreys County School District, and the Belzoni-Humphreys County Public Library. The county is also home to several small businesses, including restaurants, retail stores, and service providers.
Demographics
As of the 2010 census, the population of Humphreys County was 9,375. The population is largely African American, with a small white minority. The median household income is $25,945, and the median family income is $31,945. The unemployment rate is 8.2%, and the poverty rate is 28.3%.
Common Questions
What is Per Capita Income in Humphreys County?
Per Capita income in Humphreys County is $24,506.
What is the Median Family Income in Humphreys County?
Median Family Income in Humphreys County is $34,909.
What is the Median Household income in Humphreys County?
Median Household Income in Humphreys County is $31,907.
What is Income or Wage Gap in Humphreys County?
Income or Wage Gap in Humphreys County is 20.5%.
Women in Humphreys County earn 79.5 cents for every dollar earned by a man.
What is Inequality or Gini Index in Humphreys County?
Inequality or Gini Index in Humphreys County is 0.59.
What is the Total Population of Humphreys County?
Total Population of Humphreys County is 7,744.
What is the Total Male Population of Humphreys County?
Total Male Population of Humphreys County is 3,538.
What is the Total Female Population of Humphreys County?
Total Female Population of Humphreys County is 4,206.
What is the Ratio of Males per 100 Females in Humphreys County?
There are 84.12 Males per 100 Females in Humphreys County.
What is the Ratio of Females per 100 Males in Humphreys County?
There are 118.88 Females per 100 Males in Humphreys County.
What is the Median Population Age in Humphreys County?
Median Population Age in Humphreys County is 38.4 Years.
What is the Average Family Size in Humphreys County
Average Family Size in Humphreys County is 3.2 People.
What is the Average Household Size in Humphreys County
Average Household Size in Humphreys County is 2.6 People.
How Large is the Labor Force in Humphreys County?
There are 2,980 People in the Labor Forcein in Humphreys County.
What is the Percentage of People in the Labor Force in Humphreys County?
49.6% of People are in the Labor Force in Humphreys County.
What is the Unemployment Rate in Humphreys County?
Unemployment Rate in Humphreys County is 13.7%.