Grenada County, MS Map & Demographics
Grenada County Map
Grenada County Overview
$27,128
PER CAPITA INCOME
$62,879
AVG FAMILY INCOME
$45,745
AVG HOUSEHOLD INCOME
25.5%
WAGE / INCOME GAP [ % ]
74.5¢/ $1
WAGE / INCOME GAP [ $ ]
0.50
INEQUALITY / GINI INDEX
21,474
TOTAL POPULATION
10,391
MALE POPULATION
11,083
FEMALE POPULATION
93.76
MALES / 100 FEMALES
106.66
FEMALES / 100 MALES
38.4
MEDIAN AGE
3.1
AVG FAMILY SIZE
2.5
AVG HOUSEHOLD SIZE
9,435
LABOR FORCE [ PEOPLE ]
55.1%
PERCENT IN LABOR FORCE
4.1%
UNEMPLOYMENT RATE
Grenada County Area Codes
Income in Grenada County
Income Overview in Grenada County
Per Capita Income in Grenada County is $27,128, while median incomes of families and households are $62,879 and $45,745 respectively.
| Characteristic | Number | Measure |
| Per Capita Income | 21,474 | $27,128 |
| Median Family Income | 5,370 | $62,879 |
| Mean Family Income | 5,370 | $83,758 |
| Median Household Income | 8,434 | $45,745 |
| Mean Household Income | 8,434 | $67,233 |
| Income Deficit | 5,370 | $0 |
| Wage / Income Gap (%) | 21,474 | 25.51% |
| Wage / Income Gap ($) | 21,474 | 74.49¢ per $1 |
| Gini / Inequality Index | 21,474 | 0.50 |
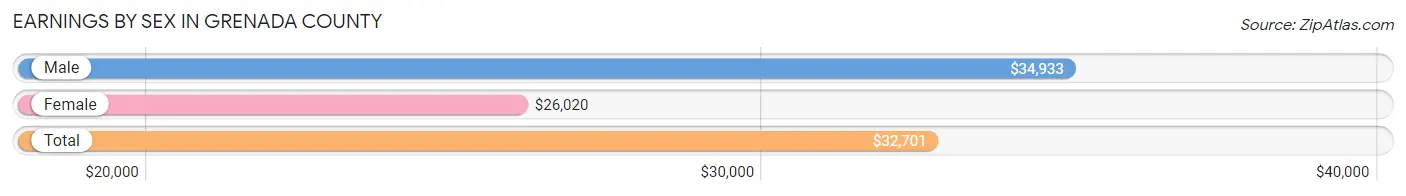
Earnings by Sex in Grenada County
Average Earnings in Grenada County are $32,701, $34,933 for men and $26,020 for women, a difference of 25.5%.
| Sex | Number | Average Earnings |
| Male | 4,843 (50.5%) | $34,933 |
| Female | 4,755 (49.5%) | $26,020 |
| Total | 9,598 (100.0%) | $32,701 |
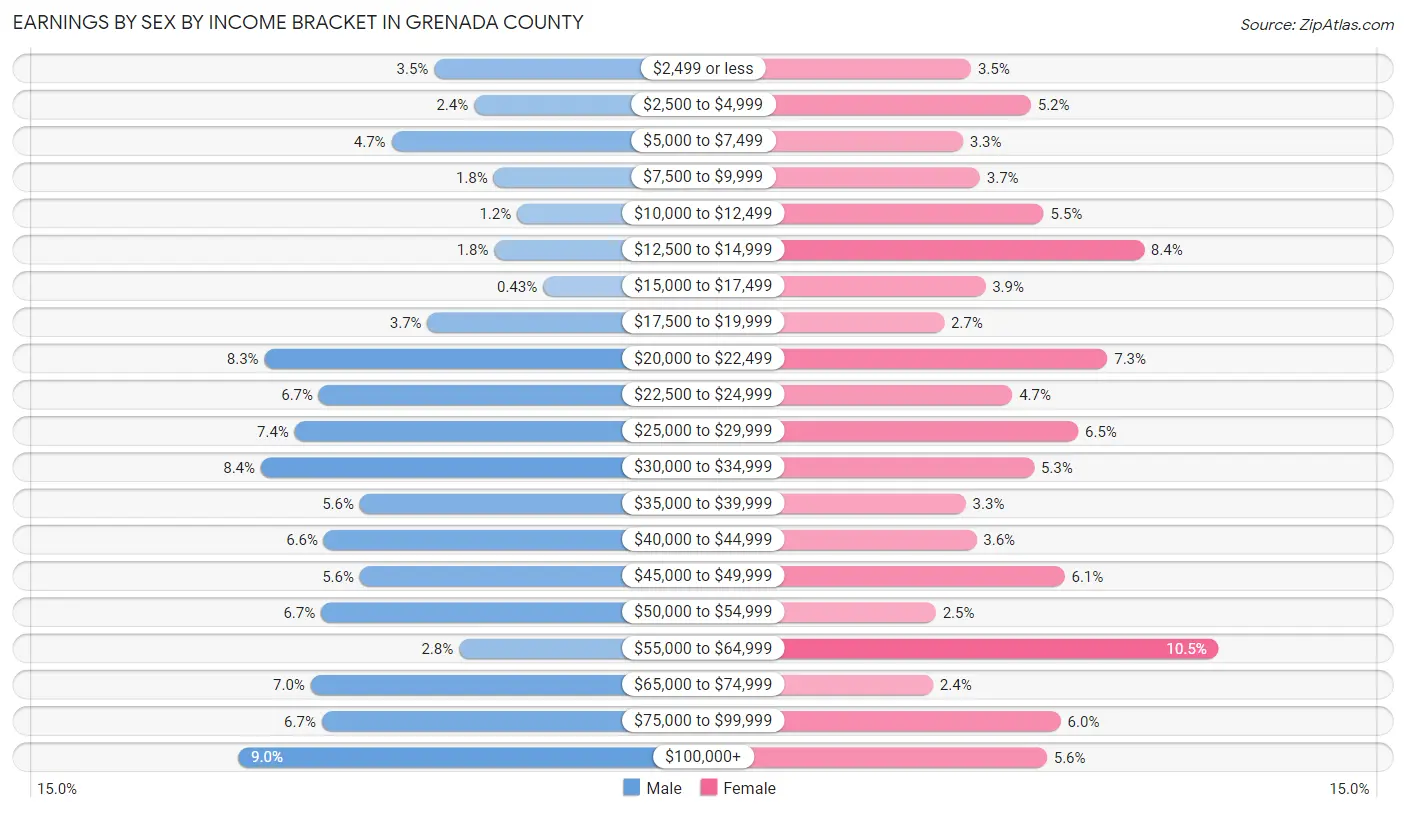
Earnings by Sex by Income Bracket in Grenada County
The most common earnings brackets in Grenada County are $100,000+ for men (436 | 9.0%) and $55,000 to $64,999 for women (497 | 10.4%).
| Income | Male | Female |
| $2,499 or less | 169 (3.5%) | 166 (3.5%) |
| $2,500 to $4,999 | 115 (2.4%) | 246 (5.2%) |
| $5,000 to $7,499 | 227 (4.7%) | 155 (3.3%) |
| $7,500 to $9,999 | 88 (1.8%) | 178 (3.7%) |
| $10,000 to $12,499 | 56 (1.2%) | 263 (5.5%) |
| $12,500 to $14,999 | 87 (1.8%) | 397 (8.4%) |
| $15,000 to $17,499 | 21 (0.4%) | 185 (3.9%) |
| $17,500 to $19,999 | 178 (3.7%) | 130 (2.7%) |
| $20,000 to $22,499 | 400 (8.3%) | 348 (7.3%) |
| $22,500 to $24,999 | 326 (6.7%) | 221 (4.6%) |
| $25,000 to $29,999 | 359 (7.4%) | 309 (6.5%) |
| $30,000 to $34,999 | 405 (8.4%) | 250 (5.3%) |
| $35,000 to $39,999 | 270 (5.6%) | 159 (3.3%) |
| $40,000 to $44,999 | 319 (6.6%) | 173 (3.6%) |
| $45,000 to $49,999 | 270 (5.6%) | 291 (6.1%) |
| $50,000 to $54,999 | 323 (6.7%) | 119 (2.5%) |
| $55,000 to $64,999 | 135 (2.8%) | 497 (10.4%) |
| $65,000 to $74,999 | 337 (7.0%) | 115 (2.4%) |
| $75,000 to $99,999 | 322 (6.7%) | 286 (6.0%) |
| $100,000+ | 436 (9.0%) | 267 (5.6%) |
| Total | 4,843 (100.0%) | 4,755 (100.0%) |
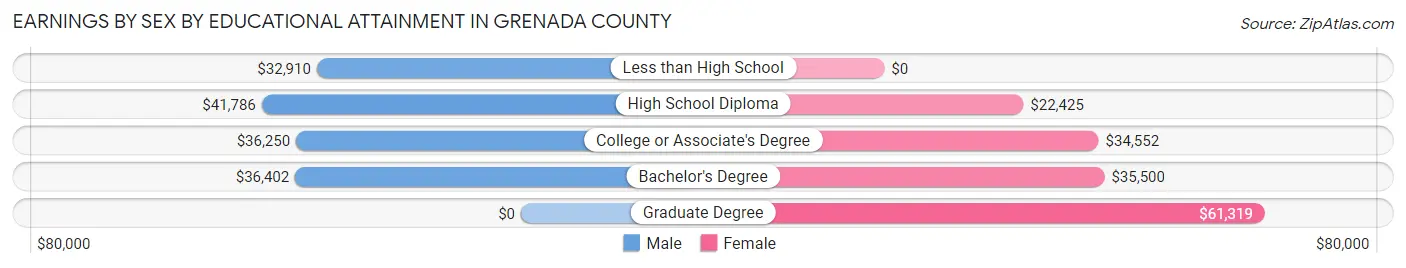
Earnings by Sex by Educational Attainment in Grenada County
Average earnings in Grenada County are $35,790 for men and $31,766 for women, a difference of 11.2%. Men with an educational attainment of high school diploma enjoy the highest average annual earnings of $41,786, while those with less than high school education earn the least with $32,910. Women with an educational attainment of graduate degree earn the most with the average annual earnings of $61,319, while those with high school diploma education have the smallest earnings of $22,425.
| Educational Attainment | Male Income | Female Income |
| Less than High School | $32,910 | $0 |
| High School Diploma | $41,786 | $22,425 |
| College or Associate's Degree | $36,250 | $34,552 |
| Bachelor's Degree | $36,402 | $35,500 |
| Graduate Degree | - | - |
| Total | $35,790 | $31,766 |
Family Income in Grenada County
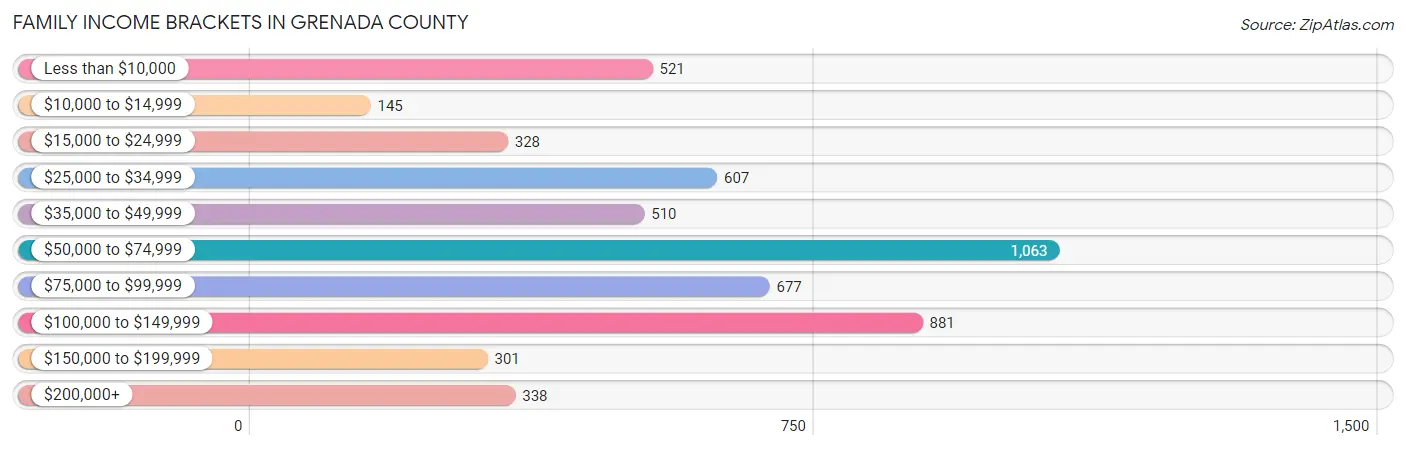
Family Income Brackets in Grenada County
According to the Grenada County family income data, there are 1,063 families falling into the $50,000 to $74,999 income range, which is the most common income bracket and makes up 19.8% of all families. Conversely, the $10,000 to $14,999 income bracket is the least frequent group with only 145 families (2.7%) belonging to this category.
| Income Bracket | # Families | % Families |
| Less than $10,000 | 521 | 9.7% |
| $10,000 to $14,999 | 145 | 2.7% |
| $15,000 to $24,999 | 328 | 6.1% |
| $25,000 to $34,999 | 607 | 11.3% |
| $35,000 to $49,999 | 510 | 9.5% |
| $50,000 to $74,999 | 1,063 | 19.8% |
| $75,000 to $99,999 | 677 | 12.6% |
| $100,000 to $149,999 | 881 | 16.4% |
| $150,000 to $199,999 | 301 | 5.6% |
| $200,000+ | 338 | 6.3% |
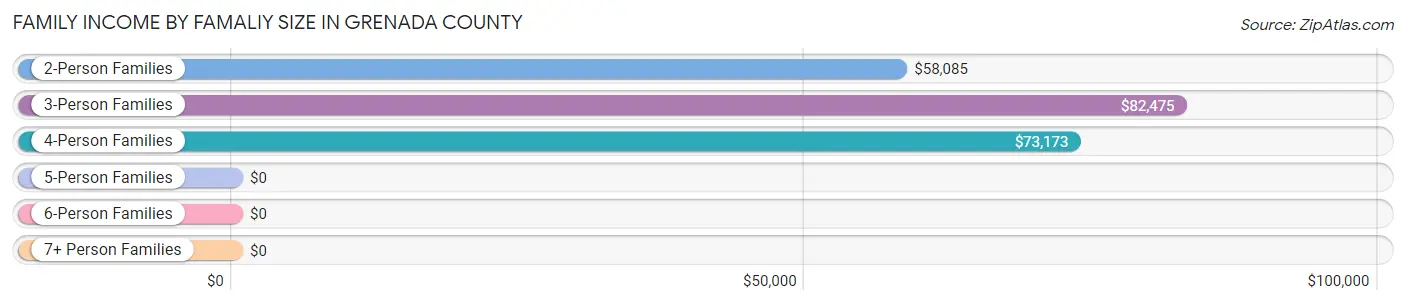
Family Income by Famaliy Size in Grenada County
3-person families (1,225 | 22.8%) account for the highest median family income in Grenada County with $82,475 per family, while 2-person families (2,879 | 53.6%) have the highest median income of $29,042 per family member.
| Income Bracket | # Families | Median Income |
| 2-Person Families | 2,879 (53.6%) | $58,085 |
| 3-Person Families | 1,225 (22.8%) | $82,475 |
| 4-Person Families | 691 (12.9%) | $73,173 |
| 5-Person Families | 478 (8.9%) | $0 |
| 6-Person Families | 65 (1.2%) | $0 |
| 7+ Person Families | 32 (0.6%) | $0 |
| Total | 5,370 (100.0%) | $62,879 |
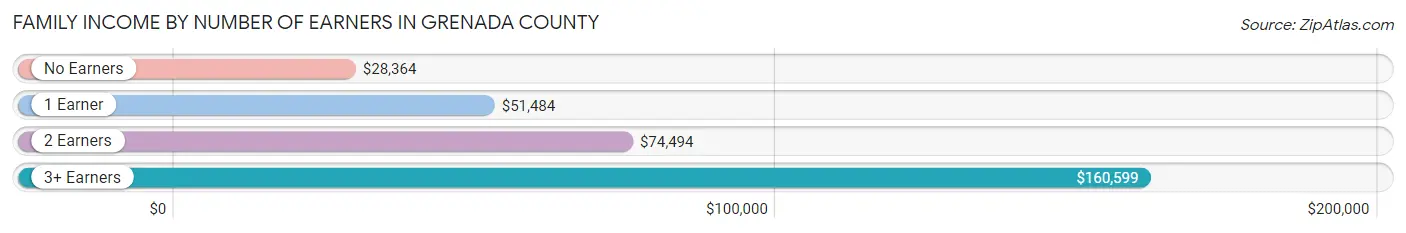
Family Income by Number of Earners in Grenada County
The median family income in Grenada County is $62,879, with families comprising 3+ earners (513) having the highest median family income of $160,599, while families with no earners (1,309) have the lowest median family income of $28,364, accounting for 9.6% and 24.4% of families, respectively.
| Number of Earners | # Families | Median Income |
| No Earners | 1,309 (24.4%) | $28,364 |
| 1 Earner | 1,681 (31.3%) | $51,484 |
| 2 Earners | 1,867 (34.8%) | $74,494 |
| 3+ Earners | 513 (9.6%) | $160,599 |
| Total | 5,370 (100.0%) | $62,879 |
Household Income in Grenada County
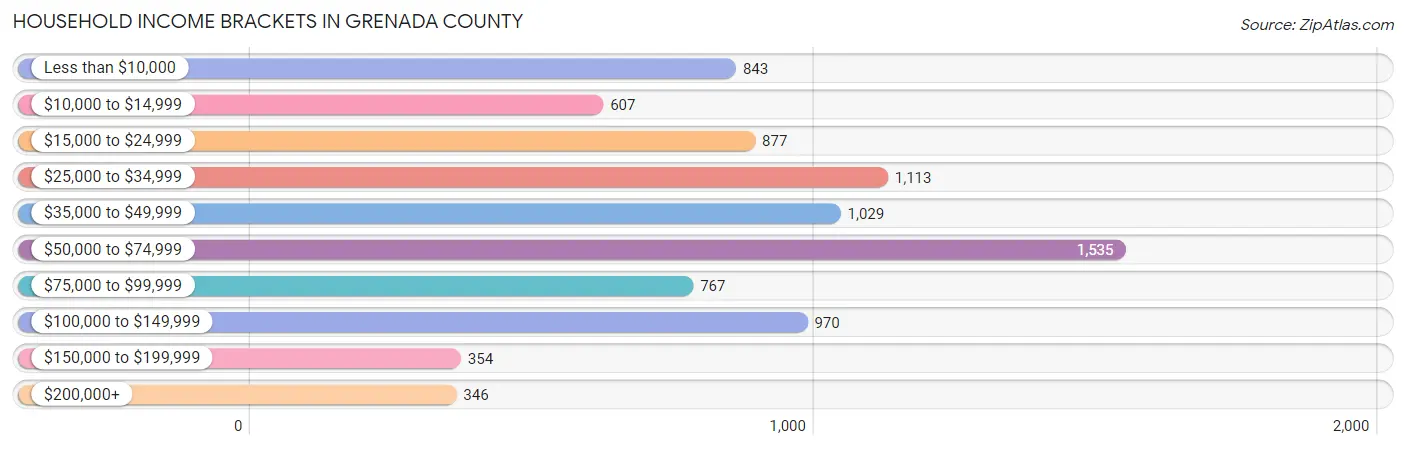
Household Income Brackets in Grenada County
With 1,535 households falling in the category, the $50,000 to $74,999 income range is the most frequent in Grenada County, accounting for 18.2% of all households. In contrast, only 346 households (4.1%) fall into the $200,000+ income bracket, making it the least populous group.
| Income Bracket | # Households | % Households |
| Less than $10,000 | 843 | 10.0% |
| $10,000 to $14,999 | 607 | 7.2% |
| $15,000 to $24,999 | 877 | 10.4% |
| $25,000 to $34,999 | 1,113 | 13.2% |
| $35,000 to $49,999 | 1,029 | 12.2% |
| $50,000 to $74,999 | 1,535 | 18.2% |
| $75,000 to $99,999 | 767 | 9.1% |
| $100,000 to $149,999 | 970 | 11.5% |
| $150,000 to $199,999 | 354 | 4.2% |
| $200,000+ | 346 | 4.1% |
Household Income by Householder Age in Grenada County
The median household income in Grenada County is $45,745, with the highest median household income of $53,679 found in the 45 to 64 years age bracket for the primary householder. A total of 3,198 households (37.9%) fall into this category. Meanwhile, the 65+ years age bracket for the primary householder has the lowest median household income of $36,159, with 2,549 households (30.2%) in this group.
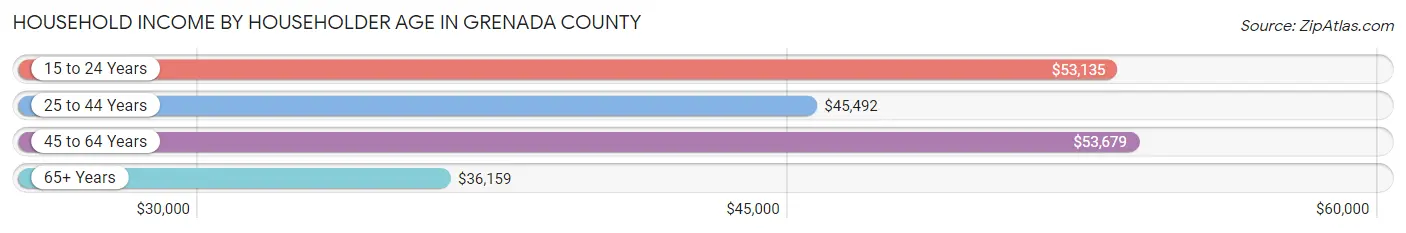
| Income Bracket | # Households | Median Income |
| 15 to 24 Years | 301 (3.6%) | $53,135 |
| 25 to 44 Years | 2,386 (28.3%) | $45,492 |
| 45 to 64 Years | 3,198 (37.9%) | $53,679 |
| 65+ Years | 2,549 (30.2%) | $36,159 |
| Total | 8,434 (100.0%) | $45,745 |
Poverty in Grenada County
Income Below Poverty by Sex and Age in Grenada County
With 20.1% poverty level for males and 24.1% for females among the residents of Grenada County, 15 year old males and 15 year old females are the most vulnerable to poverty, with 54 males (64.3%) and 31 females (100.0%) in their respective age groups living below the poverty level.
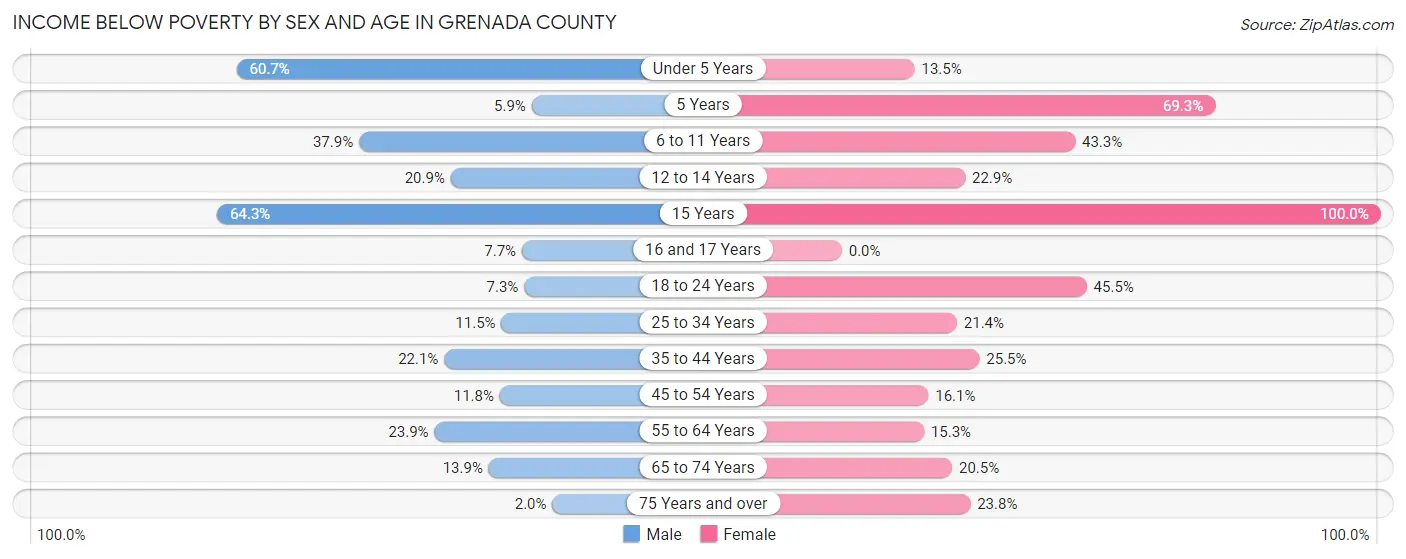
| Age Bracket | Male | Female |
| Under 5 Years | 401 (60.7%) | 85 (13.5%) |
| 5 Years | 10 (5.9%) | 133 (69.3%) |
| 6 to 11 Years | 352 (37.9%) | 362 (43.3%) |
| 12 to 14 Years | 65 (20.9%) | 75 (22.9%) |
| 15 Years | 54 (64.3%) | 31 (100.0%) |
| 16 and 17 Years | 37 (7.7%) | 0 (0.0%) |
| 18 to 24 Years | 59 (7.3%) | 395 (45.5%) |
| 25 to 34 Years | 147 (11.5%) | 301 (21.4%) |
| 35 to 44 Years | 299 (22.1%) | 324 (25.5%) |
| 45 to 54 Years | 123 (11.8%) | 225 (16.1%) |
| 55 to 64 Years | 330 (23.9%) | 223 (15.2%) |
| 65 to 74 Years | 151 (13.9%) | 255 (20.5%) |
| 75 Years and over | 11 (2.0%) | 221 (23.8%) |
| Total | 2,039 (20.1%) | 2,630 (24.1%) |
Income Above Poverty by Sex and Age in Grenada County
According to the poverty statistics in Grenada County, males aged 75 years and over and females aged 16 and 17 years are the age groups that are most secure financially, with 98.0% of males and 100.0% of females in these age groups living above the poverty line.
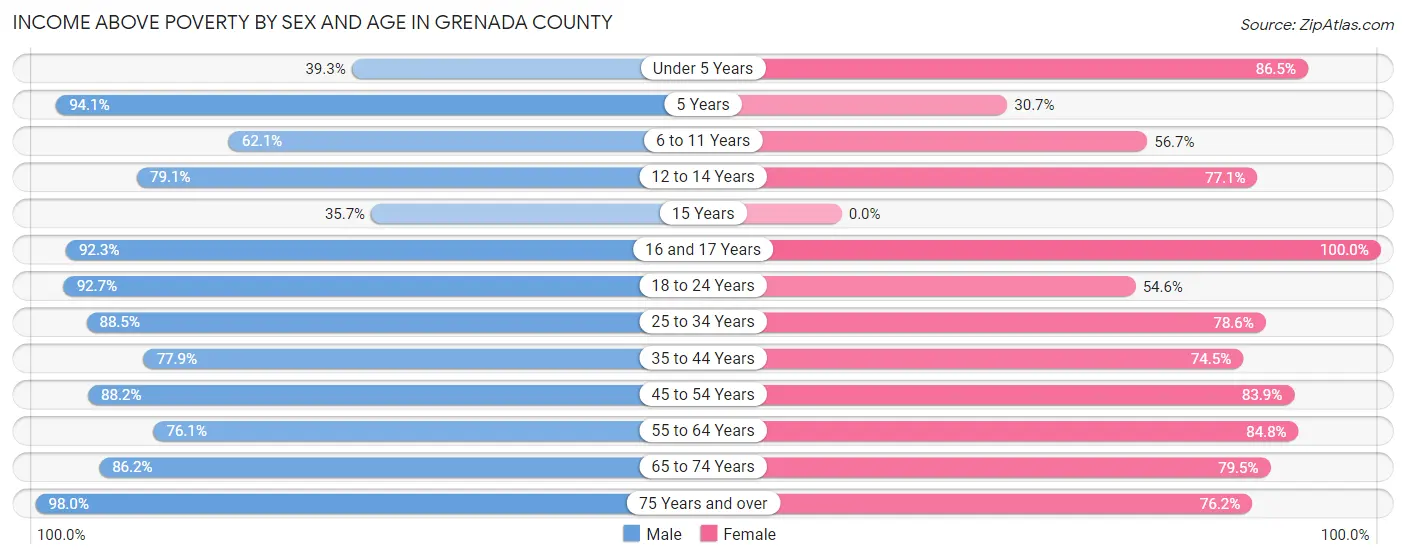
| Age Bracket | Male | Female |
| Under 5 Years | 260 (39.3%) | 544 (86.5%) |
| 5 Years | 160 (94.1%) | 59 (30.7%) |
| 6 to 11 Years | 576 (62.1%) | 474 (56.7%) |
| 12 to 14 Years | 246 (79.1%) | 253 (77.1%) |
| 15 Years | 30 (35.7%) | 0 (0.0%) |
| 16 and 17 Years | 444 (92.3%) | 295 (100.0%) |
| 18 to 24 Years | 752 (92.7%) | 474 (54.5%) |
| 25 to 34 Years | 1,131 (88.5%) | 1,108 (78.6%) |
| 35 to 44 Years | 1,053 (77.9%) | 945 (74.5%) |
| 45 to 54 Years | 920 (88.2%) | 1,176 (83.9%) |
| 55 to 64 Years | 1,049 (76.1%) | 1,239 (84.8%) |
| 65 to 74 Years | 939 (86.2%) | 991 (79.5%) |
| 75 Years and over | 529 (98.0%) | 706 (76.2%) |
| Total | 8,089 (79.9%) | 8,264 (75.9%) |
Income Below Poverty Among Married-Couple Families in Grenada County
The poverty statistics for married-couple families in Grenada County show that 9.4% or 330 of the total 3,514 families live below the poverty line. Families with 5 or more children have the highest poverty rate of 25.0%, comprising of 8 families. On the other hand, families with no children have the lowest poverty rate of 5.8%, which includes 133 families.
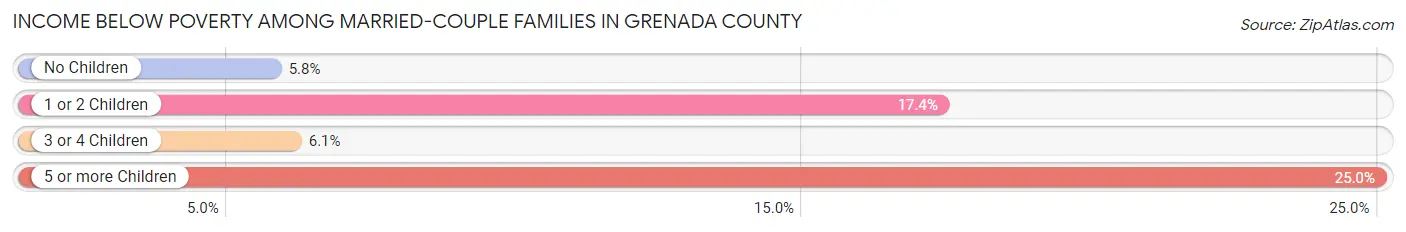
| Children | Above Poverty | Below Poverty |
| No Children | 2,177 (94.2%) | 133 (5.8%) |
| 1 or 2 Children | 860 (82.6%) | 181 (17.4%) |
| 3 or 4 Children | 123 (93.9%) | 8 (6.1%) |
| 5 or more Children | 24 (75.0%) | 8 (25.0%) |
| Total | 3,184 (90.6%) | 330 (9.4%) |
Income Below Poverty Among Single-Parent Households in Grenada County
According to the poverty data in Grenada County, 11.1% or 44 single-father households and 35.8% or 523 single-mother households are living below the poverty line. Among single-father households, those with 3 or 4 children have the highest poverty rate, with 21 households (100.0%) experiencing poverty. Likewise, among single-mother households, those with 3 or 4 children have the highest poverty rate, with 158 households (100.0%) falling below the poverty line.
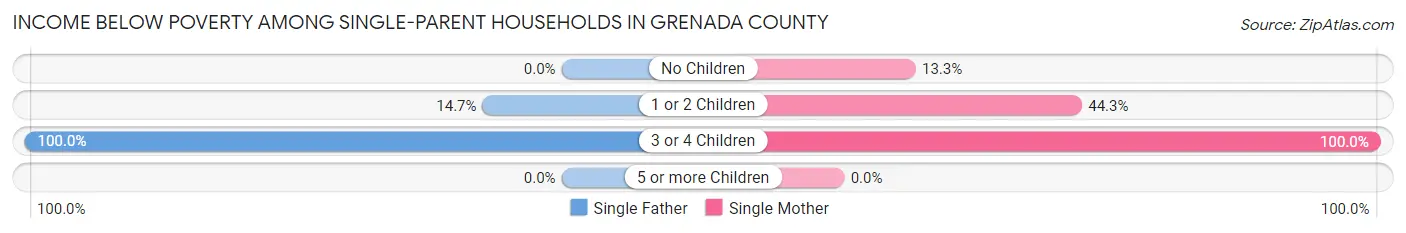
| Children | Single Father | Single Mother |
| No Children | 0 (0.0%) | 91 (13.3%) |
| 1 or 2 Children | 23 (14.7%) | 274 (44.3%) |
| 3 or 4 Children | 21 (100.0%) | 158 (100.0%) |
| 5 or more Children | 0 (0.0%) | 0 (0.0%) |
| Total | 44 (11.1%) | 523 (35.8%) |
Income Below Poverty Among Married-Couple vs Single-Parent Households in Grenada County
The poverty data for Grenada County shows that 330 of the married-couple family households (9.4%) and 567 of the single-parent households (30.5%) are living below the poverty level. Within the married-couple family households, those with 5 or more children have the highest poverty rate, with 8 households (25.0%) falling below the poverty line. Among the single-parent households, those with 3 or 4 children have the highest poverty rate, with 179 household (100.0%) living below poverty.
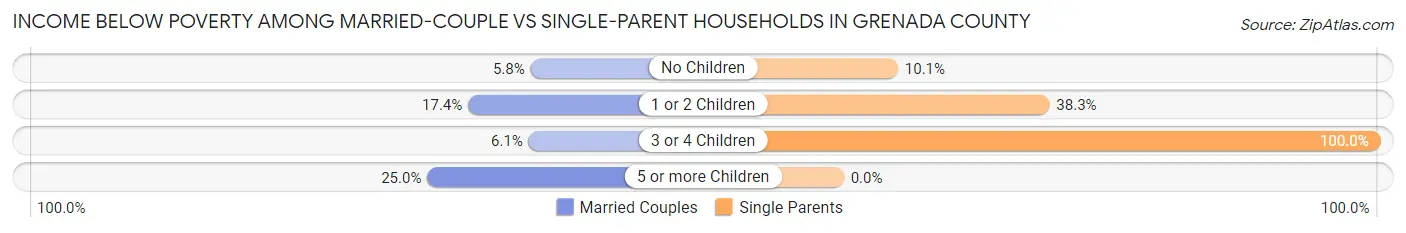
| Children | Married-Couple Families | Single-Parent Households |
| No Children | 133 (5.8%) | 91 (10.1%) |
| 1 or 2 Children | 181 (17.4%) | 297 (38.3%) |
| 3 or 4 Children | 8 (6.1%) | 179 (100.0%) |
| 5 or more Children | 8 (25.0%) | 0 (0.0%) |
| Total | 330 (9.4%) | 567 (30.5%) |
Race in Grenada County
The most populous races in Grenada County are White / Caucasian (11,079 | 51.6%), Black / African American (9,645 | 44.9%), and Two or more Races (555 | 2.6%).
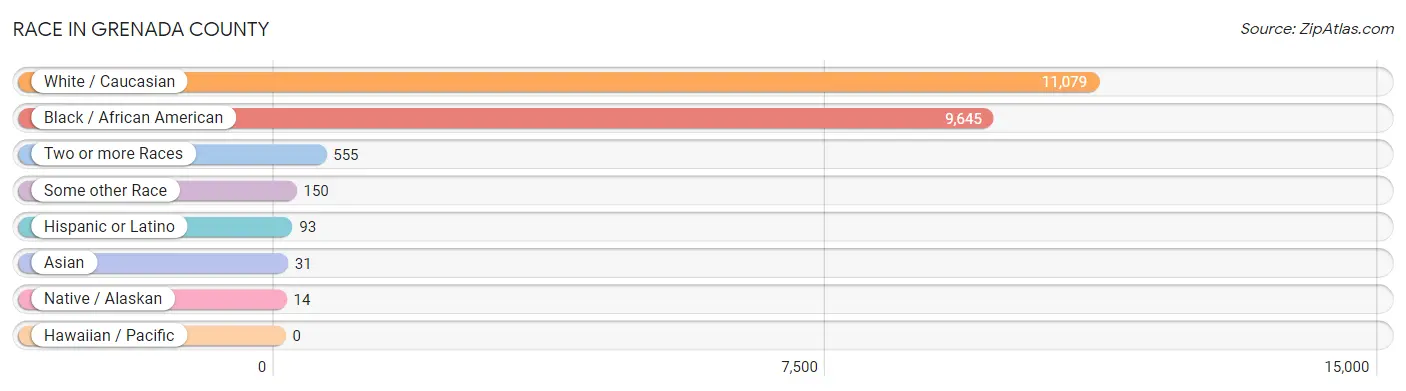
| Race | # Population | % Population |
| Asian | 31 | 0.1% |
| Black / African American | 9,645 | 44.9% |
| Hawaiian / Pacific | 0 | 0.0% |
| Hispanic or Latino | 93 | 0.4% |
| Native / Alaskan | 14 | 0.1% |
| White / Caucasian | 11,079 | 51.6% |
| Two or more Races | 555 | 2.6% |
| Some other Race | 150 | 0.7% |
| Total | 21,474 | 100.0% |
Ancestry in Grenada County
The most populous ancestries reported in Grenada County are American (1,998 | 9.3%), English (1,445 | 6.7%), Irish (1,379 | 6.4%), German (429 | 2.0%), and Italian (417 | 1.9%), together accounting for 26.4% of all Grenada County residents.
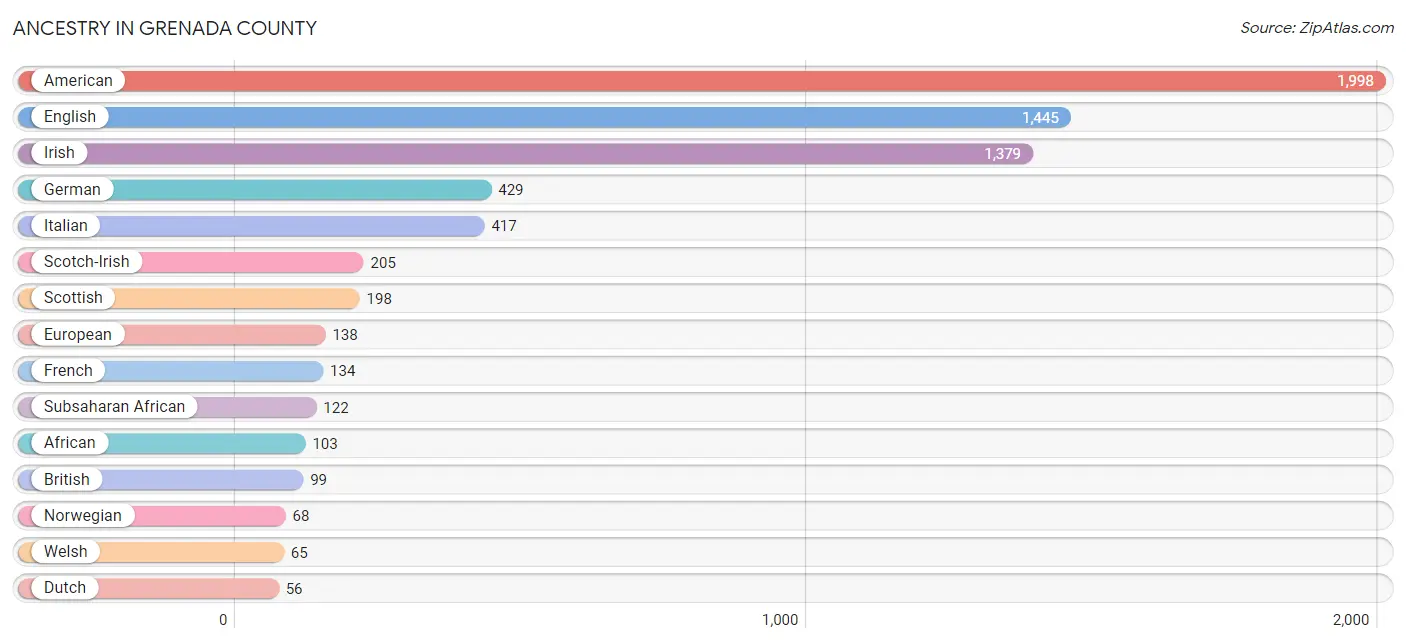
| Ancestry | # Population | % Population |
| African | 103 | 0.5% |
| American | 1,998 | 9.3% |
| British | 99 | 0.5% |
| Cherokee | 30 | 0.1% |
| Choctaw | 21 | 0.1% |
| Creek | 2 | 0.0% |
| Dutch | 56 | 0.3% |
| English | 1,445 | 6.7% |
| European | 138 | 0.6% |
| French | 134 | 0.6% |
| French Canadian | 12 | 0.1% |
| German | 429 | 2.0% |
| Greek | 22 | 0.1% |
| Irish | 1,379 | 6.4% |
| Israeli | 49 | 0.2% |
| Italian | 417 | 1.9% |
| Korean | 10 | 0.1% |
| Mexican | 50 | 0.2% |
| Nigerian | 19 | 0.1% |
| Norwegian | 68 | 0.3% |
| Polish | 17 | 0.1% |
| Scandinavian | 7 | 0.0% |
| Scotch-Irish | 205 | 0.9% |
| Scottish | 198 | 0.9% |
| Subsaharan African | 122 | 0.6% |
| Thai | 26 | 0.1% |
| Welsh | 65 | 0.3% | View All 27 Rows |
Immigrants in Grenada County
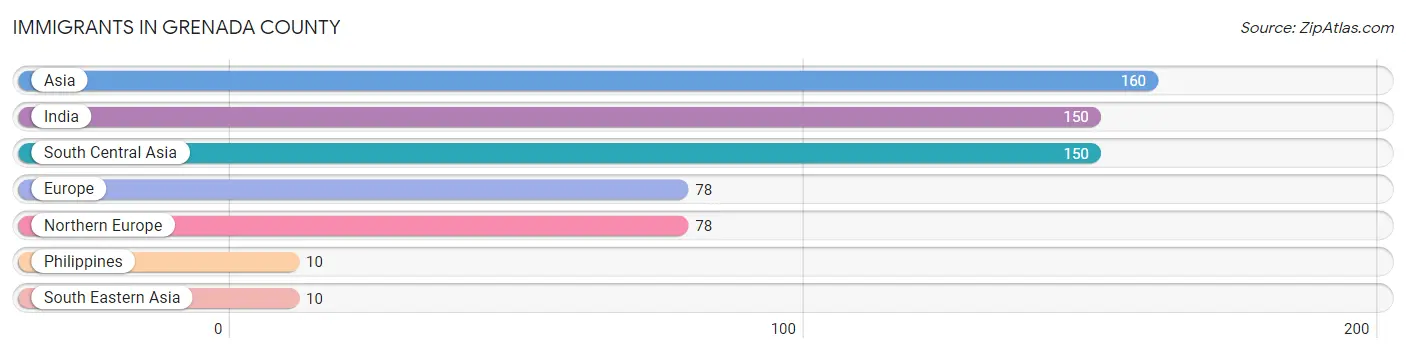
The most numerous immigrant groups reported in Grenada County came from Asia (160 | 0.7%), India (150 | 0.7%), South Central Asia (150 | 0.7%), Europe (78 | 0.4%), and Northern Europe (78 | 0.4%), together accounting for 2.9% of all Grenada County residents.
| Immigration Origin | # Population | % Population |
| Asia | 160 | 0.7% |
| Europe | 78 | 0.4% |
| India | 150 | 0.7% |
| Northern Europe | 78 | 0.4% |
| Philippines | 10 | 0.1% |
| South Central Asia | 150 | 0.7% |
| South Eastern Asia | 10 | 0.1% | View All 7 Rows |
Sex and Age in Grenada County
Sex and Age in Grenada County
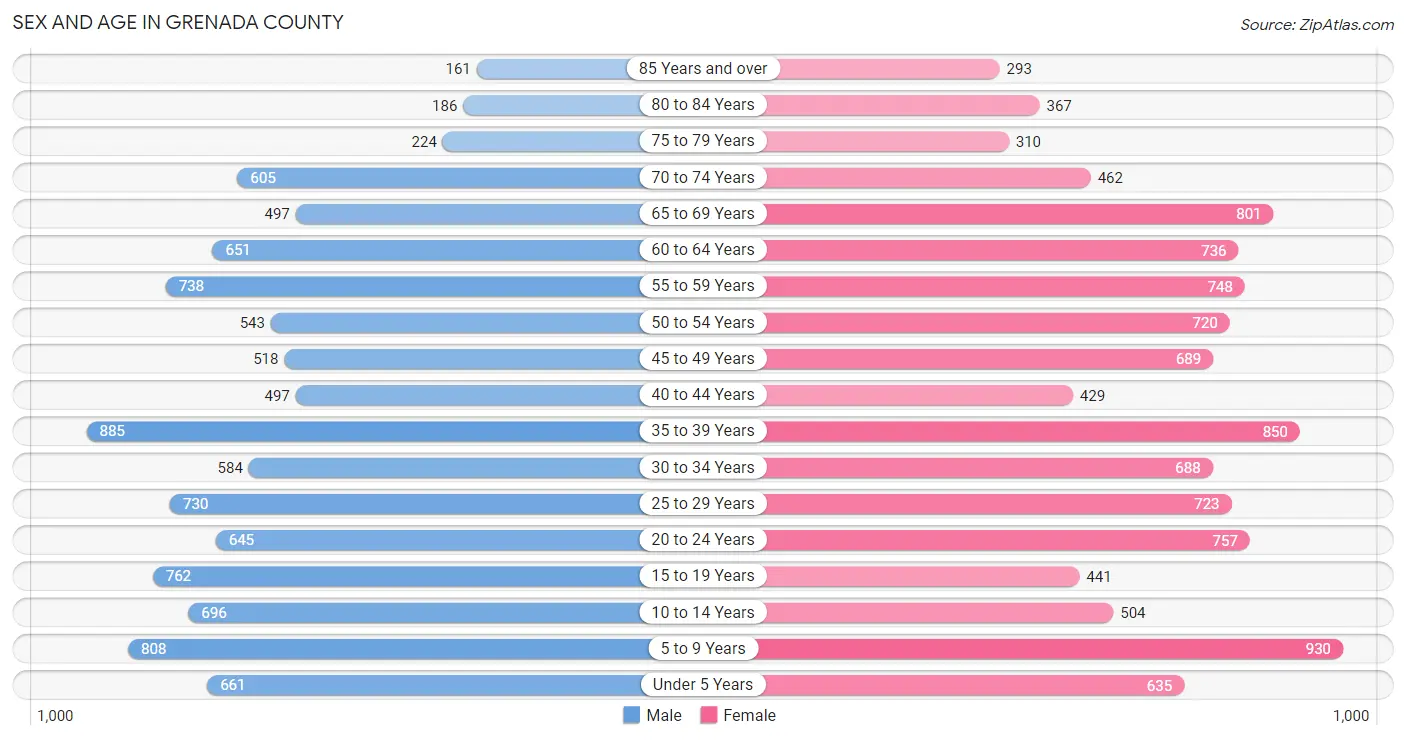
The most populous age groups in Grenada County are 35 to 39 Years (885 | 8.5%) for men and 5 to 9 Years (930 | 8.4%) for women.
| Age Bracket | Male | Female |
| Under 5 Years | 661 (6.4%) | 635 (5.7%) |
| 5 to 9 Years | 808 (7.8%) | 930 (8.4%) |
| 10 to 14 Years | 696 (6.7%) | 504 (4.5%) |
| 15 to 19 Years | 762 (7.3%) | 441 (4.0%) |
| 20 to 24 Years | 645 (6.2%) | 757 (6.8%) |
| 25 to 29 Years | 730 (7.0%) | 723 (6.5%) |
| 30 to 34 Years | 584 (5.6%) | 688 (6.2%) |
| 35 to 39 Years | 885 (8.5%) | 850 (7.7%) |
| 40 to 44 Years | 497 (4.8%) | 429 (3.9%) |
| 45 to 49 Years | 518 (5.0%) | 689 (6.2%) |
| 50 to 54 Years | 543 (5.2%) | 720 (6.5%) |
| 55 to 59 Years | 738 (7.1%) | 748 (6.8%) |
| 60 to 64 Years | 651 (6.3%) | 736 (6.6%) |
| 65 to 69 Years | 497 (4.8%) | 801 (7.2%) |
| 70 to 74 Years | 605 (5.8%) | 462 (4.2%) |
| 75 to 79 Years | 224 (2.2%) | 310 (2.8%) |
| 80 to 84 Years | 186 (1.8%) | 367 (3.3%) |
| 85 Years and over | 161 (1.5%) | 293 (2.6%) |
| Total | 10,391 (100.0%) | 11,083 (100.0%) |
Families and Households in Grenada County
Median Family Size in Grenada County
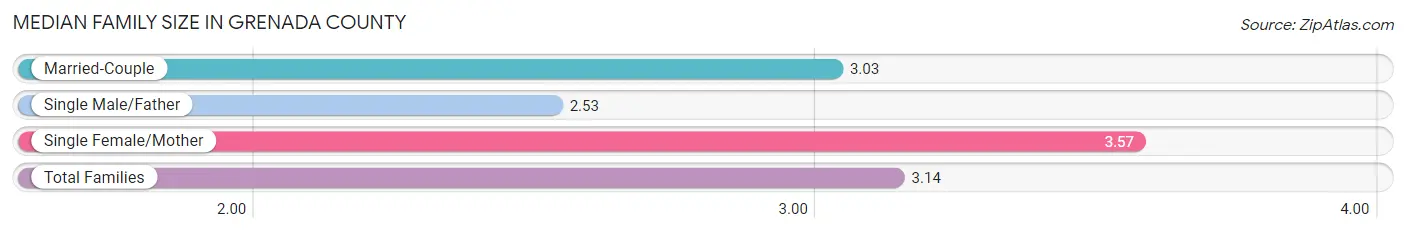
The median family size in Grenada County is 3.14 persons per family, with single female/mother families (1,461 | 27.2%) accounting for the largest median family size of 3.57 persons per family. On the other hand, single male/father families (395 | 7.4%) represent the smallest median family size with 2.53 persons per family.
| Family Type | # Families | Family Size |
| Married-Couple | 3,514 (65.4%) | 3.03 |
| Single Male/Father | 395 (7.4%) | 2.53 |
| Single Female/Mother | 1,461 (27.2%) | 3.57 |
| Total Families | 5,370 (100.0%) | 3.14 |
Median Household Size in Grenada County
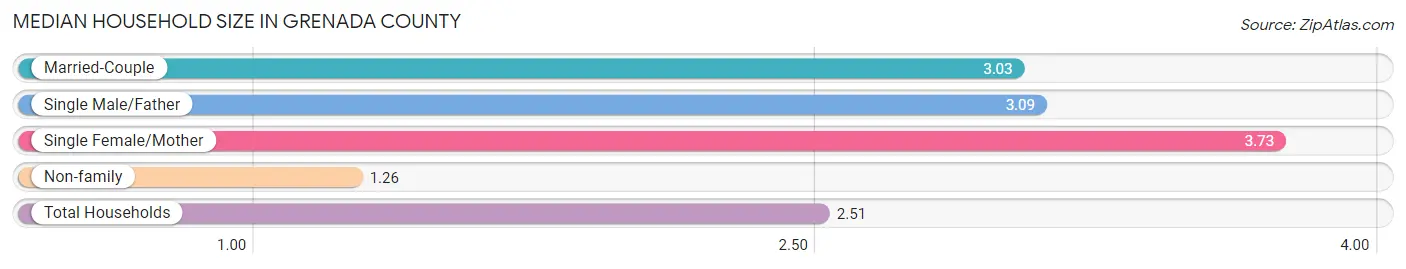
The median household size in Grenada County is 2.51 persons per household, with single female/mother households (1,461 | 17.3%) accounting for the largest median household size of 3.73 persons per household. non-family households (3,064 | 36.3%) represent the smallest median household size with 1.26 persons per household.
| Household Type | # Households | Household Size |
| Married-Couple | 3,514 (41.7%) | 3.03 |
| Single Male/Father | 395 (4.7%) | 3.09 |
| Single Female/Mother | 1,461 (17.3%) | 3.73 |
| Non-family | 3,064 (36.3%) | 1.26 |
| Total Households | 8,434 (100.0%) | 2.51 |
Household Size by Marriage Status in Grenada County
Out of a total of 8,434 households in Grenada County, 5,370 (63.7%) are family households, while 3,064 (36.3%) are nonfamily households. The most numerous type of family households are 2-person households, comprising 2,627, and the most common type of nonfamily households are 1-person households, comprising 2,566.
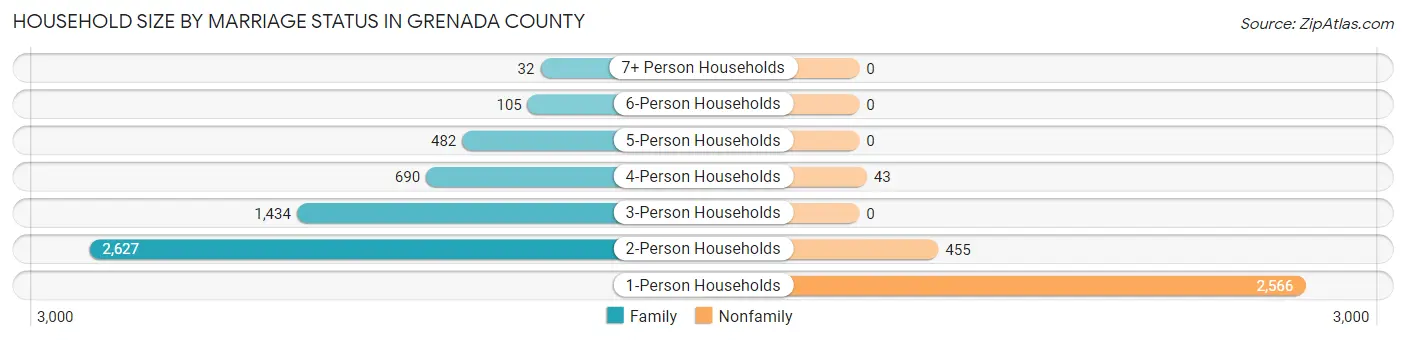
| Household Size | Family Households | Nonfamily Households |
| 1-Person Households | - | 2,566 (30.4%) |
| 2-Person Households | 2,627 (31.1%) | 455 (5.4%) |
| 3-Person Households | 1,434 (17.0%) | 0 (0.0%) |
| 4-Person Households | 690 (8.2%) | 43 (0.5%) |
| 5-Person Households | 482 (5.7%) | 0 (0.0%) |
| 6-Person Households | 105 (1.2%) | 0 (0.0%) |
| 7+ Person Households | 32 (0.4%) | 0 (0.0%) |
| Total | 5,370 (63.7%) | 3,064 (36.3%) |
Female Fertility in Grenada County
Fertility by Age in Grenada County
Average fertility rate in Grenada County is 84.0 births per 1,000 women. Women in the age bracket of 20 to 34 years have the highest fertility rate with 131.0 births per 1,000 women. Women in the age bracket of 20 to 34 years acount for 71.1% of all women with births.
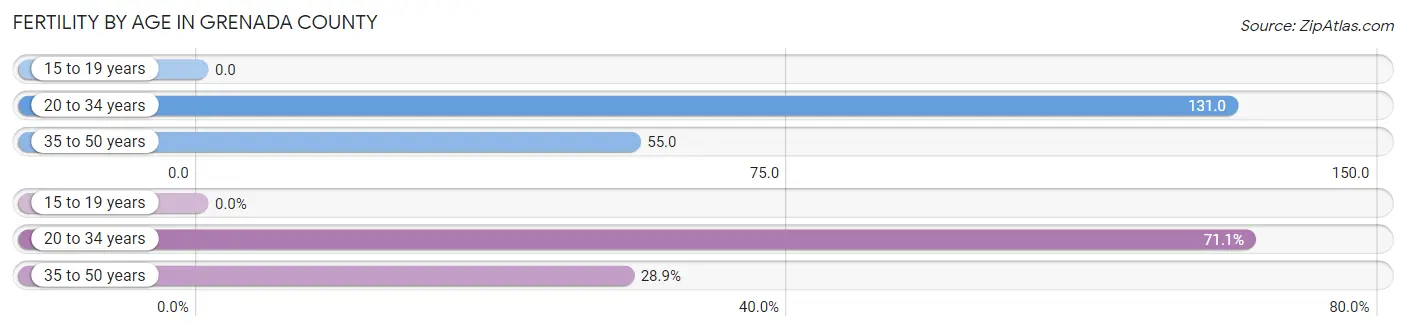
| Age Bracket | Women with Births | Births / 1,000 Women |
| 15 to 19 years | 0 (0.0%) | 0.0 |
| 20 to 34 years | 283 (71.1%) | 131.0 |
| 35 to 50 years | 115 (28.9%) | 55.0 |
| Total | 398 (100.0%) | 84.0 |
Fertility by Age by Marriage Status in Grenada County
72.9% of women with births (398) in Grenada County are married. The highest percentage of unmarried women with births falls into 20 to 34 years age bracket with 38.2% of them unmarried at the time of birth, while the lowest percentage of unmarried women with births belong to 35 to 50 years age bracket with 0.0% of them unmarried.
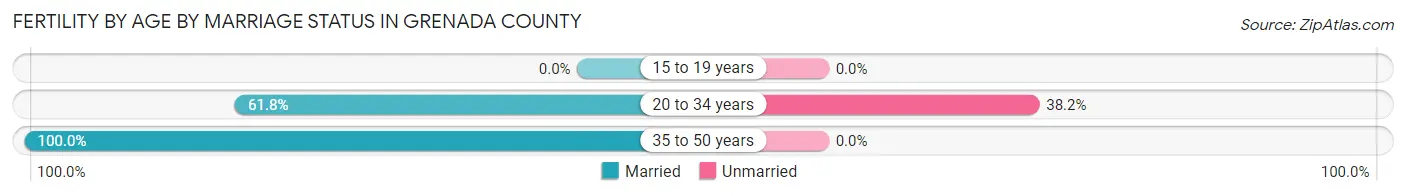
| Age Bracket | Married | Unmarried |
| 15 to 19 years | 0 (0.0%) | 0 (0.0%) |
| 20 to 34 years | 175 (61.8%) | 108 (38.2%) |
| 35 to 50 years | 115 (100.0%) | 0 (0.0%) |
| Total | 290 (72.9%) | 108 (27.1%) |
Fertility by Education in Grenada County
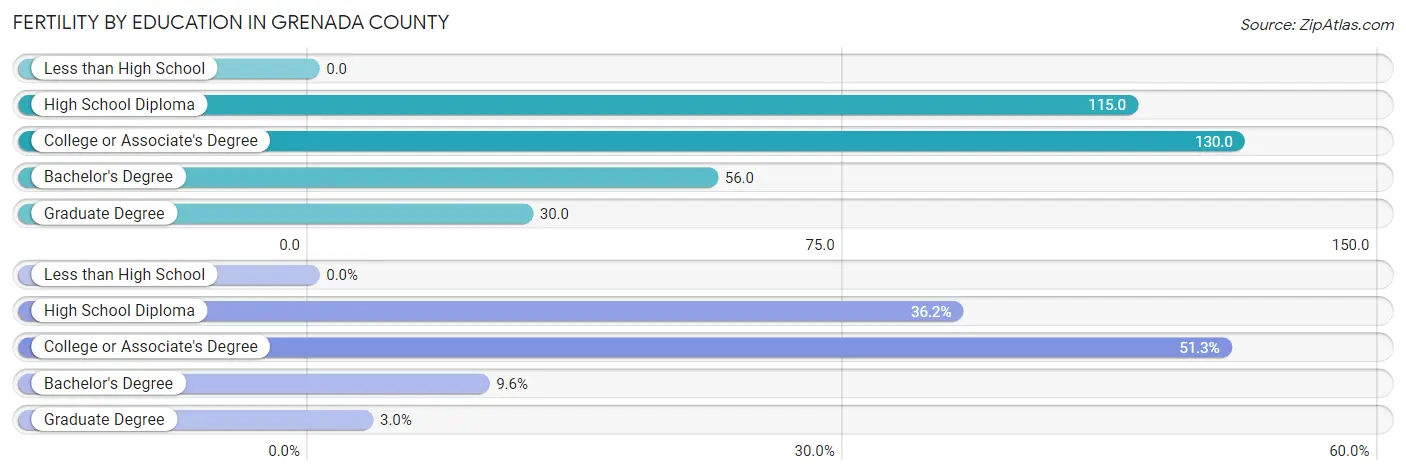
| Educational Attainment | Women with Births | Births / 1,000 Women |
| Less than High School | 0 (0.0%) | 0.0 |
| High School Diploma | 144 (36.2%) | 115.0 |
| College or Associate's Degree | 204 (51.3%) | 130.0 |
| Bachelor's Degree | 38 (9.6%) | 56.0 |
| Graduate Degree | 12 (3.0%) | 30.0 |
| Total | 398 (100.0%) | 84.0 |
Fertility by Education by Marriage Status in Grenada County
27.1% of women with births in Grenada County are unmarried. Women with the educational attainment of bachelor's degree are most likely to be married with 100.0% of them married at childbirth, while women with the educational attainment of high school diploma are least likely to be married with 41.0% of them unmarried at childbirth.
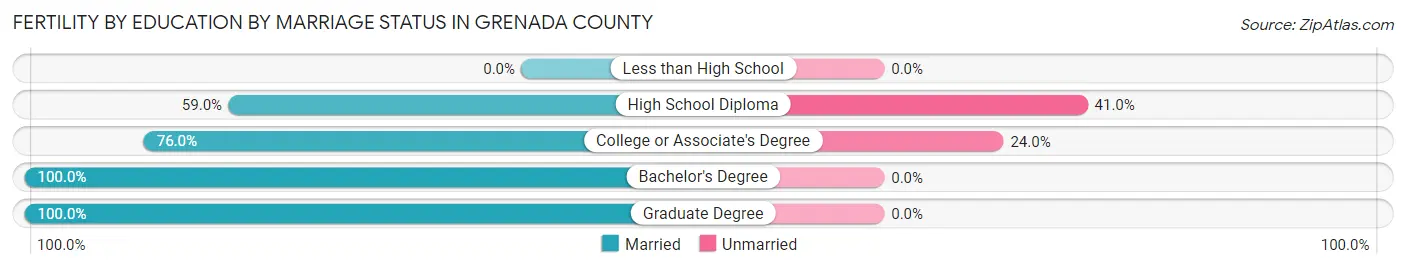
| Educational Attainment | Married | Unmarried |
| Less than High School | 0 (0.0%) | 0 (0.0%) |
| High School Diploma | 85 (59.0%) | 59 (41.0%) |
| College or Associate's Degree | 155 (76.0%) | 49 (24.0%) |
| Bachelor's Degree | 38 (100.0%) | 0 (0.0%) |
| Graduate Degree | 12 (100.0%) | 0 (0.0%) |
| Total | 290 (72.9%) | 108 (27.1%) |
Employment Characteristics in Grenada County
Employment by Class of Employer in Grenada County
Among the 8,902 employed individuals in Grenada County, private company employees (5,848 | 65.7%), local government employees (907 | 10.2%), and state government employees (717 | 8.1%) make up the most common classes of employment.
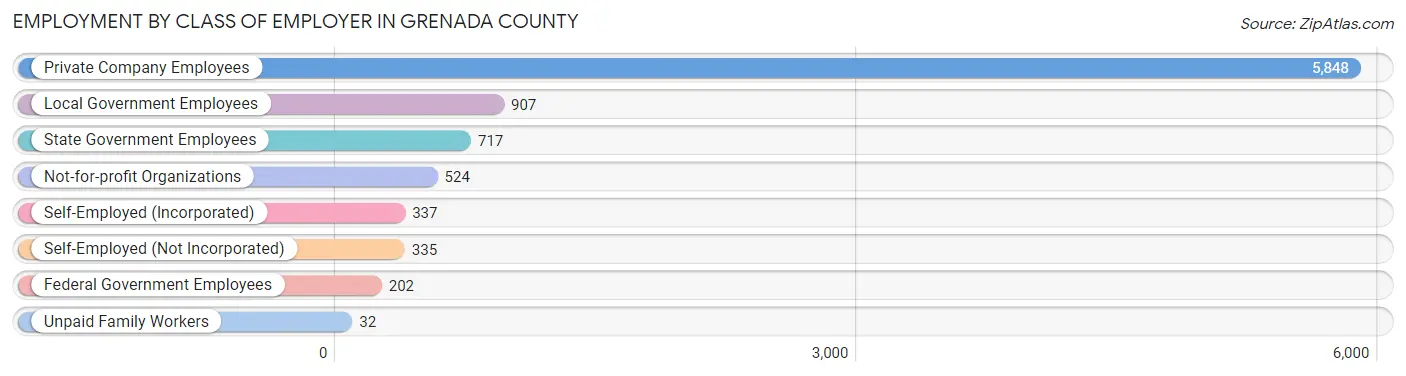
| Employer Class | # Employees | % Employees |
| Private Company Employees | 5,848 | 65.7% |
| Self-Employed (Incorporated) | 337 | 3.8% |
| Self-Employed (Not Incorporated) | 335 | 3.8% |
| Not-for-profit Organizations | 524 | 5.9% |
| Local Government Employees | 907 | 10.2% |
| State Government Employees | 717 | 8.1% |
| Federal Government Employees | 202 | 2.3% |
| Unpaid Family Workers | 32 | 0.4% |
| Total | 8,902 | 100.0% |
Employment Status by Age in Grenada County
According to the labor force statistics for Grenada County, out of the total population over 16 years of age (17,123), 55.1% or 9,435 individuals are in the labor force, with 4.1% or 387 of them unemployed. The age group with the highest labor force participation rate is 30 to 34 years, with 84.5% or 1,075 individuals in the labor force. Within the labor force, the 16 to 19 years age range has the highest percentage of unemployed individuals, with 22.3% or 42 of them being unemployed.
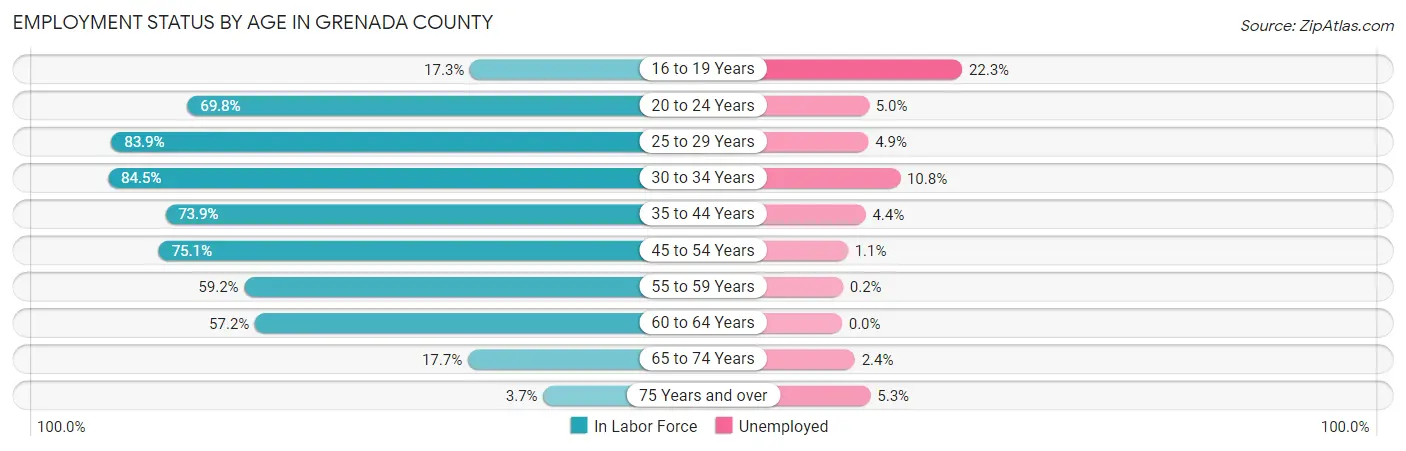
| Age Bracket | In Labor Force | Unemployed |
| 16 to 19 Years | 188 (17.3%) | 42 (22.3%) |
| 20 to 24 Years | 979 (69.8%) | 49 (5.0%) |
| 25 to 29 Years | 1,219 (83.9%) | 60 (4.9%) |
| 30 to 34 Years | 1,075 (84.5%) | 116 (10.8%) |
| 35 to 44 Years | 1,966 (73.9%) | 87 (4.4%) |
| 45 to 54 Years | 1,855 (75.1%) | 20 (1.1%) |
| 55 to 59 Years | 880 (59.2%) | 2 (0.2%) |
| 60 to 64 Years | 793 (57.2%) | 0 (0.0%) |
| 65 to 74 Years | 419 (17.7%) | 10 (2.4%) |
| 75 Years and over | 57 (3.7%) | 3 (5.3%) |
| Total | 9,435 (55.1%) | 387 (4.1%) |
Employment Status by Educational Attainment in Grenada County
According to labor force statistics for Grenada County, 72.6% of individuals (7,789) out of the total population between 25 and 64 years of age (10,729) are in the labor force, with 3.6% or 280 of them being unemployed. The group with the highest labor force participation rate are those with the educational attainment of bachelor's degree or higher, with 89.5% or 2,274 individuals in the labor force. Within the labor force, individuals with less than high school education have the highest percentage of unemployment, with 7.5% or 57 of them being unemployed.
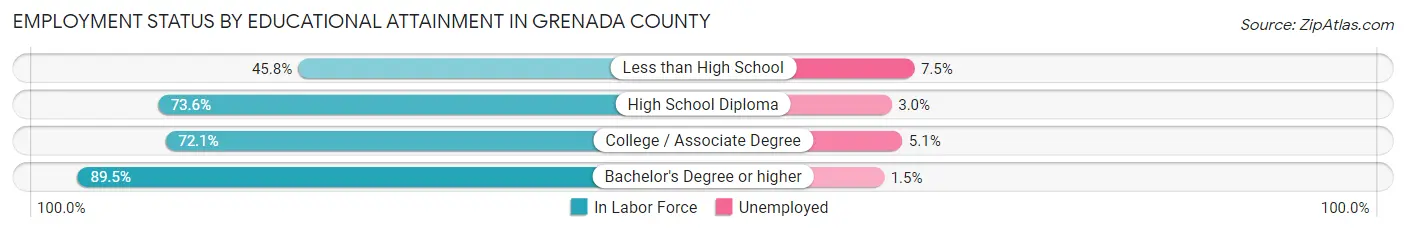
| Educational Attainment | In Labor Force | Unemployed |
| Less than High School | 760 (45.8%) | 124 (7.5%) |
| High School Diploma | 2,376 (73.6%) | 97 (3.0%) |
| College / Associate Degree | 2,379 (72.1%) | 168 (5.1%) |
| Bachelor's Degree or higher | 2,274 (89.5%) | 38 (1.5%) |
| Total | 7,789 (72.6%) | 386 (3.6%) |
Employment Occupations by Sex in Grenada County
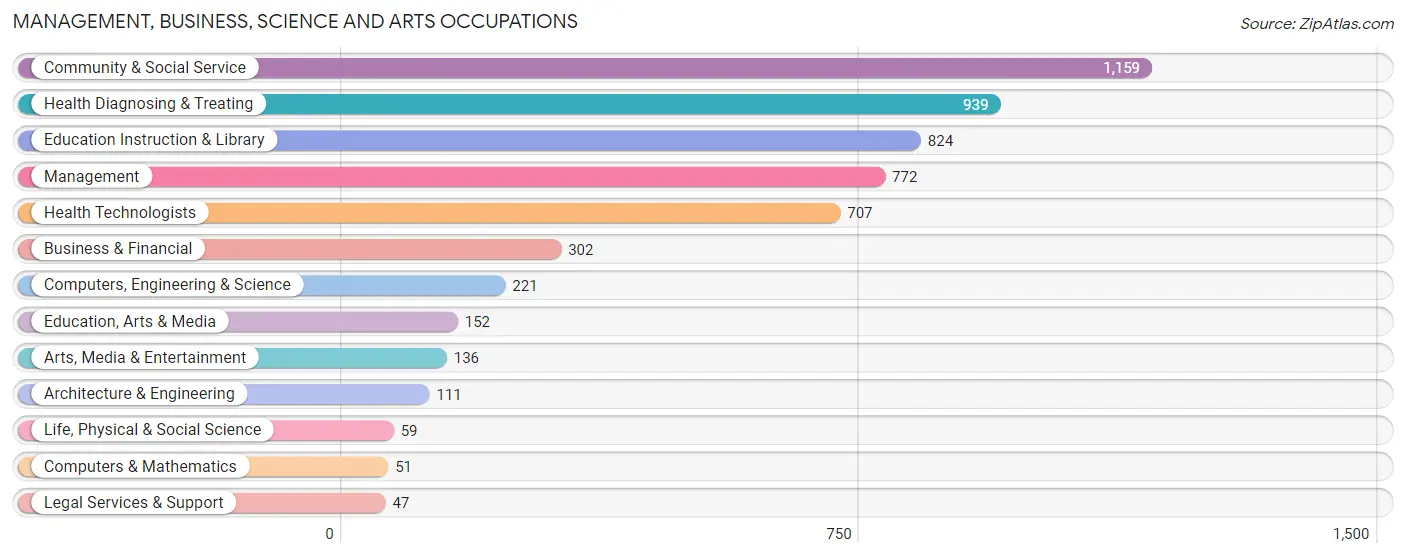
Management, Business, Science and Arts Occupations
The most common Management, Business, Science and Arts occupations in Grenada County are Community & Social Service (1,159 | 12.8%), Health Diagnosing & Treating (939 | 10.4%), Education Instruction & Library (824 | 9.1%), Management (772 | 8.5%), and Health Technologists (707 | 7.8%).
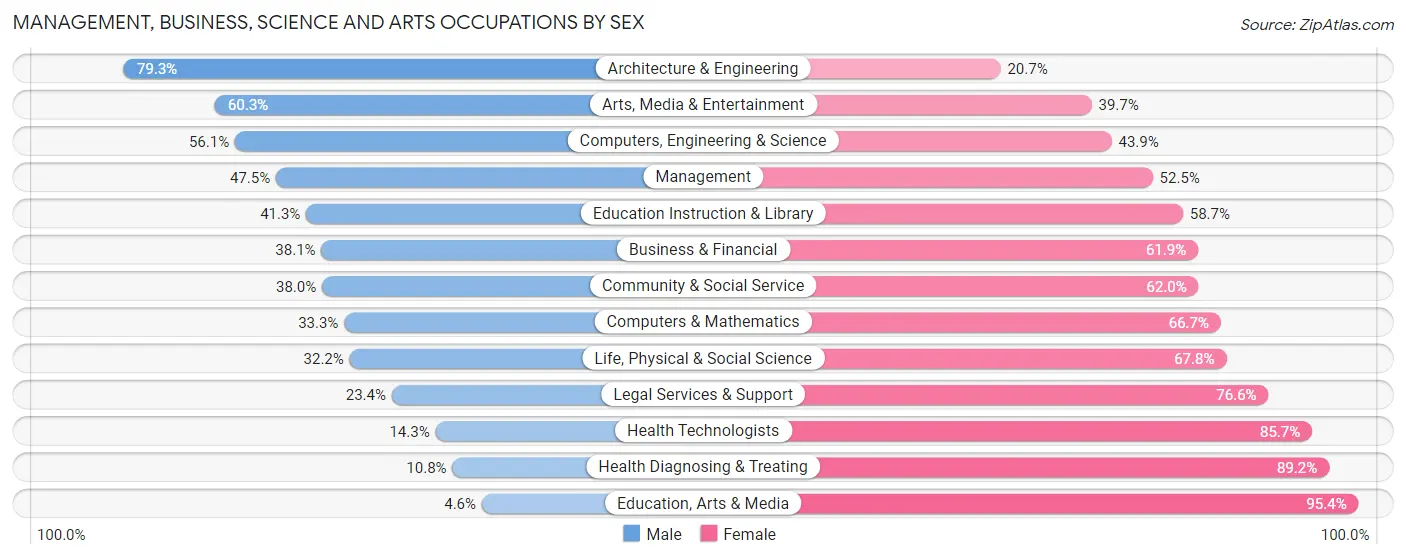
Management, Business, Science and Arts Occupations by Sex
Within the Management, Business, Science and Arts occupations in Grenada County, the most male-oriented occupations are Architecture & Engineering (79.3%), Arts, Media & Entertainment (60.3%), and Computers, Engineering & Science (56.1%), while the most female-oriented occupations are Education, Arts & Media (95.4%), Health Diagnosing & Treating (89.2%), and Health Technologists (85.7%).
| Occupation | Male | Female |
| Management | 367 (47.5%) | 405 (52.5%) |
| Business & Financial | 115 (38.1%) | 187 (61.9%) |
| Computers, Engineering & Science | 124 (56.1%) | 97 (43.9%) |
| Computers & Mathematics | 17 (33.3%) | 34 (66.7%) |
| Architecture & Engineering | 88 (79.3%) | 23 (20.7%) |
| Life, Physical & Social Science | 19 (32.2%) | 40 (67.8%) |
| Community & Social Service | 440 (38.0%) | 719 (62.0%) |
| Education, Arts & Media | 7 (4.6%) | 145 (95.4%) |
| Legal Services & Support | 11 (23.4%) | 36 (76.6%) |
| Education Instruction & Library | 340 (41.3%) | 484 (58.7%) |
| Arts, Media & Entertainment | 82 (60.3%) | 54 (39.7%) |
| Health Diagnosing & Treating | 101 (10.8%) | 838 (89.2%) |
| Health Technologists | 101 (14.3%) | 606 (85.7%) |
| Total (Category) | 1,147 (33.8%) | 2,246 (66.2%) |
| Total (Overall) | 4,622 (51.1%) | 4,422 (48.9%) |
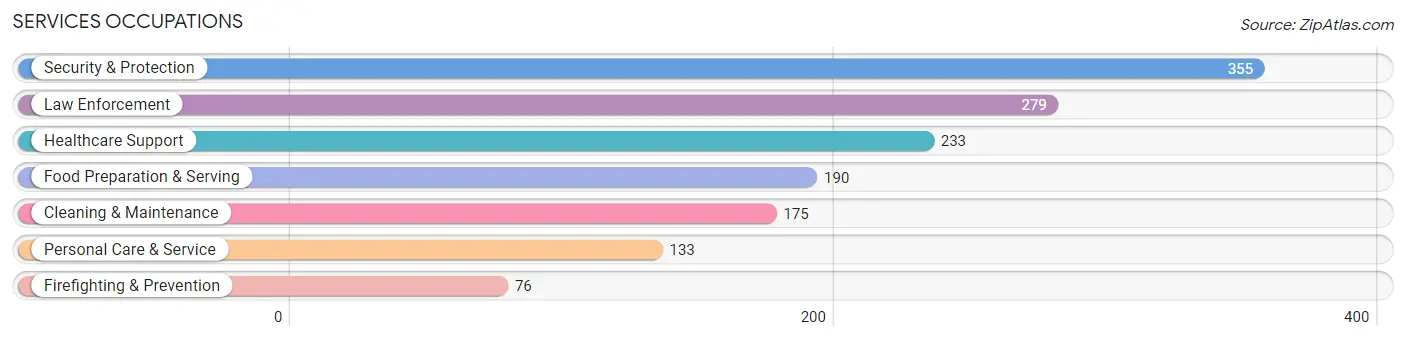
Services Occupations
The most common Services occupations in Grenada County are Security & Protection (355 | 3.9%), Law Enforcement (279 | 3.1%), Healthcare Support (233 | 2.6%), Food Preparation & Serving (190 | 2.1%), and Cleaning & Maintenance (175 | 1.9%).
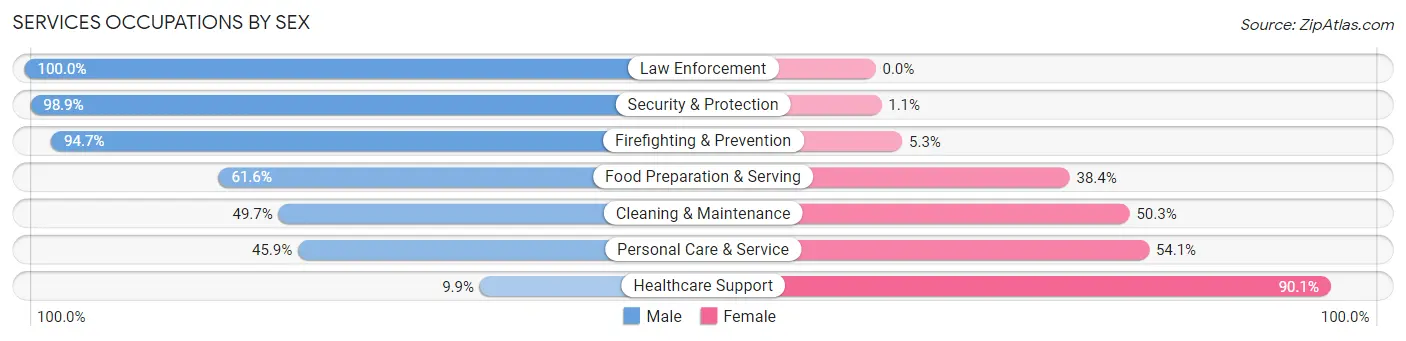
Services Occupations by Sex
Within the Services occupations in Grenada County, the most male-oriented occupations are Law Enforcement (100.0%), Security & Protection (98.9%), and Firefighting & Prevention (94.7%), while the most female-oriented occupations are Healthcare Support (90.1%), Personal Care & Service (54.1%), and Cleaning & Maintenance (50.3%).
| Occupation | Male | Female |
| Healthcare Support | 23 (9.9%) | 210 (90.1%) |
| Security & Protection | 351 (98.9%) | 4 (1.1%) |
| Firefighting & Prevention | 72 (94.7%) | 4 (5.3%) |
| Law Enforcement | 279 (100.0%) | 0 (0.0%) |
| Food Preparation & Serving | 117 (61.6%) | 73 (38.4%) |
| Cleaning & Maintenance | 87 (49.7%) | 88 (50.3%) |
| Personal Care & Service | 61 (45.9%) | 72 (54.1%) |
| Total (Category) | 639 (58.8%) | 447 (41.2%) |
| Total (Overall) | 4,622 (51.1%) | 4,422 (48.9%) |
Sales and Office Occupations
The most common Sales and Office occupations in Grenada County are Office & Administration (851 | 9.4%), and Sales & Related (845 | 9.3%).

Sales and Office Occupations by Sex

| Occupation | Male | Female |
| Sales & Related | 283 (33.5%) | 562 (66.5%) |
| Office & Administration | 152 (17.9%) | 699 (82.1%) |
| Total (Category) | 435 (25.7%) | 1,261 (74.4%) |
| Total (Overall) | 4,622 (51.1%) | 4,422 (48.9%) |
Natural Resources, Construction and Maintenance Occupations
The most common Natural Resources, Construction and Maintenance occupations in Grenada County are Installation, Maintenance & Repair (735 | 8.1%), Construction & Extraction (374 | 4.1%), and Farming, Fishing & Forestry (76 | 0.8%).
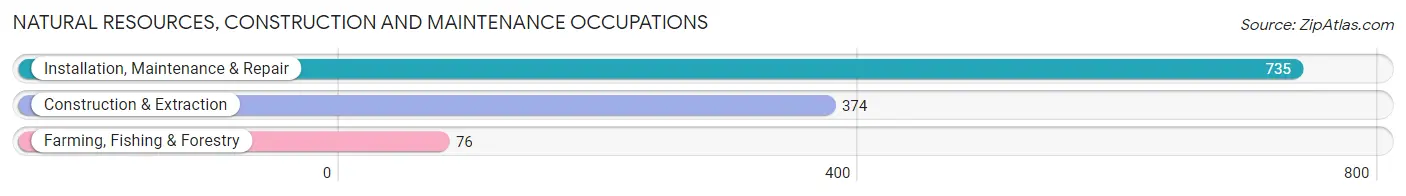
Natural Resources, Construction and Maintenance Occupations by Sex
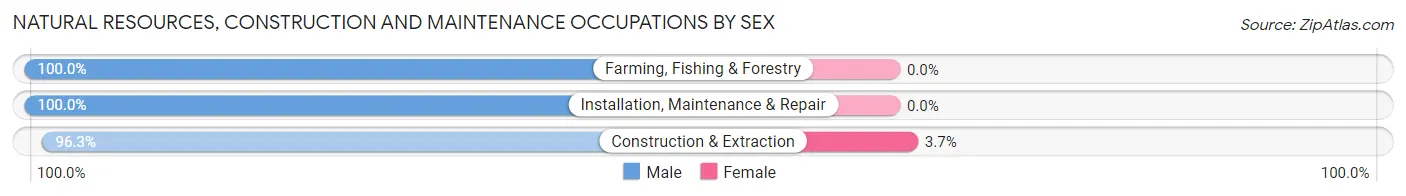
| Occupation | Male | Female |
| Farming, Fishing & Forestry | 76 (100.0%) | 0 (0.0%) |
| Construction & Extraction | 360 (96.3%) | 14 (3.7%) |
| Installation, Maintenance & Repair | 735 (100.0%) | 0 (0.0%) |
| Total (Category) | 1,171 (98.8%) | 14 (1.2%) |
| Total (Overall) | 4,622 (51.1%) | 4,422 (48.9%) |
Production, Transportation and Moving Occupations
The most common Production, Transportation and Moving occupations in Grenada County are Production (874 | 9.7%), Material Moving (551 | 6.1%), and Transportation (259 | 2.9%).
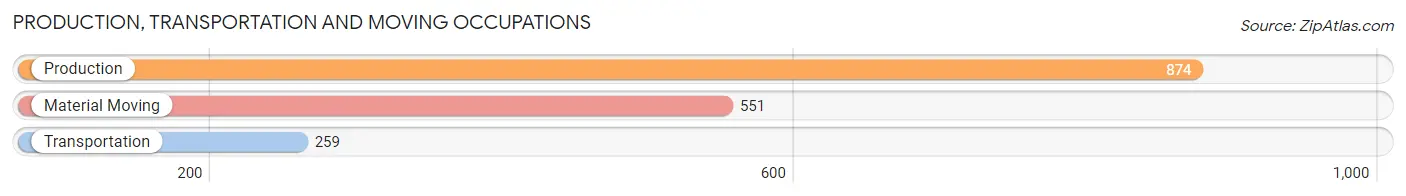
Production, Transportation and Moving Occupations by Sex
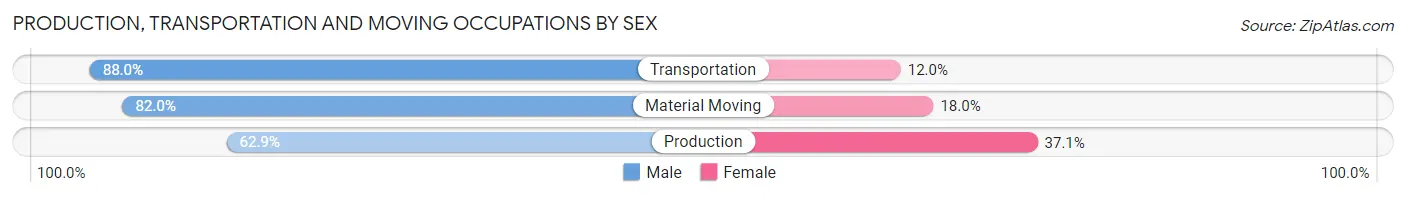
| Occupation | Male | Female |
| Production | 550 (62.9%) | 324 (37.1%) |
| Transportation | 228 (88.0%) | 31 (12.0%) |
| Material Moving | 452 (82.0%) | 99 (18.0%) |
| Total (Category) | 1,230 (73.0%) | 454 (27.0%) |
| Total (Overall) | 4,622 (51.1%) | 4,422 (48.9%) |
Employment Industries by Sex in Grenada County
Employment Industries in Grenada County
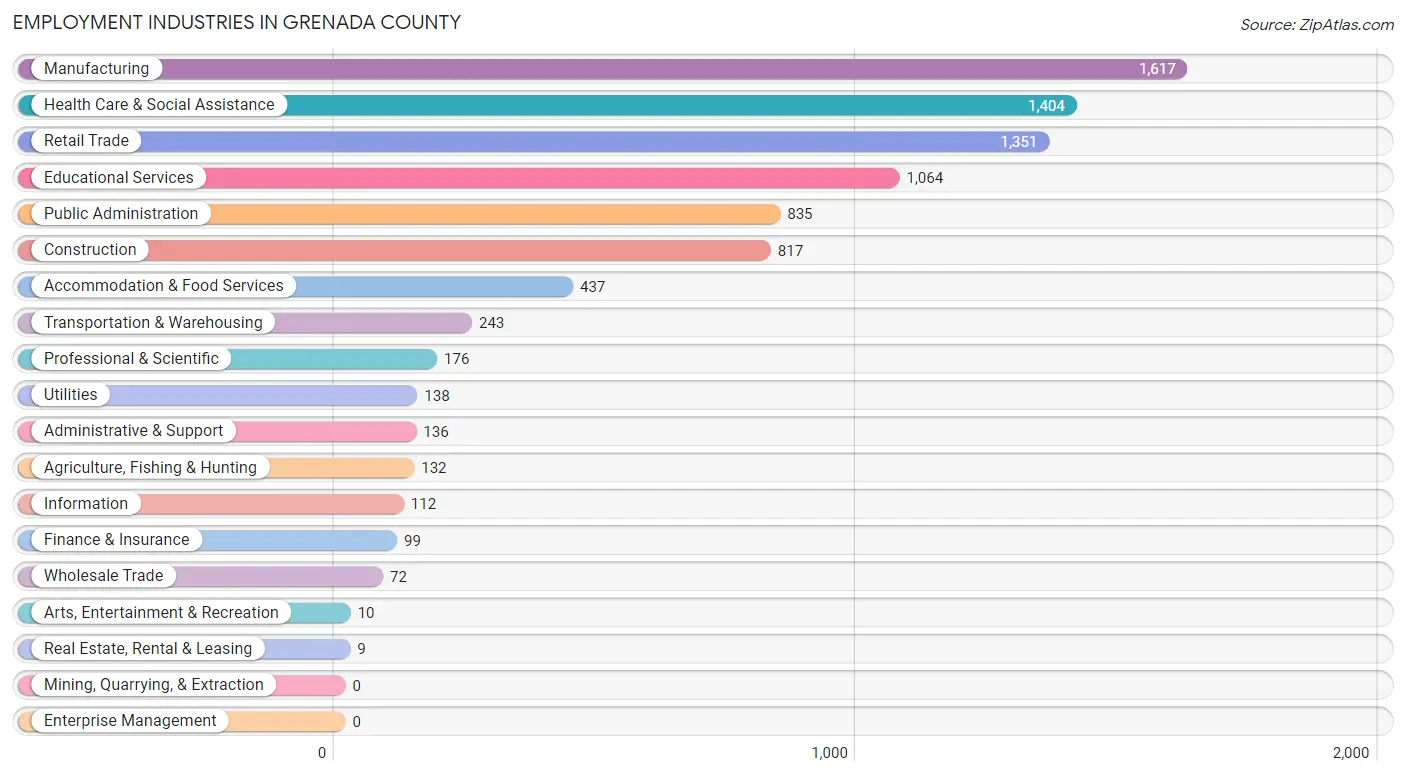
The major employment industries in Grenada County include Manufacturing (1,617 | 17.9%), Health Care & Social Assistance (1,404 | 15.5%), Retail Trade (1,351 | 14.9%), Educational Services (1,064 | 11.8%), and Public Administration (835 | 9.2%).
Employment Industries by Sex in Grenada County
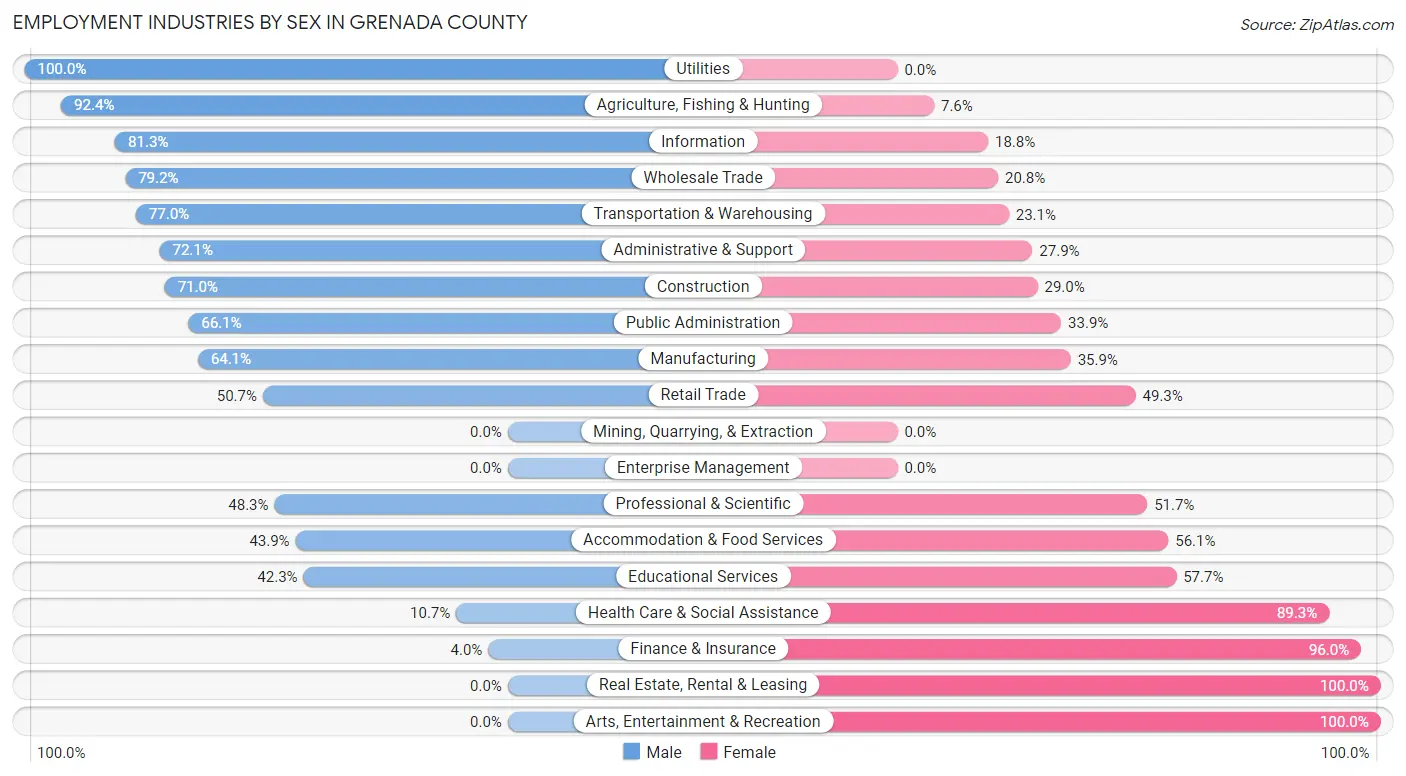
The Grenada County industries that see more men than women are Utilities (100.0%), Agriculture, Fishing & Hunting (92.4%), and Information (81.2%), whereas the industries that tend to have a higher number of women are Real Estate, Rental & Leasing (100.0%), Arts, Entertainment & Recreation (100.0%), and Finance & Insurance (96.0%).
| Industry | Male | Female |
| Agriculture, Fishing & Hunting | 122 (92.4%) | 10 (7.6%) |
| Mining, Quarrying, & Extraction | 0 (0.0%) | 0 (0.0%) |
| Construction | 580 (71.0%) | 237 (29.0%) |
| Manufacturing | 1,037 (64.1%) | 580 (35.9%) |
| Wholesale Trade | 57 (79.2%) | 15 (20.8%) |
| Retail Trade | 685 (50.7%) | 666 (49.3%) |
| Transportation & Warehousing | 187 (76.9%) | 56 (23.1%) |
| Utilities | 138 (100.0%) | 0 (0.0%) |
| Information | 91 (81.2%) | 21 (18.8%) |
| Finance & Insurance | 4 (4.0%) | 95 (96.0%) |
| Real Estate, Rental & Leasing | 0 (0.0%) | 9 (100.0%) |
| Professional & Scientific | 85 (48.3%) | 91 (51.7%) |
| Enterprise Management | 0 (0.0%) | 0 (0.0%) |
| Administrative & Support | 98 (72.1%) | 38 (27.9%) |
| Educational Services | 450 (42.3%) | 614 (57.7%) |
| Health Care & Social Assistance | 150 (10.7%) | 1,254 (89.3%) |
| Arts, Entertainment & Recreation | 0 (0.0%) | 10 (100.0%) |
| Accommodation & Food Services | 192 (43.9%) | 245 (56.1%) |
| Public Administration | 552 (66.1%) | 283 (33.9%) |
| Total | 4,622 (51.1%) | 4,422 (48.9%) |
Education in Grenada County
School Enrollment in Grenada County
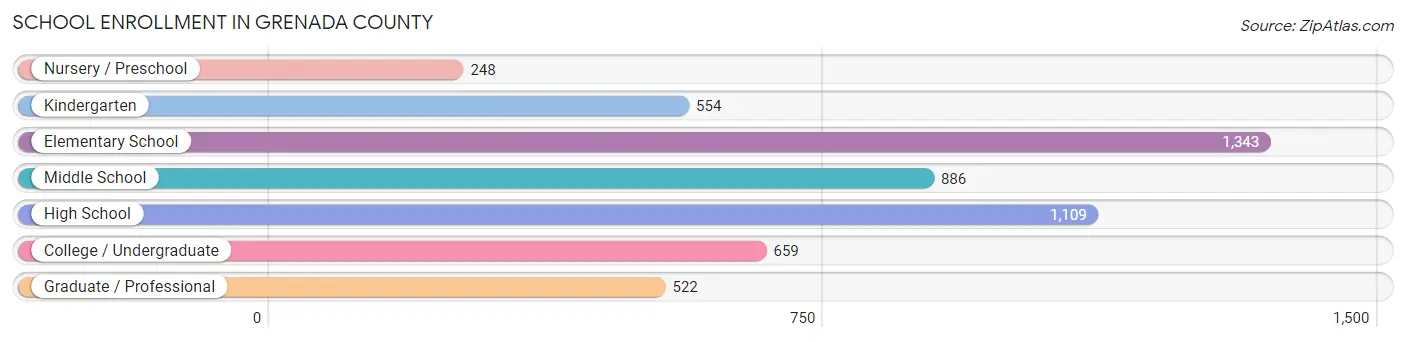
The most common levels of schooling among the 5,321 students in Grenada County are elementary school (1,343 | 25.2%), high school (1,109 | 20.8%), and middle school (886 | 16.7%).
| School Level | # Students | % Students |
| Nursery / Preschool | 248 | 4.7% |
| Kindergarten | 554 | 10.4% |
| Elementary School | 1,343 | 25.2% |
| Middle School | 886 | 16.7% |
| High School | 1,109 | 20.8% |
| College / Undergraduate | 659 | 12.4% |
| Graduate / Professional | 522 | 9.8% |
| Total | 5,321 | 100.0% |
School Enrollment by Age by Funding Source in Grenada County
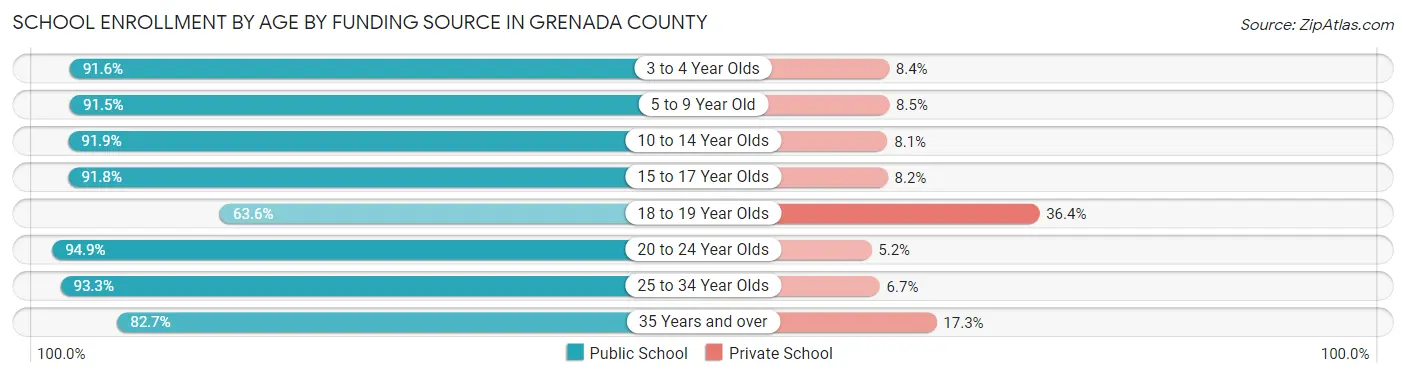
Out of a total of 5,321 students who are enrolled in schools in Grenada County, 521 (9.8%) attend a private institution, while the remaining 4,800 (90.2%) are enrolled in public schools. The age group of 18 to 19 year olds has the highest likelihood of being enrolled in private schools, with 94 (36.4% in the age bracket) enrolled. Conversely, the age group of 20 to 24 year olds has the lowest likelihood of being enrolled in a private school, with 368 (94.9% in the age bracket) attending a public institution.
| Age Bracket | Public School | Private School |
| 3 to 4 Year Olds | 207 (91.6%) | 19 (8.4%) |
| 5 to 9 Year Old | 1,546 (91.5%) | 143 (8.5%) |
| 10 to 14 Year Olds | 1,049 (91.9%) | 93 (8.1%) |
| 15 to 17 Year Olds | 819 (91.8%) | 73 (8.2%) |
| 18 to 19 Year Olds | 164 (63.6%) | 94 (36.4%) |
| 20 to 24 Year Olds | 368 (94.9%) | 20 (5.1%) |
| 25 to 34 Year Olds | 418 (93.3%) | 30 (6.7%) |
| 35 Years and over | 230 (82.7%) | 48 (17.3%) |
| Total | 4,800 (90.2%) | 521 (9.8%) |
Educational Attainment by Field of Study in Grenada County
Business (678 | 19.9%), science & technology (629 | 18.4%), education (487 | 14.3%), arts & humanities (448 | 13.1%), and bio, nature & agricultural (392 | 11.5%) are the most common fields of study among 3,413 individuals in Grenada County who have obtained a bachelor's degree or higher.
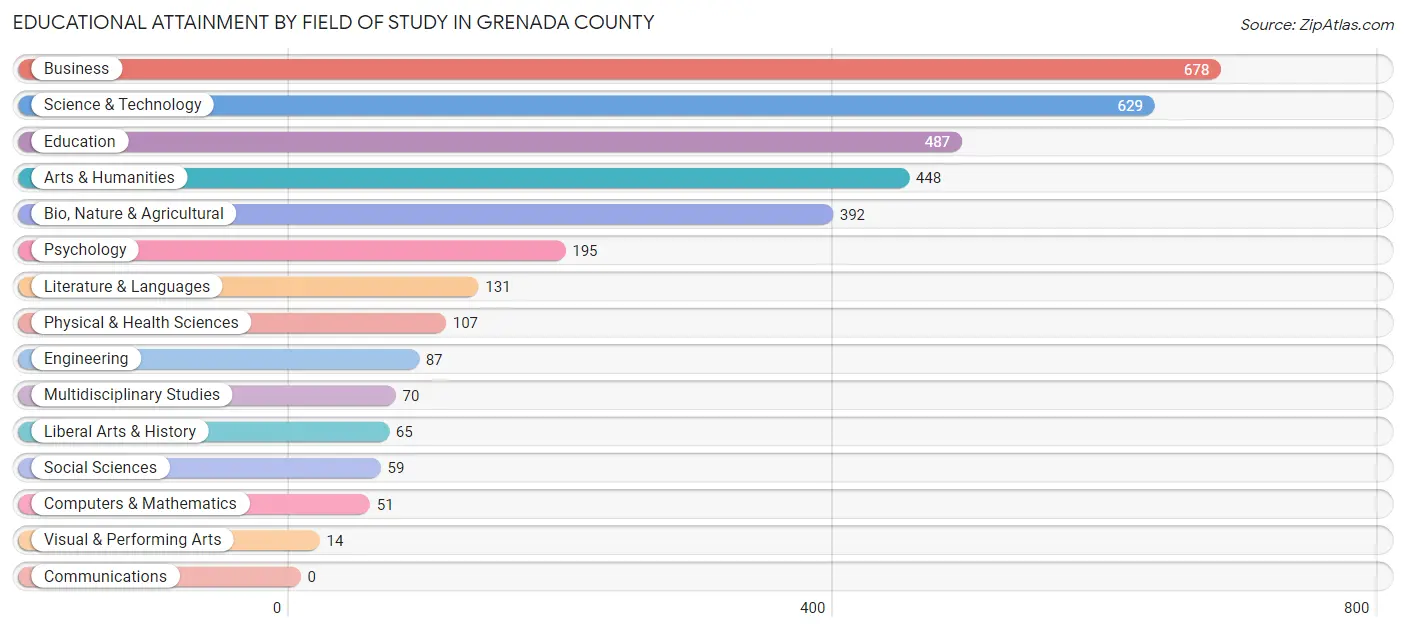
| Field of Study | # Graduates | % Graduates |
| Computers & Mathematics | 51 | 1.5% |
| Bio, Nature & Agricultural | 392 | 11.5% |
| Physical & Health Sciences | 107 | 3.1% |
| Psychology | 195 | 5.7% |
| Social Sciences | 59 | 1.7% |
| Engineering | 87 | 2.5% |
| Multidisciplinary Studies | 70 | 2.1% |
| Science & Technology | 629 | 18.4% |
| Business | 678 | 19.9% |
| Education | 487 | 14.3% |
| Literature & Languages | 131 | 3.8% |
| Liberal Arts & History | 65 | 1.9% |
| Visual & Performing Arts | 14 | 0.4% |
| Communications | 0 | 0.0% |
| Arts & Humanities | 448 | 13.1% |
| Total | 3,413 | 100.0% |
Transportation & Commute in Grenada County
Vehicle Availability by Sex in Grenada County
The most prevalent vehicle ownership categories in Grenada County are males with 2 vehicles (1,875, accounting for 41.1%) and females with 2 vehicles (1,410, making up 43.2%).
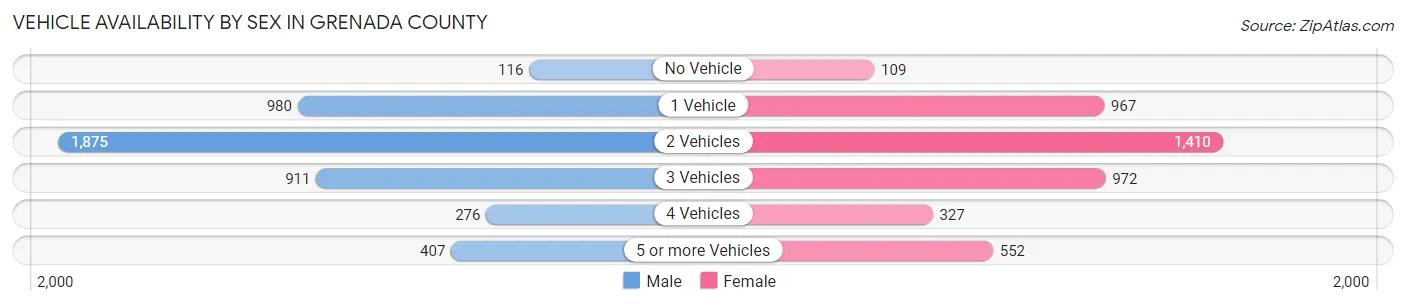
| Vehicles Available | Male | Female |
| No Vehicle | 116 (2.5%) | 109 (2.5%) |
| 1 Vehicle | 980 (21.5%) | 967 (22.3%) |
| 2 Vehicles | 1,875 (41.1%) | 1,410 (32.5%) |
| 3 Vehicles | 911 (20.0%) | 972 (22.4%) |
| 4 Vehicles | 276 (6.0%) | 327 (7.5%) |
| 5 or more Vehicles | 407 (8.9%) | 552 (12.7%) |
| Total | 4,565 (100.0%) | 4,337 (100.0%) |
Commute Time in Grenada County
The most frequently occuring commute durations in Grenada County are 10 to 14 minutes (2,196 commuters, 25.0%), 5 to 9 minutes (1,995 commuters, 22.7%), and 15 to 19 minutes (1,207 commuters, 13.8%).
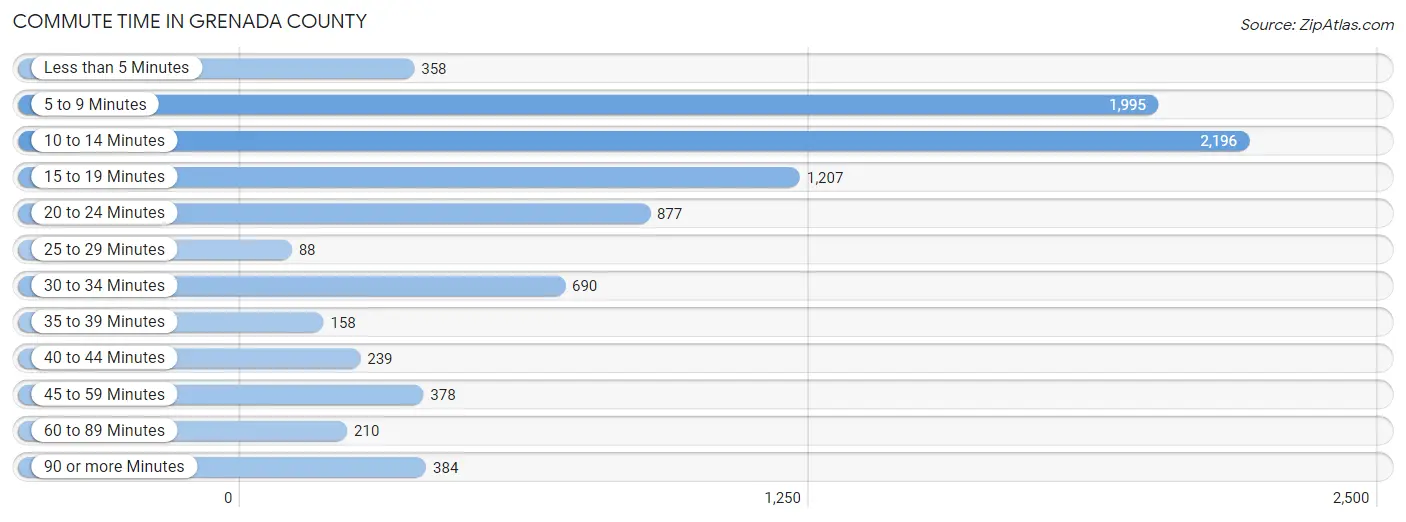
| Commute Time | # Commuters | % Commuters |
| Less than 5 Minutes | 358 | 4.1% |
| 5 to 9 Minutes | 1,995 | 22.7% |
| 10 to 14 Minutes | 2,196 | 25.0% |
| 15 to 19 Minutes | 1,207 | 13.8% |
| 20 to 24 Minutes | 877 | 10.0% |
| 25 to 29 Minutes | 88 | 1.0% |
| 30 to 34 Minutes | 690 | 7.9% |
| 35 to 39 Minutes | 158 | 1.8% |
| 40 to 44 Minutes | 239 | 2.7% |
| 45 to 59 Minutes | 378 | 4.3% |
| 60 to 89 Minutes | 210 | 2.4% |
| 90 or more Minutes | 384 | 4.4% |
Commute Time by Sex in Grenada County
The most common commute times in Grenada County are 10 to 14 minutes (1,098 commuters, 24.3%) for males and 10 to 14 minutes (1,098 commuters, 25.7%) for females.
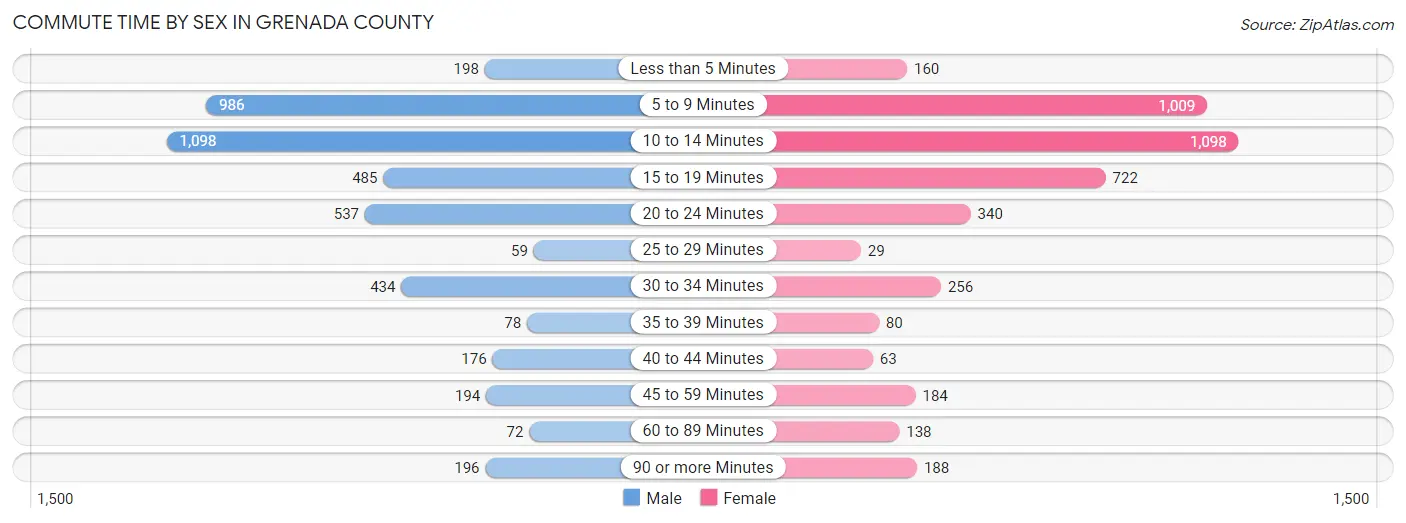
| Commute Time | Male | Female |
| Less than 5 Minutes | 198 (4.4%) | 160 (3.7%) |
| 5 to 9 Minutes | 986 (21.8%) | 1,009 (23.6%) |
| 10 to 14 Minutes | 1,098 (24.3%) | 1,098 (25.7%) |
| 15 to 19 Minutes | 485 (10.7%) | 722 (16.9%) |
| 20 to 24 Minutes | 537 (11.9%) | 340 (8.0%) |
| 25 to 29 Minutes | 59 (1.3%) | 29 (0.7%) |
| 30 to 34 Minutes | 434 (9.6%) | 256 (6.0%) |
| 35 to 39 Minutes | 78 (1.7%) | 80 (1.9%) |
| 40 to 44 Minutes | 176 (3.9%) | 63 (1.5%) |
| 45 to 59 Minutes | 194 (4.3%) | 184 (4.3%) |
| 60 to 89 Minutes | 72 (1.6%) | 138 (3.2%) |
| 90 or more Minutes | 196 (4.3%) | 188 (4.4%) |
Time of Departure to Work by Sex in Grenada County
The most frequent times of departure to work in Grenada County are 7:30 AM to 7:59 AM (716, 15.9%) for males and 7:30 AM to 7:59 AM (864, 20.3%) for females.
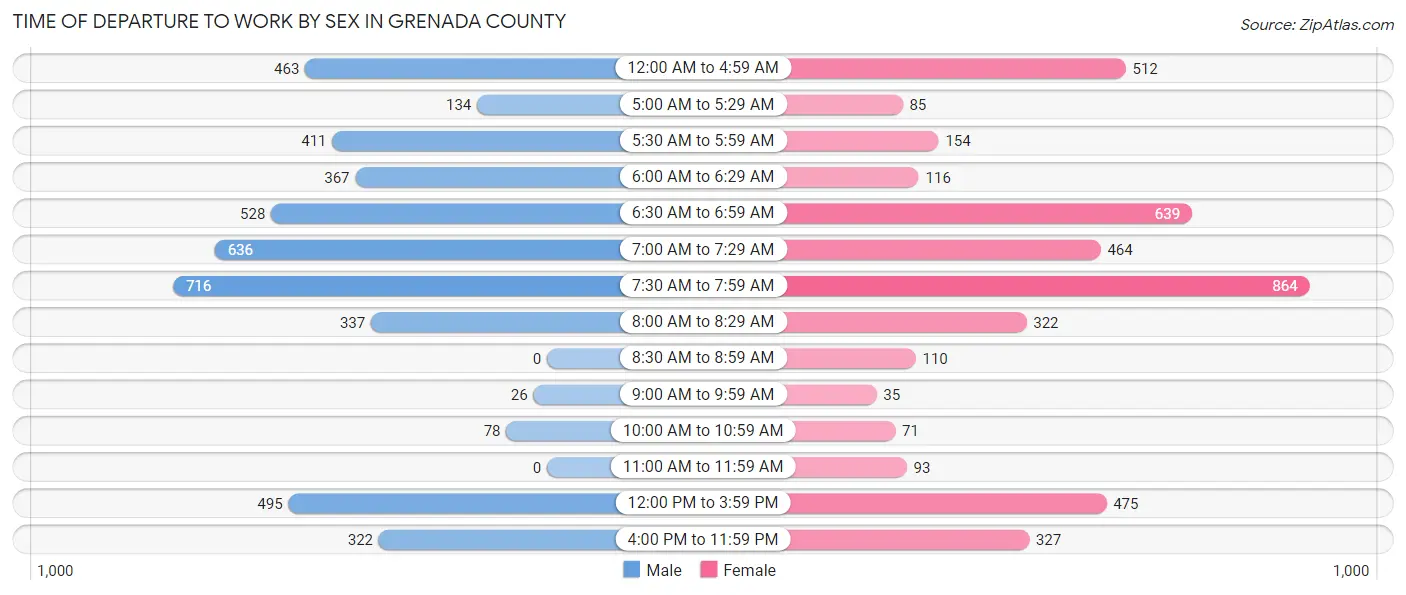
| Time of Departure | Male | Female |
| 12:00 AM to 4:59 AM | 463 (10.3%) | 512 (12.0%) |
| 5:00 AM to 5:29 AM | 134 (3.0%) | 85 (2.0%) |
| 5:30 AM to 5:59 AM | 411 (9.1%) | 154 (3.6%) |
| 6:00 AM to 6:29 AM | 367 (8.1%) | 116 (2.7%) |
| 6:30 AM to 6:59 AM | 528 (11.7%) | 639 (15.0%) |
| 7:00 AM to 7:29 AM | 636 (14.1%) | 464 (10.9%) |
| 7:30 AM to 7:59 AM | 716 (15.9%) | 864 (20.3%) |
| 8:00 AM to 8:29 AM | 337 (7.5%) | 322 (7.5%) |
| 8:30 AM to 8:59 AM | 0 (0.0%) | 110 (2.6%) |
| 9:00 AM to 9:59 AM | 26 (0.6%) | 35 (0.8%) |
| 10:00 AM to 10:59 AM | 78 (1.7%) | 71 (1.7%) |
| 11:00 AM to 11:59 AM | 0 (0.0%) | 93 (2.2%) |
| 12:00 PM to 3:59 PM | 495 (11.0%) | 475 (11.1%) |
| 4:00 PM to 11:59 PM | 322 (7.1%) | 327 (7.7%) |
| Total | 4,513 (100.0%) | 4,267 (100.0%) |
Housing Occupancy in Grenada County
Occupancy by Ownership in Grenada County
Of the total 8,434 dwellings in Grenada County, owner-occupied units account for 5,757 (68.3%), while renter-occupied units make up 2,677 (31.7%).
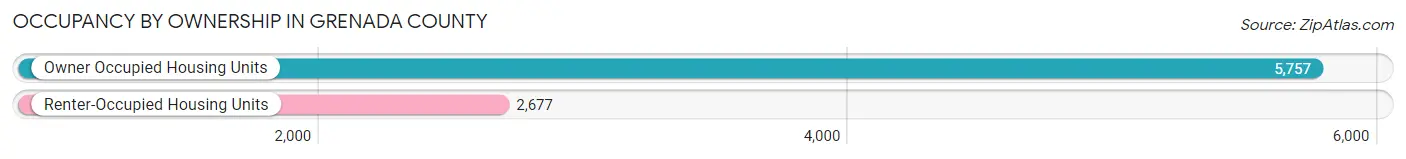
| Occupancy | # Housing Units | % Housing Units |
| Owner Occupied Housing Units | 5,757 | 68.3% |
| Renter-Occupied Housing Units | 2,677 | 31.7% |
| Total Occupied Housing Units | 8,434 | 100.0% |
Occupancy by Household Size in Grenada County
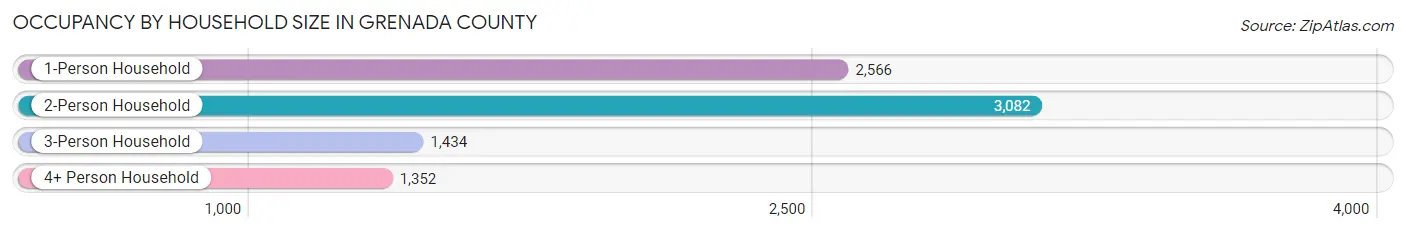
| Household Size | # Housing Units | % Housing Units |
| 1-Person Household | 2,566 | 30.4% |
| 2-Person Household | 3,082 | 36.5% |
| 3-Person Household | 1,434 | 17.0% |
| 4+ Person Household | 1,352 | 16.0% |
| Total Housing Units | 8,434 | 100.0% |
Occupancy by Ownership by Household Size in Grenada County
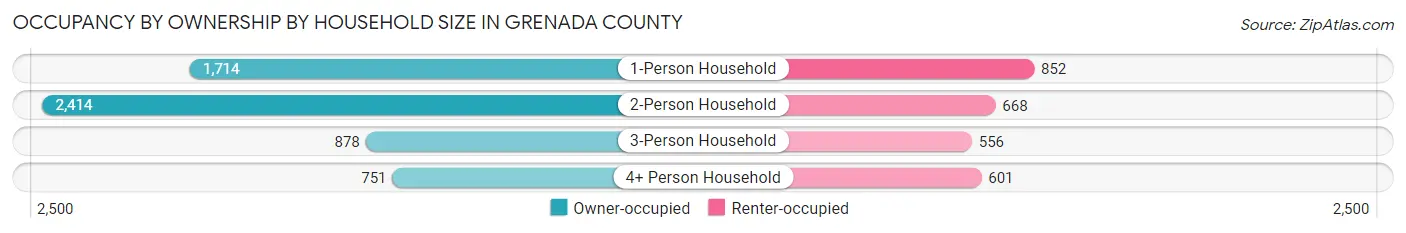
| Household Size | Owner-occupied | Renter-occupied |
| 1-Person Household | 1,714 (66.8%) | 852 (33.2%) |
| 2-Person Household | 2,414 (78.3%) | 668 (21.7%) |
| 3-Person Household | 878 (61.2%) | 556 (38.8%) |
| 4+ Person Household | 751 (55.5%) | 601 (44.5%) |
| Total Housing Units | 5,757 (68.3%) | 2,677 (31.7%) |
Occupancy by Educational Attainment in Grenada County
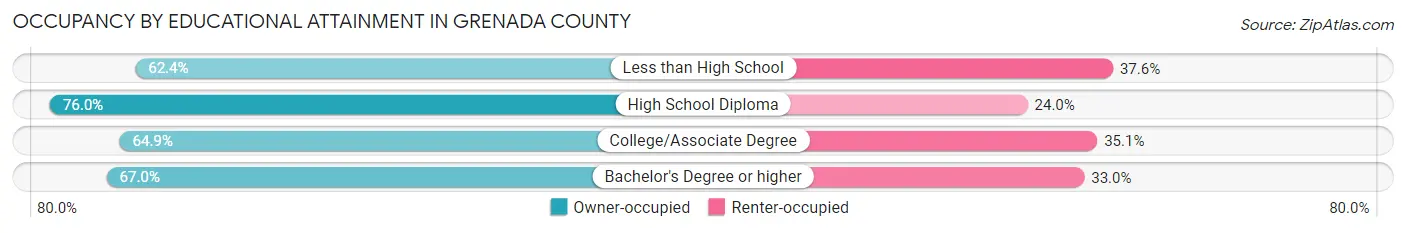
| Household Size | Owner-occupied | Renter-occupied |
| Less than High School | 1,019 (62.4%) | 613 (37.6%) |
| High School Diploma | 1,949 (76.0%) | 616 (24.0%) |
| College/Associate Degree | 1,563 (64.9%) | 844 (35.1%) |
| Bachelor's Degree or higher | 1,226 (67.0%) | 604 (33.0%) |
Occupancy by Age of Householder in Grenada County
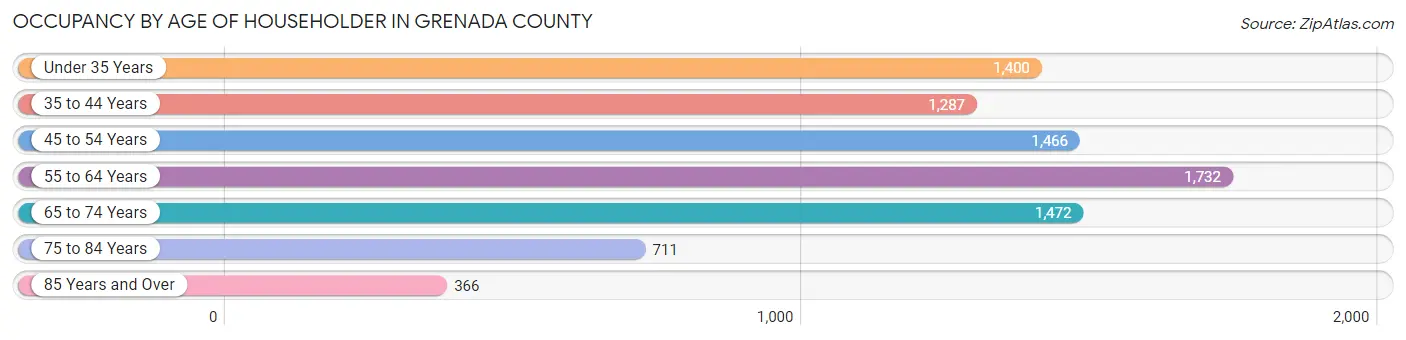
| Age Bracket | # Households | % Households |
| Under 35 Years | 1,400 | 16.6% |
| 35 to 44 Years | 1,287 | 15.3% |
| 45 to 54 Years | 1,466 | 17.4% |
| 55 to 64 Years | 1,732 | 20.5% |
| 65 to 74 Years | 1,472 | 17.4% |
| 75 to 84 Years | 711 | 8.4% |
| 85 Years and Over | 366 | 4.3% |
| Total | 8,434 | 100.0% |
Housing Finances in Grenada County
Median Income by Occupancy in Grenada County
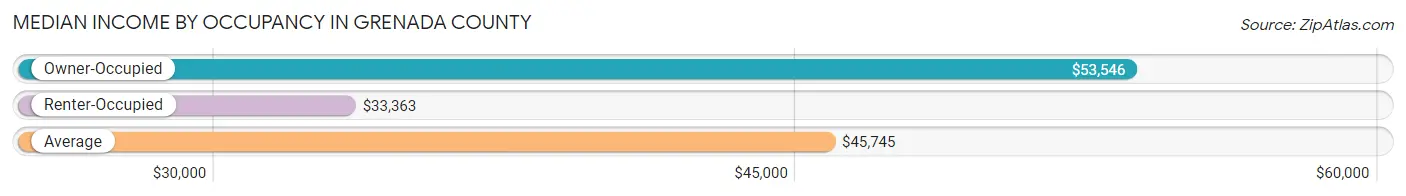
| Occupancy Type | # Households | Median Income |
| Owner-Occupied | 5,757 (68.3%) | $53,546 |
| Renter-Occupied | 2,677 (31.7%) | $33,363 |
| Average | 8,434 (100.0%) | $45,745 |
Occupancy by Householder Income Bracket in Grenada County
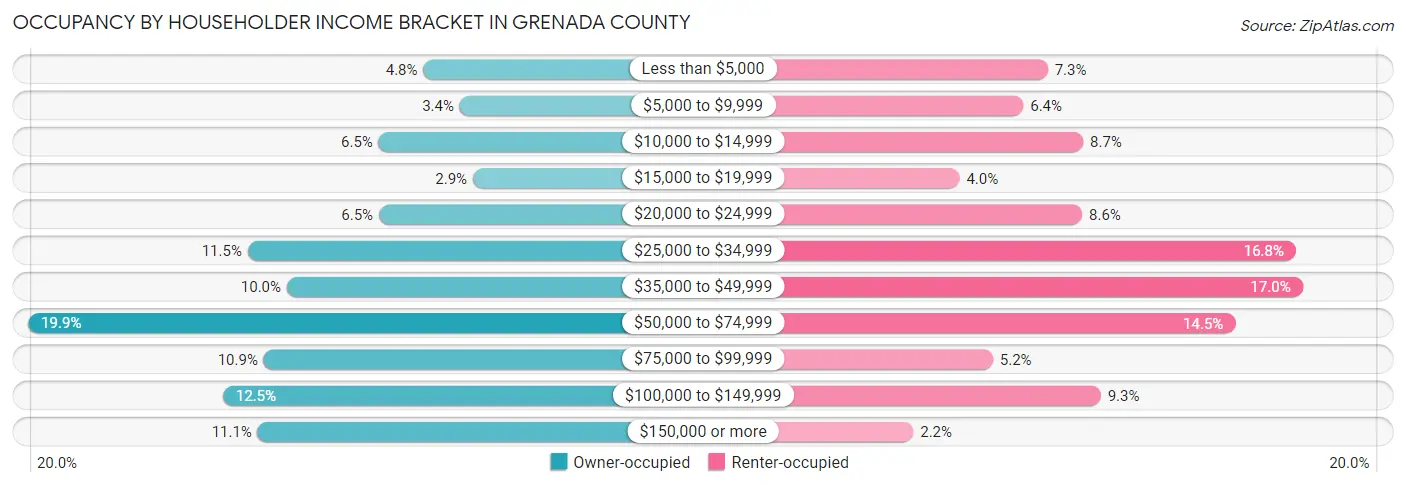
| Income Bracket | Owner-occupied | Renter-occupied |
| Less than $5,000 | 277 (4.8%) | 196 (7.3%) |
| $5,000 to $9,999 | 197 (3.4%) | 171 (6.4%) |
| $10,000 to $14,999 | 375 (6.5%) | 232 (8.7%) |
| $15,000 to $19,999 | 168 (2.9%) | 106 (4.0%) |
| $20,000 to $24,999 | 374 (6.5%) | 231 (8.6%) |
| $25,000 to $34,999 | 662 (11.5%) | 449 (16.8%) |
| $35,000 to $49,999 | 576 (10.0%) | 456 (17.0%) |
| $50,000 to $74,999 | 1,144 (19.9%) | 387 (14.5%) |
| $75,000 to $99,999 | 627 (10.9%) | 140 (5.2%) |
| $100,000 to $149,999 | 717 (12.4%) | 250 (9.3%) |
| $150,000 or more | 640 (11.1%) | 59 (2.2%) |
| Total | 5,757 (100.0%) | 2,677 (100.0%) |
Monthly Housing Cost Tiers in Grenada County
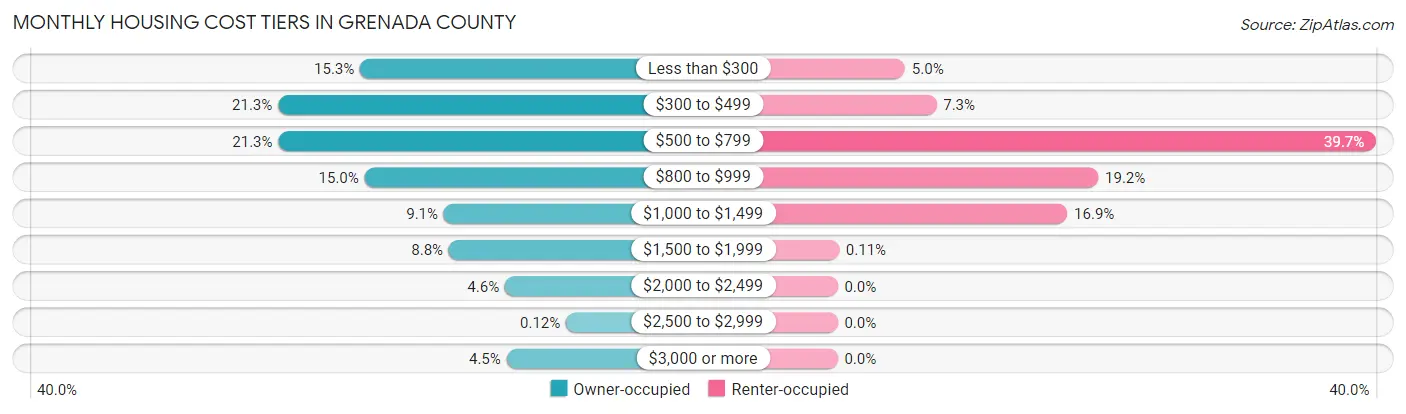
| Monthly Cost | Owner-occupied | Renter-occupied |
| Less than $300 | 880 (15.3%) | 133 (5.0%) |
| $300 to $499 | 1,228 (21.3%) | 195 (7.3%) |
| $500 to $799 | 1,227 (21.3%) | 1,062 (39.7%) |
| $800 to $999 | 861 (15.0%) | 514 (19.2%) |
| $1,000 to $1,499 | 525 (9.1%) | 453 (16.9%) |
| $1,500 to $1,999 | 504 (8.7%) | 3 (0.1%) |
| $2,000 to $2,499 | 266 (4.6%) | 0 (0.0%) |
| $2,500 to $2,999 | 7 (0.1%) | 0 (0.0%) |
| $3,000 or more | 259 (4.5%) | 0 (0.0%) |
| Total | 5,757 (100.0%) | 2,677 (100.0%) |
Physical Housing Characteristics in Grenada County
Housing Structures in Grenada County
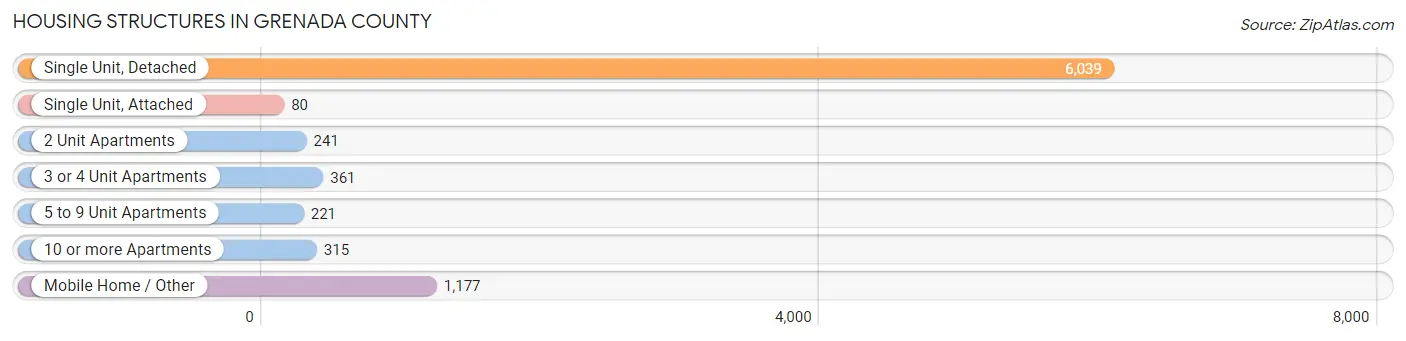
| Structure Type | # Housing Units | % Housing Units |
| Single Unit, Detached | 6,039 | 71.6% |
| Single Unit, Attached | 80 | 0.9% |
| 2 Unit Apartments | 241 | 2.9% |
| 3 or 4 Unit Apartments | 361 | 4.3% |
| 5 to 9 Unit Apartments | 221 | 2.6% |
| 10 or more Apartments | 315 | 3.7% |
| Mobile Home / Other | 1,177 | 14.0% |
| Total | 8,434 | 100.0% |
Housing Structures by Occupancy in Grenada County
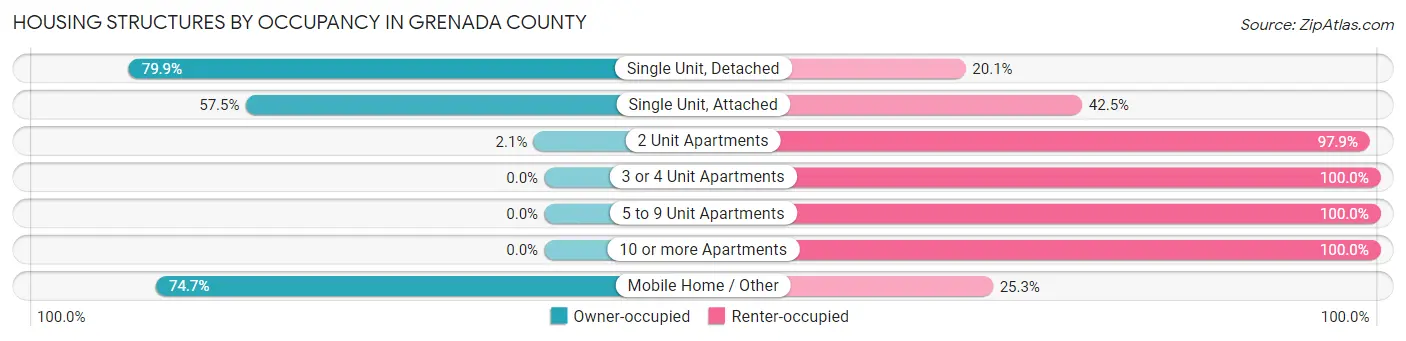
| Structure Type | Owner-occupied | Renter-occupied |
| Single Unit, Detached | 4,827 (79.9%) | 1,212 (20.1%) |
| Single Unit, Attached | 46 (57.5%) | 34 (42.5%) |
| 2 Unit Apartments | 5 (2.1%) | 236 (97.9%) |
| 3 or 4 Unit Apartments | 0 (0.0%) | 361 (100.0%) |
| 5 to 9 Unit Apartments | 0 (0.0%) | 221 (100.0%) |
| 10 or more Apartments | 0 (0.0%) | 315 (100.0%) |
| Mobile Home / Other | 879 (74.7%) | 298 (25.3%) |
| Total | 5,757 (68.3%) | 2,677 (31.7%) |
Housing Structures by Number of Rooms in Grenada County
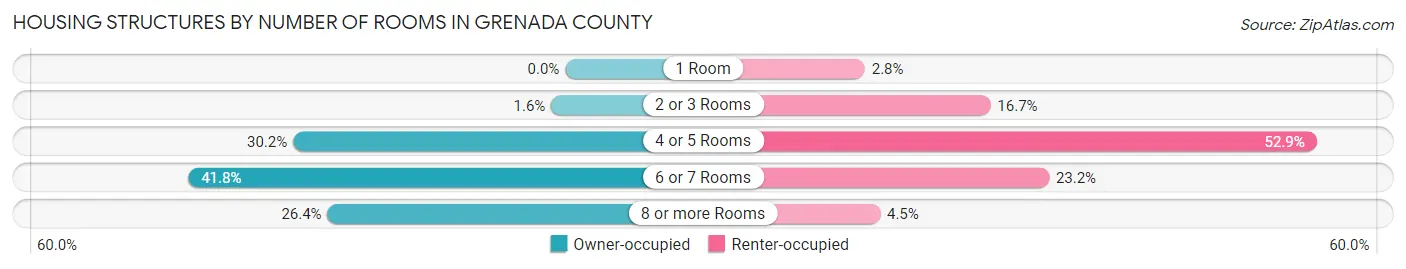
| Number of Rooms | Owner-occupied | Renter-occupied |
| 1 Room | 0 (0.0%) | 74 (2.8%) |
| 2 or 3 Rooms | 90 (1.6%) | 447 (16.7%) |
| 4 or 5 Rooms | 1,739 (30.2%) | 1,416 (52.9%) |
| 6 or 7 Rooms | 2,409 (41.8%) | 621 (23.2%) |
| 8 or more Rooms | 1,519 (26.4%) | 119 (4.4%) |
| Total | 5,757 (100.0%) | 2,677 (100.0%) |
Housing Structure by Heating Type in Grenada County
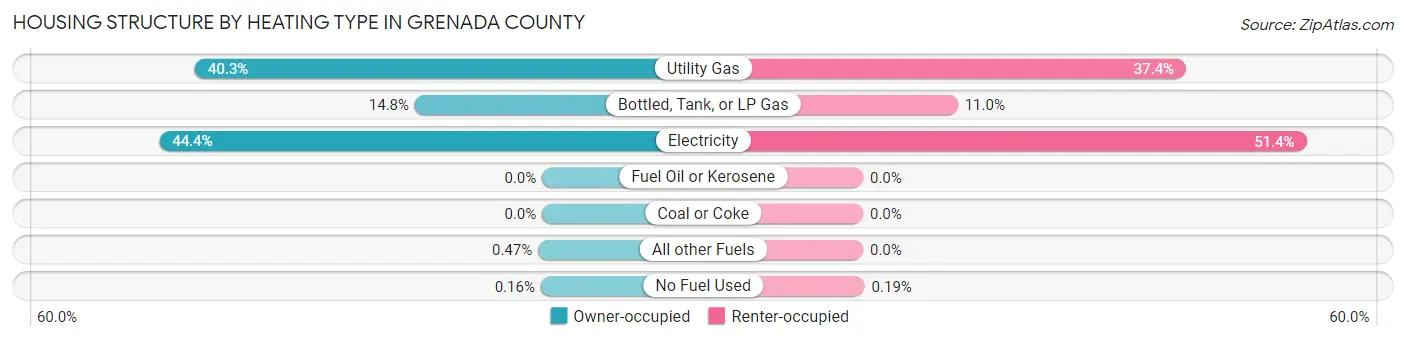
| Heating Type | Owner-occupied | Renter-occupied |
| Utility Gas | 2,317 (40.3%) | 1,002 (37.4%) |
| Bottled, Tank, or LP Gas | 849 (14.7%) | 294 (11.0%) |
| Electricity | 2,555 (44.4%) | 1,376 (51.4%) |
| Fuel Oil or Kerosene | 0 (0.0%) | 0 (0.0%) |
| Coal or Coke | 0 (0.0%) | 0 (0.0%) |
| All other Fuels | 27 (0.5%) | 0 (0.0%) |
| No Fuel Used | 9 (0.2%) | 5 (0.2%) |
| Total | 5,757 (100.0%) | 2,677 (100.0%) |
Household Vehicle Usage in Grenada County
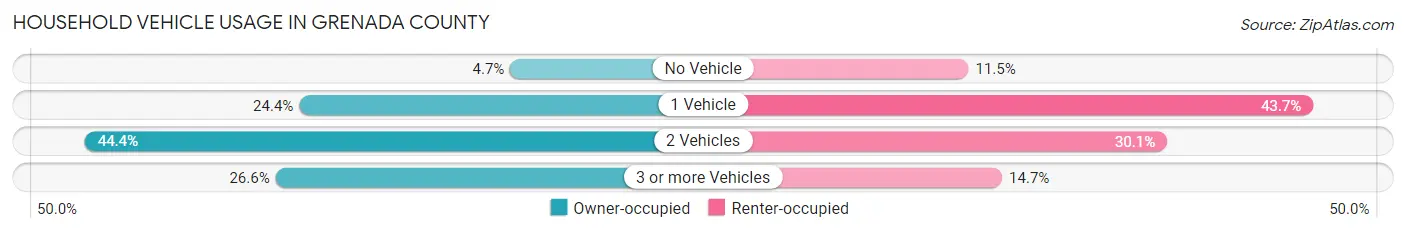
| Vehicles per Household | Owner-occupied | Renter-occupied |
| No Vehicle | 269 (4.7%) | 309 (11.5%) |
| 1 Vehicle | 1,403 (24.4%) | 1,170 (43.7%) |
| 2 Vehicles | 2,555 (44.4%) | 805 (30.1%) |
| 3 or more Vehicles | 1,530 (26.6%) | 393 (14.7%) |
| Total | 5,757 (100.0%) | 2,677 (100.0%) |
Real Estate & Mortgages in Grenada County
Real Estate and Mortgage Overview in Grenada County
| Characteristic | Without Mortgage | With Mortgage |
| Housing Units | 2,805 | 2,952 |
| Median Property Value | $110,000 | $159,400 |
| Median Household Income | $37,889 | $549 |
| Monthly Housing Costs | $394 | $242 |
| Real Estate Taxes | $885 | $599 |
Property Value by Mortgage Status in Grenada County
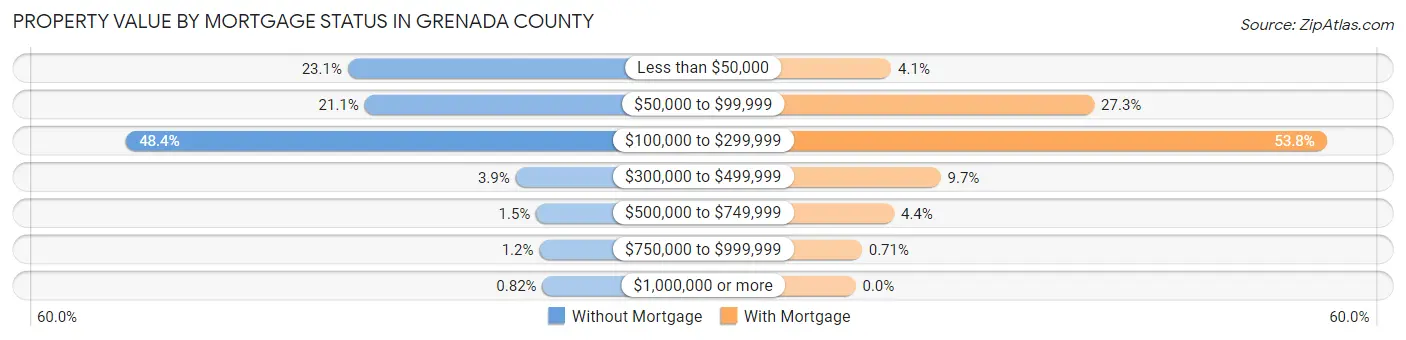
| Property Value | Without Mortgage | With Mortgage |
| Less than $50,000 | 647 (23.1%) | 120 (4.1%) |
| $50,000 to $99,999 | 593 (21.1%) | 805 (27.3%) |
| $100,000 to $299,999 | 1,357 (48.4%) | 1,589 (53.8%) |
| $300,000 to $499,999 | 109 (3.9%) | 287 (9.7%) |
| $500,000 to $749,999 | 43 (1.5%) | 130 (4.4%) |
| $750,000 to $999,999 | 33 (1.2%) | 21 (0.7%) |
| $1,000,000 or more | 23 (0.8%) | 0 (0.0%) |
| Total | 2,805 (100.0%) | 2,952 (100.0%) |
Household Income by Mortgage Status in Grenada County
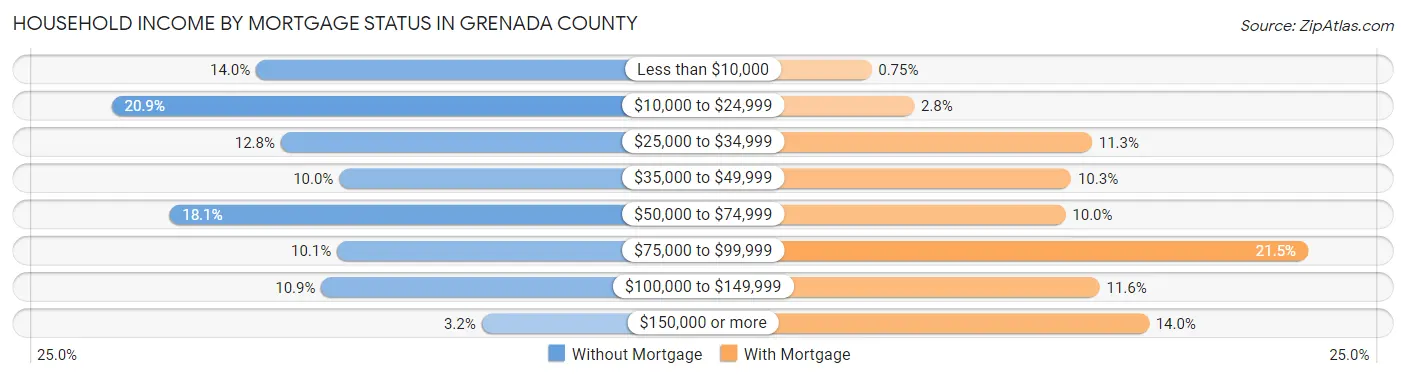
| Household Income | Without Mortgage | With Mortgage |
| Less than $10,000 | 392 (14.0%) | 22 (0.7%) |
| $10,000 to $24,999 | 585 (20.9%) | 82 (2.8%) |
| $25,000 to $34,999 | 359 (12.8%) | 332 (11.3%) |
| $35,000 to $49,999 | 281 (10.0%) | 303 (10.3%) |
| $50,000 to $74,999 | 508 (18.1%) | 295 (10.0%) |
| $75,000 to $99,999 | 284 (10.1%) | 636 (21.5%) |
| $100,000 to $149,999 | 305 (10.9%) | 343 (11.6%) |
| $150,000 or more | 91 (3.2%) | 412 (14.0%) |
| Total | 2,805 (100.0%) | 2,952 (100.0%) |
Property Value to Household Income Ratio in Grenada County
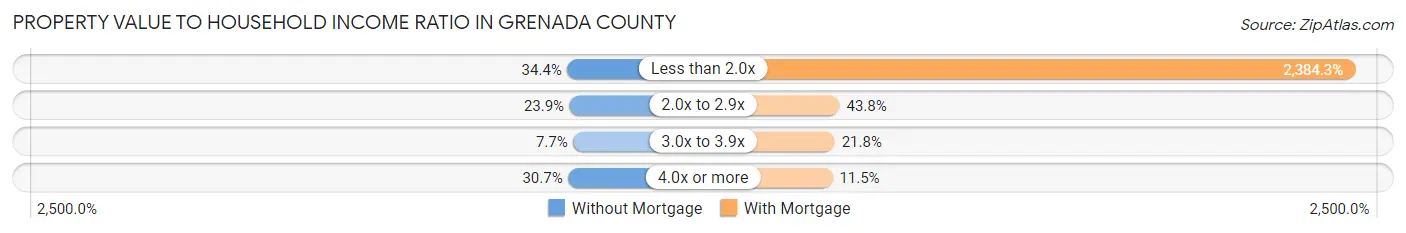
| Value-to-Income Ratio | Without Mortgage | With Mortgage |
| Less than 2.0x | 965 (34.4%) | 70,385 (2,384.3%) |
| 2.0x to 2.9x | 671 (23.9%) | 1,292 (43.8%) |
| 3.0x to 3.9x | 217 (7.7%) | 643 (21.8%) |
| 4.0x or more | 860 (30.7%) | 339 (11.5%) |
| Total | 2,805 (100.0%) | 2,952 (100.0%) |
Real Estate Taxes by Mortgage Status in Grenada County

| Property Taxes | Without Mortgage | With Mortgage |
| Less than $800 | 876 (31.2%) | 63 (2.1%) |
| $800 to $1,499 | 538 (19.2%) | 626 (21.2%) |
| $800 to $1,499 | 441 (15.7%) | 553 (18.7%) |
| Total | 2,805 (100.0%) | 2,952 (100.0%) |
Health & Disability in Grenada County
Health Insurance Coverage by Age in Grenada County
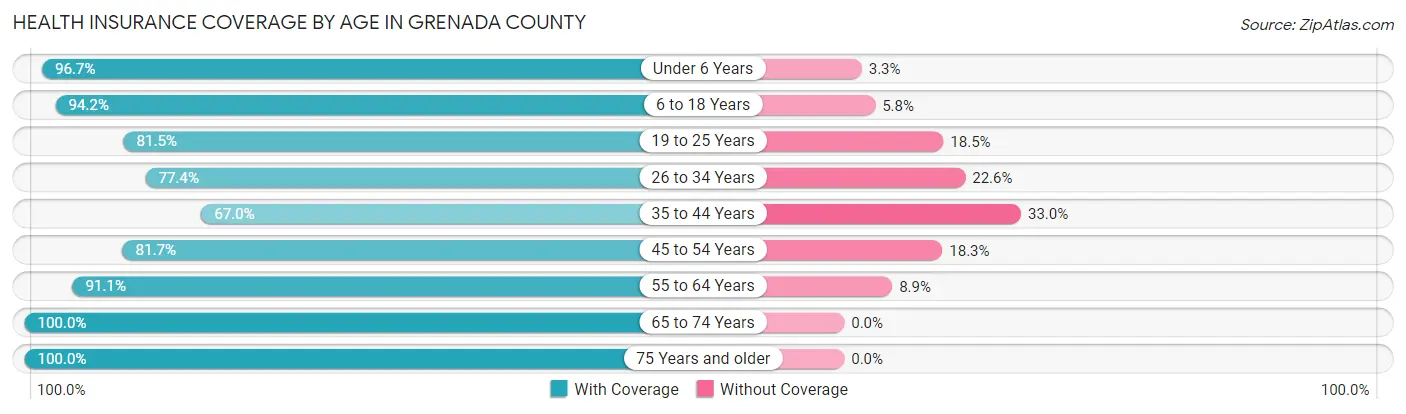
| Age Bracket | With Coverage | Without Coverage |
| Under 6 Years | 1,604 (96.7%) | 54 (3.3%) |
| 6 to 18 Years | 3,381 (94.2%) | 207 (5.8%) |
| 19 to 25 Years | 1,469 (81.5%) | 333 (18.5%) |
| 26 to 34 Years | 1,891 (77.4%) | 551 (22.6%) |
| 35 to 44 Years | 1,757 (67.0%) | 864 (33.0%) |
| 45 to 54 Years | 1,997 (81.7%) | 447 (18.3%) |
| 55 to 64 Years | 2,587 (91.1%) | 254 (8.9%) |
| 65 to 74 Years | 2,336 (100.0%) | 0 (0.0%) |
| 75 Years and older | 1,467 (100.0%) | 0 (0.0%) |
| Total | 18,489 (87.2%) | 2,710 (12.8%) |
Health Insurance Coverage by Citizenship Status in Grenada County
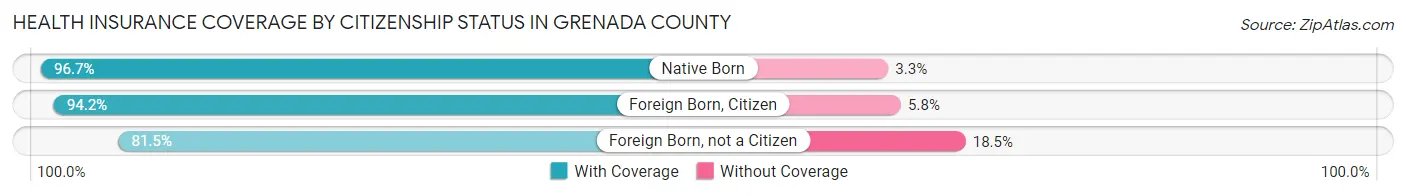
| Citizenship Status | With Coverage | Without Coverage |
| Native Born | 1,604 (96.7%) | 54 (3.3%) |
| Foreign Born, Citizen | 3,381 (94.2%) | 207 (5.8%) |
| Foreign Born, not a Citizen | 1,469 (81.5%) | 333 (18.5%) |
Health Insurance Coverage by Household Income in Grenada County
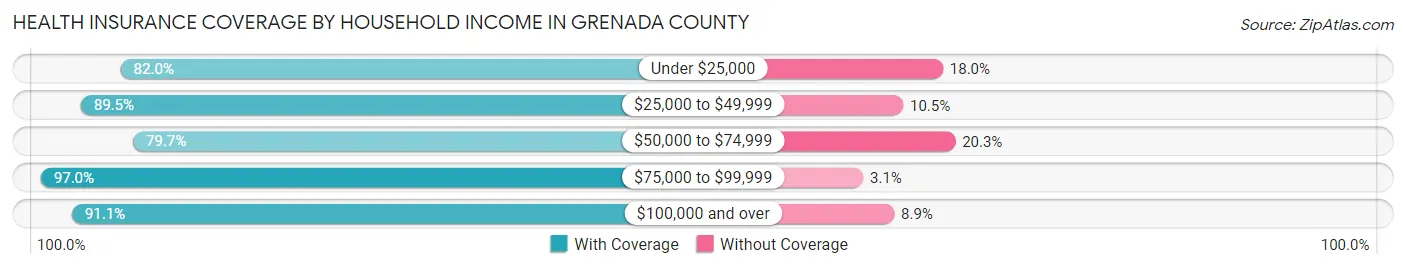
| Household Income | With Coverage | Without Coverage |
| Under $25,000 | 4,009 (82.0%) | 880 (18.0%) |
| $25,000 to $49,999 | 4,363 (89.5%) | 514 (10.5%) |
| $50,000 to $74,999 | 2,993 (79.7%) | 763 (20.3%) |
| $75,000 to $99,999 | 2,132 (97.0%) | 67 (3.0%) |
| $100,000 and over | 4,991 (91.1%) | 486 (8.9%) |
Public vs Private Health Insurance Coverage by Age in Grenada County
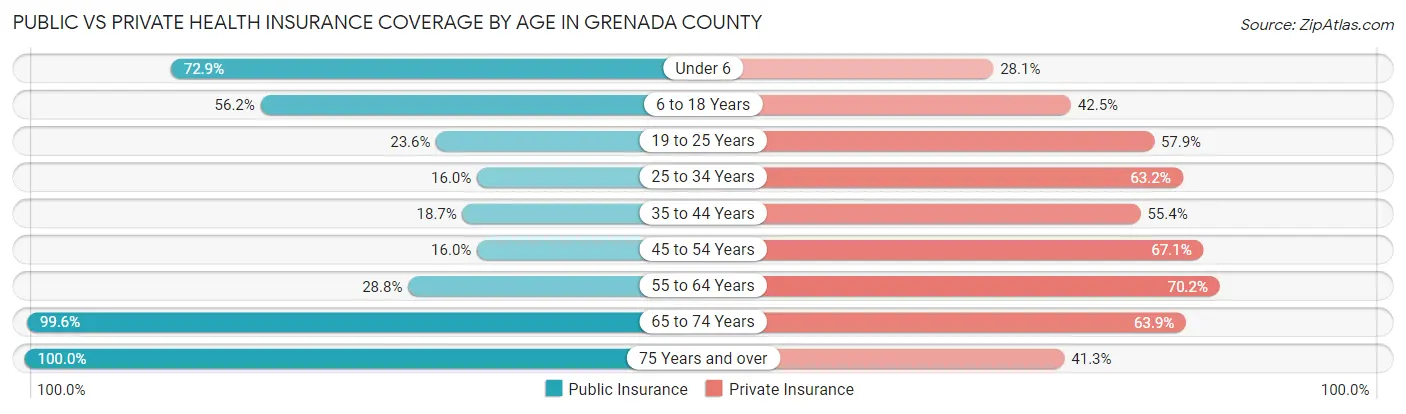
| Age Bracket | Public Insurance | Private Insurance |
| Under 6 | 1,208 (72.9%) | 466 (28.1%) |
| 6 to 18 Years | 2,016 (56.2%) | 1,526 (42.5%) |
| 19 to 25 Years | 425 (23.6%) | 1,044 (57.9%) |
| 25 to 34 Years | 391 (16.0%) | 1,544 (63.2%) |
| 35 to 44 Years | 490 (18.7%) | 1,453 (55.4%) |
| 45 to 54 Years | 391 (16.0%) | 1,641 (67.1%) |
| 55 to 64 Years | 818 (28.8%) | 1,993 (70.2%) |
| 65 to 74 Years | 2,326 (99.6%) | 1,493 (63.9%) |
| 75 Years and over | 1,467 (100.0%) | 606 (41.3%) |
| Total | 9,532 (45.0%) | 11,766 (55.5%) |
Disability Status by Sex by Age in Grenada County
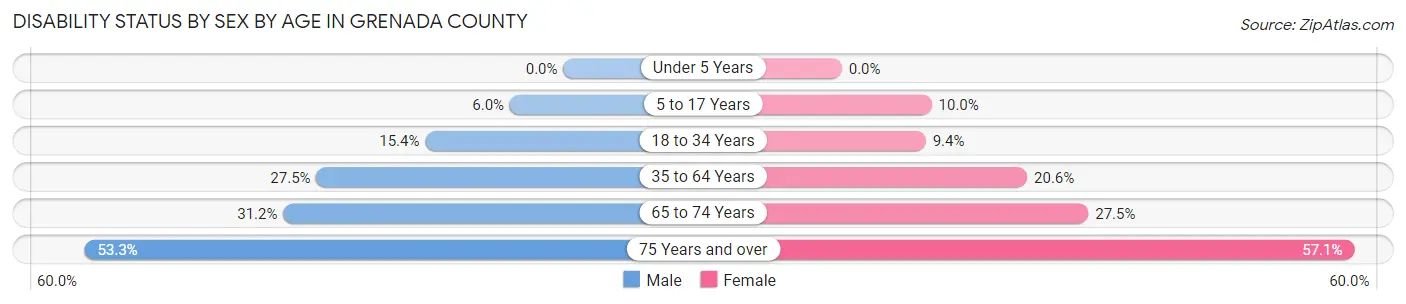
| Age Bracket | Male | Female |
| Under 5 Years | 0 (0.0%) | 0 (0.0%) |
| 5 to 17 Years | 123 (5.9%) | 176 (10.0%) |
| 18 to 34 Years | 321 (15.4%) | 213 (9.3%) |
| 35 to 64 Years | 1,038 (27.5%) | 853 (20.6%) |
| 65 to 74 Years | 340 (31.2%) | 342 (27.5%) |
| 75 Years and over | 288 (53.3%) | 529 (57.1%) |
Disability Class by Sex by Age in Grenada County
Disability Class: Hearing Difficulty
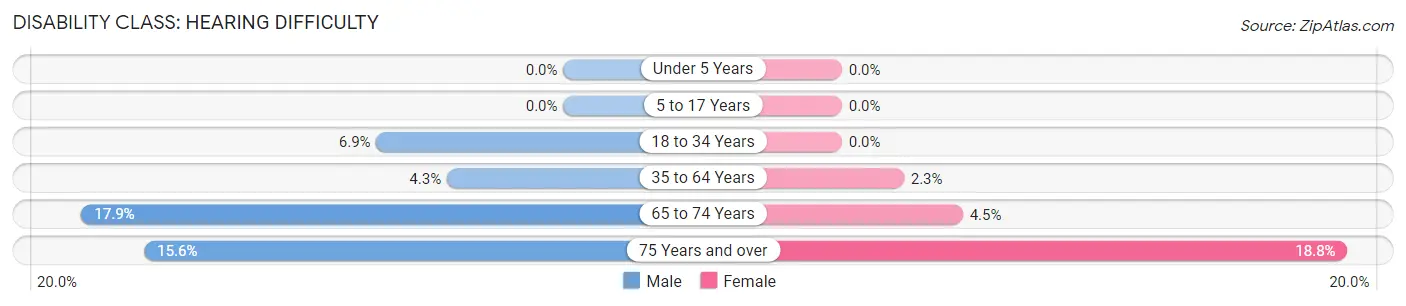
| Age Bracket | Male | Female |
| Under 5 Years | 0 (0.0%) | 0 (0.0%) |
| 5 to 17 Years | 0 (0.0%) | 0 (0.0%) |
| 18 to 34 Years | 145 (6.9%) | 0 (0.0%) |
| 35 to 64 Years | 163 (4.3%) | 95 (2.3%) |
| 65 to 74 Years | 195 (17.9%) | 56 (4.5%) |
| 75 Years and over | 84 (15.6%) | 174 (18.8%) |
Disability Class: Vision Difficulty
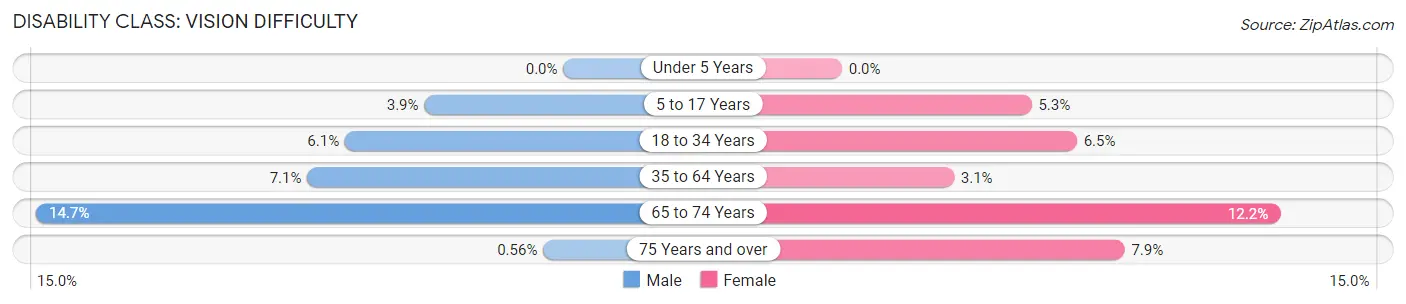
| Age Bracket | Male | Female |
| Under 5 Years | 0 (0.0%) | 0 (0.0%) |
| 5 to 17 Years | 80 (3.9%) | 93 (5.3%) |
| 18 to 34 Years | 127 (6.1%) | 149 (6.5%) |
| 35 to 64 Years | 269 (7.1%) | 129 (3.1%) |
| 65 to 74 Years | 160 (14.7%) | 152 (12.2%) |
| 75 Years and over | 3 (0.6%) | 73 (7.9%) |
Disability Class: Cognitive Difficulty
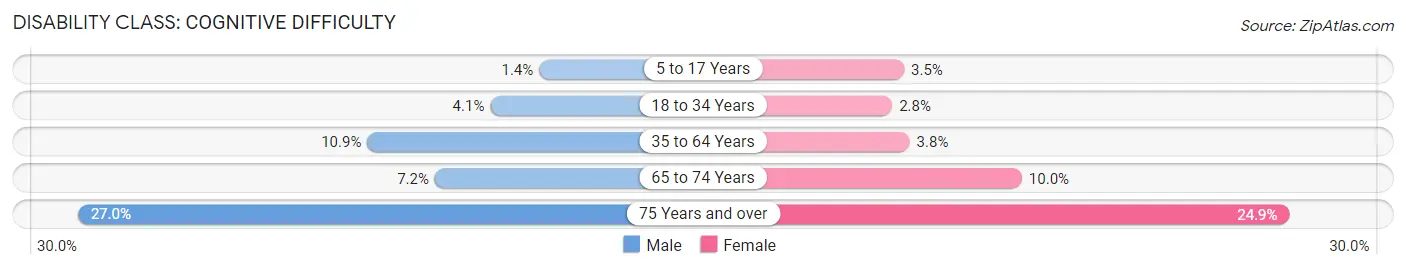
| Age Bracket | Male | Female |
| 5 to 17 Years | 28 (1.3%) | 61 (3.5%) |
| 18 to 34 Years | 85 (4.1%) | 64 (2.8%) |
| 35 to 64 Years | 412 (10.9%) | 156 (3.8%) |
| 65 to 74 Years | 78 (7.2%) | 125 (10.0%) |
| 75 Years and over | 146 (27.0%) | 231 (24.9%) |
Disability Class: Ambulatory Difficulty
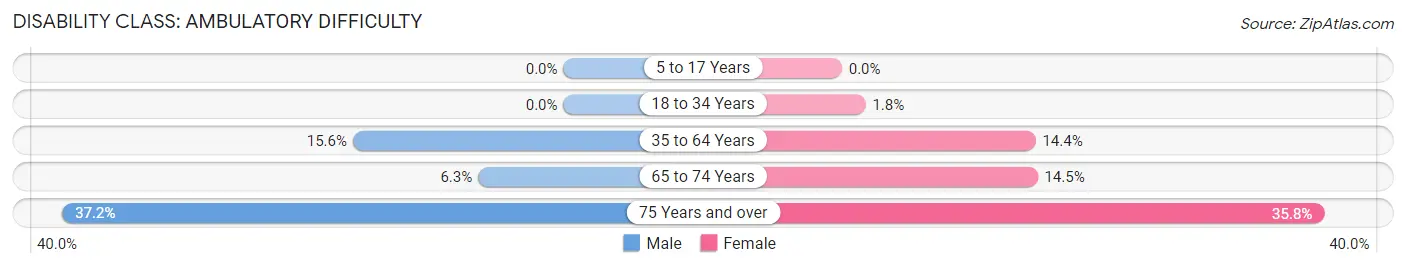
| Age Bracket | Male | Female |
| 5 to 17 Years | 0 (0.0%) | 0 (0.0%) |
| 18 to 34 Years | 0 (0.0%) | 40 (1.8%) |
| 35 to 64 Years | 590 (15.6%) | 594 (14.4%) |
| 65 to 74 Years | 69 (6.3%) | 181 (14.5%) |
| 75 Years and over | 201 (37.2%) | 332 (35.8%) |
Disability Class: Self-Care Difficulty
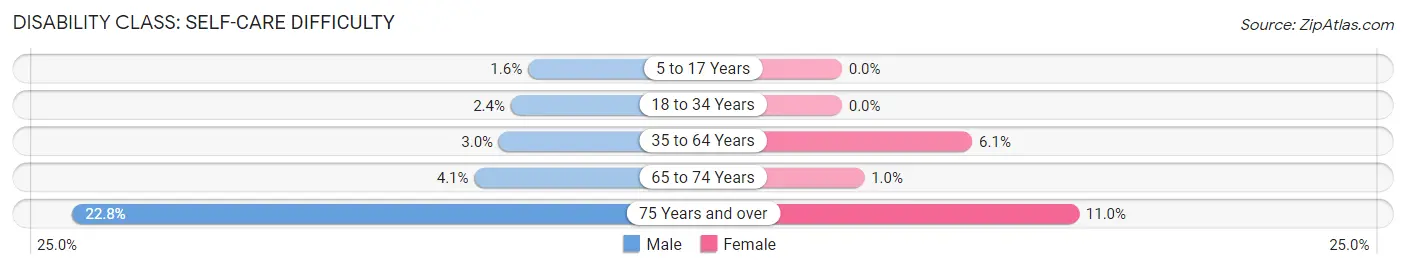
| Age Bracket | Male | Female |
| 5 to 17 Years | 34 (1.6%) | 0 (0.0%) |
| 18 to 34 Years | 51 (2.4%) | 0 (0.0%) |
| 35 to 64 Years | 113 (3.0%) | 250 (6.0%) |
| 65 to 74 Years | 45 (4.1%) | 13 (1.0%) |
| 75 Years and over | 123 (22.8%) | 102 (11.0%) |
Technology Access in Grenada County
Computing Device Access in Grenada County
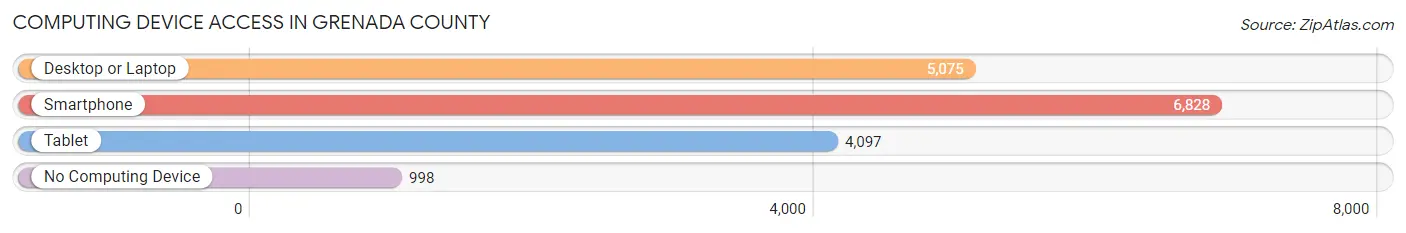
| Device Type | # Households | % Households |
| Desktop or Laptop | 5,075 | 60.2% |
| Smartphone | 6,828 | 81.0% |
| Tablet | 4,097 | 48.6% |
| No Computing Device | 998 | 11.8% |
| Total | 8,434 | 100.0% |
Internet Access in Grenada County
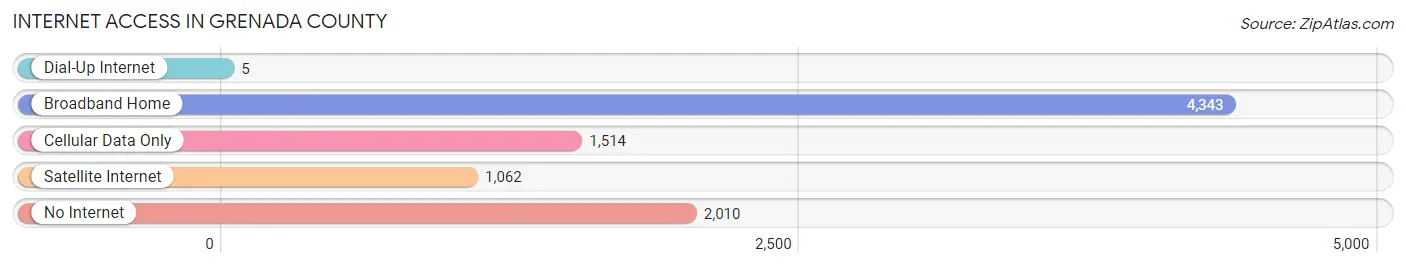
| Internet Type | # Households | % Households |
| Dial-Up Internet | 5 | 0.1% |
| Broadband Home | 4,343 | 51.5% |
| Cellular Data Only | 1,514 | 17.9% |
| Satellite Internet | 1,062 | 12.6% |
| No Internet | 2,010 | 23.8% |
| Total | 8,434 | 100.0% |
Grenada County Summary
Grenada County is located in the north-central region of Mississippi, and is part of the Delta region of the state. The county is bordered by Tallahatchie County to the north, Yalobusha County to the east, Montgomery County to the south, and Carroll County to the west. The county seat is the city of Grenada, which is located in the center of the county.
Geography
Grenada County covers an area of 576 square miles, and is located in the flat, alluvial plain of the Mississippi Delta. The county is drained by the Yalobusha River, which flows through the center of the county from north to south. The terrain is mostly flat, with some rolling hills in the northern part of the county. The soil is mostly sandy loam, with some clay in the northern part of the county. The climate is humid subtropical, with hot, humid summers and mild winters.
Demographics
As of the 2010 census, there were 21,851 people, 8,072 households, and 5,541 families residing in the county. The population density was 38 people per square mile. The racial makeup of the county was 57.3% White, 40.2% African American, 0.3% Native American, 0.3% Asian, 0.1% Pacific Islander, 0.7% from other races, and 1.1% from two or more races. Hispanic or Latino of any race were 1.7% of the population.
The median income for a household in the county was $30,945, and the median income for a family was $37,945. The per capita income for the county was $15,945. About 22.3% of families and 27.2% of the population were below the poverty line, including 37.2% of those under age 18 and 22.2% of those age 65 or over.
Economy
Grenada County’s economy is largely based on agriculture. The county is home to a number of large farms, which produce cotton, soybeans, corn, and other crops. The county is also home to a number of manufacturing plants, which produce furniture, textiles, and other products. The county is also home to a number of small businesses, including restaurants, retail stores, and service providers.
History
Grenada County was established in 1833, and was named after the city of Grenada, which was founded in 1836. The county was originally part of the Choctaw Nation, and was later part of the Chickasaw Nation. The county was home to a number of Native American tribes, including the Choctaw, Chickasaw, and Natchez.
During the Civil War, the county was the site of a number of battles, including the Battle of Grenada, which was fought in 1863. After the war, the county was home to a number of freedmen, who established a number of small farms and businesses.
In the early 20th century, the county was home to a number of large plantations, which produced cotton, corn, and other crops. The county was also home to a number of small towns, which were home to a number of small businesses.
In the late 20th century, the county was home to a number of manufacturing plants, which produced furniture, textiles, and other products. The county was also home to a number of small businesses, including restaurants, retail stores, and service providers.
Today, Grenada County is a largely rural county, with a population of just over 21,000. The county is home to a number of large farms, which produce cotton, soybeans, corn, and other crops. The county is also home to a number of manufacturing plants, which produce furniture, textiles, and other products. The county is also home to a number of small businesses, including restaurants, retail stores, and service providers.
Common Questions
What is Per Capita Income in Grenada County?
Per Capita income in Grenada County is $27,128.
What is the Median Family Income in Grenada County?
Median Family Income in Grenada County is $62,879.
What is the Median Household income in Grenada County?
Median Household Income in Grenada County is $45,745.
What is Income or Wage Gap in Grenada County?
Income or Wage Gap in Grenada County is 25.5%.
Women in Grenada County earn 74.5 cents for every dollar earned by a man.
What is Inequality or Gini Index in Grenada County?
Inequality or Gini Index in Grenada County is 0.50.
What is the Total Population of Grenada County?
Total Population of Grenada County is 21,474.
What is the Total Male Population of Grenada County?
Total Male Population of Grenada County is 10,391.
What is the Total Female Population of Grenada County?
Total Female Population of Grenada County is 11,083.
What is the Ratio of Males per 100 Females in Grenada County?
There are 93.76 Males per 100 Females in Grenada County.
What is the Ratio of Females per 100 Males in Grenada County?
There are 106.66 Females per 100 Males in Grenada County.
What is the Median Population Age in Grenada County?
Median Population Age in Grenada County is 38.4 Years.
What is the Average Family Size in Grenada County
Average Family Size in Grenada County is 3.1 People.
What is the Average Household Size in Grenada County
Average Household Size in Grenada County is 2.5 People.
How Large is the Labor Force in Grenada County?
There are 9,435 People in the Labor Forcein in Grenada County.
What is the Percentage of People in the Labor Force in Grenada County?
55.1% of People are in the Labor Force in Grenada County.
What is the Unemployment Rate in Grenada County?
Unemployment Rate in Grenada County is 4.1%.