Coahoma County, MS Map & Demographics
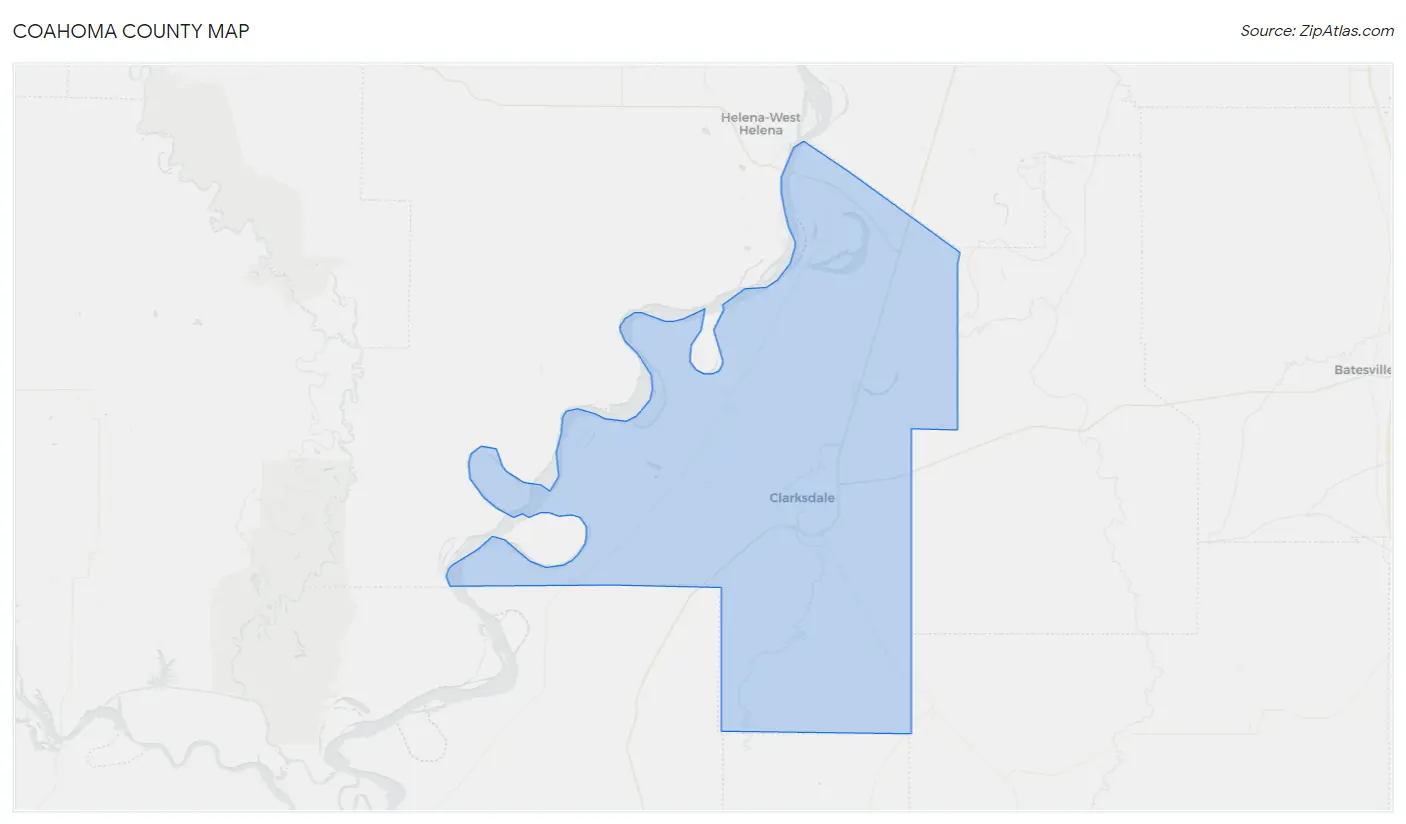
Coahoma County Map
Coahoma County Overview
$22,701
PER CAPITA INCOME
$43,603
AVG FAMILY INCOME
$36,075
AVG HOUSEHOLD INCOME
34.7%
WAGE / INCOME GAP [ % ]
65.3¢/ $1
WAGE / INCOME GAP [ $ ]
$11,447
FAMILY INCOME DEFICIT
0.52
INEQUALITY / GINI INDEX
21,264
TOTAL POPULATION
9,982
MALE POPULATION
11,282
FEMALE POPULATION
88.48
MALES / 100 FEMALES
113.02
FEMALES / 100 MALES
35.7
MEDIAN AGE
3.2
AVG FAMILY SIZE
2.5
AVG HOUSEHOLD SIZE
8,496
LABOR FORCE [ PEOPLE ]
52.4%
PERCENT IN LABOR FORCE
10.8%
UNEMPLOYMENT RATE
Coahoma County Area Codes
Income in Coahoma County
Income Overview in Coahoma County
Per Capita Income in Coahoma County is $22,701, while median incomes of families and households are $43,603 and $36,075 respectively.
| Characteristic | Number | Measure |
| Per Capita Income | 21,264 | $22,701 |
| Median Family Income | 5,135 | $43,603 |
| Mean Family Income | 5,135 | $63,333 |
| Median Household Income | 8,387 | $36,075 |
| Mean Household Income | 8,387 | $54,256 |
| Income Deficit | 5,135 | $11,447 |
| Wage / Income Gap (%) | 21,264 | 34.75% |
| Wage / Income Gap ($) | 21,264 | 65.25¢ per $1 |
| Gini / Inequality Index | 21,264 | 0.52 |
Earnings by Sex in Coahoma County
Average Earnings in Coahoma County are $26,851, $35,271 for men and $23,016 for women, a difference of 34.7%.
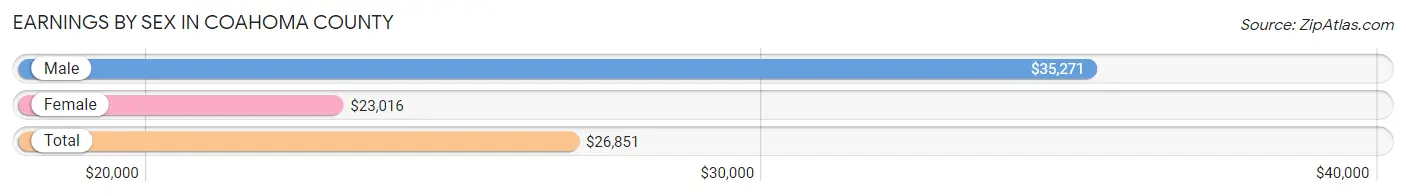
| Sex | Number | Average Earnings |
| Male | 3,908 (46.5%) | $35,271 |
| Female | 4,502 (53.5%) | $23,016 |
| Total | 8,410 (100.0%) | $26,851 |
Earnings by Sex by Income Bracket in Coahoma County
The most common earnings brackets in Coahoma County are $75,000 to $99,999 for men (526 | 13.5%) and $15,000 to $17,499 for women (422 | 9.4%).
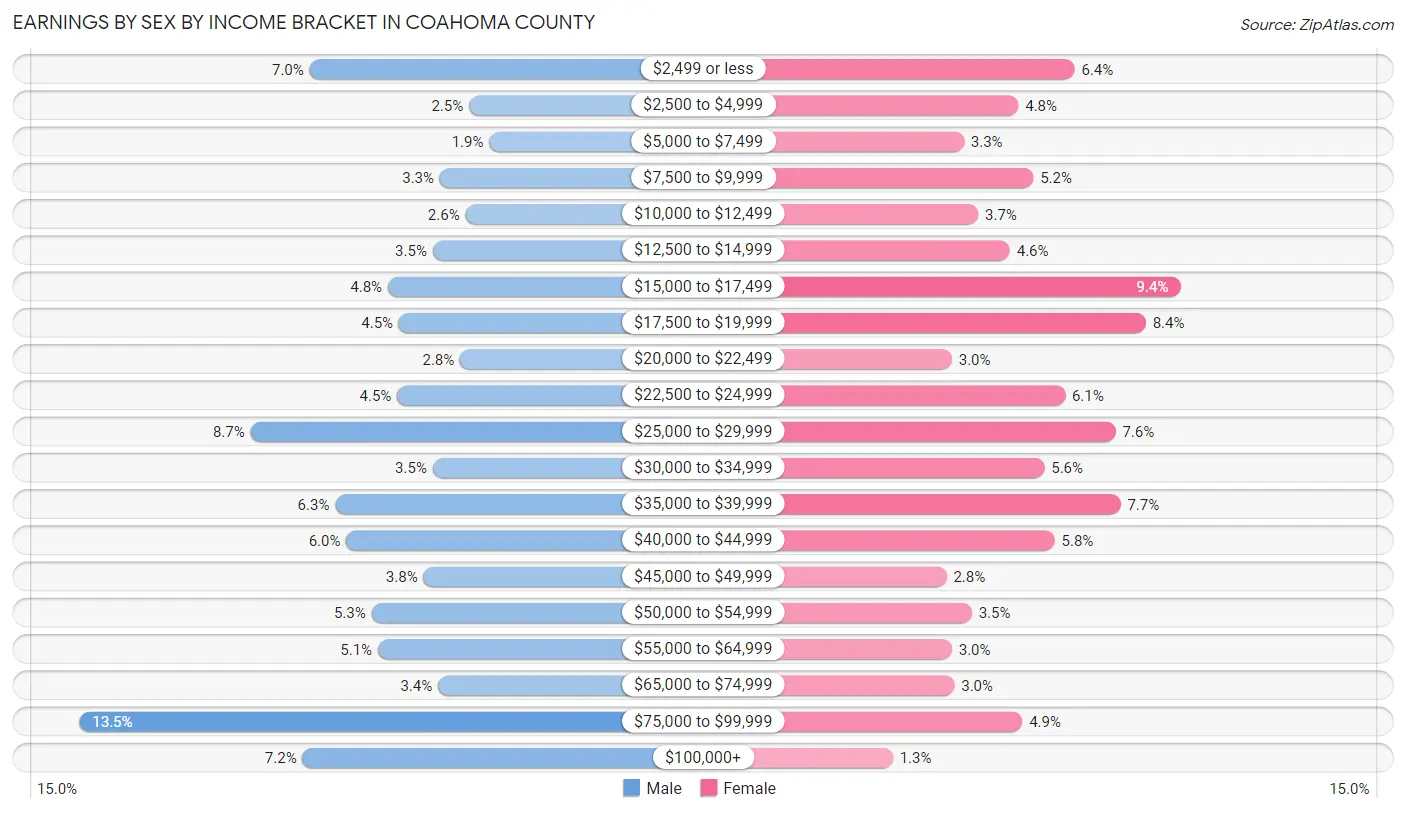
| Income | Male | Female |
| $2,499 or less | 273 (7.0%) | 288 (6.4%) |
| $2,500 to $4,999 | 98 (2.5%) | 217 (4.8%) |
| $5,000 to $7,499 | 76 (1.9%) | 148 (3.3%) |
| $7,500 to $9,999 | 130 (3.3%) | 236 (5.2%) |
| $10,000 to $12,499 | 102 (2.6%) | 166 (3.7%) |
| $12,500 to $14,999 | 138 (3.5%) | 206 (4.6%) |
| $15,000 to $17,499 | 187 (4.8%) | 422 (9.4%) |
| $17,500 to $19,999 | 175 (4.5%) | 378 (8.4%) |
| $20,000 to $22,499 | 108 (2.8%) | 133 (2.9%) |
| $22,500 to $24,999 | 177 (4.5%) | 276 (6.1%) |
| $25,000 to $29,999 | 338 (8.6%) | 340 (7.5%) |
| $30,000 to $34,999 | 138 (3.5%) | 250 (5.6%) |
| $35,000 to $39,999 | 245 (6.3%) | 346 (7.7%) |
| $40,000 to $44,999 | 233 (6.0%) | 263 (5.8%) |
| $45,000 to $49,999 | 148 (3.8%) | 126 (2.8%) |
| $50,000 to $54,999 | 205 (5.2%) | 158 (3.5%) |
| $55,000 to $64,999 | 198 (5.1%) | 133 (2.9%) |
| $65,000 to $74,999 | 132 (3.4%) | 136 (3.0%) |
| $75,000 to $99,999 | 526 (13.5%) | 222 (4.9%) |
| $100,000+ | 281 (7.2%) | 58 (1.3%) |
| Total | 3,908 (100.0%) | 4,502 (100.0%) |
Earnings by Sex by Educational Attainment in Coahoma County
Average earnings in Coahoma County are $38,045 for men and $24,635 for women, a difference of 35.2%. Men with an educational attainment of graduate degree enjoy the highest average annual earnings of $67,171, while those with less than high school education earn the least with $25,699. Women with an educational attainment of bachelor's degree earn the most with the average annual earnings of $44,352, while those with less than high school education have the smallest earnings of $17,212.
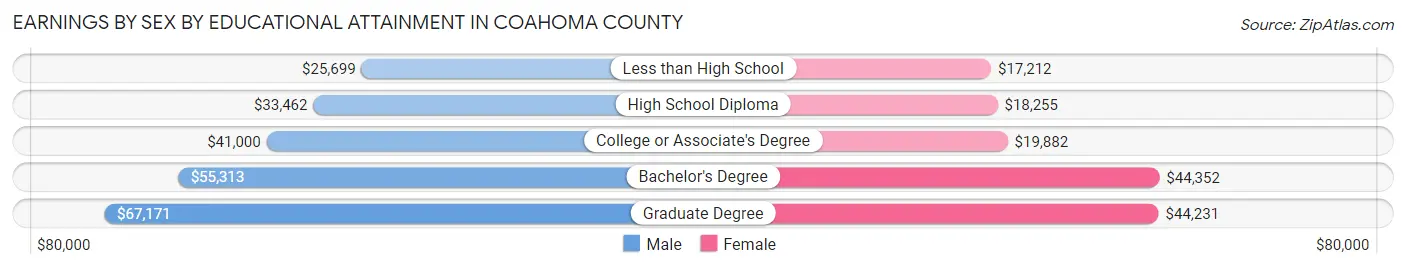
| Educational Attainment | Male Income | Female Income |
| Less than High School | $25,699 | $17,212 |
| High School Diploma | $33,462 | $18,255 |
| College or Associate's Degree | $41,000 | $19,882 |
| Bachelor's Degree | $55,313 | $44,352 |
| Graduate Degree | $67,171 | $44,231 |
| Total | $38,045 | $24,635 |
Family Income in Coahoma County
Family Income Brackets in Coahoma County
According to the Coahoma County family income data, there are 847 families falling into the $35,000 to $49,999 income range, which is the most common income bracket and makes up 16.5% of all families. Conversely, the $150,000 to $199,999 income bracket is the least frequent group with only 92 families (1.8%) belonging to this category.
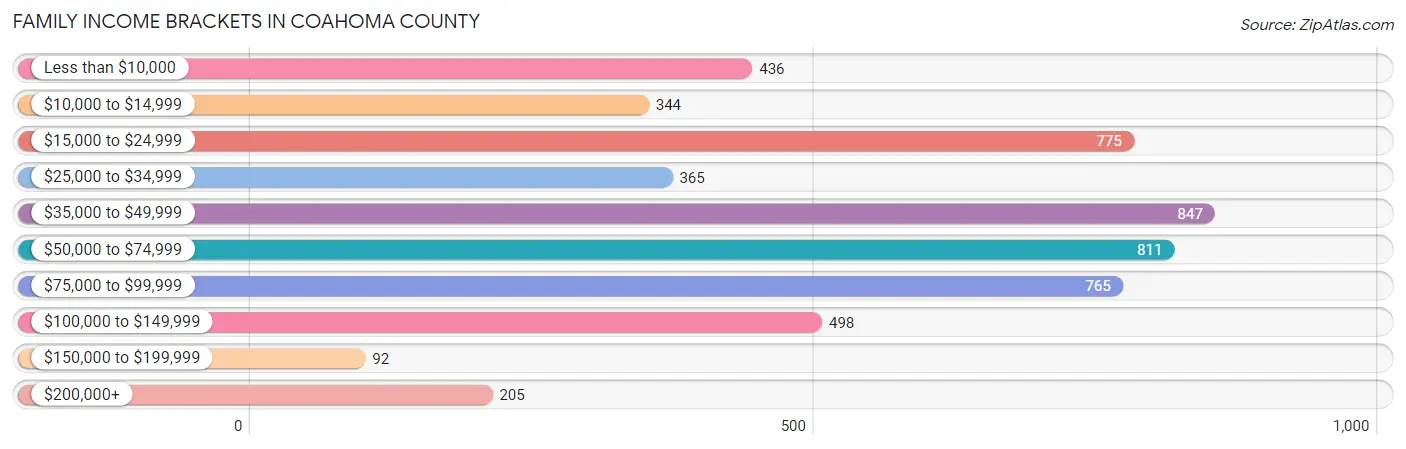
| Income Bracket | # Families | % Families |
| Less than $10,000 | 436 | 8.5% |
| $10,000 to $14,999 | 344 | 6.7% |
| $15,000 to $24,999 | 775 | 15.1% |
| $25,000 to $34,999 | 365 | 7.1% |
| $35,000 to $49,999 | 847 | 16.5% |
| $50,000 to $74,999 | 811 | 15.8% |
| $75,000 to $99,999 | 765 | 14.9% |
| $100,000 to $149,999 | 498 | 9.7% |
| $150,000 to $199,999 | 92 | 1.8% |
| $200,000+ | 205 | 4.0% |
Family Income by Famaliy Size in Coahoma County
7+ person families (155 | 3.0%) account for the highest median family income in Coahoma County with $50,422 per family, while 2-person families (2,307 | 44.9%) have the highest median income of $23,062 per family member.
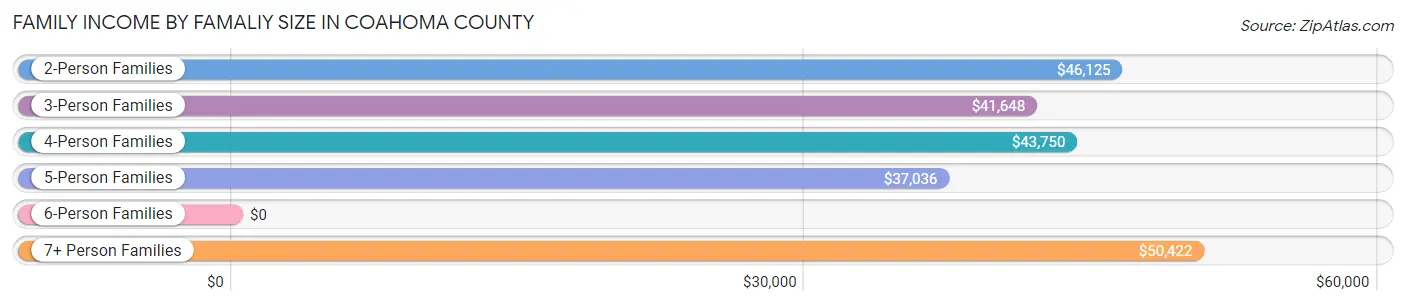
| Income Bracket | # Families | Median Income |
| 2-Person Families | 2,307 (44.9%) | $46,125 |
| 3-Person Families | 1,266 (24.6%) | $41,648 |
| 4-Person Families | 946 (18.4%) | $43,750 |
| 5-Person Families | 389 (7.6%) | $37,036 |
| 6-Person Families | 72 (1.4%) | $0 |
| 7+ Person Families | 155 (3.0%) | $50,422 |
| Total | 5,135 (100.0%) | $43,603 |
Family Income by Number of Earners in Coahoma County
The median family income in Coahoma County is $43,603, with families comprising 2 earners (1,352) having the highest median family income of $94,085, while families with no earners (1,160) have the lowest median family income of $22,206, accounting for 26.3% and 22.6% of families, respectively.
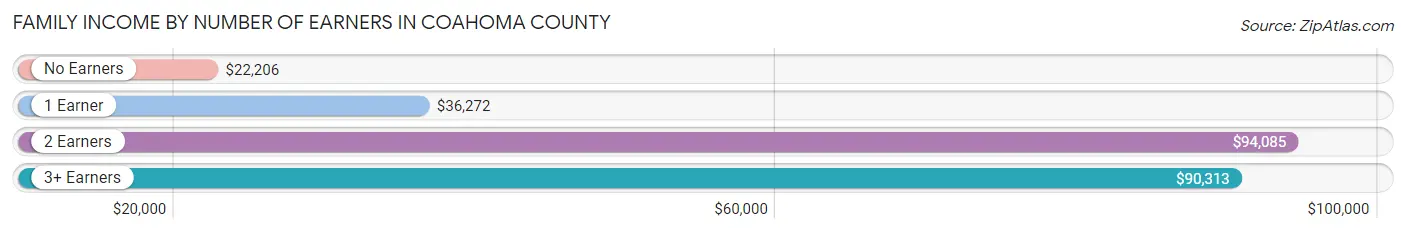
| Number of Earners | # Families | Median Income |
| No Earners | 1,160 (22.6%) | $22,206 |
| 1 Earner | 2,430 (47.3%) | $36,272 |
| 2 Earners | 1,352 (26.3%) | $94,085 |
| 3+ Earners | 193 (3.8%) | $90,313 |
| Total | 5,135 (100.0%) | $43,603 |
Household Income in Coahoma County
Household Income Brackets in Coahoma County
With 1,384 households falling in the category, the $15,000 to $24,999 income range is the most frequent in Coahoma County, accounting for 16.5% of all households. In contrast, only 101 households (1.2%) fall into the $150,000 to $199,999 income bracket, making it the least populous group.
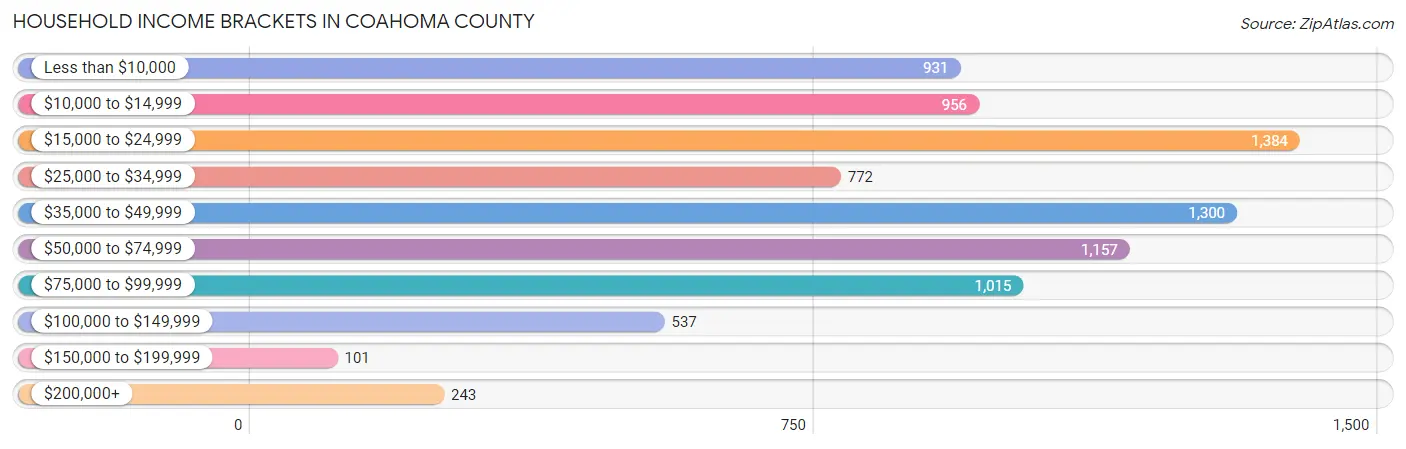
| Income Bracket | # Households | % Households |
| Less than $10,000 | 931 | 11.1% |
| $10,000 to $14,999 | 956 | 11.4% |
| $15,000 to $24,999 | 1,384 | 16.5% |
| $25,000 to $34,999 | 772 | 9.2% |
| $35,000 to $49,999 | 1,300 | 15.5% |
| $50,000 to $74,999 | 1,157 | 13.8% |
| $75,000 to $99,999 | 1,015 | 12.1% |
| $100,000 to $149,999 | 537 | 6.4% |
| $150,000 to $199,999 | 101 | 1.2% |
| $200,000+ | 243 | 2.9% |
Household Income by Householder Age in Coahoma County
The median household income in Coahoma County is $36,075, with the highest median household income of $43,971 found in the 15 to 24 years age bracket for the primary householder. A total of 236 households (2.8%) fall into this category. Meanwhile, the 25 to 44 years age bracket for the primary householder has the lowest median household income of $32,299, with 2,451 households (29.2%) in this group.
| Income Bracket | # Households | Median Income |
| 15 to 24 Years | 236 (2.8%) | $43,971 |
| 25 to 44 Years | 2,451 (29.2%) | $32,299 |
| 45 to 64 Years | 3,324 (39.6%) | $39,403 |
| 65+ Years | 2,376 (28.3%) | $34,254 |
| Total | 8,387 (100.0%) | $36,075 |
Poverty in Coahoma County
Income Below Poverty by Sex and Age in Coahoma County
With 35.3% poverty level for males and 38.4% for females among the residents of Coahoma County, 15 year old males and 12 to 14 year old females are the most vulnerable to poverty, with 118 males (81.4%) and 252 females (73.5%) in their respective age groups living below the poverty level.
| Age Bracket | Male | Female |
| Under 5 Years | 442 (63.4%) | 434 (50.9%) |
| 5 Years | 95 (61.7%) | 44 (48.9%) |
| 6 to 11 Years | 390 (42.5%) | 360 (32.3%) |
| 12 to 14 Years | 298 (56.3%) | 252 (73.5%) |
| 15 Years | 118 (81.4%) | 60 (42.5%) |
| 16 and 17 Years | 146 (46.9%) | 144 (48.6%) |
| 18 to 24 Years | 441 (49.8%) | 623 (65.4%) |
| 25 to 34 Years | 463 (38.3%) | 742 (52.9%) |
| 35 to 44 Years | 275 (26.2%) | 539 (40.7%) |
| 45 to 54 Years | 201 (19.8%) | 313 (24.9%) |
| 55 to 64 Years | 340 (27.4%) | 412 (28.2%) |
| 65 to 74 Years | 125 (13.0%) | 205 (19.2%) |
| 75 Years and over | 28 (6.9%) | 133 (16.8%) |
| Total | 3,362 (35.3%) | 4,261 (38.4%) |
Income Above Poverty by Sex and Age in Coahoma County
According to the poverty statistics in Coahoma County, males aged 75 years and over and females aged 75 years and over are the age groups that are most secure financially, with 93.1% of males and 83.3% of females in these age groups living above the poverty line.
| Age Bracket | Male | Female |
| Under 5 Years | 255 (36.6%) | 419 (49.1%) |
| 5 Years | 59 (38.3%) | 46 (51.1%) |
| 6 to 11 Years | 527 (57.5%) | 756 (67.7%) |
| 12 to 14 Years | 231 (43.7%) | 91 (26.5%) |
| 15 Years | 27 (18.6%) | 81 (57.5%) |
| 16 and 17 Years | 165 (53.0%) | 152 (51.3%) |
| 18 to 24 Years | 445 (50.2%) | 329 (34.6%) |
| 25 to 34 Years | 747 (61.7%) | 661 (47.1%) |
| 35 to 44 Years | 773 (73.8%) | 784 (59.3%) |
| 45 to 54 Years | 812 (80.2%) | 946 (75.1%) |
| 55 to 64 Years | 902 (72.6%) | 1,050 (71.8%) |
| 65 to 74 Years | 835 (87.0%) | 865 (80.8%) |
| 75 Years and over | 377 (93.1%) | 661 (83.3%) |
| Total | 6,155 (64.7%) | 6,841 (61.6%) |
Income Below Poverty Among Married-Couple Families in Coahoma County
The poverty statistics for married-couple families in Coahoma County show that 2.0% or 42 of the total 2,110 families live below the poverty line. Families with 3 or 4 children have the highest poverty rate of 10.5%, comprising of 11 families. On the other hand, families with 5 or more children have the lowest poverty rate of 0.0%, which includes 0 families.
| Children | Above Poverty | Below Poverty |
| No Children | 1,302 (99.2%) | 11 (0.8%) |
| 1 or 2 Children | 670 (97.1%) | 20 (2.9%) |
| 3 or 4 Children | 94 (89.5%) | 11 (10.5%) |
| 5 or more Children | 2 (100.0%) | 0 (0.0%) |
| Total | 2,068 (98.0%) | 42 (2.0%) |
Income Below Poverty Among Single-Parent Households in Coahoma County
According to the poverty data in Coahoma County, 44.8% or 265 single-father households and 51.1% or 1,244 single-mother households are living below the poverty line. Among single-father households, those with 1 or 2 children have the highest poverty rate, with 132 households (60.6%) experiencing poverty. Likewise, among single-mother households, those with 5 or more children have the highest poverty rate, with 129 households (100.0%) falling below the poverty line.
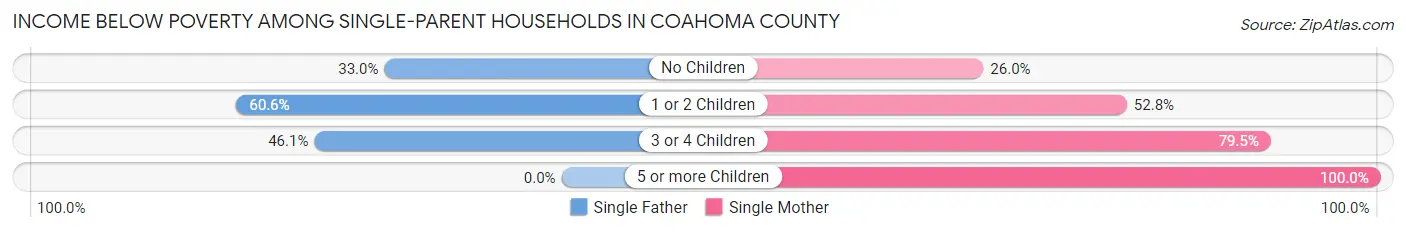
| Children | Single Father | Single Mother |
| No Children | 98 (33.0%) | 189 (26.0%) |
| 1 or 2 Children | 132 (60.6%) | 650 (52.8%) |
| 3 or 4 Children | 35 (46.1%) | 276 (79.5%) |
| 5 or more Children | 0 (0.0%) | 129 (100.0%) |
| Total | 265 (44.8%) | 1,244 (51.1%) |
Income Below Poverty Among Married-Couple vs Single-Parent Households in Coahoma County
The poverty data for Coahoma County shows that 42 of the married-couple family households (2.0%) and 1,509 of the single-parent households (49.9%) are living below the poverty level. Within the married-couple family households, those with 3 or 4 children have the highest poverty rate, with 11 households (10.5%) falling below the poverty line. Among the single-parent households, those with 5 or more children have the highest poverty rate, with 129 household (100.0%) living below poverty.
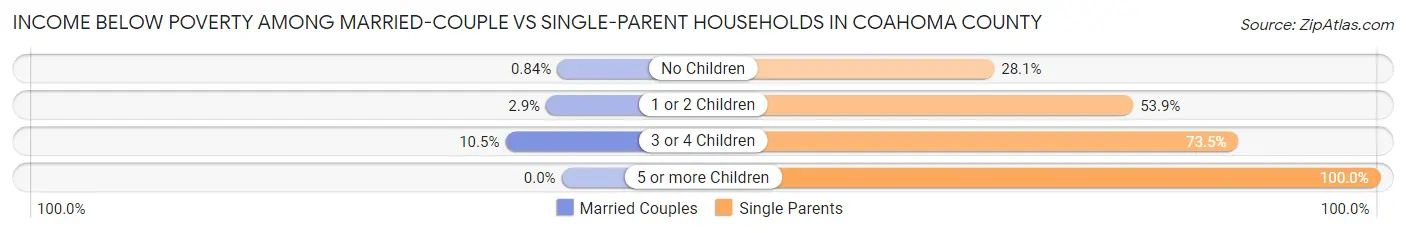
| Children | Married-Couple Families | Single-Parent Households |
| No Children | 11 (0.8%) | 287 (28.1%) |
| 1 or 2 Children | 20 (2.9%) | 782 (53.9%) |
| 3 or 4 Children | 11 (10.5%) | 311 (73.5%) |
| 5 or more Children | 0 (0.0%) | 129 (100.0%) |
| Total | 42 (2.0%) | 1,509 (49.9%) |
Race in Coahoma County
The most populous races in Coahoma County are Black / African American (16,148 | 75.9%), White / Caucasian (4,206 | 19.8%), and Two or more Races (759 | 3.6%).
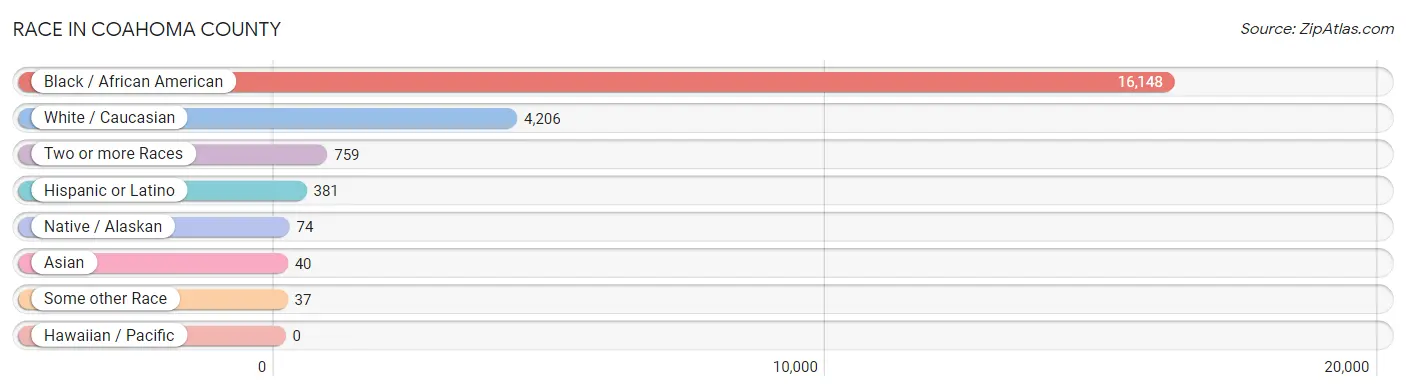
| Race | # Population | % Population |
| Asian | 40 | 0.2% |
| Black / African American | 16,148 | 75.9% |
| Hawaiian / Pacific | 0 | 0.0% |
| Hispanic or Latino | 381 | 1.8% |
| Native / Alaskan | 74 | 0.4% |
| White / Caucasian | 4,206 | 19.8% |
| Two or more Races | 759 | 3.6% |
| Some other Race | 37 | 0.2% |
| Total | 21,264 | 100.0% |
Ancestry in Coahoma County
The most populous ancestries reported in Coahoma County are English (1,286 | 6.0%), Irish (776 | 3.6%), American (576 | 2.7%), German (510 | 2.4%), and Italian (474 | 2.2%), together accounting for 17.0% of all Coahoma County residents.
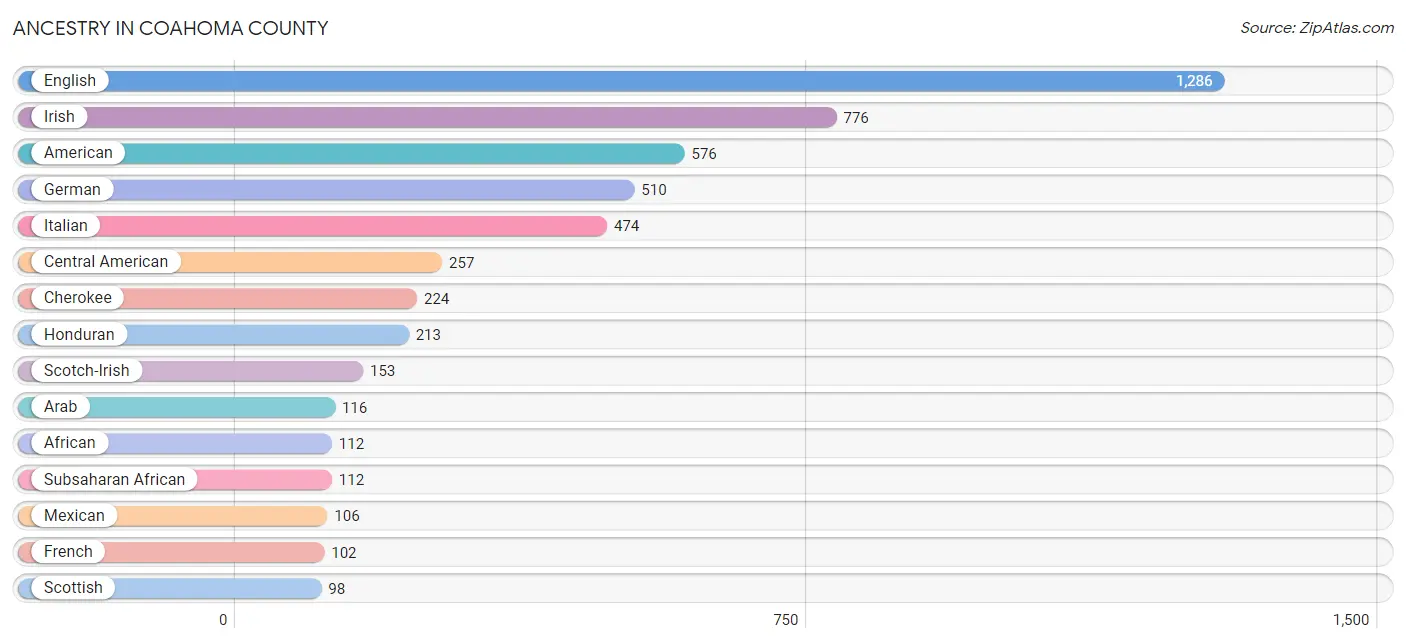
| Ancestry | # Population | % Population |
| African | 112 | 0.5% |
| American | 576 | 2.7% |
| Arab | 116 | 0.5% |
| Brazilian | 21 | 0.1% |
| British | 16 | 0.1% |
| Burmese | 6 | 0.0% |
| Central American | 257 | 1.2% |
| Cherokee | 224 | 1.1% |
| Croatian | 5 | 0.0% |
| Czech | 11 | 0.1% |
| Danish | 10 | 0.1% |
| Dutch | 37 | 0.2% |
| English | 1,286 | 6.0% |
| European | 68 | 0.3% |
| French | 102 | 0.5% |
| German | 510 | 2.4% |
| Greek | 14 | 0.1% |
| Guatemalan | 44 | 0.2% |
| Honduran | 213 | 1.0% |
| Iranian | 12 | 0.1% |
| Irish | 776 | 3.6% |
| Italian | 474 | 2.2% |
| Jamaican | 7 | 0.0% |
| Lebanese | 71 | 0.3% |
| Mexican | 106 | 0.5% |
| Mexican American Indian | 5 | 0.0% |
| Norwegian | 15 | 0.1% |
| Polish | 1 | 0.0% |
| Samoan | 9 | 0.0% |
| Scotch-Irish | 153 | 0.7% |
| Scottish | 98 | 0.5% |
| Subsaharan African | 112 | 0.5% |
| Swiss | 15 | 0.1% |
| Thai | 40 | 0.2% |
| Welsh | 20 | 0.1% | View All 35 Rows |
Immigrants in Coahoma County
The most numerous immigrant groups reported in Coahoma County came from Latin America (290 | 1.4%), Central America (284 | 1.3%), Honduras (213 | 1.0%), Guatemala (44 | 0.2%), and Asia (29 | 0.1%), together accounting for 4.0% of all Coahoma County residents.
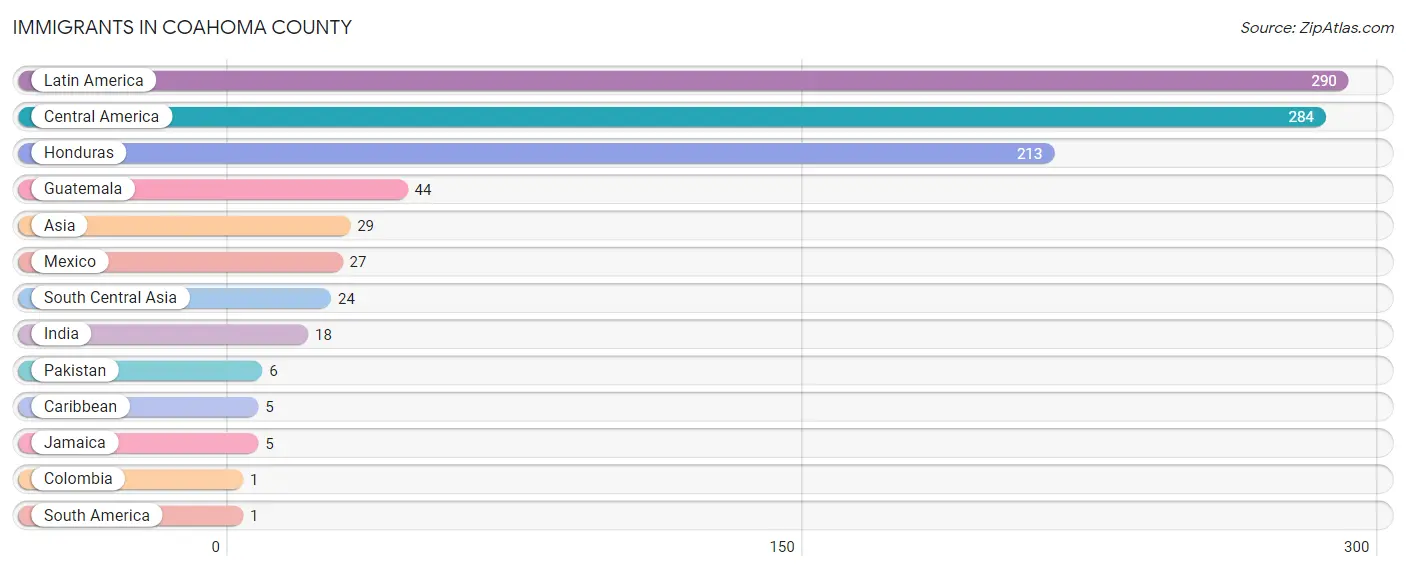
| Immigration Origin | # Population | % Population |
| Asia | 29 | 0.1% |
| Caribbean | 5 | 0.0% |
| Central America | 284 | 1.3% |
| Colombia | 1 | 0.0% |
| Guatemala | 44 | 0.2% |
| Honduras | 213 | 1.0% |
| India | 18 | 0.1% |
| Jamaica | 5 | 0.0% |
| Latin America | 290 | 1.4% |
| Mexico | 27 | 0.1% |
| Pakistan | 6 | 0.0% |
| South America | 1 | 0.0% |
| South Central Asia | 24 | 0.1% | View All 13 Rows |
Sex and Age in Coahoma County
Sex and Age in Coahoma County
The most populous age groups in Coahoma County are 10 to 14 Years (1,002 | 10.0%) for men and Under 5 Years (853 | 7.6%) for women.
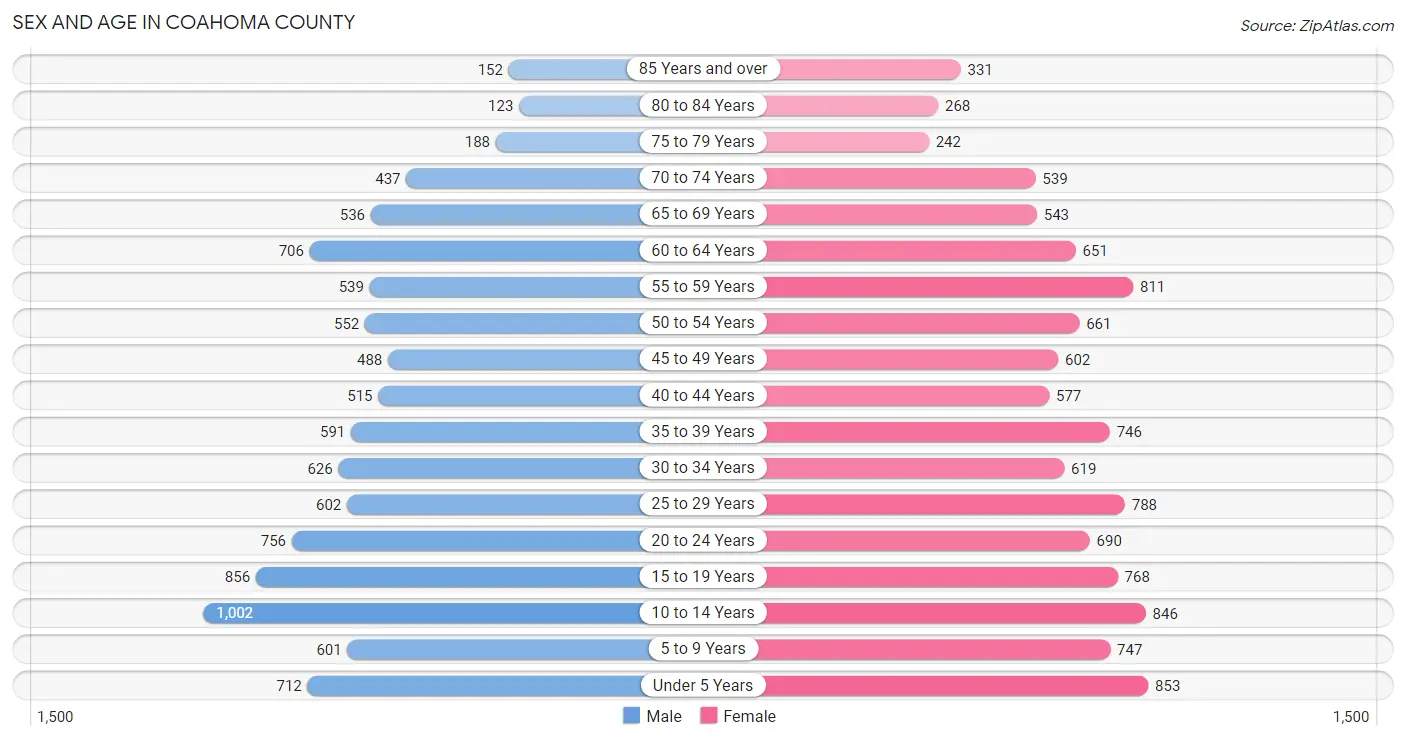
| Age Bracket | Male | Female |
| Under 5 Years | 712 (7.1%) | 853 (7.6%) |
| 5 to 9 Years | 601 (6.0%) | 747 (6.6%) |
| 10 to 14 Years | 1,002 (10.0%) | 846 (7.5%) |
| 15 to 19 Years | 856 (8.6%) | 768 (6.8%) |
| 20 to 24 Years | 756 (7.6%) | 690 (6.1%) |
| 25 to 29 Years | 602 (6.0%) | 788 (7.0%) |
| 30 to 34 Years | 626 (6.3%) | 619 (5.5%) |
| 35 to 39 Years | 591 (5.9%) | 746 (6.6%) |
| 40 to 44 Years | 515 (5.2%) | 577 (5.1%) |
| 45 to 49 Years | 488 (4.9%) | 602 (5.3%) |
| 50 to 54 Years | 552 (5.5%) | 661 (5.9%) |
| 55 to 59 Years | 539 (5.4%) | 811 (7.2%) |
| 60 to 64 Years | 706 (7.1%) | 651 (5.8%) |
| 65 to 69 Years | 536 (5.4%) | 543 (4.8%) |
| 70 to 74 Years | 437 (4.4%) | 539 (4.8%) |
| 75 to 79 Years | 188 (1.9%) | 242 (2.1%) |
| 80 to 84 Years | 123 (1.2%) | 268 (2.4%) |
| 85 Years and over | 152 (1.5%) | 331 (2.9%) |
| Total | 9,982 (100.0%) | 11,282 (100.0%) |
Families and Households in Coahoma County
Median Family Size in Coahoma County
The median family size in Coahoma County is 3.17 persons per family, with single female/mother families (2,434 | 47.4%) accounting for the largest median family size of 3.47 persons per family. On the other hand, single male/father families (591 | 11.5%) represent the smallest median family size with 2.80 persons per family.
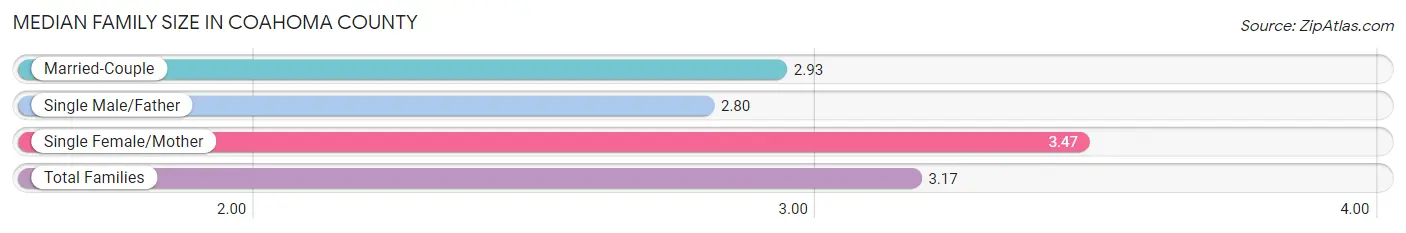
| Family Type | # Families | Family Size |
| Married-Couple | 2,110 (41.1%) | 2.93 |
| Single Male/Father | 591 (11.5%) | 2.80 |
| Single Female/Mother | 2,434 (47.4%) | 3.47 |
| Total Families | 5,135 (100.0%) | 3.17 |
Median Household Size in Coahoma County
The median household size in Coahoma County is 2.45 persons per household, with single female/mother households (2,434 | 29.0%) accounting for the largest median household size of 3.64 persons per household. non-family households (3,252 | 38.8%) represent the smallest median household size with 1.15 persons per household.
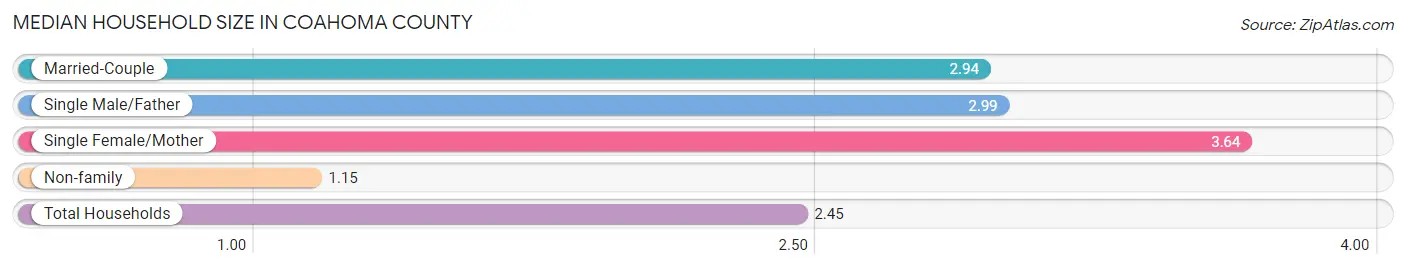
| Household Type | # Households | Household Size |
| Married-Couple | 2,110 (25.2%) | 2.94 |
| Single Male/Father | 591 (7.0%) | 2.99 |
| Single Female/Mother | 2,434 (29.0%) | 3.64 |
| Non-family | 3,252 (38.8%) | 1.15 |
| Total Households | 8,387 (100.0%) | 2.45 |
Household Size by Marriage Status in Coahoma County
Out of a total of 8,387 households in Coahoma County, 5,135 (61.2%) are family households, while 3,252 (38.8%) are nonfamily households. The most numerous type of family households are 2-person households, comprising 2,228, and the most common type of nonfamily households are 1-person households, comprising 2,838.
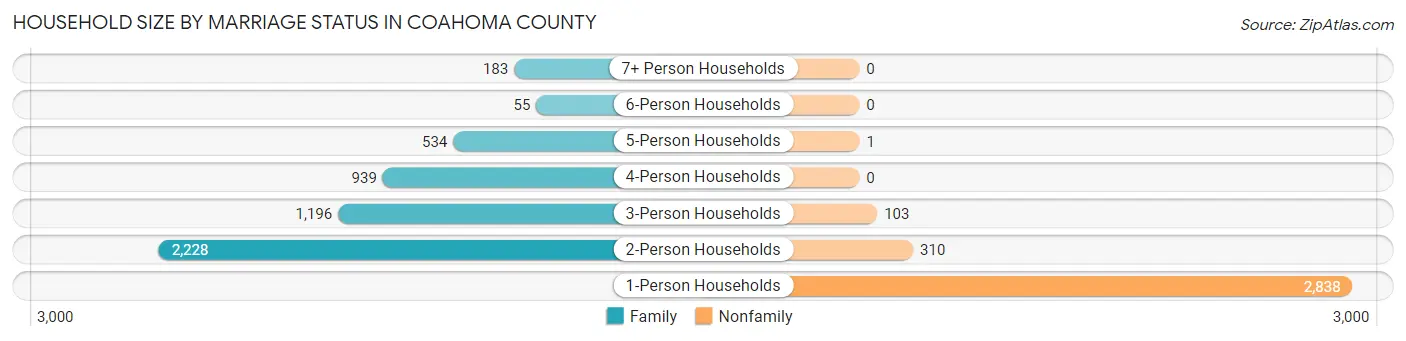
| Household Size | Family Households | Nonfamily Households |
| 1-Person Households | - | 2,838 (33.8%) |
| 2-Person Households | 2,228 (26.6%) | 310 (3.7%) |
| 3-Person Households | 1,196 (14.3%) | 103 (1.2%) |
| 4-Person Households | 939 (11.2%) | 0 (0.0%) |
| 5-Person Households | 534 (6.4%) | 1 (0.0%) |
| 6-Person Households | 55 (0.7%) | 0 (0.0%) |
| 7+ Person Households | 183 (2.2%) | 0 (0.0%) |
| Total | 5,135 (61.2%) | 3,252 (38.8%) |
Female Fertility in Coahoma County
Fertility by Age in Coahoma County
Average fertility rate in Coahoma County is 52.0 births per 1,000 women. Women in the age bracket of 20 to 34 years have the highest fertility rate with 93.0 births per 1,000 women. Women in the age bracket of 20 to 34 years acount for 76.4% of all women with births.
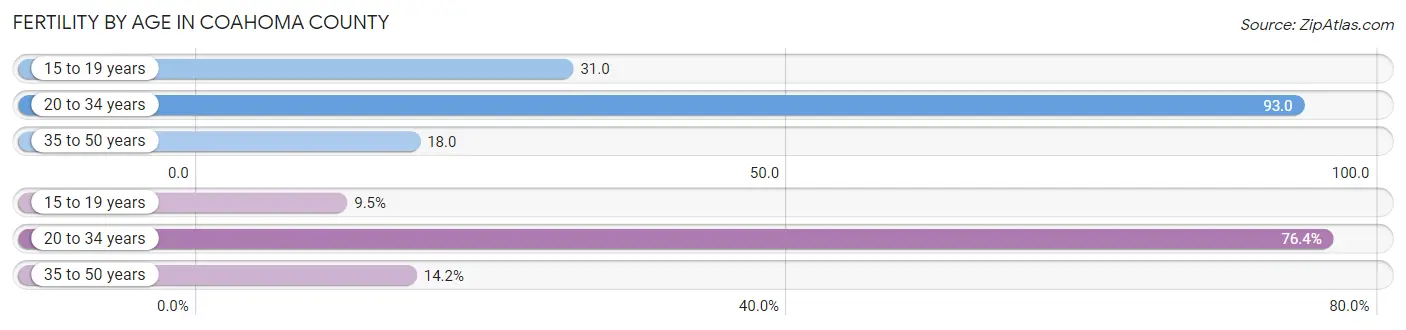
| Age Bracket | Women with Births | Births / 1,000 Women |
| 15 to 19 years | 24 (9.5%) | 31.0 |
| 20 to 34 years | 194 (76.4%) | 93.0 |
| 35 to 50 years | 36 (14.2%) | 18.0 |
| Total | 254 (100.0%) | 52.0 |
Fertility by Age by Marriage Status in Coahoma County
25.2% of women with births (254) in Coahoma County are married. The highest percentage of unmarried women with births falls into 15 to 19 years age bracket with 100.0% of them unmarried at the time of birth, while the lowest percentage of unmarried women with births belong to 35 to 50 years age bracket with 55.6% of them unmarried.
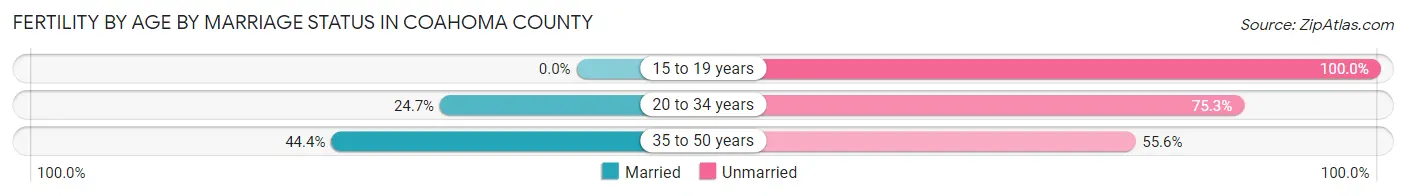
| Age Bracket | Married | Unmarried |
| 15 to 19 years | 0 (0.0%) | 24 (100.0%) |
| 20 to 34 years | 48 (24.7%) | 146 (75.3%) |
| 35 to 50 years | 16 (44.4%) | 20 (55.6%) |
| Total | 64 (25.2%) | 190 (74.8%) |
Fertility by Education in Coahoma County
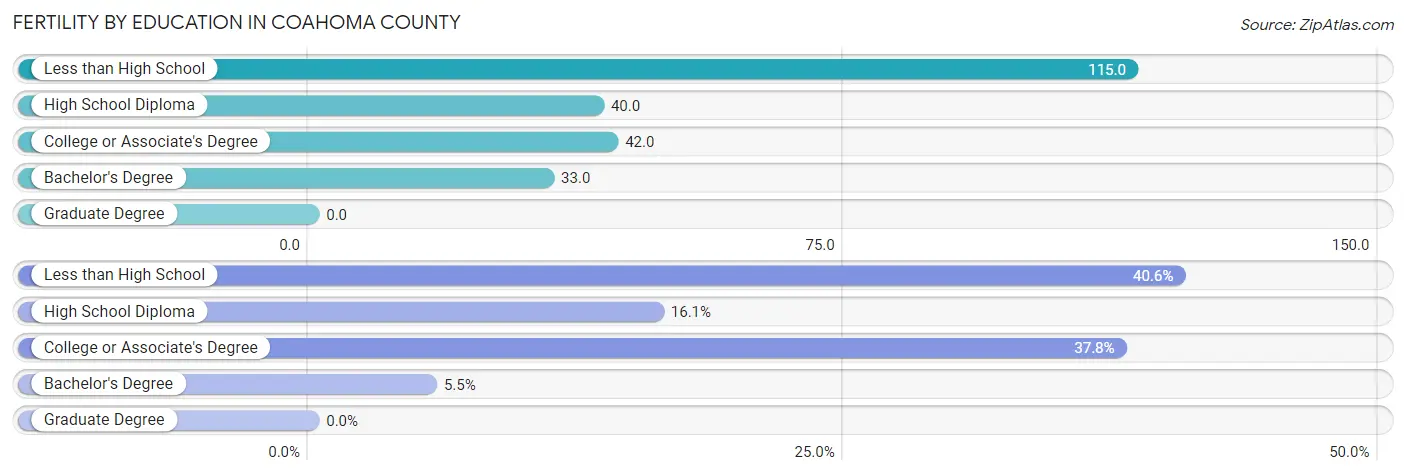
| Educational Attainment | Women with Births | Births / 1,000 Women |
| Less than High School | 103 (40.6%) | 115.0 |
| High School Diploma | 41 (16.1%) | 40.0 |
| College or Associate's Degree | 96 (37.8%) | 42.0 |
| Bachelor's Degree | 14 (5.5%) | 33.0 |
| Graduate Degree | 0 (0.0%) | 0.0 |
| Total | 254 (100.0%) | 52.0 |
Fertility by Education by Marriage Status in Coahoma County
74.8% of women with births in Coahoma County are unmarried. Women with the educational attainment of bachelor's degree are most likely to be married with 100.0% of them married at childbirth, while women with the educational attainment of less than high school are least likely to be married with 100.0% of them unmarried at childbirth.
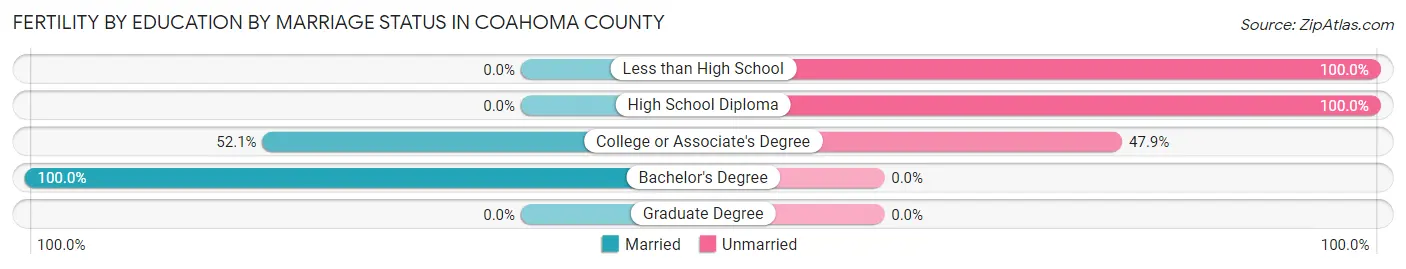
| Educational Attainment | Married | Unmarried |
| Less than High School | 0 (0.0%) | 103 (100.0%) |
| High School Diploma | 0 (0.0%) | 41 (100.0%) |
| College or Associate's Degree | 50 (52.1%) | 46 (47.9%) |
| Bachelor's Degree | 14 (100.0%) | 0 (0.0%) |
| Graduate Degree | 0 (0.0%) | 0 (0.0%) |
| Total | 64 (25.2%) | 190 (74.8%) |
Employment Characteristics in Coahoma County
Employment by Class of Employer in Coahoma County
Among the 7,411 employed individuals in Coahoma County, private company employees (4,674 | 63.1%), state government employees (969 | 13.1%), and local government employees (626 | 8.5%) make up the most common classes of employment.
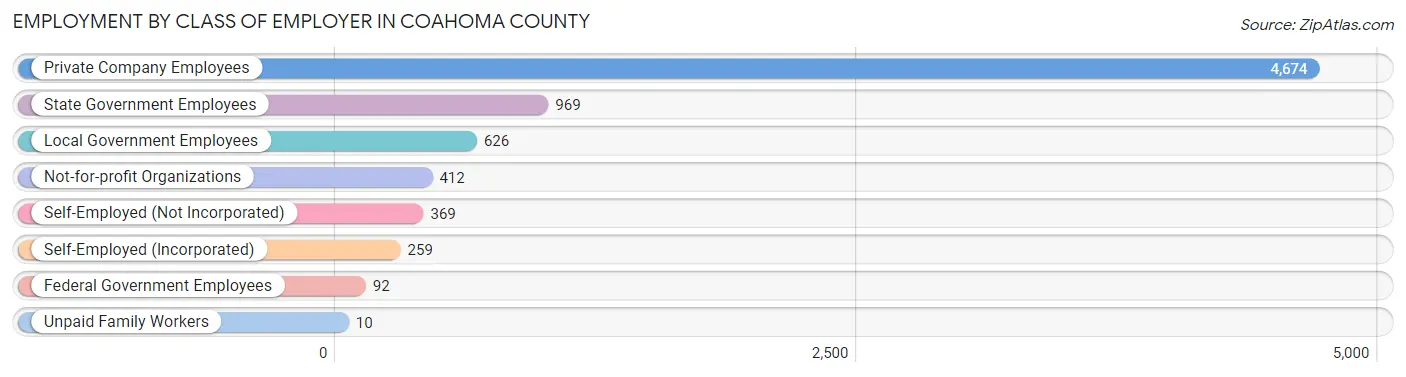
| Employer Class | # Employees | % Employees |
| Private Company Employees | 4,674 | 63.1% |
| Self-Employed (Incorporated) | 259 | 3.5% |
| Self-Employed (Not Incorporated) | 369 | 5.0% |
| Not-for-profit Organizations | 412 | 5.6% |
| Local Government Employees | 626 | 8.5% |
| State Government Employees | 969 | 13.1% |
| Federal Government Employees | 92 | 1.2% |
| Unpaid Family Workers | 10 | 0.1% |
| Total | 7,411 | 100.0% |
Employment Status by Age in Coahoma County
According to the labor force statistics for Coahoma County, out of the total population over 16 years of age (16,214), 52.4% or 8,496 individuals are in the labor force, with 10.8% or 918 of them unemployed. The age group with the highest labor force participation rate is 30 to 34 years, with 81.9% or 1,020 individuals in the labor force. Within the labor force, the 16 to 19 years age range has the highest percentage of unemployed individuals, with 42.9% or 103 of them being unemployed.
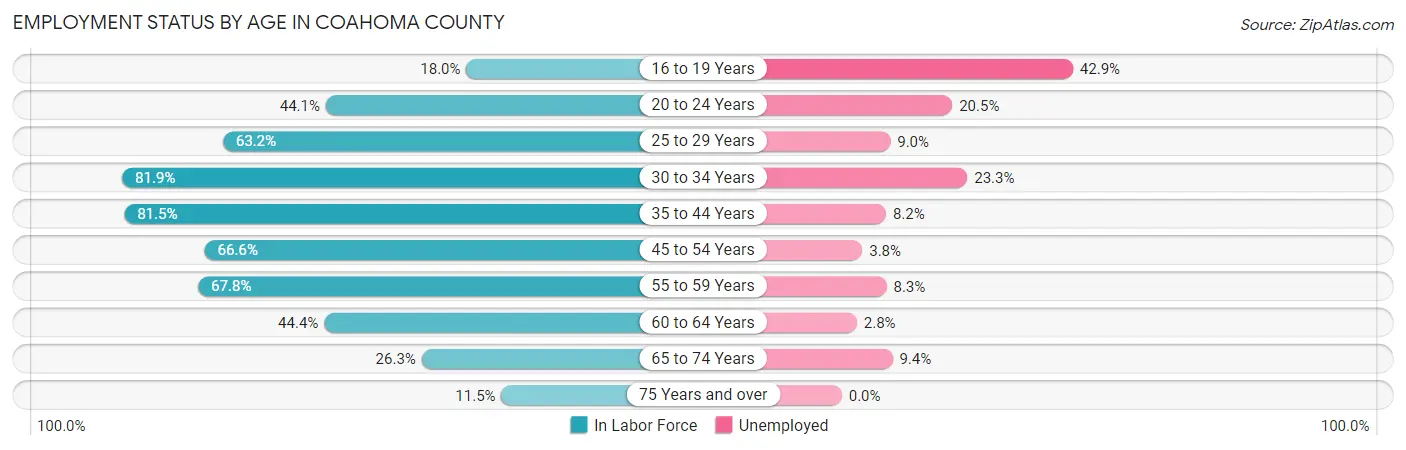
| Age Bracket | In Labor Force | Unemployed |
| 16 to 19 Years | 240 (18.0%) | 103 (42.9%) |
| 20 to 24 Years | 638 (44.1%) | 131 (20.5%) |
| 25 to 29 Years | 878 (63.2%) | 79 (9.0%) |
| 30 to 34 Years | 1,020 (81.9%) | 238 (23.3%) |
| 35 to 44 Years | 1,980 (81.5%) | 162 (8.2%) |
| 45 to 54 Years | 1,534 (66.6%) | 58 (3.8%) |
| 55 to 59 Years | 915 (67.8%) | 76 (8.3%) |
| 60 to 64 Years | 603 (44.4%) | 17 (2.8%) |
| 65 to 74 Years | 540 (26.3%) | 51 (9.4%) |
| 75 Years and over | 150 (11.5%) | 0 (0.0%) |
| Total | 8,496 (52.4%) | 918 (10.8%) |
Employment Status by Educational Attainment in Coahoma County
According to labor force statistics for Coahoma County, 68.8% of individuals (6,931) out of the total population between 25 and 64 years of age (10,074) are in the labor force, with 9.1% or 631 of them being unemployed. The group with the highest labor force participation rate are those with the educational attainment of bachelor's degree or higher, with 83.6% or 1,582 individuals in the labor force. Within the labor force, individuals with high school diploma education have the highest percentage of unemployment, with 16.9% or 239 of them being unemployed.
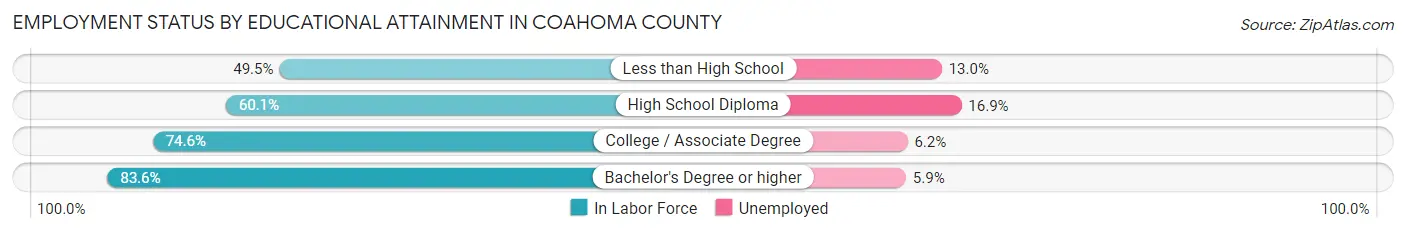
| Educational Attainment | In Labor Force | Unemployed |
| Less than High School | 817 (49.5%) | 214 (13.0%) |
| High School Diploma | 1,416 (60.1%) | 398 (16.9%) |
| College / Associate Degree | 3,115 (74.6%) | 259 (6.2%) |
| Bachelor's Degree or higher | 1,582 (83.6%) | 112 (5.9%) |
| Total | 6,931 (68.8%) | 917 (9.1%) |
Employment Occupations by Sex in Coahoma County
Management, Business, Science and Arts Occupations
The most common Management, Business, Science and Arts occupations in Coahoma County are Community & Social Service (909 | 12.0%), Management (822 | 10.9%), Education Instruction & Library (655 | 8.6%), Health Diagnosing & Treating (549 | 7.2%), and Health Technologists (315 | 4.2%).
Management, Business, Science and Arts Occupations by Sex
Within the Management, Business, Science and Arts occupations in Coahoma County, the most male-oriented occupations are Architecture & Engineering (100.0%), Life, Physical & Social Science (95.7%), and Computers, Engineering & Science (90.9%), while the most female-oriented occupations are Education, Arts & Media (87.6%), Health Diagnosing & Treating (82.3%), and Health Technologists (80.0%).
| Occupation | Male | Female |
| Management | 483 (58.8%) | 339 (41.2%) |
| Business & Financial | 96 (61.2%) | 61 (38.9%) |
| Computers, Engineering & Science | 191 (90.9%) | 19 (9.0%) |
| Computers & Mathematics | 7 (36.8%) | 12 (63.2%) |
| Architecture & Engineering | 28 (100.0%) | 0 (0.0%) |
| Life, Physical & Social Science | 156 (95.7%) | 7 (4.3%) |
| Community & Social Service | 314 (34.5%) | 595 (65.5%) |
| Education, Arts & Media | 22 (12.4%) | 156 (87.6%) |
| Legal Services & Support | 15 (60.0%) | 10 (40.0%) |
| Education Instruction & Library | 251 (38.3%) | 404 (61.7%) |
| Arts, Media & Entertainment | 26 (51.0%) | 25 (49.0%) |
| Health Diagnosing & Treating | 97 (17.7%) | 452 (82.3%) |
| Health Technologists | 63 (20.0%) | 252 (80.0%) |
| Total (Category) | 1,181 (44.6%) | 1,466 (55.4%) |
| Total (Overall) | 3,587 (47.4%) | 3,985 (52.6%) |
Services Occupations
The most common Services occupations in Coahoma County are Cleaning & Maintenance (606 | 8.0%), Food Preparation & Serving (413 | 5.4%), Healthcare Support (385 | 5.1%), Security & Protection (273 | 3.6%), and Personal Care & Service (253 | 3.3%).
Services Occupations by Sex
Within the Services occupations in Coahoma County, the most male-oriented occupations are Firefighting & Prevention (76.6%), Security & Protection (63.4%), and Law Enforcement (50.0%), while the most female-oriented occupations are Healthcare Support (98.4%), Food Preparation & Serving (83.3%), and Personal Care & Service (72.3%).
| Occupation | Male | Female |
| Healthcare Support | 6 (1.6%) | 379 (98.4%) |
| Security & Protection | 173 (63.4%) | 100 (36.6%) |
| Firefighting & Prevention | 105 (76.6%) | 32 (23.4%) |
| Law Enforcement | 68 (50.0%) | 68 (50.0%) |
| Food Preparation & Serving | 69 (16.7%) | 344 (83.3%) |
| Cleaning & Maintenance | 247 (40.8%) | 359 (59.2%) |
| Personal Care & Service | 70 (27.7%) | 183 (72.3%) |
| Total (Category) | 565 (29.3%) | 1,365 (70.7%) |
| Total (Overall) | 3,587 (47.4%) | 3,985 (52.6%) |
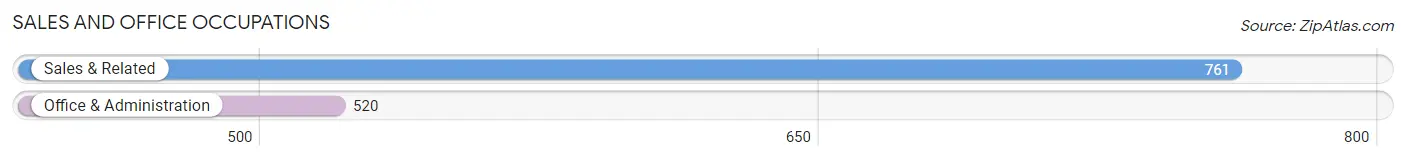
Sales and Office Occupations
The most common Sales and Office occupations in Coahoma County are Sales & Related (761 | 10.1%), and Office & Administration (520 | 6.9%).
Sales and Office Occupations by Sex
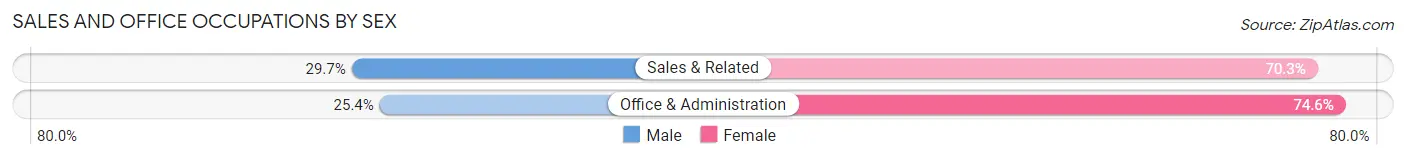
| Occupation | Male | Female |
| Sales & Related | 226 (29.7%) | 535 (70.3%) |
| Office & Administration | 132 (25.4%) | 388 (74.6%) |
| Total (Category) | 358 (28.0%) | 923 (72.1%) |
| Total (Overall) | 3,587 (47.4%) | 3,985 (52.6%) |
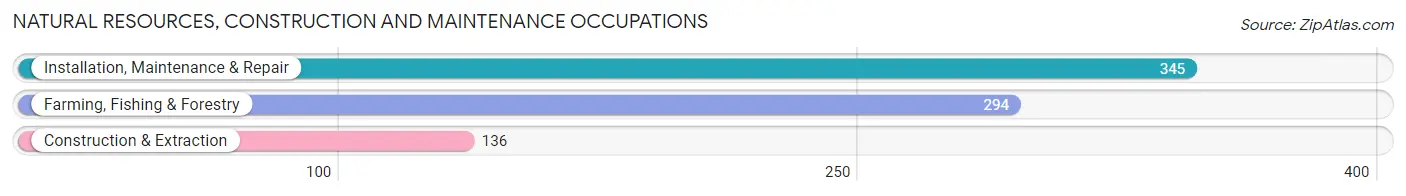
Natural Resources, Construction and Maintenance Occupations
The most common Natural Resources, Construction and Maintenance occupations in Coahoma County are Installation, Maintenance & Repair (345 | 4.6%), Farming, Fishing & Forestry (294 | 3.9%), and Construction & Extraction (136 | 1.8%).
Natural Resources, Construction and Maintenance Occupations by Sex
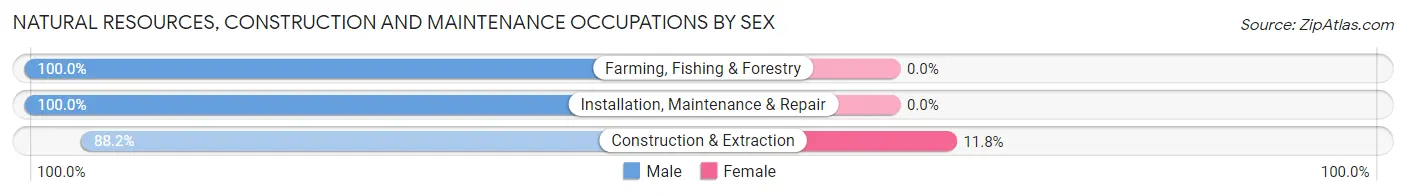
| Occupation | Male | Female |
| Farming, Fishing & Forestry | 294 (100.0%) | 0 (0.0%) |
| Construction & Extraction | 120 (88.2%) | 16 (11.8%) |
| Installation, Maintenance & Repair | 345 (100.0%) | 0 (0.0%) |
| Total (Category) | 759 (97.9%) | 16 (2.1%) |
| Total (Overall) | 3,587 (47.4%) | 3,985 (52.6%) |
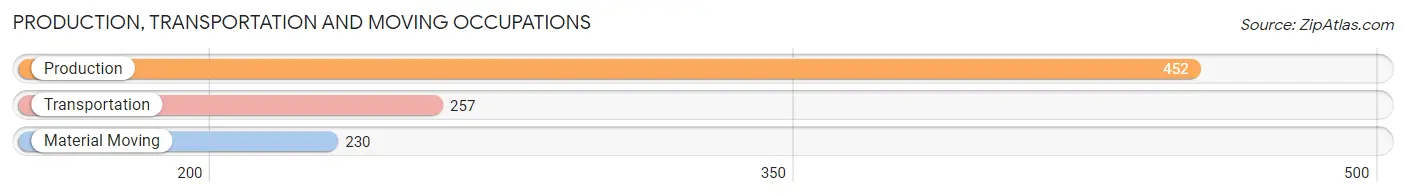
Production, Transportation and Moving Occupations
The most common Production, Transportation and Moving occupations in Coahoma County are Production (452 | 6.0%), Transportation (257 | 3.4%), and Material Moving (230 | 3.0%).
Production, Transportation and Moving Occupations by Sex
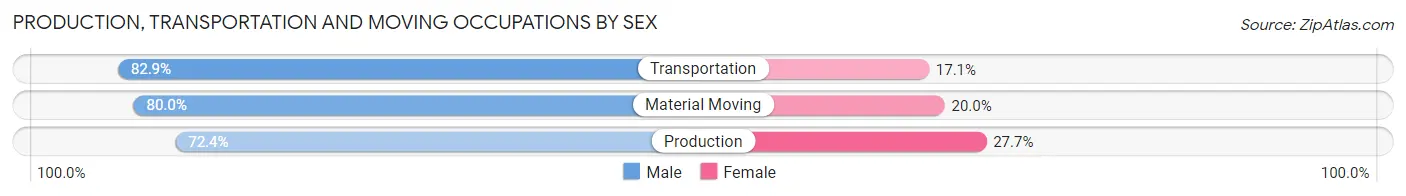
| Occupation | Male | Female |
| Production | 327 (72.4%) | 125 (27.7%) |
| Transportation | 213 (82.9%) | 44 (17.1%) |
| Material Moving | 184 (80.0%) | 46 (20.0%) |
| Total (Category) | 724 (77.1%) | 215 (22.9%) |
| Total (Overall) | 3,587 (47.4%) | 3,985 (52.6%) |
Employment Industries by Sex in Coahoma County
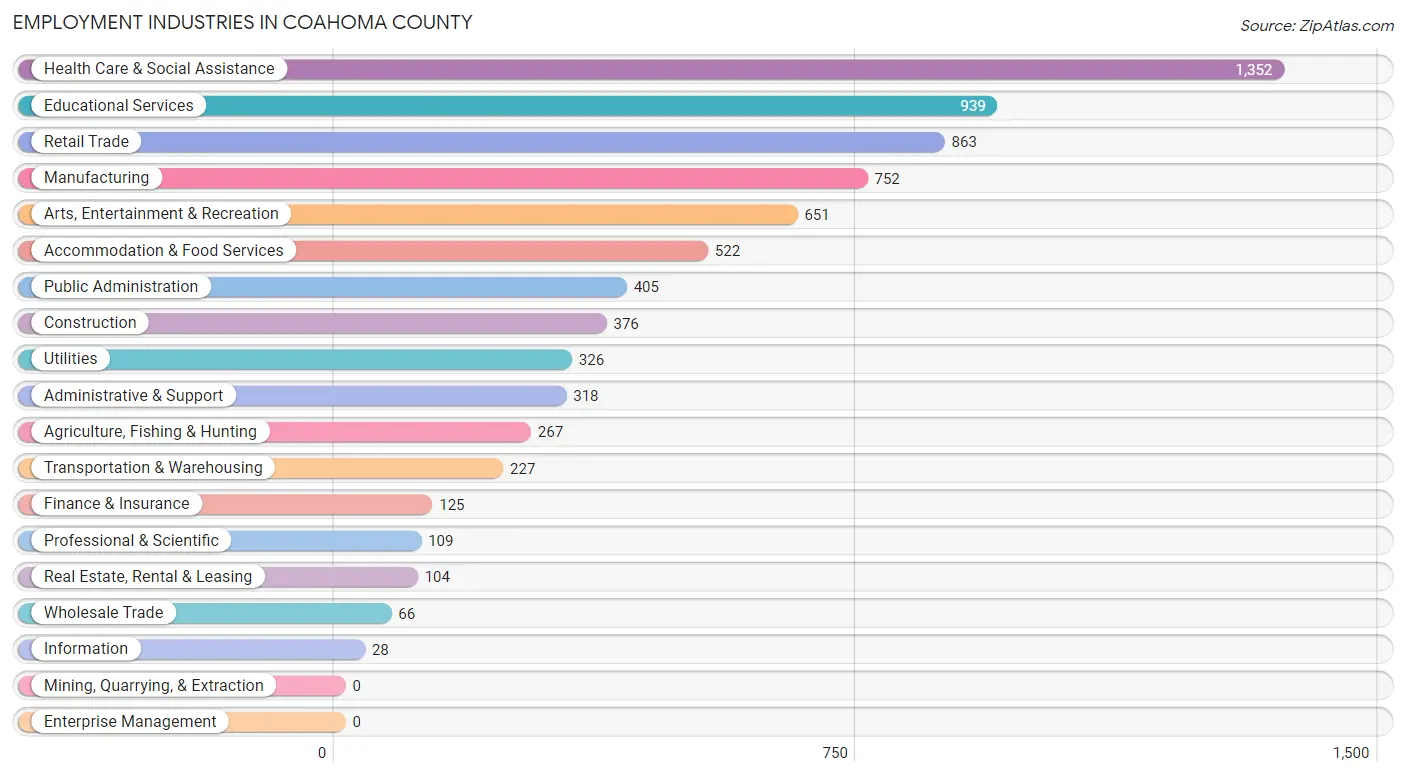
Employment Industries in Coahoma County
The major employment industries in Coahoma County include Health Care & Social Assistance (1,352 | 17.9%), Educational Services (939 | 12.4%), Retail Trade (863 | 11.4%), Manufacturing (752 | 9.9%), and Arts, Entertainment & Recreation (651 | 8.6%).
Employment Industries by Sex in Coahoma County
The Coahoma County industries that see more men than women are Information (100.0%), Utilities (94.8%), and Agriculture, Fishing & Hunting (92.5%), whereas the industries that tend to have a higher number of women are Health Care & Social Assistance (86.1%), Finance & Insurance (68.8%), and Accommodation & Food Services (67.2%).
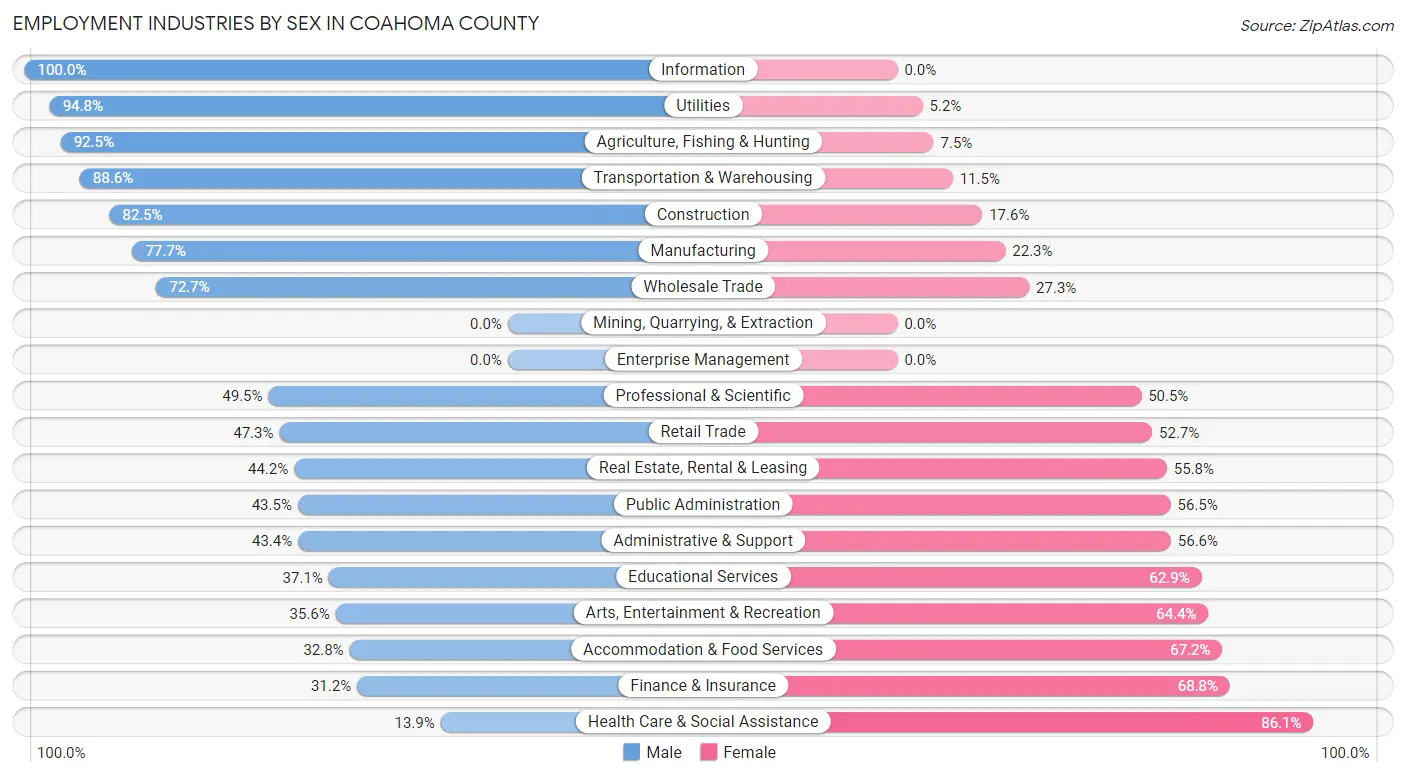
| Industry | Male | Female |
| Agriculture, Fishing & Hunting | 247 (92.5%) | 20 (7.5%) |
| Mining, Quarrying, & Extraction | 0 (0.0%) | 0 (0.0%) |
| Construction | 310 (82.5%) | 66 (17.5%) |
| Manufacturing | 584 (77.7%) | 168 (22.3%) |
| Wholesale Trade | 48 (72.7%) | 18 (27.3%) |
| Retail Trade | 408 (47.3%) | 455 (52.7%) |
| Transportation & Warehousing | 201 (88.5%) | 26 (11.5%) |
| Utilities | 309 (94.8%) | 17 (5.2%) |
| Information | 28 (100.0%) | 0 (0.0%) |
| Finance & Insurance | 39 (31.2%) | 86 (68.8%) |
| Real Estate, Rental & Leasing | 46 (44.2%) | 58 (55.8%) |
| Professional & Scientific | 54 (49.5%) | 55 (50.5%) |
| Enterprise Management | 0 (0.0%) | 0 (0.0%) |
| Administrative & Support | 138 (43.4%) | 180 (56.6%) |
| Educational Services | 348 (37.1%) | 591 (62.9%) |
| Health Care & Social Assistance | 188 (13.9%) | 1,164 (86.1%) |
| Arts, Entertainment & Recreation | 232 (35.6%) | 419 (64.4%) |
| Accommodation & Food Services | 171 (32.8%) | 351 (67.2%) |
| Public Administration | 176 (43.5%) | 229 (56.5%) |
| Total | 3,587 (47.4%) | 3,985 (52.6%) |
Education in Coahoma County
School Enrollment in Coahoma County
The most common levels of schooling among the 5,972 students in Coahoma County are middle school (1,379 | 23.1%), elementary school (1,330 | 22.3%), and college / undergraduate (1,194 | 20.0%).
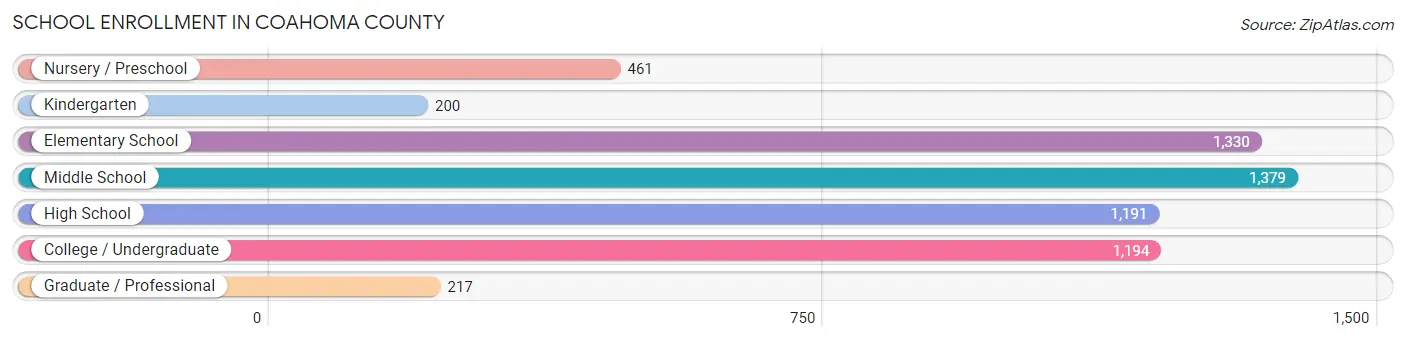
| School Level | # Students | % Students |
| Nursery / Preschool | 461 | 7.7% |
| Kindergarten | 200 | 3.4% |
| Elementary School | 1,330 | 22.3% |
| Middle School | 1,379 | 23.1% |
| High School | 1,191 | 19.9% |
| College / Undergraduate | 1,194 | 20.0% |
| Graduate / Professional | 217 | 3.6% |
| Total | 5,972 | 100.0% |
School Enrollment by Age by Funding Source in Coahoma County
Out of a total of 5,972 students who are enrolled in schools in Coahoma County, 591 (9.9%) attend a private institution, while the remaining 5,381 (90.1%) are enrolled in public schools. The age group of 10 to 14 year olds has the highest likelihood of being enrolled in private schools, with 273 (15.1% in the age bracket) enrolled. Conversely, the age group of 20 to 24 year olds has the lowest likelihood of being enrolled in a private school, with 505 (100.0% in the age bracket) attending a public institution.
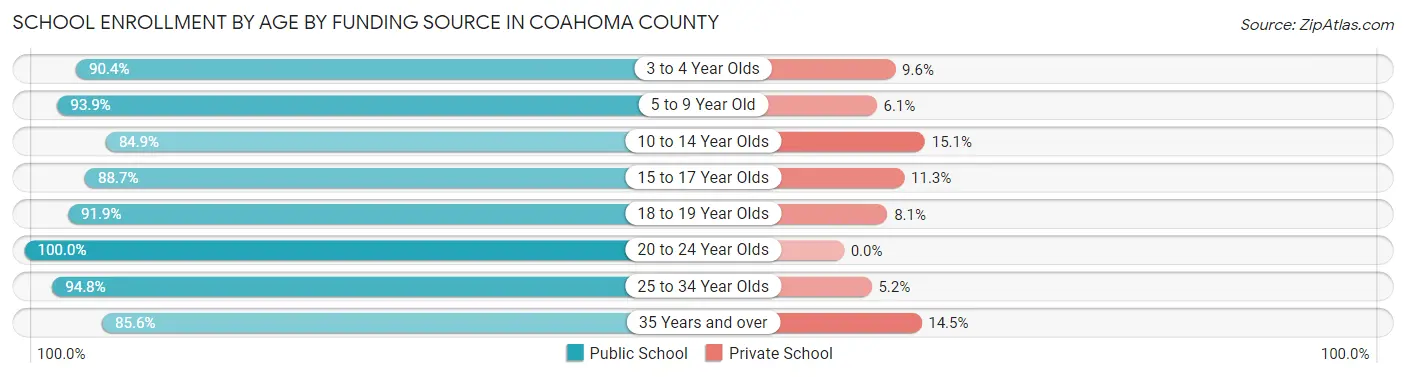
| Age Bracket | Public School | Private School |
| 3 to 4 Year Olds | 330 (90.4%) | 35 (9.6%) |
| 5 to 9 Year Old | 1,242 (93.9%) | 81 (6.1%) |
| 10 to 14 Year Olds | 1,534 (84.9%) | 273 (15.1%) |
| 15 to 17 Year Olds | 717 (88.7%) | 91 (11.3%) |
| 18 to 19 Year Olds | 521 (91.9%) | 46 (8.1%) |
| 20 to 24 Year Olds | 505 (100.0%) | 0 (0.0%) |
| 25 to 34 Year Olds | 238 (94.8%) | 13 (5.2%) |
| 35 Years and over | 296 (85.6%) | 50 (14.4%) |
| Total | 5,381 (90.1%) | 591 (9.9%) |
Educational Attainment by Field of Study in Coahoma County
Education (739 | 26.3%), business (651 | 23.2%), science & technology (314 | 11.2%), arts & humanities (246 | 8.8%), and bio, nature & agricultural (222 | 7.9%) are the most common fields of study among 2,808 individuals in Coahoma County who have obtained a bachelor's degree or higher.
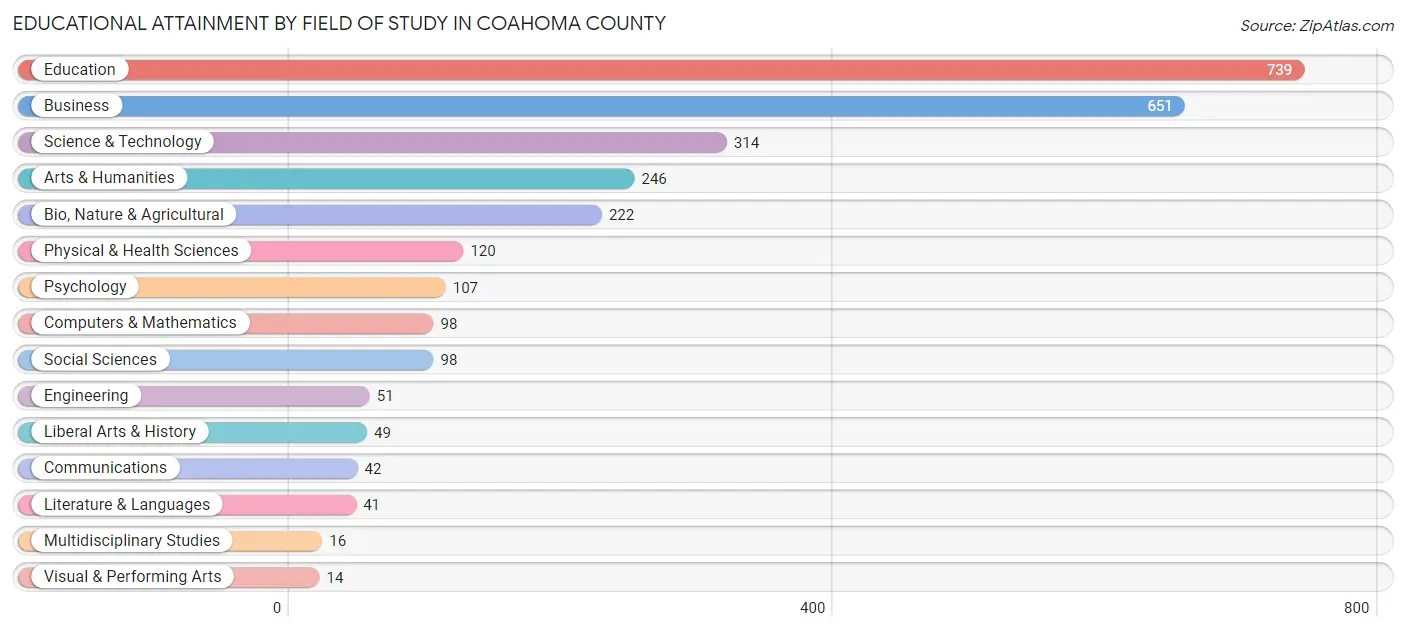
| Field of Study | # Graduates | % Graduates |
| Computers & Mathematics | 98 | 3.5% |
| Bio, Nature & Agricultural | 222 | 7.9% |
| Physical & Health Sciences | 120 | 4.3% |
| Psychology | 107 | 3.8% |
| Social Sciences | 98 | 3.5% |
| Engineering | 51 | 1.8% |
| Multidisciplinary Studies | 16 | 0.6% |
| Science & Technology | 314 | 11.2% |
| Business | 651 | 23.2% |
| Education | 739 | 26.3% |
| Literature & Languages | 41 | 1.5% |
| Liberal Arts & History | 49 | 1.8% |
| Visual & Performing Arts | 14 | 0.5% |
| Communications | 42 | 1.5% |
| Arts & Humanities | 246 | 8.8% |
| Total | 2,808 | 100.0% |
Transportation & Commute in Coahoma County
Vehicle Availability by Sex in Coahoma County
The most prevalent vehicle ownership categories in Coahoma County are males with 2 vehicles (1,164, accounting for 32.9%) and females with 2 vehicles (1,188, making up 30.1%).
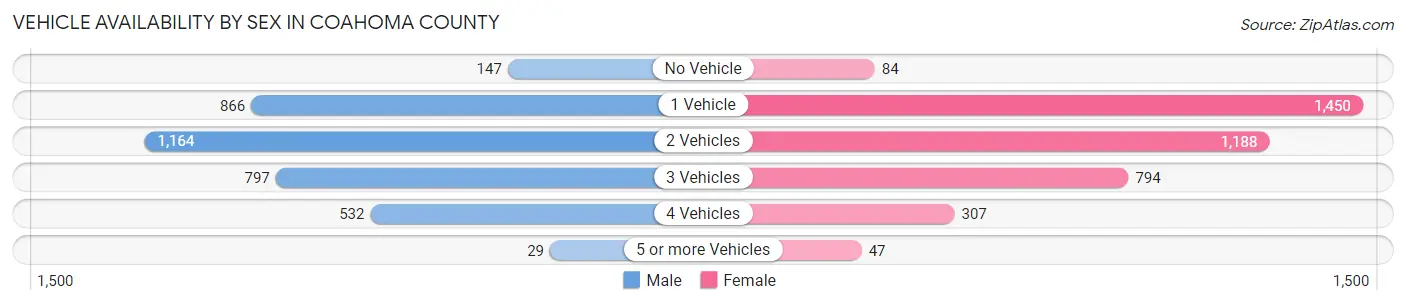
| Vehicles Available | Male | Female |
| No Vehicle | 147 (4.2%) | 84 (2.2%) |
| 1 Vehicle | 866 (24.5%) | 1,450 (37.5%) |
| 2 Vehicles | 1,164 (32.9%) | 1,188 (30.7%) |
| 3 Vehicles | 797 (22.6%) | 794 (20.5%) |
| 4 Vehicles | 532 (15.0%) | 307 (7.9%) |
| 5 or more Vehicles | 29 (0.8%) | 47 (1.2%) |
| Total | 3,535 (100.0%) | 3,870 (100.0%) |
Commute Time in Coahoma County
The most frequently occuring commute durations in Coahoma County are 10 to 14 minutes (1,934 commuters, 28.2%), 5 to 9 minutes (1,466 commuters, 21.4%), and 15 to 19 minutes (872 commuters, 12.7%).
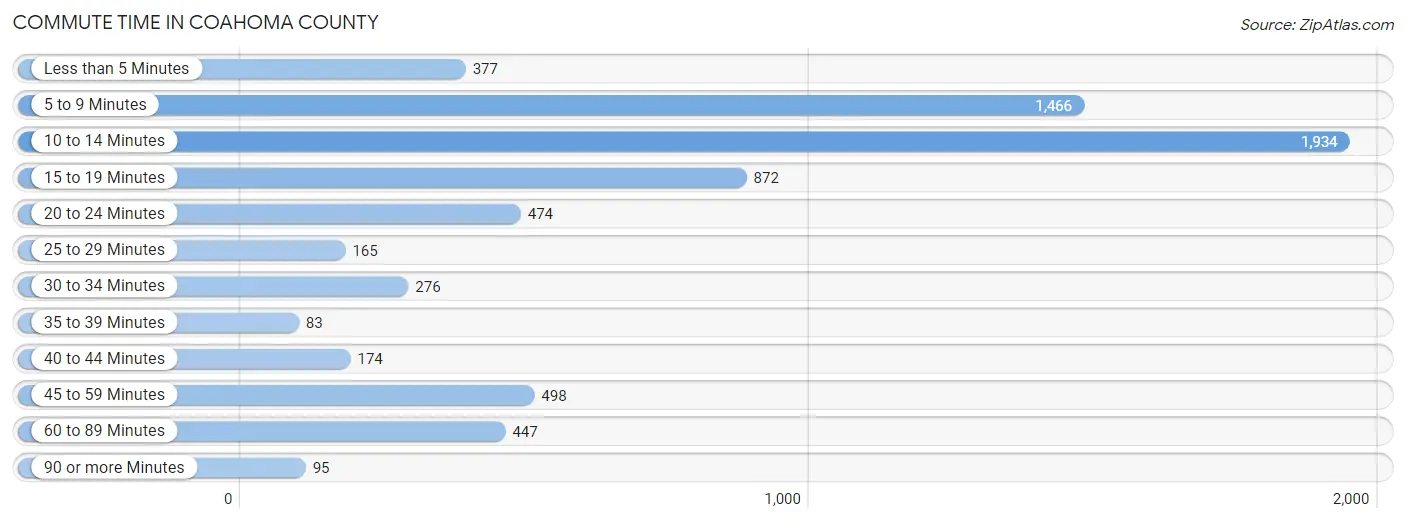
| Commute Time | # Commuters | % Commuters |
| Less than 5 Minutes | 377 | 5.5% |
| 5 to 9 Minutes | 1,466 | 21.4% |
| 10 to 14 Minutes | 1,934 | 28.2% |
| 15 to 19 Minutes | 872 | 12.7% |
| 20 to 24 Minutes | 474 | 6.9% |
| 25 to 29 Minutes | 165 | 2.4% |
| 30 to 34 Minutes | 276 | 4.0% |
| 35 to 39 Minutes | 83 | 1.2% |
| 40 to 44 Minutes | 174 | 2.5% |
| 45 to 59 Minutes | 498 | 7.3% |
| 60 to 89 Minutes | 447 | 6.5% |
| 90 or more Minutes | 95 | 1.4% |
Commute Time by Sex in Coahoma County
The most common commute times in Coahoma County are 10 to 14 minutes (932 commuters, 28.5%) for males and 10 to 14 minutes (1,002 commuters, 27.9%) for females.
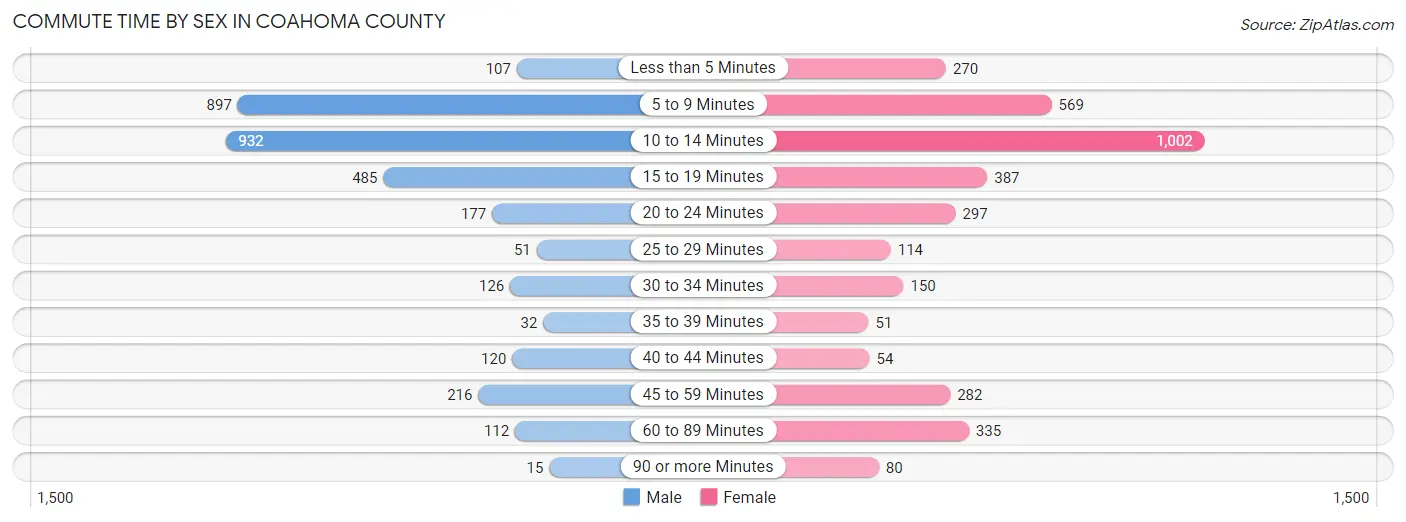
| Commute Time | Male | Female |
| Less than 5 Minutes | 107 (3.3%) | 270 (7.5%) |
| 5 to 9 Minutes | 897 (27.4%) | 569 (15.9%) |
| 10 to 14 Minutes | 932 (28.5%) | 1,002 (27.9%) |
| 15 to 19 Minutes | 485 (14.8%) | 387 (10.8%) |
| 20 to 24 Minutes | 177 (5.4%) | 297 (8.3%) |
| 25 to 29 Minutes | 51 (1.6%) | 114 (3.2%) |
| 30 to 34 Minutes | 126 (3.8%) | 150 (4.2%) |
| 35 to 39 Minutes | 32 (1.0%) | 51 (1.4%) |
| 40 to 44 Minutes | 120 (3.7%) | 54 (1.5%) |
| 45 to 59 Minutes | 216 (6.6%) | 282 (7.9%) |
| 60 to 89 Minutes | 112 (3.4%) | 335 (9.3%) |
| 90 or more Minutes | 15 (0.5%) | 80 (2.2%) |
Time of Departure to Work by Sex in Coahoma County
The most frequent times of departure to work in Coahoma County are 6:30 AM to 6:59 AM (649, 19.9%) for males and 7:00 AM to 7:29 AM (603, 16.8%) for females.
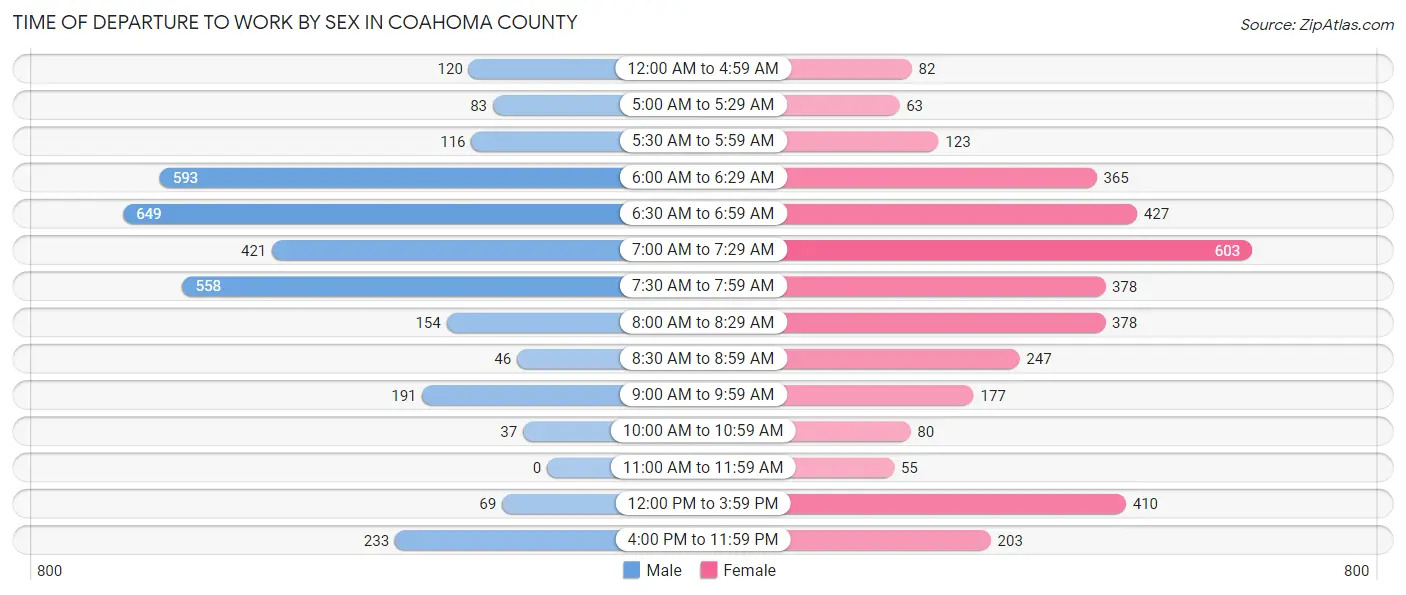
| Time of Departure | Male | Female |
| 12:00 AM to 4:59 AM | 120 (3.7%) | 82 (2.3%) |
| 5:00 AM to 5:29 AM | 83 (2.5%) | 63 (1.8%) |
| 5:30 AM to 5:59 AM | 116 (3.5%) | 123 (3.4%) |
| 6:00 AM to 6:29 AM | 593 (18.1%) | 365 (10.2%) |
| 6:30 AM to 6:59 AM | 649 (19.9%) | 427 (11.9%) |
| 7:00 AM to 7:29 AM | 421 (12.9%) | 603 (16.8%) |
| 7:30 AM to 7:59 AM | 558 (17.1%) | 378 (10.5%) |
| 8:00 AM to 8:29 AM | 154 (4.7%) | 378 (10.5%) |
| 8:30 AM to 8:59 AM | 46 (1.4%) | 247 (6.9%) |
| 9:00 AM to 9:59 AM | 191 (5.8%) | 177 (4.9%) |
| 10:00 AM to 10:59 AM | 37 (1.1%) | 80 (2.2%) |
| 11:00 AM to 11:59 AM | 0 (0.0%) | 55 (1.5%) |
| 12:00 PM to 3:59 PM | 69 (2.1%) | 410 (11.4%) |
| 4:00 PM to 11:59 PM | 233 (7.1%) | 203 (5.7%) |
| Total | 3,270 (100.0%) | 3,591 (100.0%) |
Housing Occupancy in Coahoma County
Occupancy by Ownership in Coahoma County
Of the total 8,387 dwellings in Coahoma County, owner-occupied units account for 4,479 (53.4%), while renter-occupied units make up 3,908 (46.6%).
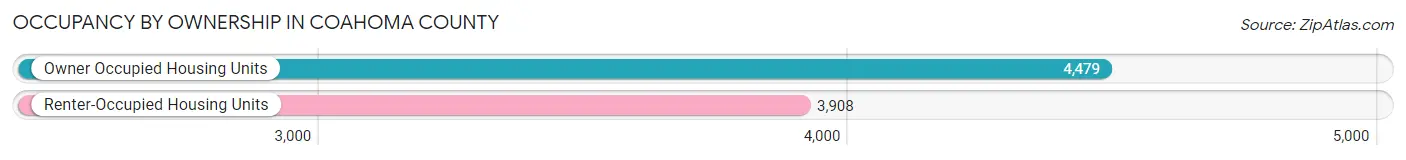
| Occupancy | # Housing Units | % Housing Units |
| Owner Occupied Housing Units | 4,479 | 53.4% |
| Renter-Occupied Housing Units | 3,908 | 46.6% |
| Total Occupied Housing Units | 8,387 | 100.0% |
Occupancy by Household Size in Coahoma County
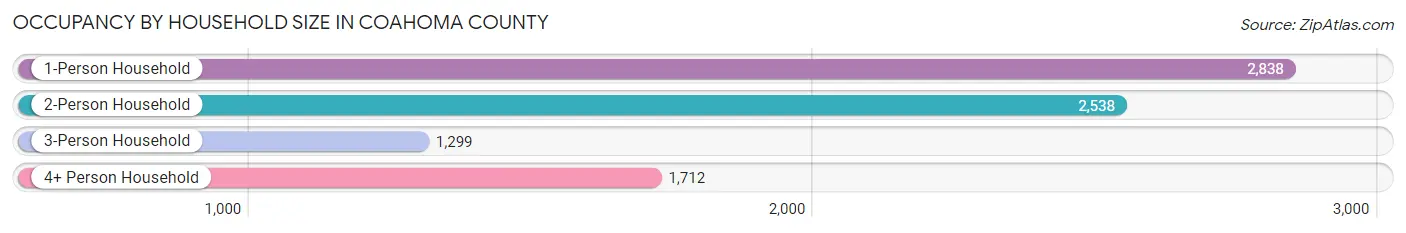
| Household Size | # Housing Units | % Housing Units |
| 1-Person Household | 2,838 | 33.8% |
| 2-Person Household | 2,538 | 30.3% |
| 3-Person Household | 1,299 | 15.5% |
| 4+ Person Household | 1,712 | 20.4% |
| Total Housing Units | 8,387 | 100.0% |
Occupancy by Ownership by Household Size in Coahoma County
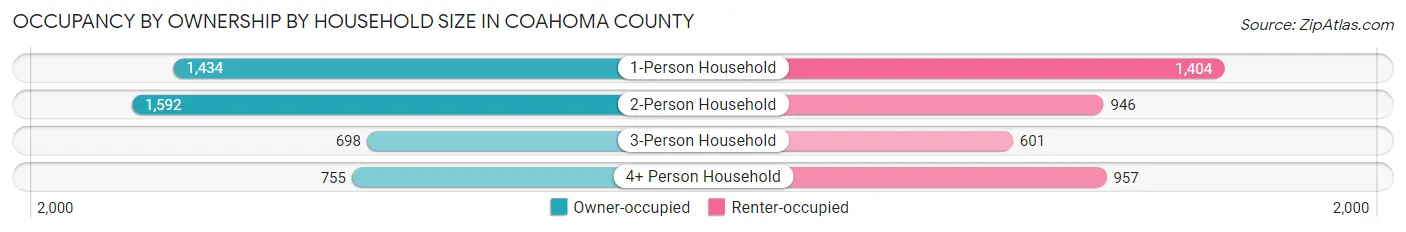
| Household Size | Owner-occupied | Renter-occupied |
| 1-Person Household | 1,434 (50.5%) | 1,404 (49.5%) |
| 2-Person Household | 1,592 (62.7%) | 946 (37.3%) |
| 3-Person Household | 698 (53.7%) | 601 (46.3%) |
| 4+ Person Household | 755 (44.1%) | 957 (55.9%) |
| Total Housing Units | 4,479 (53.4%) | 3,908 (46.6%) |
Occupancy by Educational Attainment in Coahoma County
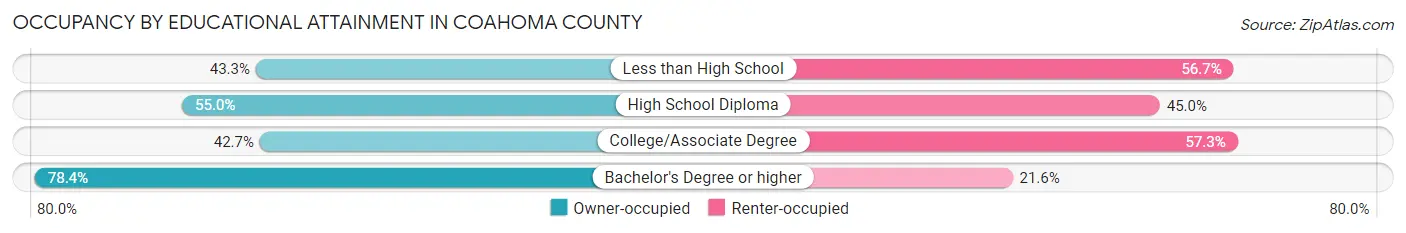
| Household Size | Owner-occupied | Renter-occupied |
| Less than High School | 562 (43.3%) | 735 (56.7%) |
| High School Diploma | 1,147 (55.0%) | 938 (45.0%) |
| College/Associate Degree | 1,379 (42.7%) | 1,851 (57.3%) |
| Bachelor's Degree or higher | 1,391 (78.4%) | 384 (21.6%) |
Occupancy by Age of Householder in Coahoma County
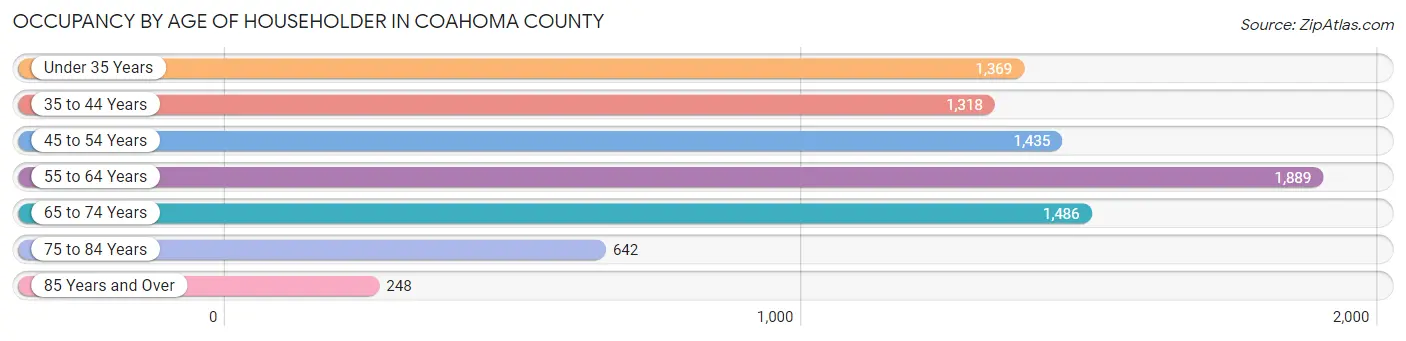
| Age Bracket | # Households | % Households |
| Under 35 Years | 1,369 | 16.3% |
| 35 to 44 Years | 1,318 | 15.7% |
| 45 to 54 Years | 1,435 | 17.1% |
| 55 to 64 Years | 1,889 | 22.5% |
| 65 to 74 Years | 1,486 | 17.7% |
| 75 to 84 Years | 642 | 7.6% |
| 85 Years and Over | 248 | 3.0% |
| Total | 8,387 | 100.0% |
Housing Finances in Coahoma County
Median Income by Occupancy in Coahoma County
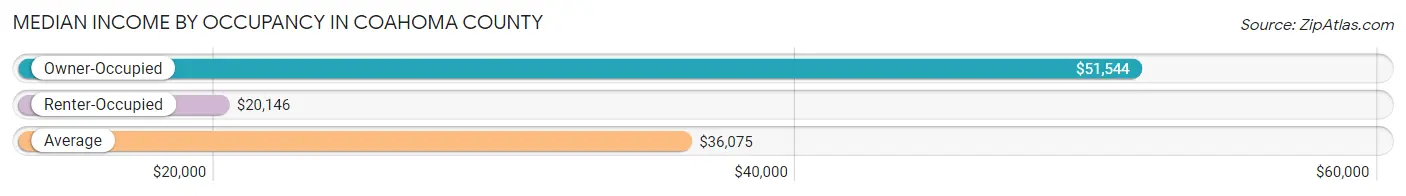
| Occupancy Type | # Households | Median Income |
| Owner-Occupied | 4,479 (53.4%) | $51,544 |
| Renter-Occupied | 3,908 (46.6%) | $20,146 |
| Average | 8,387 (100.0%) | $36,075 |
Occupancy by Householder Income Bracket in Coahoma County
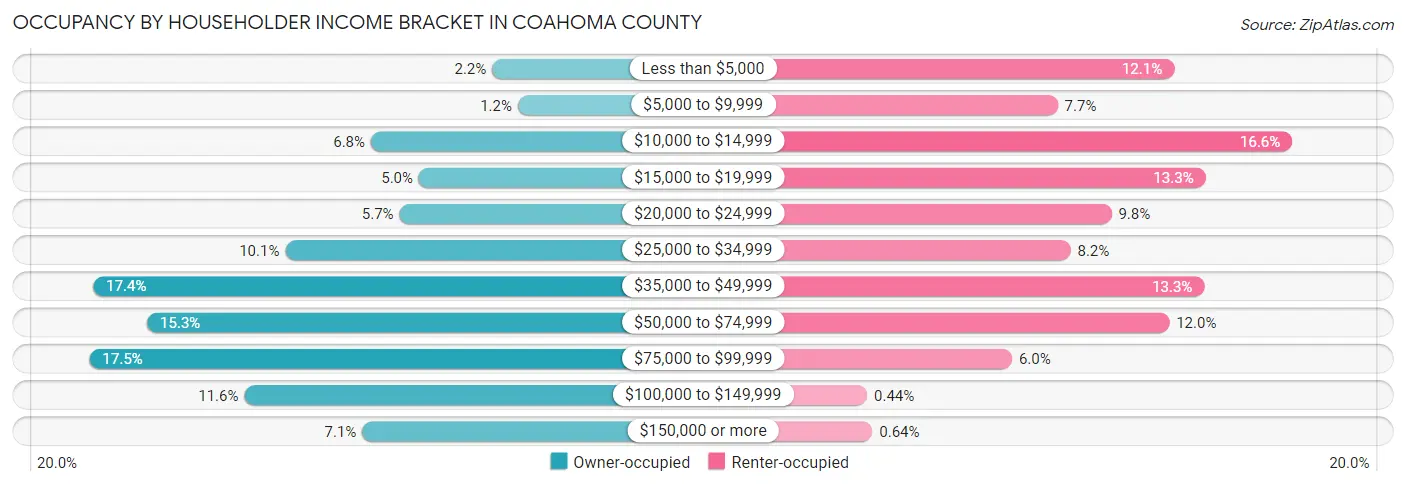
| Income Bracket | Owner-occupied | Renter-occupied |
| Less than $5,000 | 98 (2.2%) | 474 (12.1%) |
| $5,000 to $9,999 | 54 (1.2%) | 301 (7.7%) |
| $10,000 to $14,999 | 305 (6.8%) | 650 (16.6%) |
| $15,000 to $19,999 | 223 (5.0%) | 521 (13.3%) |
| $20,000 to $24,999 | 256 (5.7%) | 381 (9.8%) |
| $25,000 to $34,999 | 451 (10.1%) | 320 (8.2%) |
| $35,000 to $49,999 | 779 (17.4%) | 519 (13.3%) |
| $50,000 to $74,999 | 687 (15.3%) | 467 (11.9%) |
| $75,000 to $99,999 | 785 (17.5%) | 233 (6.0%) |
| $100,000 to $149,999 | 521 (11.6%) | 17 (0.4%) |
| $150,000 or more | 320 (7.1%) | 25 (0.6%) |
| Total | 4,479 (100.0%) | 3,908 (100.0%) |
Monthly Housing Cost Tiers in Coahoma County
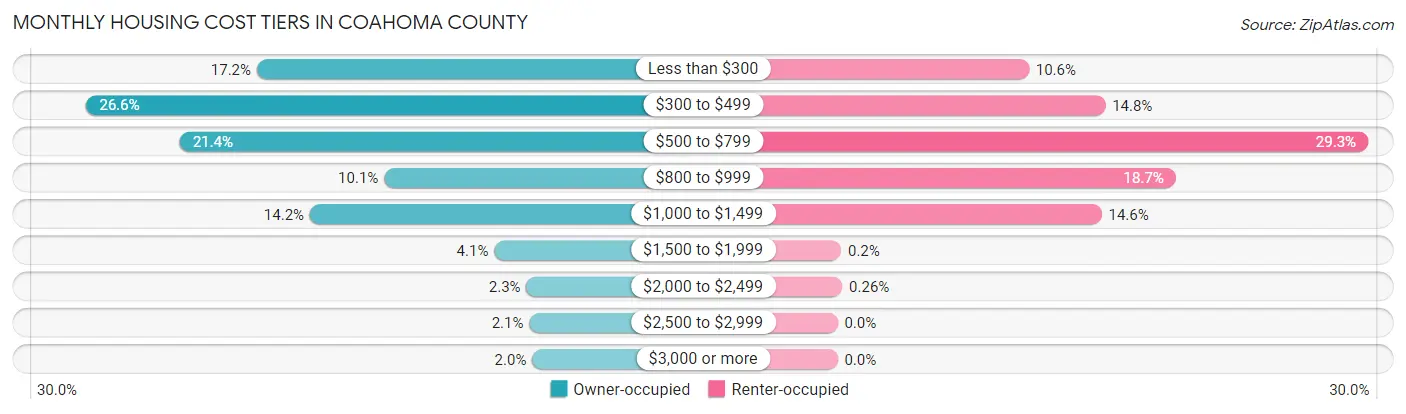
| Monthly Cost | Owner-occupied | Renter-occupied |
| Less than $300 | 769 (17.2%) | 413 (10.6%) |
| $300 to $499 | 1,191 (26.6%) | 578 (14.8%) |
| $500 to $799 | 960 (21.4%) | 1,145 (29.3%) |
| $800 to $999 | 454 (10.1%) | 730 (18.7%) |
| $1,000 to $1,499 | 638 (14.2%) | 570 (14.6%) |
| $1,500 to $1,999 | 182 (4.1%) | 8 (0.2%) |
| $2,000 to $2,499 | 102 (2.3%) | 10 (0.3%) |
| $2,500 to $2,999 | 95 (2.1%) | 0 (0.0%) |
| $3,000 or more | 88 (2.0%) | 0 (0.0%) |
| Total | 4,479 (100.0%) | 3,908 (100.0%) |
Physical Housing Characteristics in Coahoma County
Housing Structures in Coahoma County
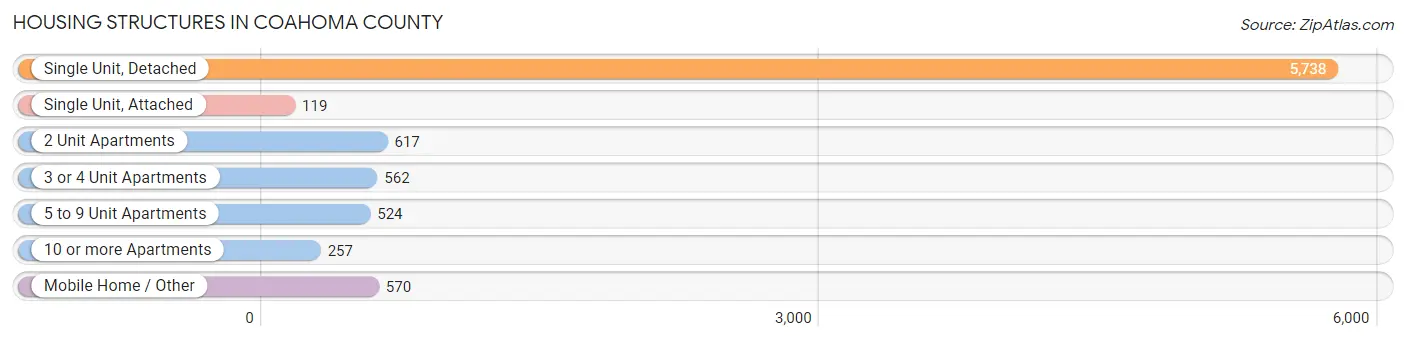
| Structure Type | # Housing Units | % Housing Units |
| Single Unit, Detached | 5,738 | 68.4% |
| Single Unit, Attached | 119 | 1.4% |
| 2 Unit Apartments | 617 | 7.4% |
| 3 or 4 Unit Apartments | 562 | 6.7% |
| 5 to 9 Unit Apartments | 524 | 6.2% |
| 10 or more Apartments | 257 | 3.1% |
| Mobile Home / Other | 570 | 6.8% |
| Total | 8,387 | 100.0% |
Housing Structures by Occupancy in Coahoma County
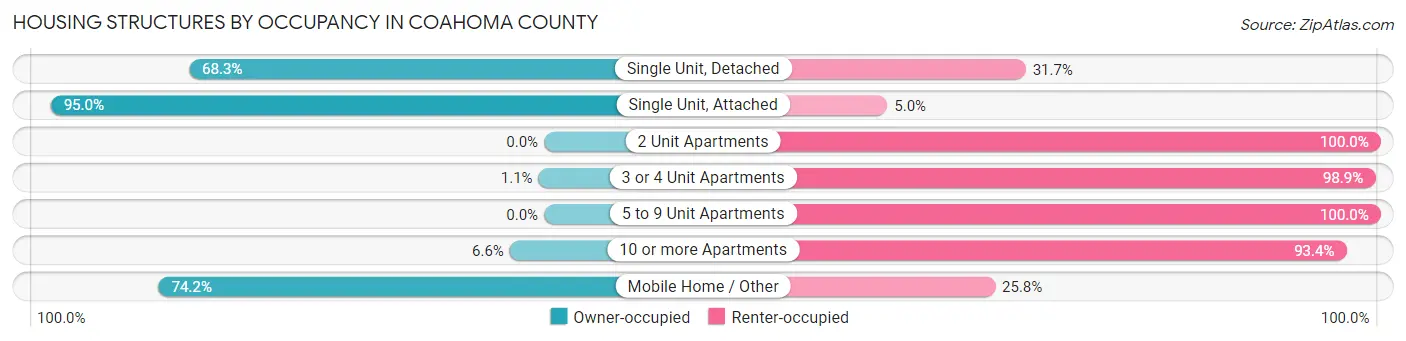
| Structure Type | Owner-occupied | Renter-occupied |
| Single Unit, Detached | 3,920 (68.3%) | 1,818 (31.7%) |
| Single Unit, Attached | 113 (95.0%) | 6 (5.0%) |
| 2 Unit Apartments | 0 (0.0%) | 617 (100.0%) |
| 3 or 4 Unit Apartments | 6 (1.1%) | 556 (98.9%) |
| 5 to 9 Unit Apartments | 0 (0.0%) | 524 (100.0%) |
| 10 or more Apartments | 17 (6.6%) | 240 (93.4%) |
| Mobile Home / Other | 423 (74.2%) | 147 (25.8%) |
| Total | 4,479 (53.4%) | 3,908 (46.6%) |
Housing Structures by Number of Rooms in Coahoma County
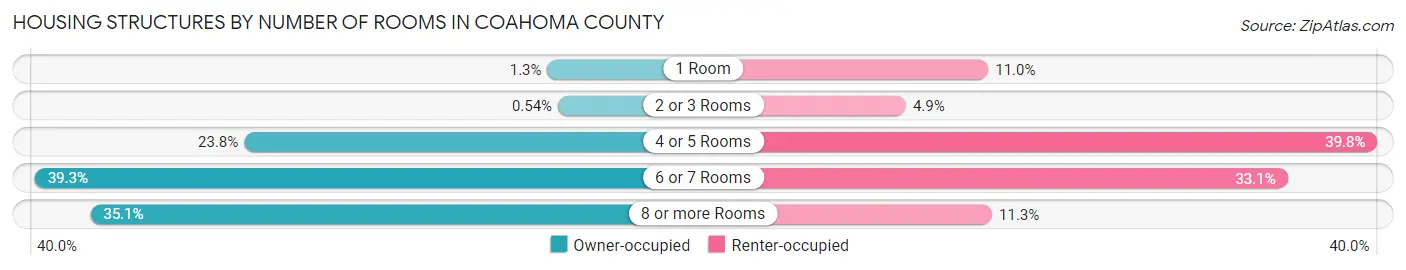
| Number of Rooms | Owner-occupied | Renter-occupied |
| 1 Room | 59 (1.3%) | 429 (11.0%) |
| 2 or 3 Rooms | 24 (0.5%) | 191 (4.9%) |
| 4 or 5 Rooms | 1,064 (23.8%) | 1,554 (39.8%) |
| 6 or 7 Rooms | 1,758 (39.3%) | 1,294 (33.1%) |
| 8 or more Rooms | 1,574 (35.1%) | 440 (11.3%) |
| Total | 4,479 (100.0%) | 3,908 (100.0%) |
Housing Structure by Heating Type in Coahoma County
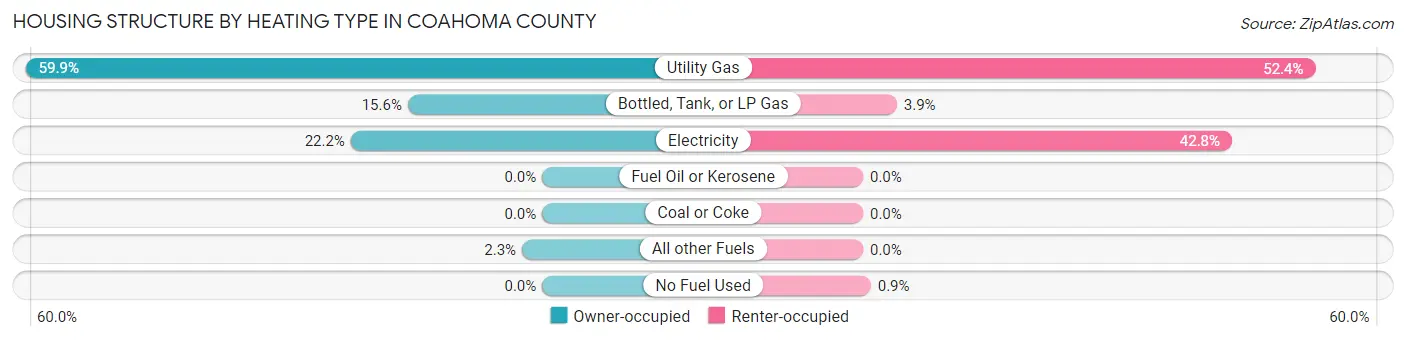
| Heating Type | Owner-occupied | Renter-occupied |
| Utility Gas | 2,682 (59.9%) | 2,049 (52.4%) |
| Bottled, Tank, or LP Gas | 698 (15.6%) | 153 (3.9%) |
| Electricity | 994 (22.2%) | 1,671 (42.8%) |
| Fuel Oil or Kerosene | 0 (0.0%) | 0 (0.0%) |
| Coal or Coke | 0 (0.0%) | 0 (0.0%) |
| All other Fuels | 105 (2.3%) | 0 (0.0%) |
| No Fuel Used | 0 (0.0%) | 35 (0.9%) |
| Total | 4,479 (100.0%) | 3,908 (100.0%) |
Household Vehicle Usage in Coahoma County
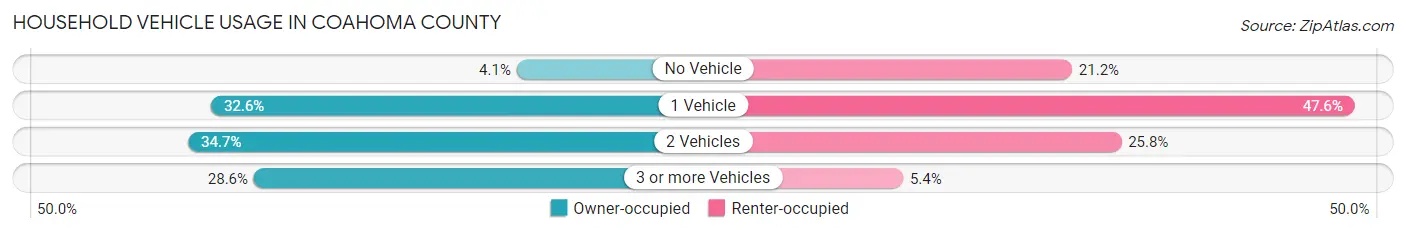
| Vehicles per Household | Owner-occupied | Renter-occupied |
| No Vehicle | 182 (4.1%) | 828 (21.2%) |
| 1 Vehicle | 1,460 (32.6%) | 1,860 (47.6%) |
| 2 Vehicles | 1,556 (34.7%) | 1,008 (25.8%) |
| 3 or more Vehicles | 1,281 (28.6%) | 212 (5.4%) |
| Total | 4,479 (100.0%) | 3,908 (100.0%) |
Real Estate & Mortgages in Coahoma County
Real Estate and Mortgage Overview in Coahoma County
| Characteristic | Without Mortgage | With Mortgage |
| Housing Units | 2,814 | 1,665 |
| Median Property Value | $65,400 | $133,700 |
| Median Household Income | $43,650 | $171 |
| Monthly Housing Costs | $392 | $71 |
| Real Estate Taxes | $803 | $362 |
Property Value by Mortgage Status in Coahoma County
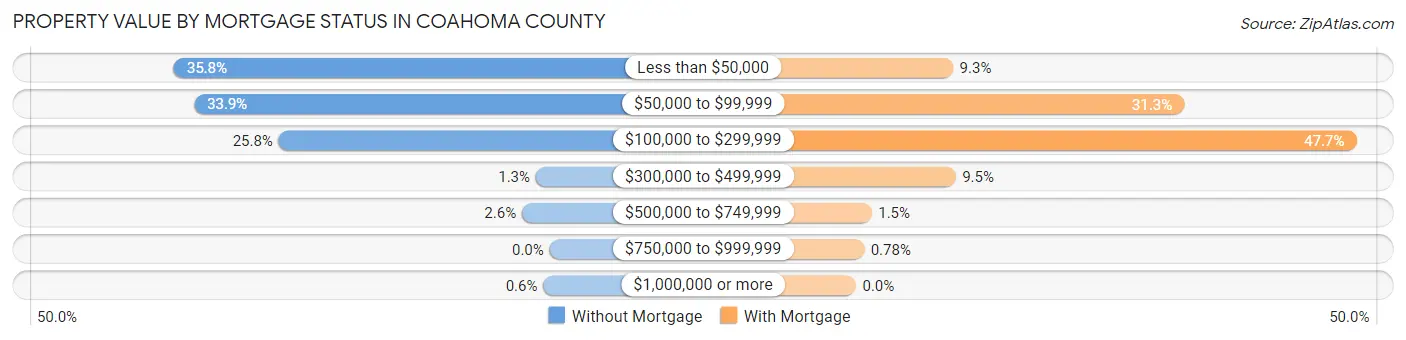
| Property Value | Without Mortgage | With Mortgage |
| Less than $50,000 | 1,007 (35.8%) | 154 (9.2%) |
| $50,000 to $99,999 | 953 (33.9%) | 521 (31.3%) |
| $100,000 to $299,999 | 726 (25.8%) | 794 (47.7%) |
| $300,000 to $499,999 | 37 (1.3%) | 158 (9.5%) |
| $500,000 to $749,999 | 74 (2.6%) | 25 (1.5%) |
| $750,000 to $999,999 | 0 (0.0%) | 13 (0.8%) |
| $1,000,000 or more | 17 (0.6%) | 0 (0.0%) |
| Total | 2,814 (100.0%) | 1,665 (100.0%) |
Household Income by Mortgage Status in Coahoma County
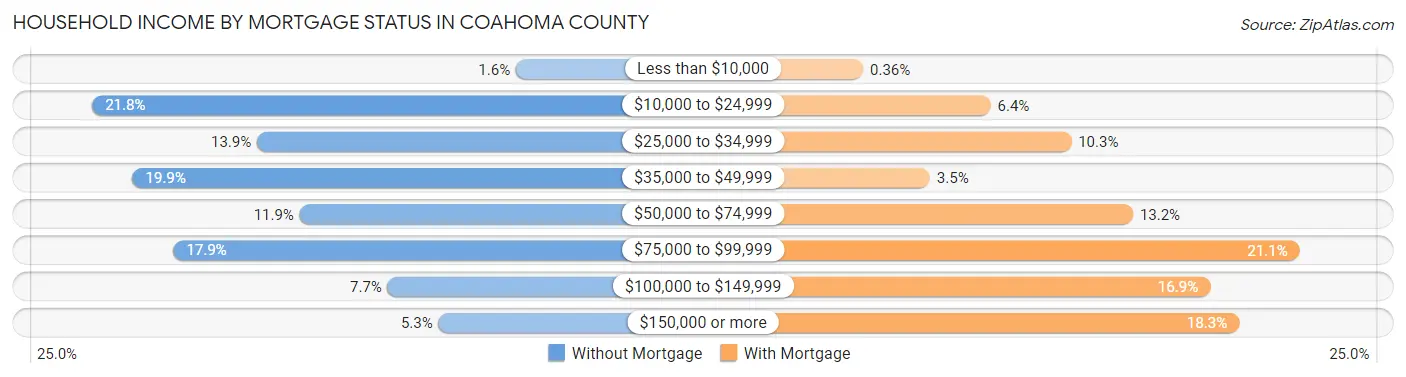
| Household Income | Without Mortgage | With Mortgage |
| Less than $10,000 | 45 (1.6%) | 6 (0.4%) |
| $10,000 to $24,999 | 613 (21.8%) | 107 (6.4%) |
| $25,000 to $34,999 | 392 (13.9%) | 171 (10.3%) |
| $35,000 to $49,999 | 559 (19.9%) | 59 (3.5%) |
| $50,000 to $74,999 | 335 (11.9%) | 220 (13.2%) |
| $75,000 to $99,999 | 504 (17.9%) | 352 (21.1%) |
| $100,000 to $149,999 | 217 (7.7%) | 281 (16.9%) |
| $150,000 or more | 149 (5.3%) | 304 (18.3%) |
| Total | 2,814 (100.0%) | 1,665 (100.0%) |
Property Value to Household Income Ratio in Coahoma County
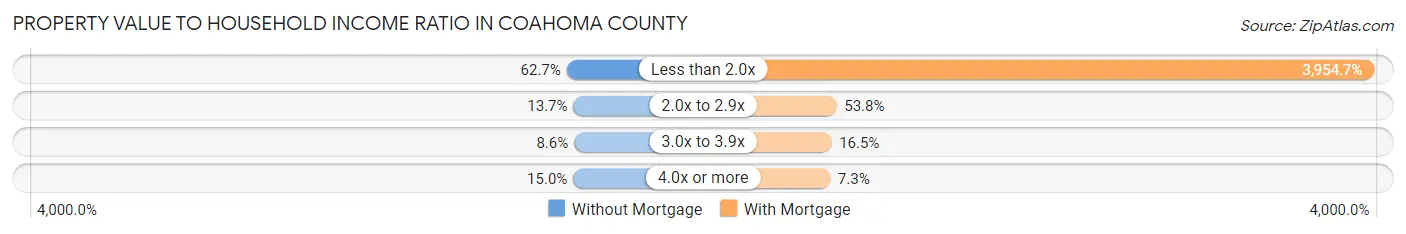
| Value-to-Income Ratio | Without Mortgage | With Mortgage |
| Less than 2.0x | 1,764 (62.7%) | 65,846 (3,954.7%) |
| 2.0x to 2.9x | 384 (13.7%) | 896 (53.8%) |
| 3.0x to 3.9x | 243 (8.6%) | 274 (16.5%) |
| 4.0x or more | 423 (15.0%) | 122 (7.3%) |
| Total | 2,814 (100.0%) | 1,665 (100.0%) |
Real Estate Taxes by Mortgage Status in Coahoma County
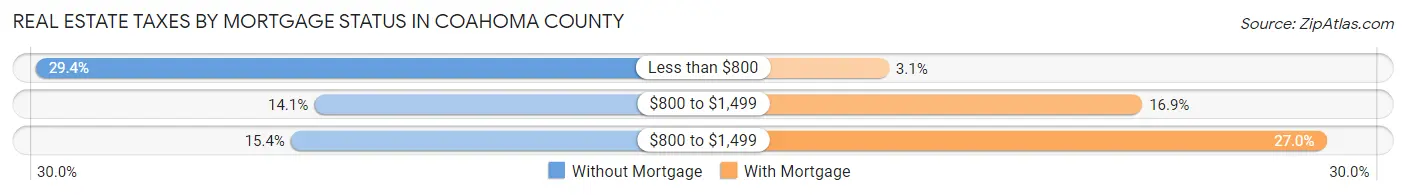
| Property Taxes | Without Mortgage | With Mortgage |
| Less than $800 | 827 (29.4%) | 51 (3.1%) |
| $800 to $1,499 | 398 (14.1%) | 282 (16.9%) |
| $800 to $1,499 | 434 (15.4%) | 450 (27.0%) |
| Total | 2,814 (100.0%) | 1,665 (100.0%) |
Health & Disability in Coahoma County
Health Insurance Coverage by Age in Coahoma County
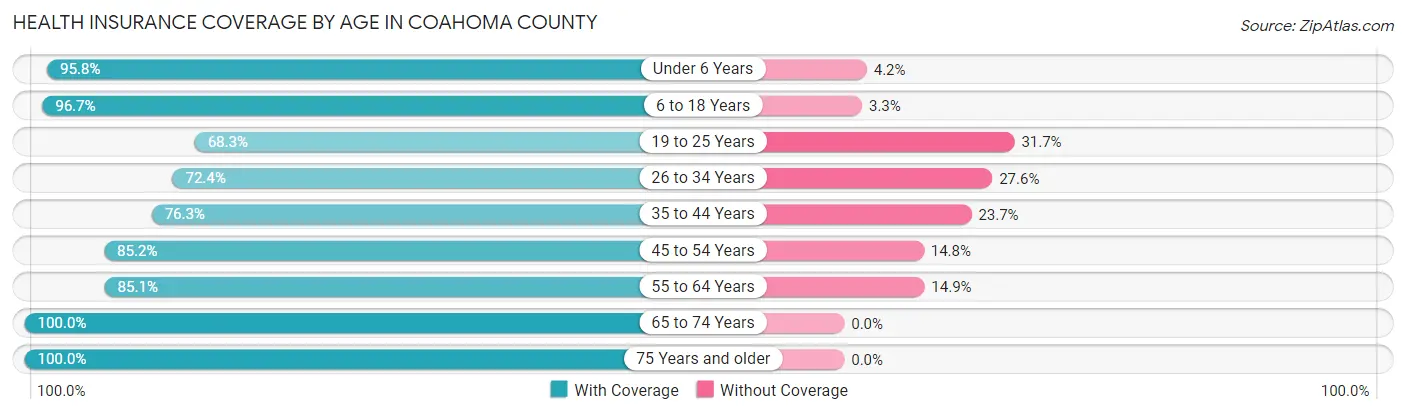
| Age Bracket | With Coverage | Without Coverage |
| Under 6 Years | 1,737 (95.8%) | 76 (4.2%) |
| 6 to 18 Years | 4,092 (96.7%) | 140 (3.3%) |
| 19 to 25 Years | 1,377 (68.3%) | 640 (31.7%) |
| 26 to 34 Years | 1,698 (72.4%) | 647 (27.6%) |
| 35 to 44 Years | 1,802 (76.3%) | 560 (23.7%) |
| 45 to 54 Years | 1,935 (85.2%) | 337 (14.8%) |
| 55 to 64 Years | 2,300 (85.1%) | 404 (14.9%) |
| 65 to 74 Years | 2,030 (100.0%) | 0 (0.0%) |
| 75 Years and older | 1,199 (100.0%) | 0 (0.0%) |
| Total | 18,170 (86.6%) | 2,804 (13.4%) |
Health Insurance Coverage by Citizenship Status in Coahoma County
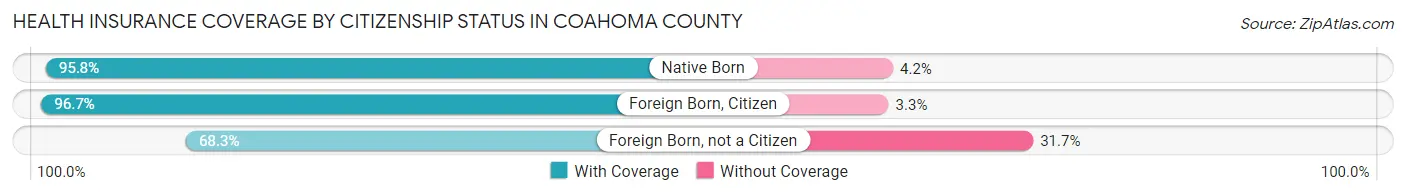
| Citizenship Status | With Coverage | Without Coverage |
| Native Born | 1,737 (95.8%) | 76 (4.2%) |
| Foreign Born, Citizen | 4,092 (96.7%) | 140 (3.3%) |
| Foreign Born, not a Citizen | 1,377 (68.3%) | 640 (31.7%) |
Health Insurance Coverage by Household Income in Coahoma County
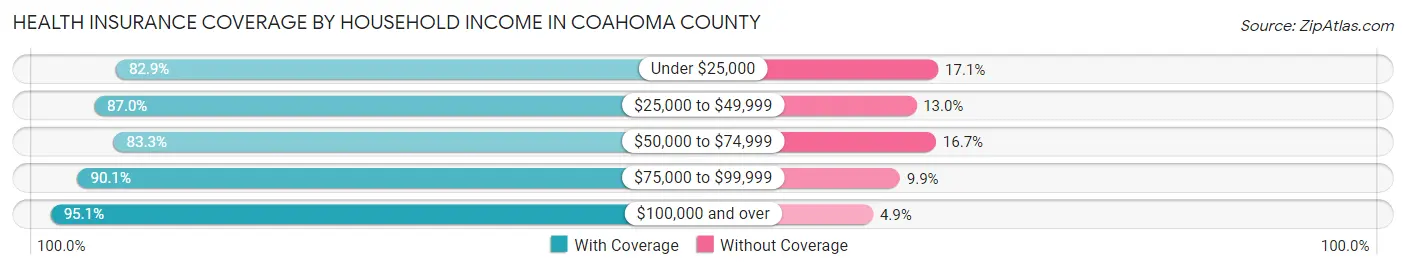
| Household Income | With Coverage | Without Coverage |
| Under $25,000 | 5,612 (82.9%) | 1,159 (17.1%) |
| $25,000 to $49,999 | 3,994 (87.0%) | 597 (13.0%) |
| $50,000 to $74,999 | 2,895 (83.3%) | 580 (16.7%) |
| $75,000 to $99,999 | 2,908 (90.1%) | 321 (9.9%) |
| $100,000 and over | 2,387 (95.1%) | 123 (4.9%) |
Public vs Private Health Insurance Coverage by Age in Coahoma County
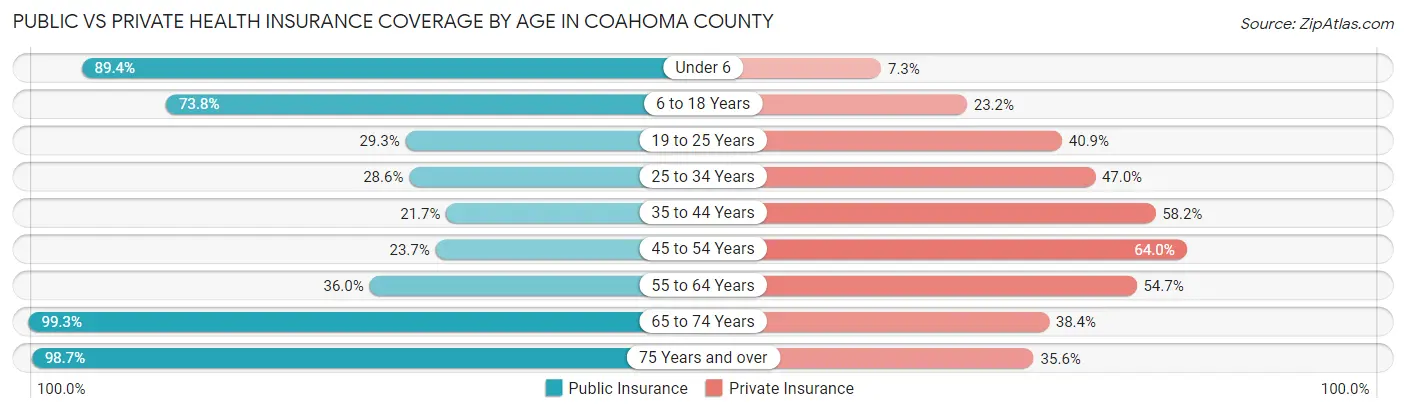
| Age Bracket | Public Insurance | Private Insurance |
| Under 6 | 1,621 (89.4%) | 132 (7.3%) |
| 6 to 18 Years | 3,121 (73.8%) | 982 (23.2%) |
| 19 to 25 Years | 591 (29.3%) | 824 (40.8%) |
| 25 to 34 Years | 671 (28.6%) | 1,102 (47.0%) |
| 35 to 44 Years | 513 (21.7%) | 1,374 (58.2%) |
| 45 to 54 Years | 539 (23.7%) | 1,454 (64.0%) |
| 55 to 64 Years | 973 (36.0%) | 1,479 (54.7%) |
| 65 to 74 Years | 2,015 (99.3%) | 780 (38.4%) |
| 75 Years and over | 1,183 (98.7%) | 427 (35.6%) |
| Total | 11,227 (53.5%) | 8,554 (40.8%) |
Disability Status by Sex by Age in Coahoma County
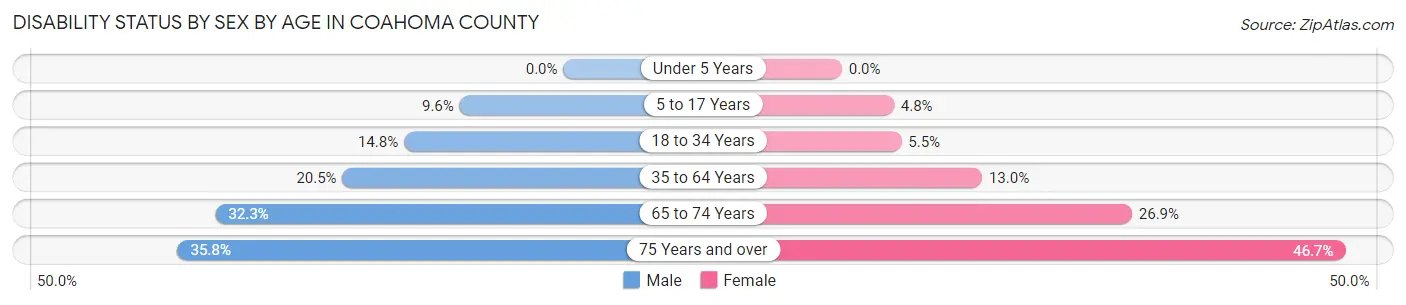
| Age Bracket | Male | Female |
| Under 5 Years | 0 (0.0%) | 0 (0.0%) |
| 5 to 17 Years | 198 (9.6%) | 98 (4.8%) |
| 18 to 34 Years | 345 (14.8%) | 134 (5.5%) |
| 35 to 64 Years | 677 (20.5%) | 525 (13.0%) |
| 65 to 74 Years | 310 (32.3%) | 288 (26.9%) |
| 75 Years and over | 145 (35.8%) | 371 (46.7%) |
Disability Class by Sex by Age in Coahoma County
Disability Class: Hearing Difficulty
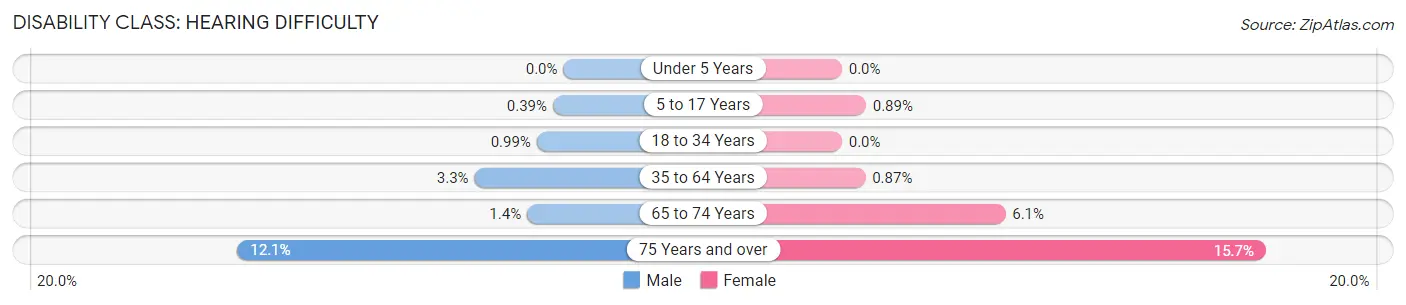
| Age Bracket | Male | Female |
| Under 5 Years | 0 (0.0%) | 0 (0.0%) |
| 5 to 17 Years | 8 (0.4%) | 18 (0.9%) |
| 18 to 34 Years | 23 (1.0%) | 0 (0.0%) |
| 35 to 64 Years | 109 (3.3%) | 35 (0.9%) |
| 65 to 74 Years | 13 (1.3%) | 65 (6.1%) |
| 75 Years and over | 49 (12.1%) | 125 (15.7%) |
Disability Class: Vision Difficulty
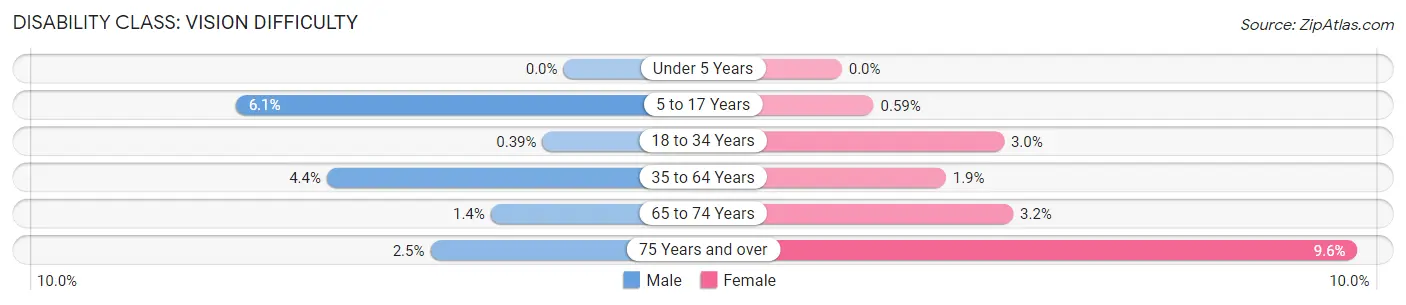
| Age Bracket | Male | Female |
| Under 5 Years | 0 (0.0%) | 0 (0.0%) |
| 5 to 17 Years | 125 (6.1%) | 12 (0.6%) |
| 18 to 34 Years | 9 (0.4%) | 73 (3.0%) |
| 35 to 64 Years | 145 (4.4%) | 78 (1.9%) |
| 65 to 74 Years | 13 (1.3%) | 34 (3.2%) |
| 75 Years and over | 10 (2.5%) | 76 (9.6%) |
Disability Class: Cognitive Difficulty
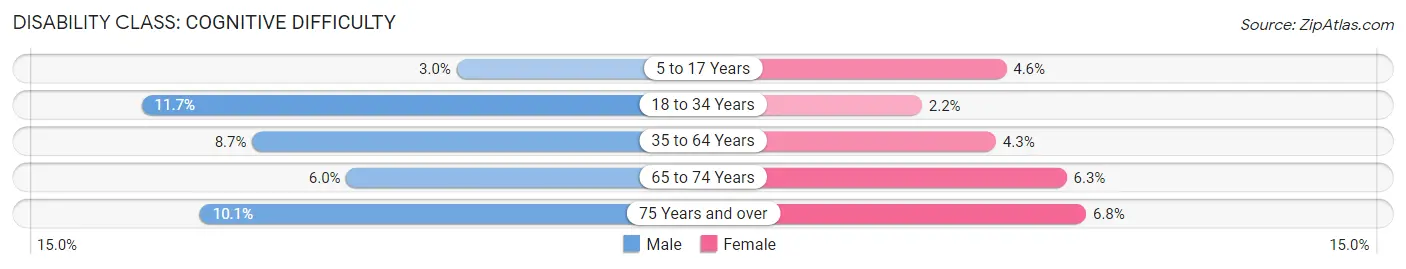
| Age Bracket | Male | Female |
| 5 to 17 Years | 61 (3.0%) | 93 (4.6%) |
| 18 to 34 Years | 274 (11.7%) | 54 (2.2%) |
| 35 to 64 Years | 286 (8.7%) | 173 (4.3%) |
| 65 to 74 Years | 58 (6.0%) | 67 (6.3%) |
| 75 Years and over | 41 (10.1%) | 54 (6.8%) |
Disability Class: Ambulatory Difficulty
| Age Bracket | Male | Female |
| 5 to 17 Years | 1 (0.1%) | 18 (0.9%) |
| 18 to 34 Years | 93 (4.0%) | 75 (3.1%) |
| 35 to 64 Years | 350 (10.6%) | 351 (8.7%) |
| 65 to 74 Years | 279 (29.1%) | 258 (24.1%) |
| 75 Years and over | 82 (20.3%) | 205 (25.8%) |
Disability Class: Self-Care Difficulty
| Age Bracket | Male | Female |
| 5 to 17 Years | 23 (1.1%) | 18 (0.9%) |
| 18 to 34 Years | 32 (1.4%) | 53 (2.2%) |
| 35 to 64 Years | 127 (3.8%) | 104 (2.6%) |
| 65 to 74 Years | 57 (5.9%) | 74 (6.9%) |
| 75 Years and over | 15 (3.7%) | 125 (15.7%) |
Technology Access in Coahoma County
Computing Device Access in Coahoma County
| Device Type | # Households | % Households |
| Desktop or Laptop | 4,679 | 55.8% |
| Smartphone | 6,663 | 79.4% |
| Tablet | 4,040 | 48.2% |
| No Computing Device | 1,206 | 14.4% |
| Total | 8,387 | 100.0% |
Internet Access in Coahoma County
| Internet Type | # Households | % Households |
| Dial-Up Internet | 0 | 0.0% |
| Broadband Home | 2,321 | 27.7% |
| Cellular Data Only | 3,373 | 40.2% |
| Satellite Internet | 653 | 7.8% |
| No Internet | 2,187 | 26.1% |
| Total | 8,387 | 100.0% |
Coahoma County Summary
Coahoma County is located in the northwestern corner of the state of Mississippi, in the Mississippi Delta region. It is bordered by the Mississippi River to the west, the state of Arkansas to the north, and the state of Tennessee to the east. The county seat is Clarksdale, and the county has a total area of 576 square miles.
History
Coahoma County was established in 1836, and was named after the Choctaw word for “red panther.” The county was originally part of the Chickasaw Cession of 1832, and was part of the Choctaw Nation until 1836. The county was home to several Native American tribes, including the Chickasaw, Choctaw, and Tunica.
The county was home to several plantations during the antebellum period, and was a major cotton-producing region. The county was also home to several freedmen’s settlements, including the town of Mound Bayou, which was founded in 1887 by former slaves.
During the Civil War, the county was the site of several battles, including the Battle of Fort Pemberton and the Battle of Helena. After the war, the county was home to several freedmen’s schools, including the Coahoma County Agricultural High School, which was founded in 1892.
Geography
Coahoma County is located in the northwestern corner of the state of Mississippi, in the Mississippi Delta region. It is bordered by the Mississippi River to the west, the state of Arkansas to the north, and the state of Tennessee to the east. The county has a total area of 576 square miles, and is mostly flat, with some rolling hills in the northern part of the county. The county is drained by the Sunflower River, which flows through the county from north to south.
The county is home to several state parks, including the John W. Kyle State Park, which is located on the banks of the Mississippi River. The county is also home to several wildlife management areas, including the Coahoma County Wildlife Management Area, which is located in the northern part of the county.
Economy
The economy of Coahoma County is largely based on agriculture. The county is home to several large farms, and is a major producer of cotton, soybeans, corn, and other crops. The county is also home to several manufacturing plants, including a paper mill and a furniture factory.
The county is home to several casinos, including the Tunica Resorts Casino, which is located in the town of Tunica. The county is also home to several tourist attractions, including the Delta Blues Museum, which is located in Clarksdale.
Demographics
As of the 2010 census, Coahoma County had a population of 26,151. The racial makeup of the county was 57.3% African American, 40.2% White, 0.3% Native American, 0.2% Asian, 0.1% Pacific Islander, 0.7% from other races, and 1.4% from two or more races. Hispanic or Latino of any race were 1.7% of the population.
The median income for a household in the county was $25,945, and the median income for a family was $31,945. The per capita income for the county was $14,845. About 24.3% of the population was below the poverty line.
Common Questions
What is Per Capita Income in Coahoma County?
Per Capita income in Coahoma County is $22,701.
What is the Median Family Income in Coahoma County?
Median Family Income in Coahoma County is $43,603.
What is the Median Household income in Coahoma County?
Median Household Income in Coahoma County is $36,075.
What is Income or Wage Gap in Coahoma County?
Income or Wage Gap in Coahoma County is 34.7%.
Women in Coahoma County earn 65.3 cents for every dollar earned by a man.
What is Family Income Deficit in Coahoma County?
Family Income Deficit in Coahoma County is $11,447.
Families that are below poverty line in Coahoma County earn $11,447 less on average than the poverty threshold level.
What is Inequality or Gini Index in Coahoma County?
Inequality or Gini Index in Coahoma County is 0.52.
What is the Total Population of Coahoma County?
Total Population of Coahoma County is 21,264.
What is the Total Male Population of Coahoma County?
Total Male Population of Coahoma County is 9,982.
What is the Total Female Population of Coahoma County?
Total Female Population of Coahoma County is 11,282.
What is the Ratio of Males per 100 Females in Coahoma County?
There are 88.48 Males per 100 Females in Coahoma County.
What is the Ratio of Females per 100 Males in Coahoma County?
There are 113.02 Females per 100 Males in Coahoma County.
What is the Median Population Age in Coahoma County?
Median Population Age in Coahoma County is 35.7 Years.
What is the Average Family Size in Coahoma County
Average Family Size in Coahoma County is 3.2 People.
What is the Average Household Size in Coahoma County
Average Household Size in Coahoma County is 2.5 People.
How Large is the Labor Force in Coahoma County?
There are 8,496 People in the Labor Forcein in Coahoma County.
What is the Percentage of People in the Labor Force in Coahoma County?
52.4% of People are in the Labor Force in Coahoma County.
What is the Unemployment Rate in Coahoma County?
Unemployment Rate in Coahoma County is 10.8%.