Clarke County, MS Map & Demographics
Clarke County Map
Clarke County Overview
$26,435
PER CAPITA INCOME
$60,057
AVG FAMILY INCOME
$46,329
AVG HOUSEHOLD INCOME
48.4%
WAGE / INCOME GAP [ % ]
51.6¢/ $1
WAGE / INCOME GAP [ $ ]
$12,196
FAMILY INCOME DEFICIT
0.50
INEQUALITY / GINI INDEX
15,553
TOTAL POPULATION
7,289
MALE POPULATION
8,264
FEMALE POPULATION
88.20
MALES / 100 FEMALES
113.38
FEMALES / 100 MALES
42.1
MEDIAN AGE
3.0
AVG FAMILY SIZE
2.5
AVG HOUSEHOLD SIZE
6,685
LABOR FORCE [ PEOPLE ]
53.4%
PERCENT IN LABOR FORCE
5.6%
UNEMPLOYMENT RATE
Clarke County Area Codes
Income in Clarke County
Income Overview in Clarke County
Per Capita Income in Clarke County is $26,435, while median incomes of families and households are $60,057 and $46,329 respectively.
| Characteristic | Number | Measure |
| Per Capita Income | 15,553 | $26,435 |
| Median Family Income | 4,399 | $60,057 |
| Mean Family Income | 4,399 | $77,075 |
| Median Household Income | 6,117 | $46,329 |
| Mean Household Income | 6,117 | $64,381 |
| Income Deficit | 4,399 | $12,196 |
| Wage / Income Gap (%) | 15,553 | 48.38% |
| Wage / Income Gap ($) | 15,553 | 51.62¢ per $1 |
| Gini / Inequality Index | 15,553 | 0.50 |
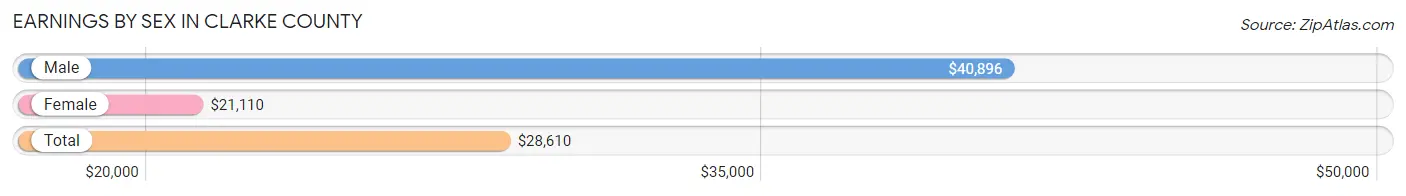
Earnings by Sex in Clarke County
Average Earnings in Clarke County are $28,610, $40,896 for men and $21,110 for women, a difference of 48.4%.
| Sex | Number | Average Earnings |
| Male | 3,563 (52.4%) | $40,896 |
| Female | 3,231 (47.6%) | $21,110 |
| Total | 6,794 (100.0%) | $28,610 |
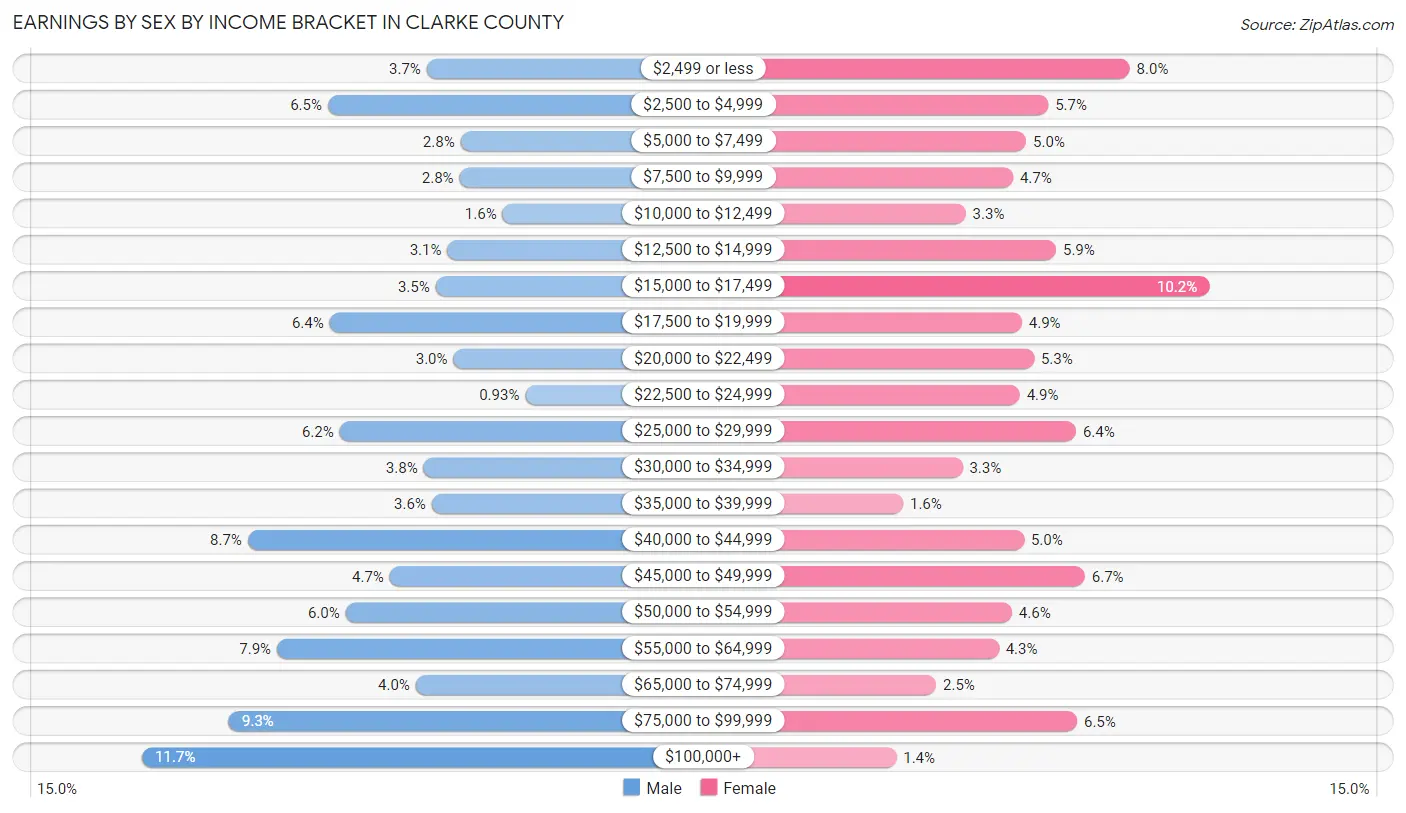
Earnings by Sex by Income Bracket in Clarke County
The most common earnings brackets in Clarke County are $100,000+ for men (417 | 11.7%) and $15,000 to $17,499 for women (329 | 10.2%).
| Income | Male | Female |
| $2,499 or less | 132 (3.7%) | 257 (8.0%) |
| $2,500 to $4,999 | 231 (6.5%) | 183 (5.7%) |
| $5,000 to $7,499 | 98 (2.8%) | 163 (5.0%) |
| $7,500 to $9,999 | 99 (2.8%) | 151 (4.7%) |
| $10,000 to $12,499 | 56 (1.6%) | 108 (3.3%) |
| $12,500 to $14,999 | 111 (3.1%) | 190 (5.9%) |
| $15,000 to $17,499 | 123 (3.5%) | 329 (10.2%) |
| $17,500 to $19,999 | 229 (6.4%) | 159 (4.9%) |
| $20,000 to $22,499 | 105 (2.9%) | 170 (5.3%) |
| $22,500 to $24,999 | 33 (0.9%) | 157 (4.9%) |
| $25,000 to $29,999 | 219 (6.1%) | 208 (6.4%) |
| $30,000 to $34,999 | 135 (3.8%) | 105 (3.3%) |
| $35,000 to $39,999 | 127 (3.6%) | 51 (1.6%) |
| $40,000 to $44,999 | 311 (8.7%) | 161 (5.0%) |
| $45,000 to $49,999 | 169 (4.7%) | 216 (6.7%) |
| $50,000 to $54,999 | 213 (6.0%) | 150 (4.6%) |
| $55,000 to $64,999 | 282 (7.9%) | 138 (4.3%) |
| $65,000 to $74,999 | 143 (4.0%) | 81 (2.5%) |
| $75,000 to $99,999 | 330 (9.3%) | 209 (6.5%) |
| $100,000+ | 417 (11.7%) | 45 (1.4%) |
| Total | 3,563 (100.0%) | 3,231 (100.0%) |
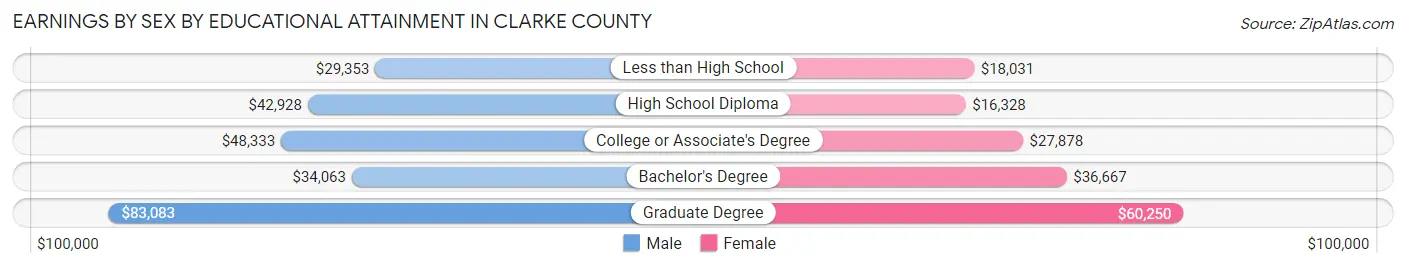
Earnings by Sex by Educational Attainment in Clarke County
Average earnings in Clarke County are $44,635 for men and $24,297 for women, a difference of 45.6%. Men with an educational attainment of graduate degree enjoy the highest average annual earnings of $83,083, while those with less than high school education earn the least with $29,353. Women with an educational attainment of graduate degree earn the most with the average annual earnings of $60,250, while those with high school diploma education have the smallest earnings of $16,328.
| Educational Attainment | Male Income | Female Income |
| Less than High School | $29,353 | $18,031 |
| High School Diploma | $42,928 | $16,328 |
| College or Associate's Degree | $48,333 | $27,878 |
| Bachelor's Degree | $34,063 | $36,667 |
| Graduate Degree | $83,083 | $60,250 |
| Total | $44,635 | $24,297 |
Family Income in Clarke County
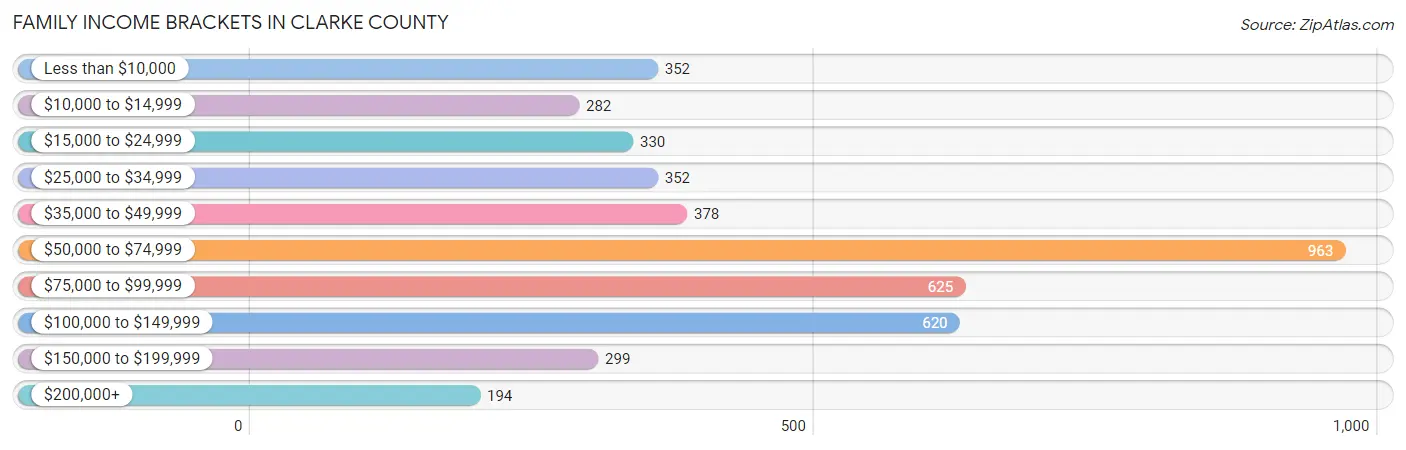
Family Income Brackets in Clarke County
According to the Clarke County family income data, there are 963 families falling into the $50,000 to $74,999 income range, which is the most common income bracket and makes up 21.9% of all families. Conversely, the $200,000+ income bracket is the least frequent group with only 194 families (4.4%) belonging to this category.
| Income Bracket | # Families | % Families |
| Less than $10,000 | 352 | 8.0% |
| $10,000 to $14,999 | 282 | 6.4% |
| $15,000 to $24,999 | 330 | 7.5% |
| $25,000 to $34,999 | 352 | 8.0% |
| $35,000 to $49,999 | 378 | 8.6% |
| $50,000 to $74,999 | 963 | 21.9% |
| $75,000 to $99,999 | 625 | 14.2% |
| $100,000 to $149,999 | 620 | 14.1% |
| $150,000 to $199,999 | 299 | 6.8% |
| $200,000+ | 194 | 4.4% |
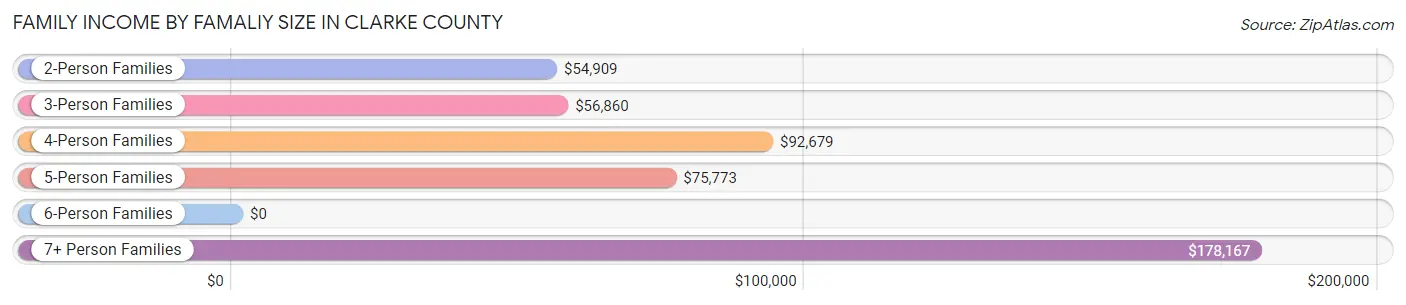
Family Income by Famaliy Size in Clarke County
7+ person families (44 | 1.0%) account for the highest median family income in Clarke County with $178,167 per family, while 2-person families (2,317 | 52.7%) have the highest median income of $27,454 per family member.
| Income Bracket | # Families | Median Income |
| 2-Person Families | 2,317 (52.7%) | $54,909 |
| 3-Person Families | 972 (22.1%) | $56,860 |
| 4-Person Families | 604 (13.7%) | $92,679 |
| 5-Person Families | 455 (10.3%) | $75,773 |
| 6-Person Families | 7 (0.2%) | $0 |
| 7+ Person Families | 44 (1.0%) | $178,167 |
| Total | 4,399 (100.0%) | $60,057 |
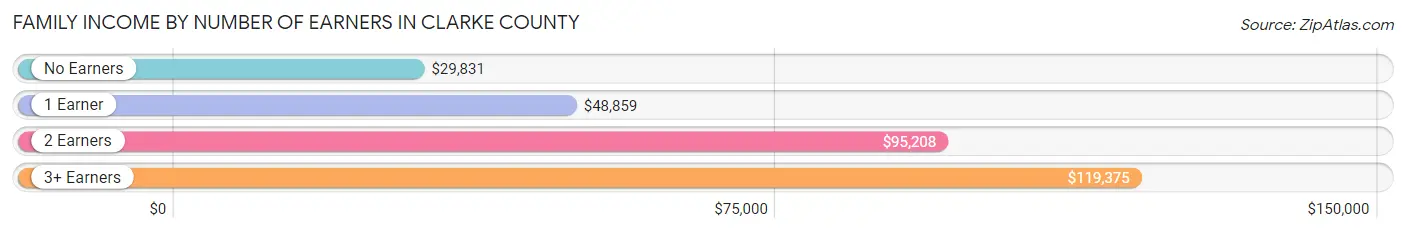
Family Income by Number of Earners in Clarke County
The median family income in Clarke County is $60,057, with families comprising 3+ earners (248) having the highest median family income of $119,375, while families with no earners (996) have the lowest median family income of $29,831, accounting for 5.6% and 22.6% of families, respectively.
| Number of Earners | # Families | Median Income |
| No Earners | 996 (22.6%) | $29,831 |
| 1 Earner | 1,815 (41.3%) | $48,859 |
| 2 Earners | 1,340 (30.5%) | $95,208 |
| 3+ Earners | 248 (5.6%) | $119,375 |
| Total | 4,399 (100.0%) | $60,057 |
Household Income in Clarke County
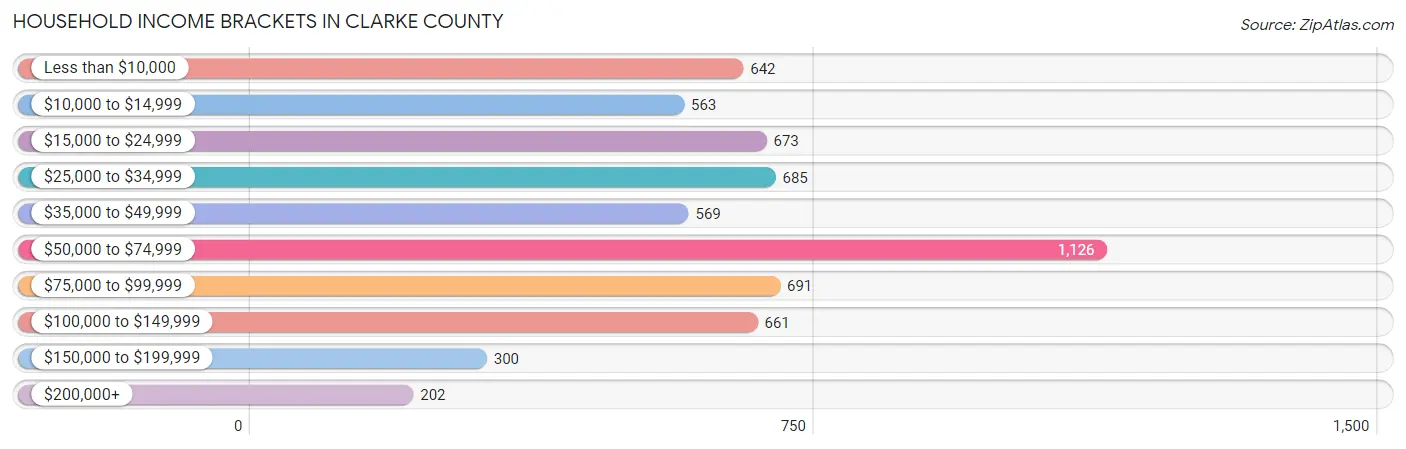
Household Income Brackets in Clarke County
With 1,126 households falling in the category, the $50,000 to $74,999 income range is the most frequent in Clarke County, accounting for 18.4% of all households. In contrast, only 202 households (3.3%) fall into the $200,000+ income bracket, making it the least populous group.
| Income Bracket | # Households | % Households |
| Less than $10,000 | 642 | 10.5% |
| $10,000 to $14,999 | 563 | 9.2% |
| $15,000 to $24,999 | 673 | 11.0% |
| $25,000 to $34,999 | 685 | 11.2% |
| $35,000 to $49,999 | 569 | 9.3% |
| $50,000 to $74,999 | 1,126 | 18.4% |
| $75,000 to $99,999 | 691 | 11.3% |
| $100,000 to $149,999 | 661 | 10.8% |
| $150,000 to $199,999 | 300 | 4.9% |
| $200,000+ | 202 | 3.3% |
Household Income by Householder Age in Clarke County
The median household income in Clarke County is $46,329, with the highest median household income of $65,043 found in the 25 to 44 years age bracket for the primary householder. A total of 1,513 households (24.7%) fall into this category. Meanwhile, the 15 to 24 years age bracket for the primary householder has the lowest median household income of $0, with 124 households (2.0%) in this group.
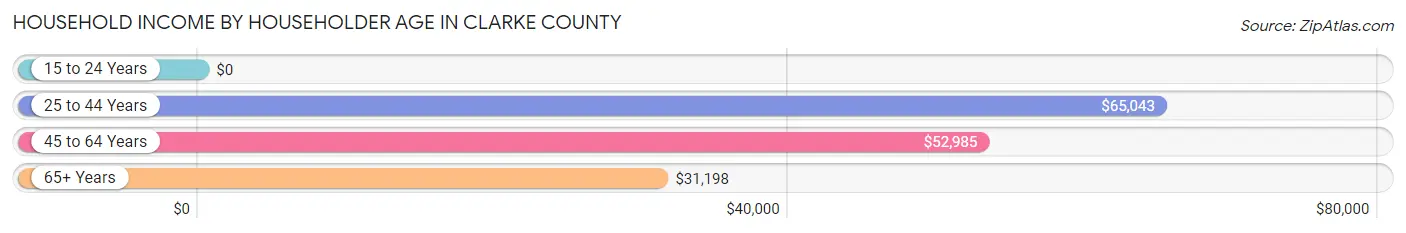
| Income Bracket | # Households | Median Income |
| 15 to 24 Years | 124 (2.0%) | $0 |
| 25 to 44 Years | 1,513 (24.7%) | $65,043 |
| 45 to 64 Years | 2,241 (36.6%) | $52,985 |
| 65+ Years | 2,239 (36.6%) | $31,198 |
| Total | 6,117 (100.0%) | $46,329 |
Poverty in Clarke County
Income Below Poverty by Sex and Age in Clarke County
With 13.9% poverty level for males and 26.5% for females among the residents of Clarke County, 15 year old males and 16 and 17 year old females are the most vulnerable to poverty, with 14 males (43.8%) and 116 females (49.1%) in their respective age groups living below the poverty level.
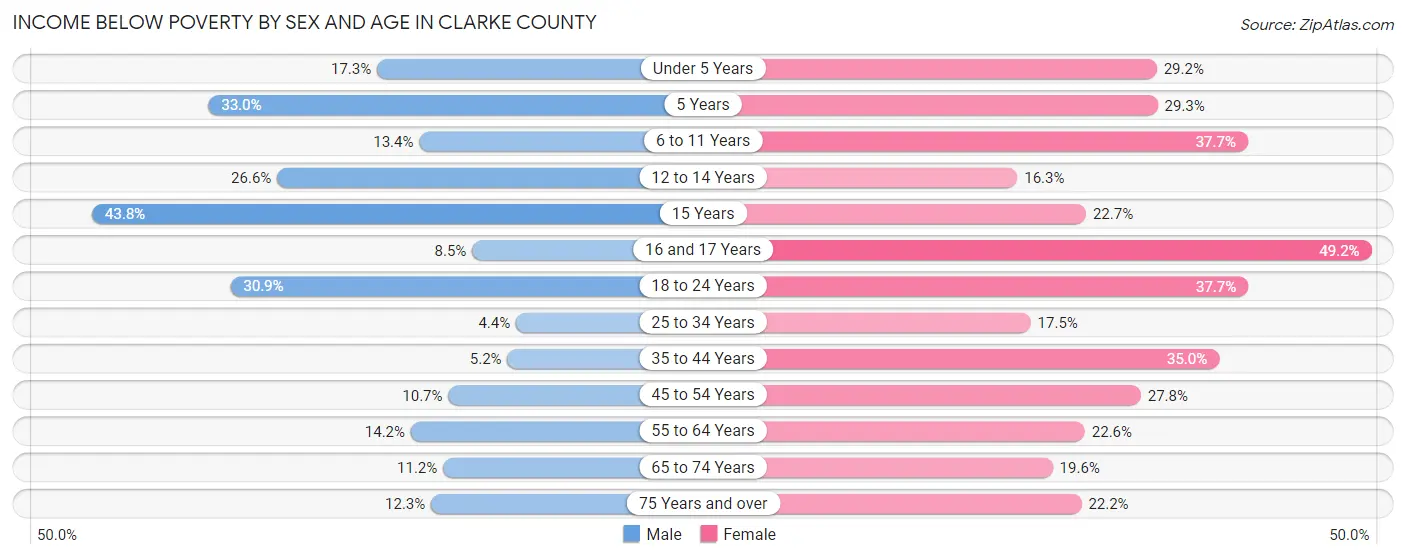
| Age Bracket | Male | Female |
| Under 5 Years | 79 (17.3%) | 133 (29.2%) |
| 5 Years | 29 (33.0%) | 17 (29.3%) |
| 6 to 11 Years | 67 (13.4%) | 194 (37.7%) |
| 12 to 14 Years | 102 (26.6%) | 58 (16.3%) |
| 15 Years | 14 (43.8%) | 29 (22.7%) |
| 16 and 17 Years | 17 (8.5%) | 116 (49.1%) |
| 18 to 24 Years | 216 (30.9%) | 230 (37.7%) |
| 25 to 34 Years | 35 (4.4%) | 180 (17.5%) |
| 35 to 44 Years | 36 (5.2%) | 306 (35.0%) |
| 45 to 54 Years | 95 (10.7%) | 267 (27.8%) |
| 55 to 64 Years | 149 (14.1%) | 275 (22.6%) |
| 65 to 74 Years | 97 (11.2%) | 199 (19.6%) |
| 75 Years and over | 67 (12.3%) | 169 (22.2%) |
| Total | 1,003 (13.9%) | 2,173 (26.5%) |
Income Above Poverty by Sex and Age in Clarke County
According to the poverty statistics in Clarke County, males aged 25 to 34 years and females aged 12 to 14 years are the age groups that are most secure financially, with 95.6% of males and 83.7% of females in these age groups living above the poverty line.
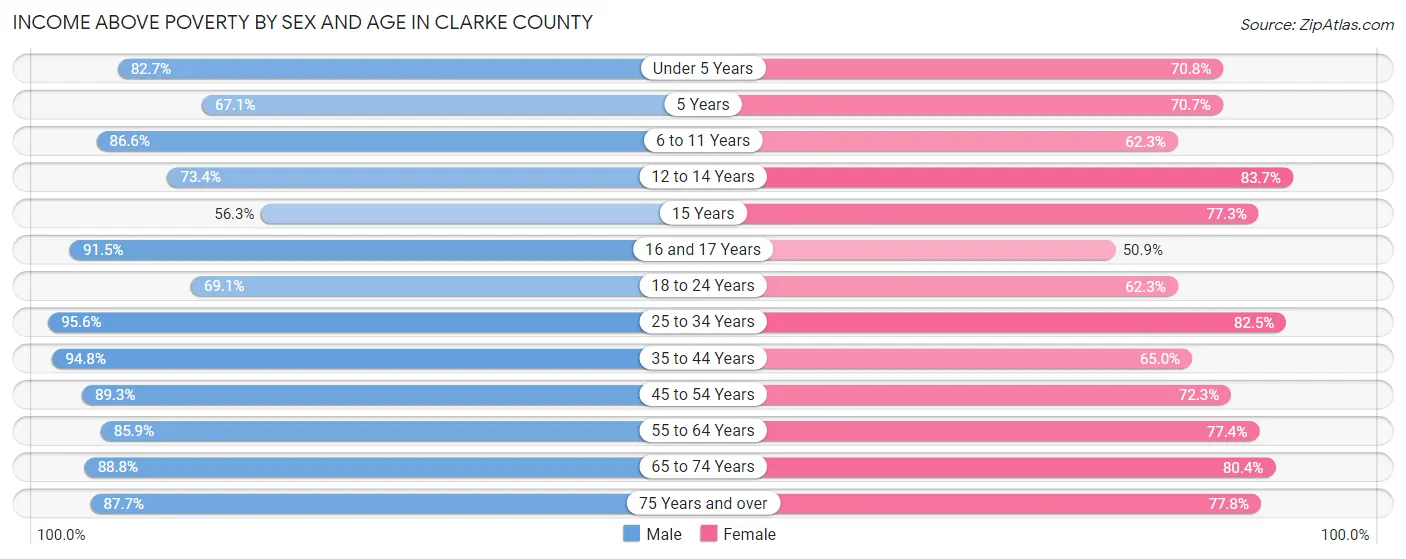
| Age Bracket | Male | Female |
| Under 5 Years | 378 (82.7%) | 322 (70.8%) |
| 5 Years | 59 (67.0%) | 41 (70.7%) |
| 6 to 11 Years | 434 (86.6%) | 321 (62.3%) |
| 12 to 14 Years | 282 (73.4%) | 298 (83.7%) |
| 15 Years | 18 (56.2%) | 99 (77.3%) |
| 16 and 17 Years | 184 (91.5%) | 120 (50.8%) |
| 18 to 24 Years | 483 (69.1%) | 380 (62.3%) |
| 25 to 34 Years | 762 (95.6%) | 847 (82.5%) |
| 35 to 44 Years | 657 (94.8%) | 568 (65.0%) |
| 45 to 54 Years | 795 (89.3%) | 695 (72.3%) |
| 55 to 64 Years | 904 (85.9%) | 944 (77.4%) |
| 65 to 74 Years | 772 (88.8%) | 818 (80.4%) |
| 75 Years and over | 479 (87.7%) | 591 (77.8%) |
| Total | 6,207 (86.1%) | 6,044 (73.6%) |
Income Below Poverty Among Married-Couple Families in Clarke County
The poverty statistics for married-couple families in Clarke County show that 7.7% or 229 of the total 2,964 families live below the poverty line. Families with 5 or more children have the highest poverty rate of 14.3%, comprising of 2 families. On the other hand, families with 3 or 4 children have the lowest poverty rate of 4.4%, which includes 11 families.
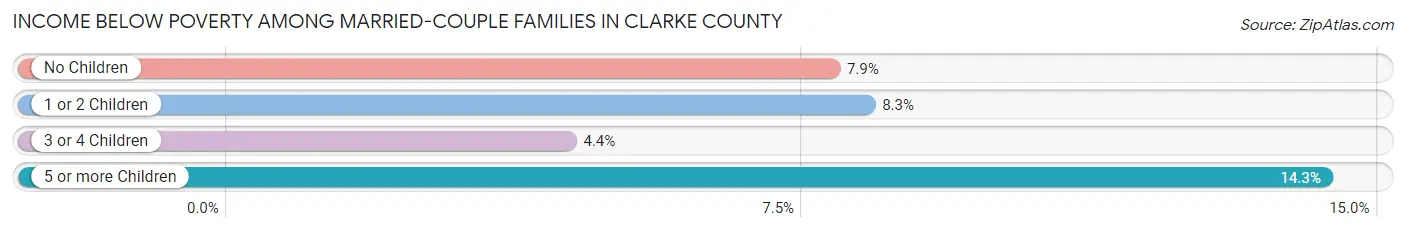
| Children | Above Poverty | Below Poverty |
| No Children | 1,758 (92.1%) | 150 (7.9%) |
| 1 or 2 Children | 727 (91.7%) | 66 (8.3%) |
| 3 or 4 Children | 238 (95.6%) | 11 (4.4%) |
| 5 or more Children | 12 (85.7%) | 2 (14.3%) |
| Total | 2,735 (92.3%) | 229 (7.7%) |
Income Below Poverty Among Single-Parent Households in Clarke County
According to the poverty data in Clarke County, 22.6% or 52 single-father households and 45.7% or 551 single-mother households are living below the poverty line. Among single-father households, those with 1 or 2 children have the highest poverty rate, with 40 households (31.2%) experiencing poverty. Likewise, among single-mother households, those with 1 or 2 children have the highest poverty rate, with 320 households (64.6%) falling below the poverty line.
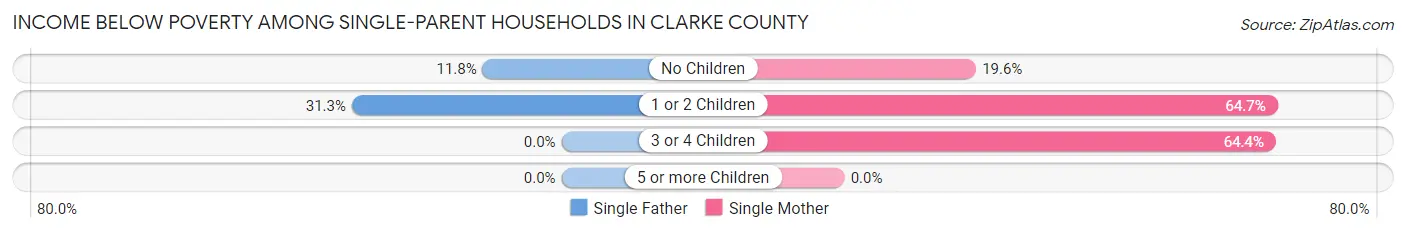
| Children | Single Father | Single Mother |
| No Children | 12 (11.8%) | 99 (19.6%) |
| 1 or 2 Children | 40 (31.2%) | 320 (64.6%) |
| 3 or 4 Children | 0 (0.0%) | 132 (64.4%) |
| 5 or more Children | 0 (0.0%) | 0 (0.0%) |
| Total | 52 (22.6%) | 551 (45.7%) |
Income Below Poverty Among Married-Couple vs Single-Parent Households in Clarke County
The poverty data for Clarke County shows that 229 of the married-couple family households (7.7%) and 603 of the single-parent households (42.0%) are living below the poverty level. Within the married-couple family households, those with 5 or more children have the highest poverty rate, with 2 households (14.3%) falling below the poverty line. Among the single-parent households, those with 3 or 4 children have the highest poverty rate, with 132 household (64.4%) living below poverty.
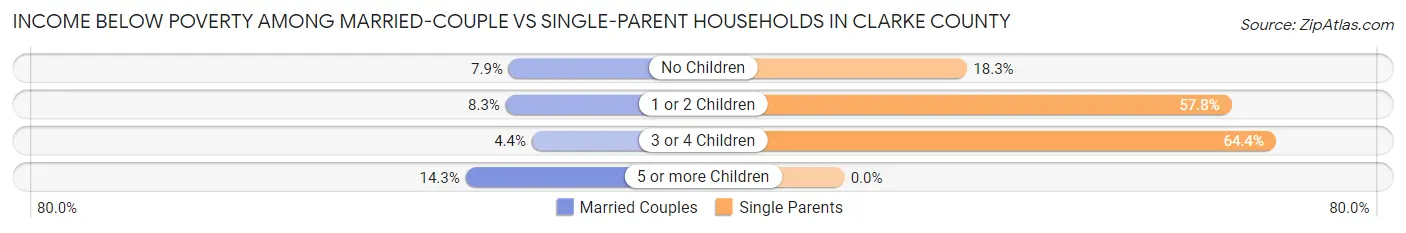
| Children | Married-Couple Families | Single-Parent Households |
| No Children | 150 (7.9%) | 111 (18.3%) |
| 1 or 2 Children | 66 (8.3%) | 360 (57.8%) |
| 3 or 4 Children | 11 (4.4%) | 132 (64.4%) |
| 5 or more Children | 2 (14.3%) | 0 (0.0%) |
| Total | 229 (7.7%) | 603 (42.0%) |
Race in Clarke County
The most populous races in Clarke County are White / Caucasian (9,861 | 63.4%), Black / African American (5,342 | 34.4%), and Two or more Races (323 | 2.1%).
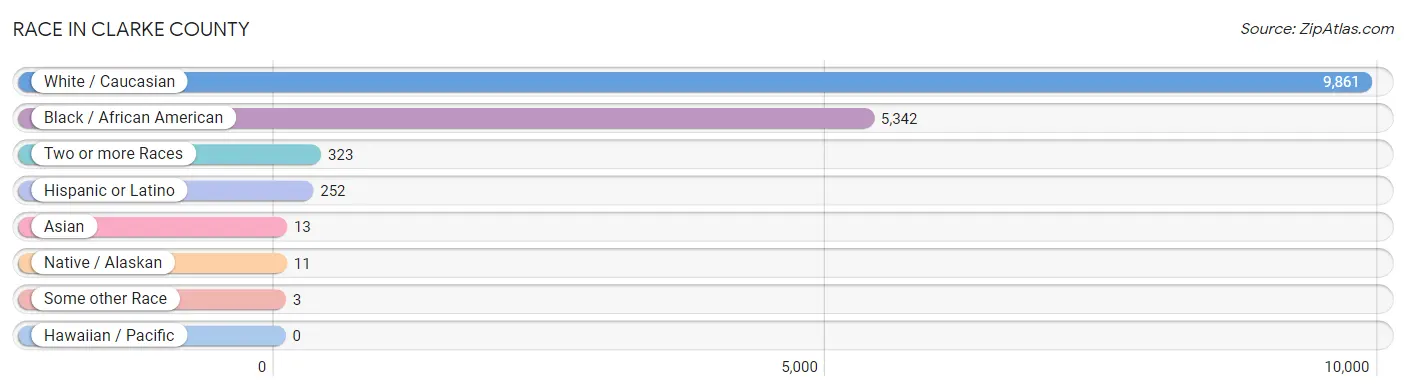
| Race | # Population | % Population |
| Asian | 13 | 0.1% |
| Black / African American | 5,342 | 34.4% |
| Hawaiian / Pacific | 0 | 0.0% |
| Hispanic or Latino | 252 | 1.6% |
| Native / Alaskan | 11 | 0.1% |
| White / Caucasian | 9,861 | 63.4% |
| Two or more Races | 323 | 2.1% |
| Some other Race | 3 | 0.0% |
| Total | 15,553 | 100.0% |
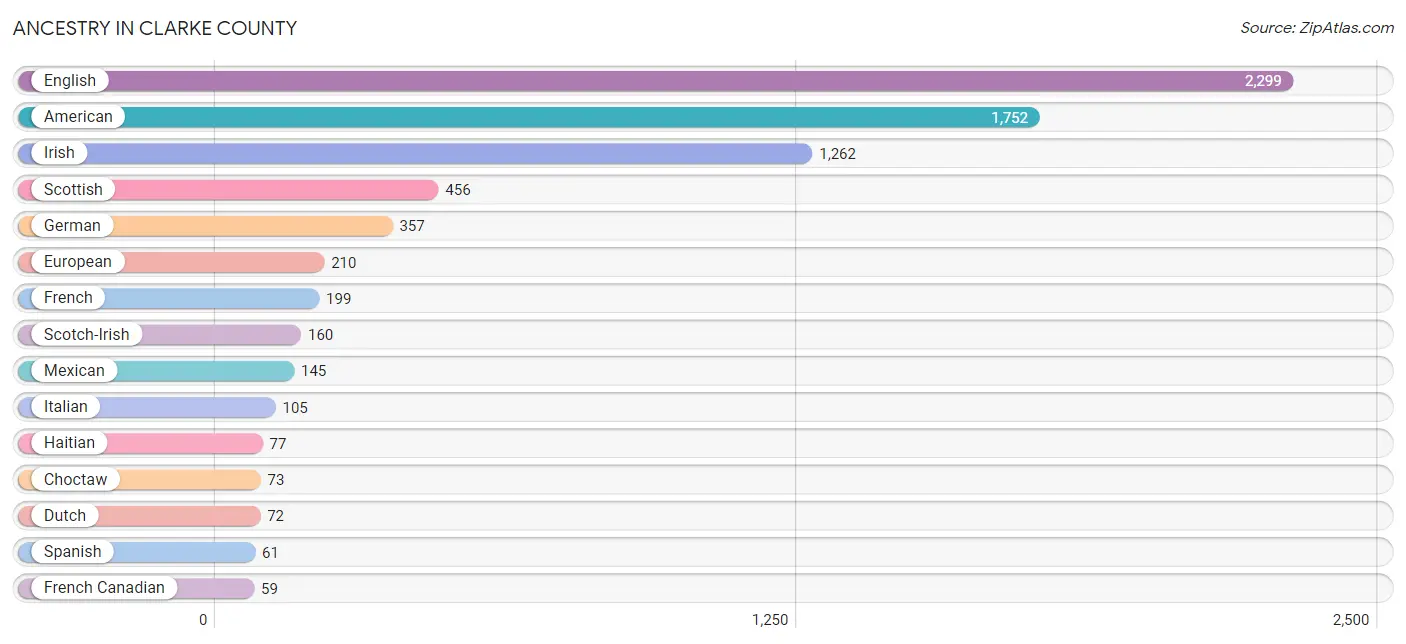
Ancestry in Clarke County
The most populous ancestries reported in Clarke County are English (2,299 | 14.8%), American (1,752 | 11.3%), Irish (1,262 | 8.1%), Scottish (456 | 2.9%), and German (357 | 2.3%), together accounting for 39.4% of all Clarke County residents.
| Ancestry | # Population | % Population |
| African | 55 | 0.4% |
| American | 1,752 | 11.3% |
| Belizean | 12 | 0.1% |
| British | 28 | 0.2% |
| Burmese | 4 | 0.0% |
| Canadian | 33 | 0.2% |
| Central American | 46 | 0.3% |
| Choctaw | 73 | 0.5% |
| Czechoslovakian | 4 | 0.0% |
| Dutch | 72 | 0.5% |
| English | 2,299 | 14.8% |
| European | 210 | 1.3% |
| Finnish | 11 | 0.1% |
| French | 199 | 1.3% |
| French Canadian | 59 | 0.4% |
| German | 357 | 2.3% |
| Greek | 11 | 0.1% |
| Guatemalan | 34 | 0.2% |
| Haitian | 77 | 0.5% |
| Honduran | 12 | 0.1% |
| Hungarian | 3 | 0.0% |
| Indian (Asian) | 3 | 0.0% |
| Irish | 1,262 | 8.1% |
| Italian | 105 | 0.7% |
| Mexican | 145 | 0.9% |
| Northern European | 16 | 0.1% |
| Norwegian | 3 | 0.0% |
| Pennsylvania German | 15 | 0.1% |
| Polish | 11 | 0.1% |
| Portuguese | 11 | 0.1% |
| Russian | 9 | 0.1% |
| Scotch-Irish | 160 | 1.0% |
| Scottish | 456 | 2.9% |
| Spanish | 61 | 0.4% |
| Subsaharan African | 55 | 0.4% |
| Swedish | 53 | 0.3% |
| Thai | 39 | 0.3% |
| Tlingit-Haida | 11 | 0.1% | View All 38 Rows |
Immigrants in Clarke County
The most numerous immigrant groups reported in Clarke County came from Latin America (95 | 0.6%), Central America (43 | 0.3%), Caribbean (41 | 0.3%), Haiti (41 | 0.3%), and Canada (36 | 0.2%), together accounting for 1.6% of all Clarke County residents.
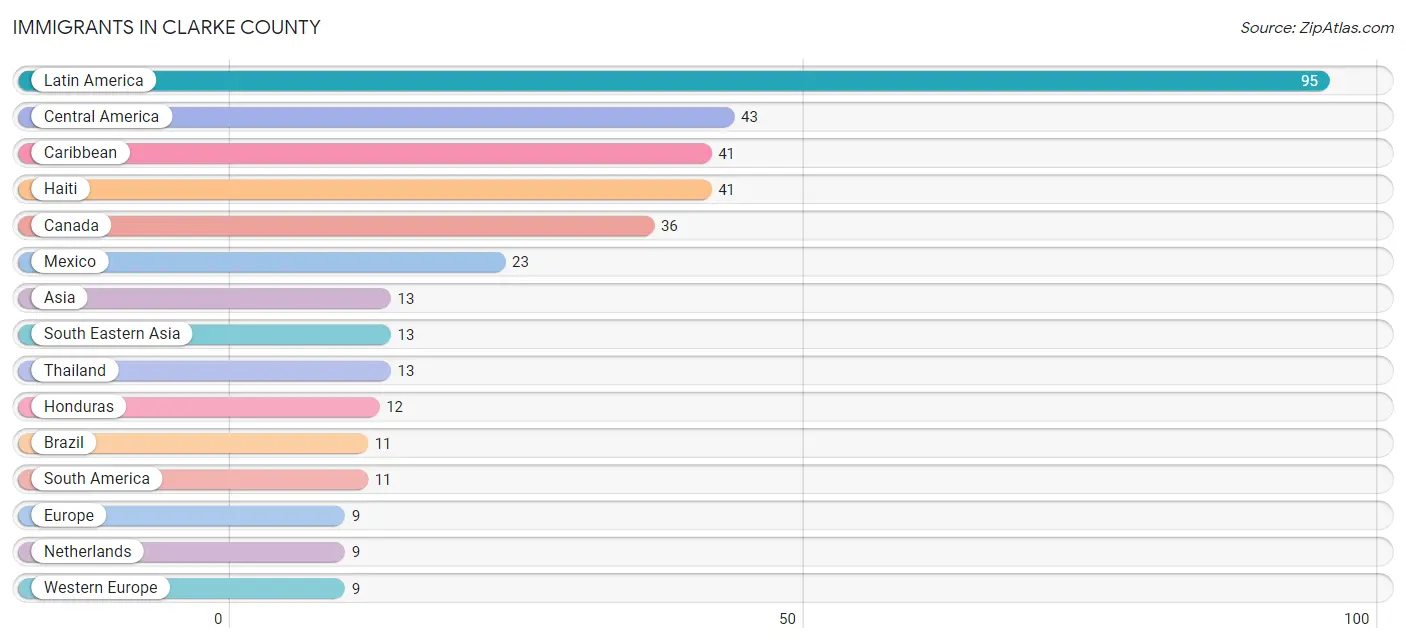
| Immigration Origin | # Population | % Population |
| Asia | 13 | 0.1% |
| Brazil | 11 | 0.1% |
| Canada | 36 | 0.2% |
| Caribbean | 41 | 0.3% |
| Central America | 43 | 0.3% |
| Europe | 9 | 0.1% |
| Guatemala | 8 | 0.1% |
| Haiti | 41 | 0.3% |
| Honduras | 12 | 0.1% |
| Latin America | 95 | 0.6% |
| Mexico | 23 | 0.2% |
| Netherlands | 9 | 0.1% |
| South America | 11 | 0.1% |
| South Eastern Asia | 13 | 0.1% |
| Thailand | 13 | 0.1% |
| Western Europe | 9 | 0.1% | View All 16 Rows |
Sex and Age in Clarke County
Sex and Age in Clarke County
The most populous age groups in Clarke County are 10 to 14 Years (694 | 9.5%) for men and 60 to 64 Years (756 | 9.1%) for women.
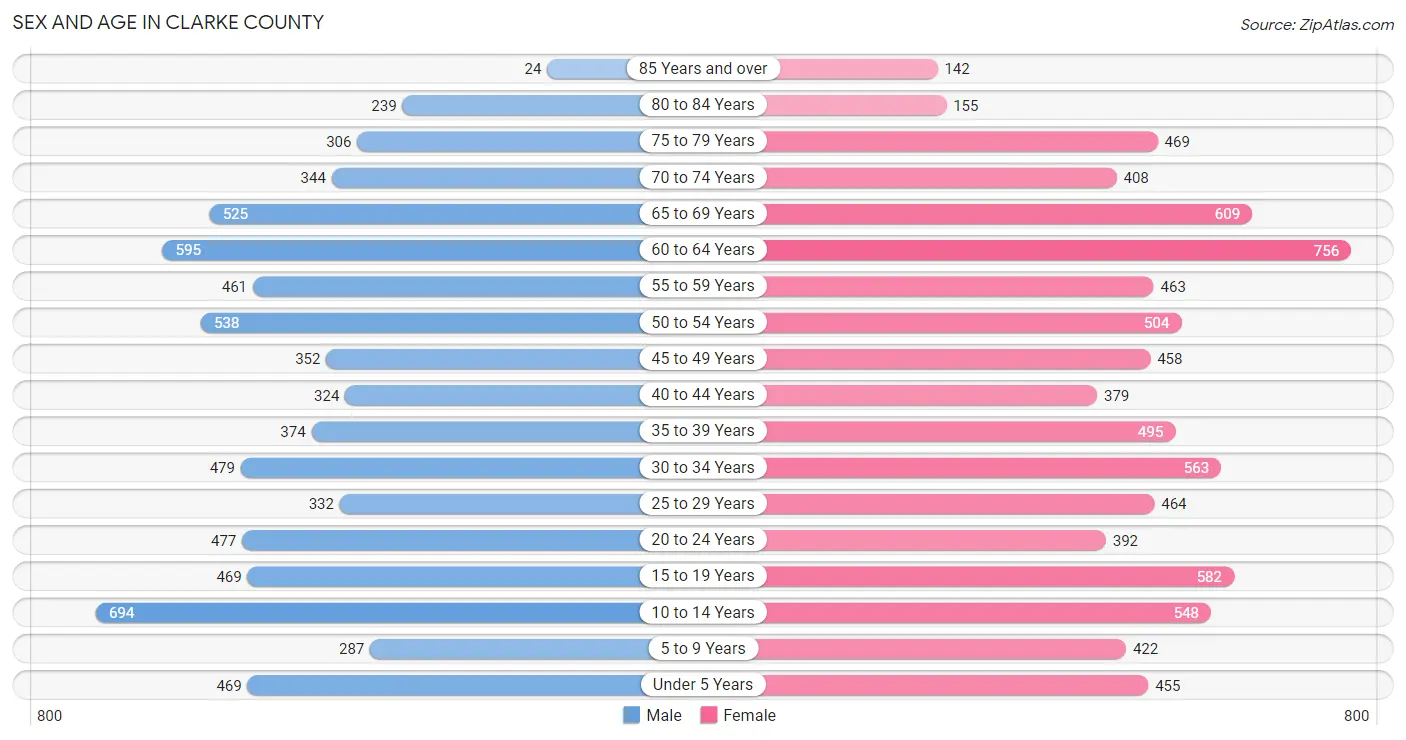
| Age Bracket | Male | Female |
| Under 5 Years | 469 (6.4%) | 455 (5.5%) |
| 5 to 9 Years | 287 (3.9%) | 422 (5.1%) |
| 10 to 14 Years | 694 (9.5%) | 548 (6.6%) |
| 15 to 19 Years | 469 (6.4%) | 582 (7.0%) |
| 20 to 24 Years | 477 (6.5%) | 392 (4.7%) |
| 25 to 29 Years | 332 (4.5%) | 464 (5.6%) |
| 30 to 34 Years | 479 (6.6%) | 563 (6.8%) |
| 35 to 39 Years | 374 (5.1%) | 495 (6.0%) |
| 40 to 44 Years | 324 (4.4%) | 379 (4.6%) |
| 45 to 49 Years | 352 (4.8%) | 458 (5.5%) |
| 50 to 54 Years | 538 (7.4%) | 504 (6.1%) |
| 55 to 59 Years | 461 (6.3%) | 463 (5.6%) |
| 60 to 64 Years | 595 (8.2%) | 756 (9.1%) |
| 65 to 69 Years | 525 (7.2%) | 609 (7.4%) |
| 70 to 74 Years | 344 (4.7%) | 408 (4.9%) |
| 75 to 79 Years | 306 (4.2%) | 469 (5.7%) |
| 80 to 84 Years | 239 (3.3%) | 155 (1.9%) |
| 85 Years and over | 24 (0.3%) | 142 (1.7%) |
| Total | 7,289 (100.0%) | 8,264 (100.0%) |
Families and Households in Clarke County
Median Family Size in Clarke County
The median family size in Clarke County is 3.04 persons per family, with single female/mother families (1,205 | 27.4%) accounting for the largest median family size of 3.17 persons per family. On the other hand, single male/father families (230 | 5.2%) represent the smallest median family size with 2.67 persons per family.
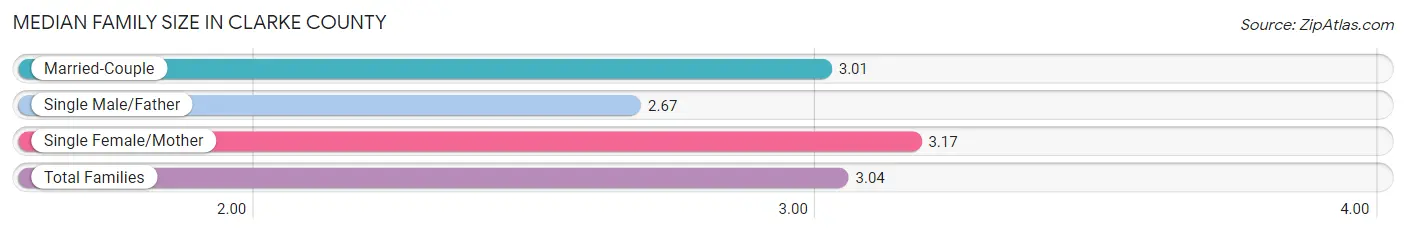
| Family Type | # Families | Family Size |
| Married-Couple | 2,964 (67.4%) | 3.01 |
| Single Male/Father | 230 (5.2%) | 2.67 |
| Single Female/Mother | 1,205 (27.4%) | 3.17 |
| Total Families | 4,399 (100.0%) | 3.04 |
Median Household Size in Clarke County
The median household size in Clarke County is 2.53 persons per household, with single male/father households (230 | 3.8%) accounting for the largest median household size of 3.45 persons per household. non-family households (1,718 | 28.1%) represent the smallest median household size with 1.08 persons per household.
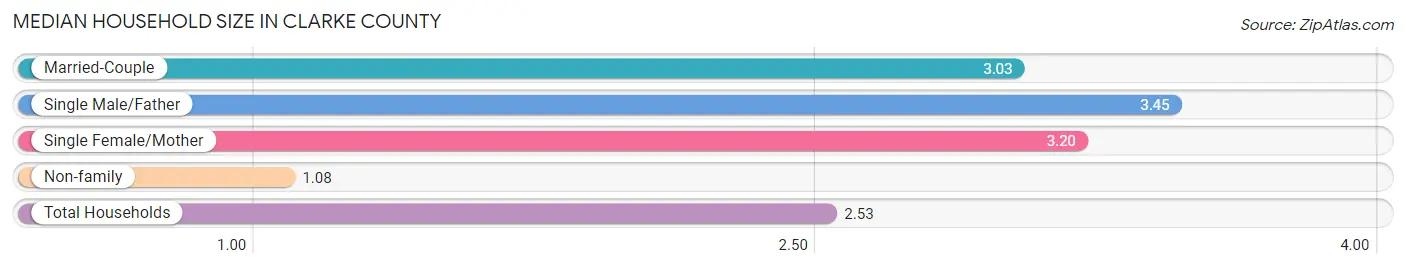
| Household Type | # Households | Household Size |
| Married-Couple | 2,964 (48.5%) | 3.03 |
| Single Male/Father | 230 (3.8%) | 3.45 |
| Single Female/Mother | 1,205 (19.7%) | 3.20 |
| Non-family | 1,718 (28.1%) | 1.08 |
| Total Households | 6,117 (100.0%) | 2.53 |
Household Size by Marriage Status in Clarke County
Out of a total of 6,117 households in Clarke County, 4,399 (71.9%) are family households, while 1,718 (28.1%) are nonfamily households. The most numerous type of family households are 2-person households, comprising 2,211, and the most common type of nonfamily households are 1-person households, comprising 1,624.
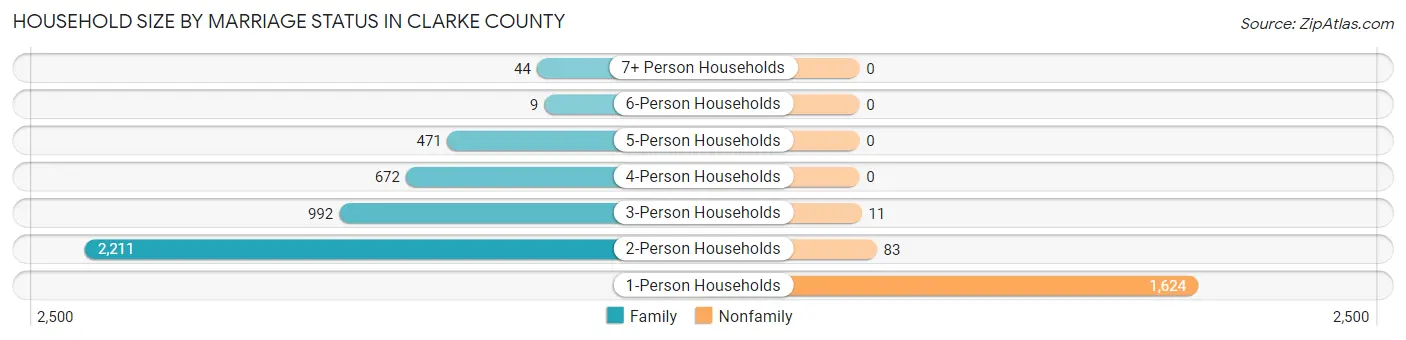
| Household Size | Family Households | Nonfamily Households |
| 1-Person Households | - | 1,624 (26.6%) |
| 2-Person Households | 2,211 (36.1%) | 83 (1.4%) |
| 3-Person Households | 992 (16.2%) | 11 (0.2%) |
| 4-Person Households | 672 (11.0%) | 0 (0.0%) |
| 5-Person Households | 471 (7.7%) | 0 (0.0%) |
| 6-Person Households | 9 (0.2%) | 0 (0.0%) |
| 7+ Person Households | 44 (0.7%) | 0 (0.0%) |
| Total | 4,399 (71.9%) | 1,718 (28.1%) |
Female Fertility in Clarke County
Fertility by Age in Clarke County
Average fertility rate in Clarke County is 26.0 births per 1,000 women. Women in the age bracket of 20 to 34 years have the highest fertility rate with 56.0 births per 1,000 women. Women in the age bracket of 20 to 34 years acount for 88.8% of all women with births.
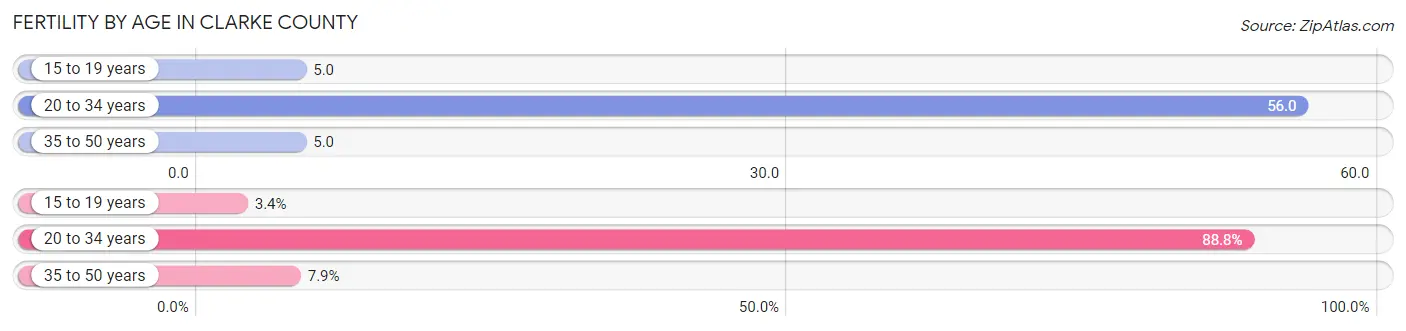
| Age Bracket | Women with Births | Births / 1,000 Women |
| 15 to 19 years | 3 (3.4%) | 5.0 |
| 20 to 34 years | 79 (88.8%) | 56.0 |
| 35 to 50 years | 7 (7.9%) | 5.0 |
| Total | 89 (100.0%) | 26.0 |
Fertility by Age by Marriage Status in Clarke County
62.9% of women with births (89) in Clarke County are married. The highest percentage of unmarried women with births falls into 15 to 19 years age bracket with 100.0% of them unmarried at the time of birth, while the lowest percentage of unmarried women with births belong to 20 to 34 years age bracket with 29.1% of them unmarried.
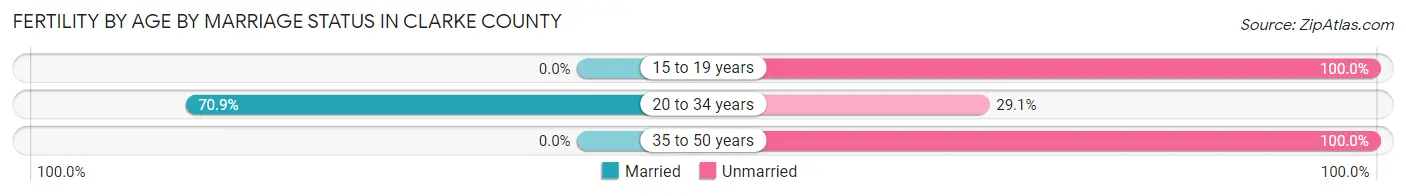
| Age Bracket | Married | Unmarried |
| 15 to 19 years | 0 (0.0%) | 3 (100.0%) |
| 20 to 34 years | 56 (70.9%) | 23 (29.1%) |
| 35 to 50 years | 0 (0.0%) | 7 (100.0%) |
| Total | 56 (62.9%) | 33 (37.1%) |
Fertility by Education in Clarke County
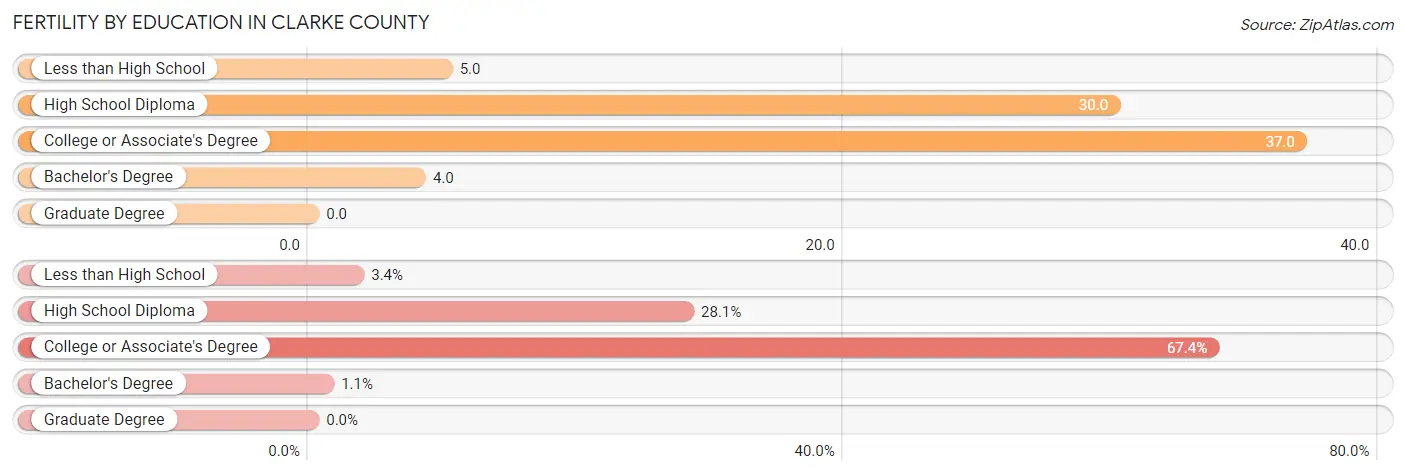
| Educational Attainment | Women with Births | Births / 1,000 Women |
| Less than High School | 3 (3.4%) | 5.0 |
| High School Diploma | 25 (28.1%) | 30.0 |
| College or Associate's Degree | 60 (67.4%) | 37.0 |
| Bachelor's Degree | 1 (1.1%) | 4.0 |
| Graduate Degree | 0 (0.0%) | 0.0 |
| Total | 89 (100.0%) | 26.0 |
Fertility by Education by Marriage Status in Clarke County
37.1% of women with births in Clarke County are unmarried. Women with the educational attainment of bachelor's degree are most likely to be married with 100.0% of them married at childbirth, while women with the educational attainment of less than high school are least likely to be married with 100.0% of them unmarried at childbirth.
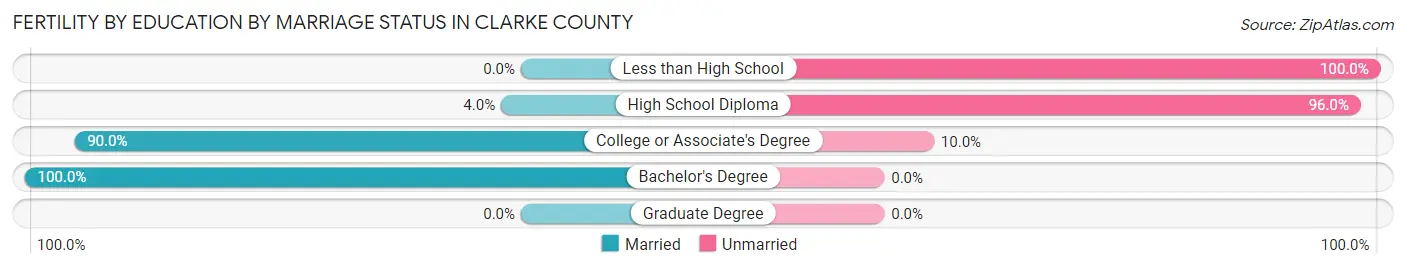
| Educational Attainment | Married | Unmarried |
| Less than High School | 0 (0.0%) | 3 (100.0%) |
| High School Diploma | 1 (4.0%) | 24 (96.0%) |
| College or Associate's Degree | 54 (90.0%) | 6 (10.0%) |
| Bachelor's Degree | 1 (100.0%) | 0 (0.0%) |
| Graduate Degree | 0 (0.0%) | 0 (0.0%) |
| Total | 56 (62.9%) | 33 (37.1%) |
Employment Characteristics in Clarke County
Employment by Class of Employer in Clarke County
Among the 5,980 employed individuals in Clarke County, private company employees (3,972 | 66.4%), self-employed (not incorporated) (505 | 8.4%), and not-for-profit organizations (505 | 8.4%) make up the most common classes of employment.
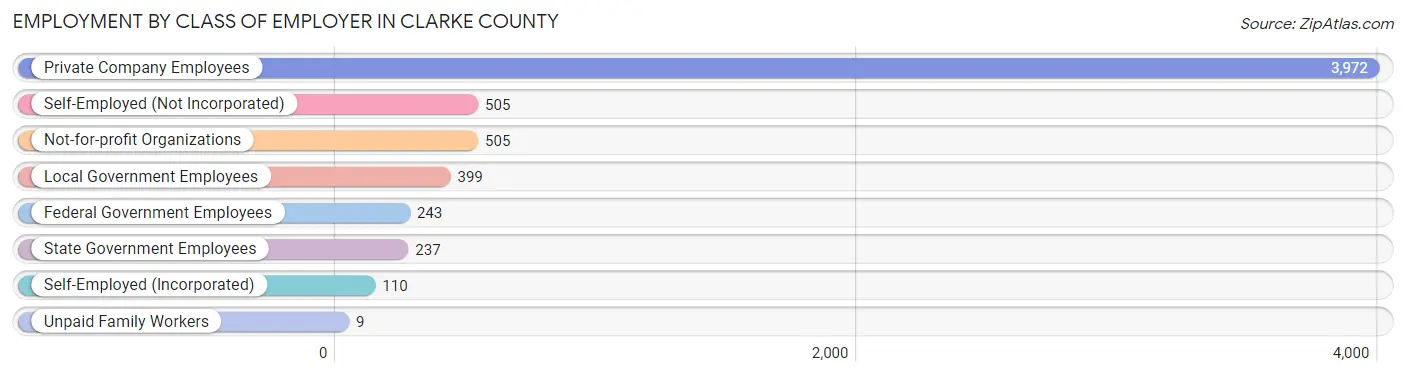
| Employer Class | # Employees | % Employees |
| Private Company Employees | 3,972 | 66.4% |
| Self-Employed (Incorporated) | 110 | 1.8% |
| Self-Employed (Not Incorporated) | 505 | 8.4% |
| Not-for-profit Organizations | 505 | 8.4% |
| Local Government Employees | 399 | 6.7% |
| State Government Employees | 237 | 4.0% |
| Federal Government Employees | 243 | 4.1% |
| Unpaid Family Workers | 9 | 0.2% |
| Total | 5,980 | 100.0% |
Employment Status by Age in Clarke County
According to the labor force statistics for Clarke County, out of the total population over 16 years of age (12,518), 53.4% or 6,685 individuals are in the labor force, with 5.6% or 374 of them unemployed. The age group with the highest labor force participation rate is 30 to 34 years, with 89.8% or 936 individuals in the labor force. Within the labor force, the 35 to 44 years age range has the highest percentage of unemployed individuals, with 16.3% or 189 of them being unemployed.
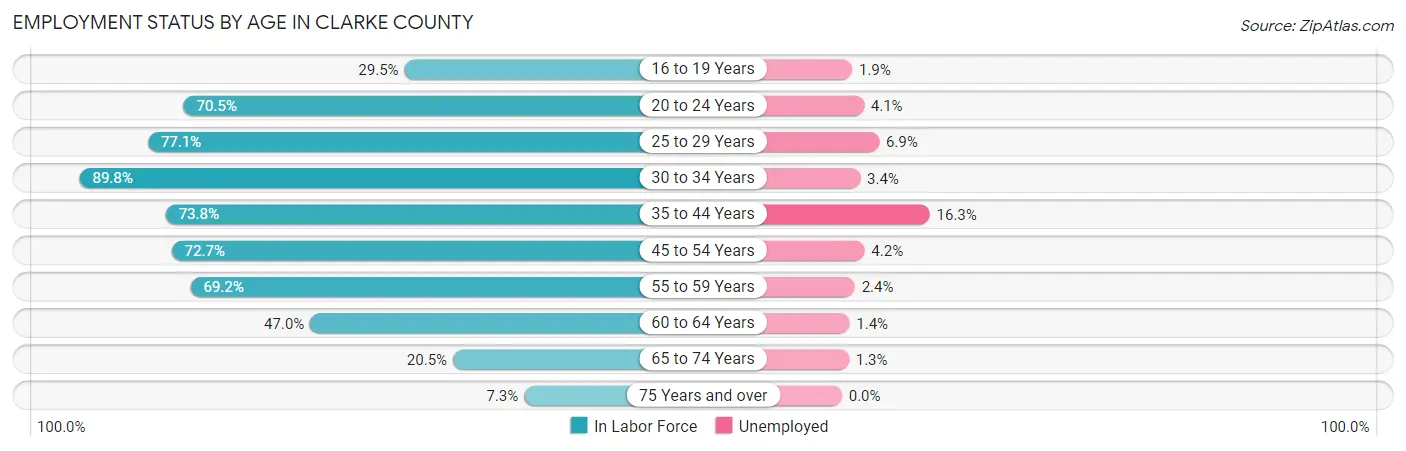
| Age Bracket | In Labor Force | Unemployed |
| 16 to 19 Years | 263 (29.5%) | 5 (1.9%) |
| 20 to 24 Years | 613 (70.5%) | 25 (4.1%) |
| 25 to 29 Years | 614 (77.1%) | 42 (6.9%) |
| 30 to 34 Years | 936 (89.8%) | 32 (3.4%) |
| 35 to 44 Years | 1,160 (73.8%) | 189 (16.3%) |
| 45 to 54 Years | 1,346 (72.7%) | 57 (4.2%) |
| 55 to 59 Years | 639 (69.2%) | 15 (2.4%) |
| 60 to 64 Years | 635 (47.0%) | 9 (1.4%) |
| 65 to 74 Years | 387 (20.5%) | 5 (1.3%) |
| 75 Years and over | 97 (7.3%) | 0 (0.0%) |
| Total | 6,685 (53.4%) | 374 (5.6%) |
Employment Status by Educational Attainment in Clarke County
According to labor force statistics for Clarke County, 70.7% of individuals (5,329) out of the total population between 25 and 64 years of age (7,537) are in the labor force, with 6.4% or 341 of them being unemployed. The group with the highest labor force participation rate are those with the educational attainment of bachelor's degree or higher, with 88.1% or 740 individuals in the labor force. Within the labor force, individuals with less than high school education have the highest percentage of unemployment, with 10.1% or 54 of them being unemployed.
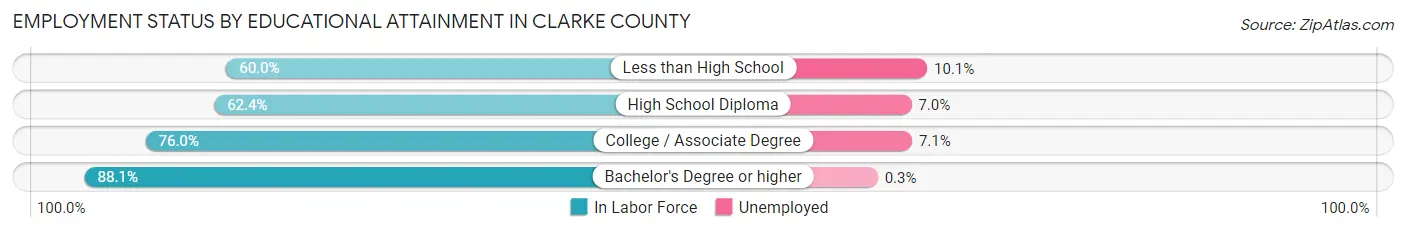
| Educational Attainment | In Labor Force | Unemployed |
| Less than High School | 536 (60.0%) | 90 (10.1%) |
| High School Diploma | 1,638 (62.4%) | 184 (7.0%) |
| College / Associate Degree | 2,415 (76.0%) | 226 (7.1%) |
| Bachelor's Degree or higher | 740 (88.1%) | 3 (0.3%) |
| Total | 5,329 (70.7%) | 482 (6.4%) |
Employment Occupations by Sex in Clarke County
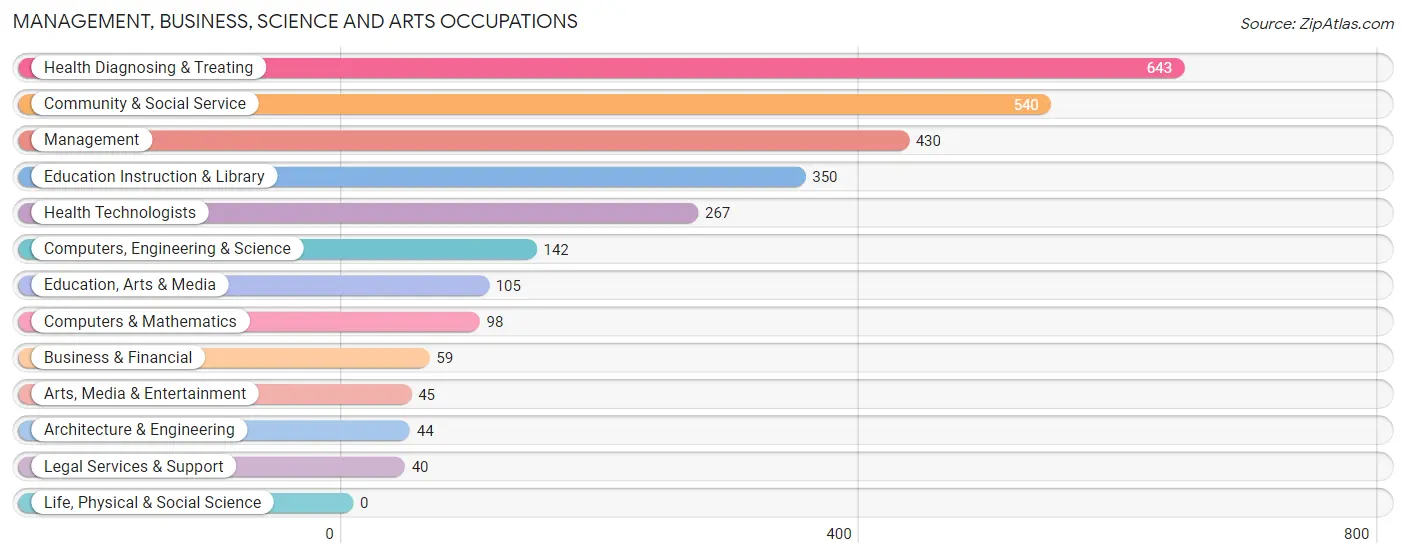
Management, Business, Science and Arts Occupations
The most common Management, Business, Science and Arts occupations in Clarke County are Health Diagnosing & Treating (643 | 10.3%), Community & Social Service (540 | 8.6%), Management (430 | 6.9%), Education Instruction & Library (350 | 5.6%), and Health Technologists (267 | 4.3%).
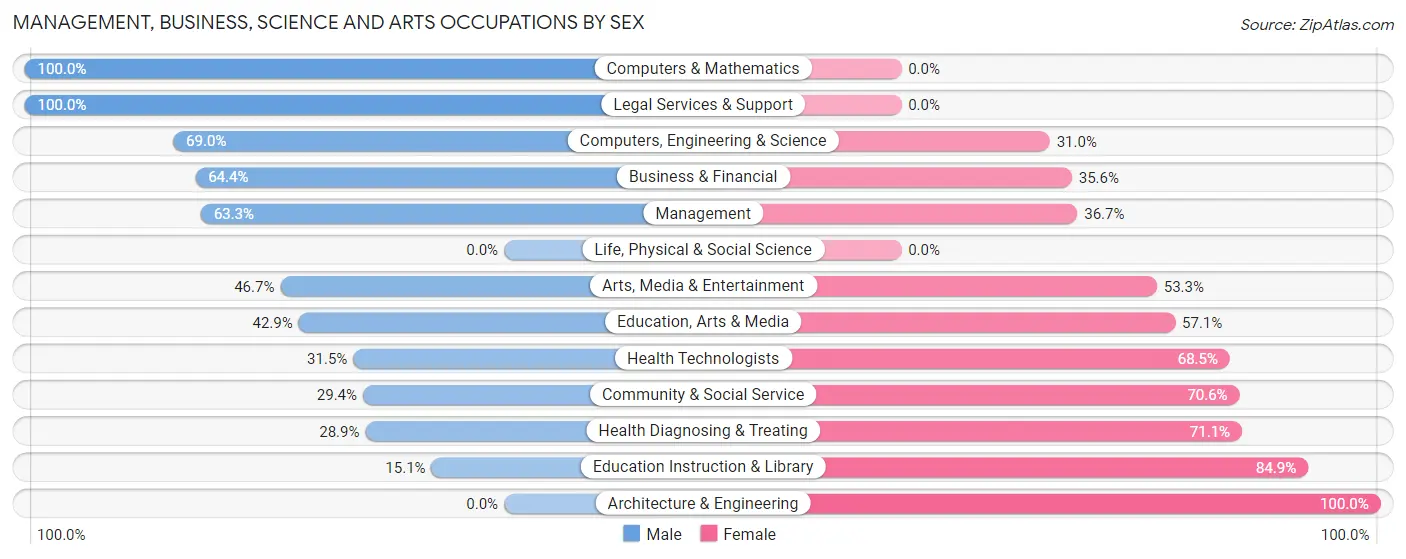
Management, Business, Science and Arts Occupations by Sex
Within the Management, Business, Science and Arts occupations in Clarke County, the most male-oriented occupations are Computers & Mathematics (100.0%), Legal Services & Support (100.0%), and Computers, Engineering & Science (69.0%), while the most female-oriented occupations are Architecture & Engineering (100.0%), Education Instruction & Library (84.9%), and Health Diagnosing & Treating (71.1%).
| Occupation | Male | Female |
| Management | 272 (63.3%) | 158 (36.7%) |
| Business & Financial | 38 (64.4%) | 21 (35.6%) |
| Computers, Engineering & Science | 98 (69.0%) | 44 (31.0%) |
| Computers & Mathematics | 98 (100.0%) | 0 (0.0%) |
| Architecture & Engineering | 0 (0.0%) | 44 (100.0%) |
| Life, Physical & Social Science | 0 (0.0%) | 0 (0.0%) |
| Community & Social Service | 159 (29.4%) | 381 (70.6%) |
| Education, Arts & Media | 45 (42.9%) | 60 (57.1%) |
| Legal Services & Support | 40 (100.0%) | 0 (0.0%) |
| Education Instruction & Library | 53 (15.1%) | 297 (84.9%) |
| Arts, Media & Entertainment | 21 (46.7%) | 24 (53.3%) |
| Health Diagnosing & Treating | 186 (28.9%) | 457 (71.1%) |
| Health Technologists | 84 (31.5%) | 183 (68.5%) |
| Total (Category) | 753 (41.5%) | 1,061 (58.5%) |
| Total (Overall) | 3,250 (51.9%) | 3,008 (48.1%) |
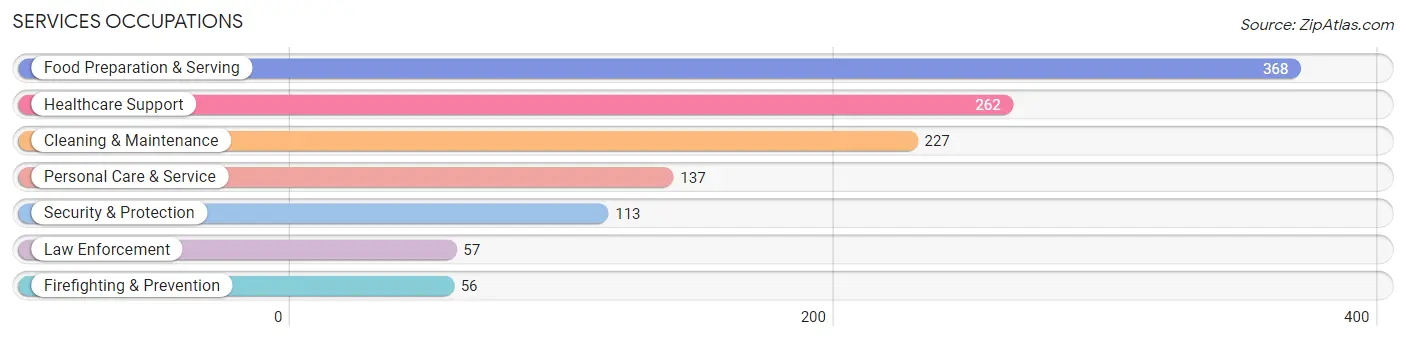
Services Occupations
The most common Services occupations in Clarke County are Food Preparation & Serving (368 | 5.9%), Healthcare Support (262 | 4.2%), Cleaning & Maintenance (227 | 3.6%), Personal Care & Service (137 | 2.2%), and Security & Protection (113 | 1.8%).
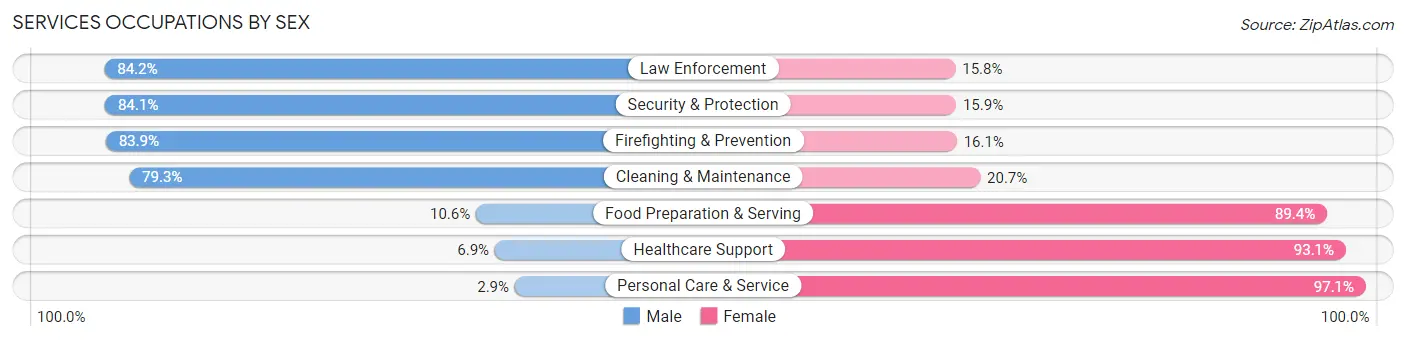
Services Occupations by Sex
Within the Services occupations in Clarke County, the most male-oriented occupations are Law Enforcement (84.2%), Security & Protection (84.1%), and Firefighting & Prevention (83.9%), while the most female-oriented occupations are Personal Care & Service (97.1%), Healthcare Support (93.1%), and Food Preparation & Serving (89.4%).
| Occupation | Male | Female |
| Healthcare Support | 18 (6.9%) | 244 (93.1%) |
| Security & Protection | 95 (84.1%) | 18 (15.9%) |
| Firefighting & Prevention | 47 (83.9%) | 9 (16.1%) |
| Law Enforcement | 48 (84.2%) | 9 (15.8%) |
| Food Preparation & Serving | 39 (10.6%) | 329 (89.4%) |
| Cleaning & Maintenance | 180 (79.3%) | 47 (20.7%) |
| Personal Care & Service | 4 (2.9%) | 133 (97.1%) |
| Total (Category) | 336 (30.3%) | 771 (69.7%) |
| Total (Overall) | 3,250 (51.9%) | 3,008 (48.1%) |
Sales and Office Occupations
The most common Sales and Office occupations in Clarke County are Sales & Related (626 | 10.0%), and Office & Administration (613 | 9.8%).
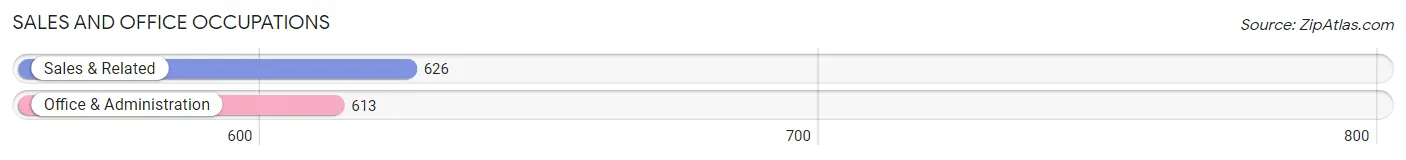
Sales and Office Occupations by Sex
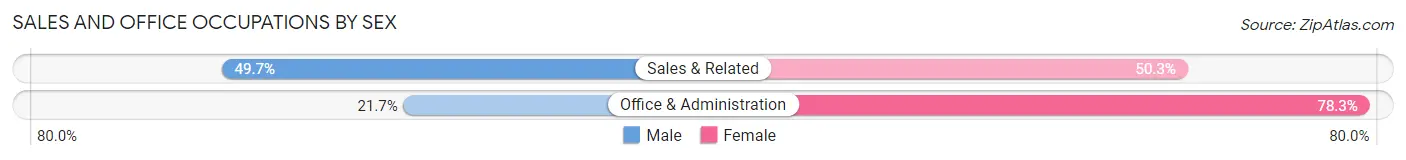
| Occupation | Male | Female |
| Sales & Related | 311 (49.7%) | 315 (50.3%) |
| Office & Administration | 133 (21.7%) | 480 (78.3%) |
| Total (Category) | 444 (35.8%) | 795 (64.2%) |
| Total (Overall) | 3,250 (51.9%) | 3,008 (48.1%) |
Natural Resources, Construction and Maintenance Occupations
The most common Natural Resources, Construction and Maintenance occupations in Clarke County are Construction & Extraction (353 | 5.6%), Installation, Maintenance & Repair (343 | 5.5%), and Farming, Fishing & Forestry (82 | 1.3%).
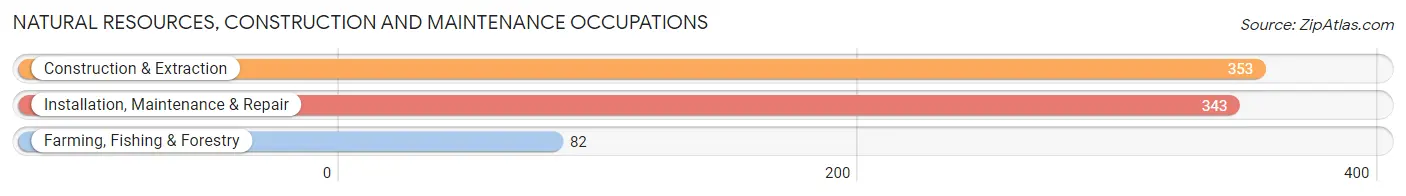
Natural Resources, Construction and Maintenance Occupations by Sex
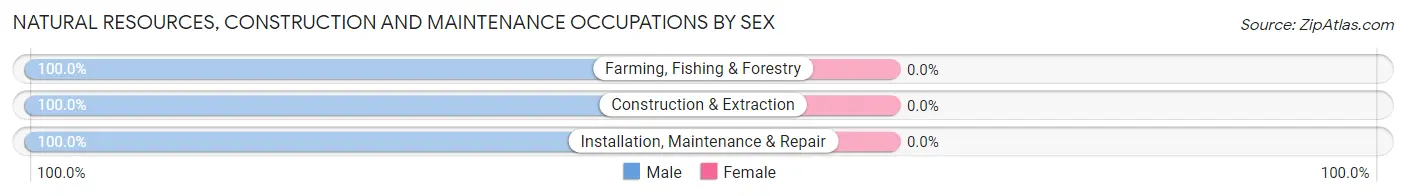
| Occupation | Male | Female |
| Farming, Fishing & Forestry | 82 (100.0%) | 0 (0.0%) |
| Construction & Extraction | 353 (100.0%) | 0 (0.0%) |
| Installation, Maintenance & Repair | 343 (100.0%) | 0 (0.0%) |
| Total (Category) | 778 (100.0%) | 0 (0.0%) |
| Total (Overall) | 3,250 (51.9%) | 3,008 (48.1%) |
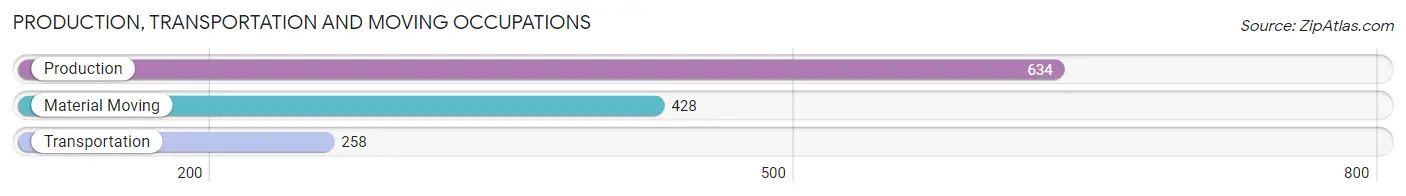
Production, Transportation and Moving Occupations
The most common Production, Transportation and Moving occupations in Clarke County are Production (634 | 10.1%), Material Moving (428 | 6.8%), and Transportation (258 | 4.1%).
Production, Transportation and Moving Occupations by Sex
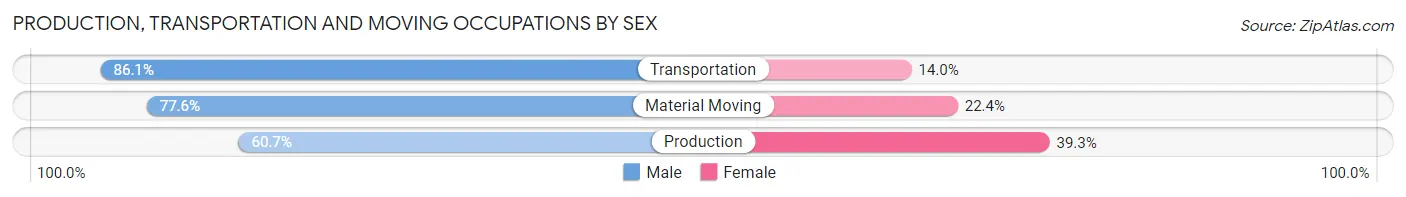
| Occupation | Male | Female |
| Production | 385 (60.7%) | 249 (39.3%) |
| Transportation | 222 (86.1%) | 36 (14.0%) |
| Material Moving | 332 (77.6%) | 96 (22.4%) |
| Total (Category) | 939 (71.1%) | 381 (28.9%) |
| Total (Overall) | 3,250 (51.9%) | 3,008 (48.1%) |
Employment Industries by Sex in Clarke County
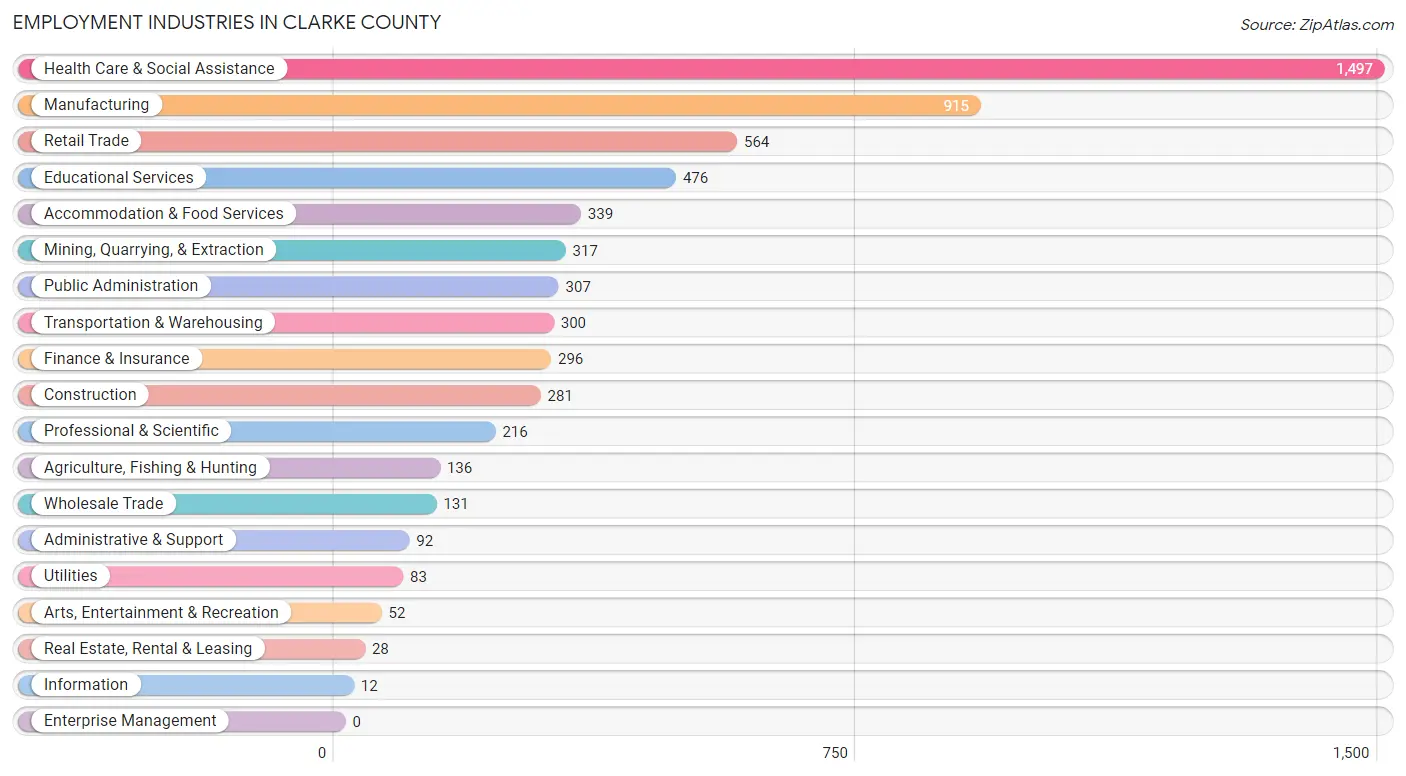
Employment Industries in Clarke County
The major employment industries in Clarke County include Health Care & Social Assistance (1,497 | 23.9%), Manufacturing (915 | 14.6%), Retail Trade (564 | 9.0%), Educational Services (476 | 7.6%), and Accommodation & Food Services (339 | 5.4%).
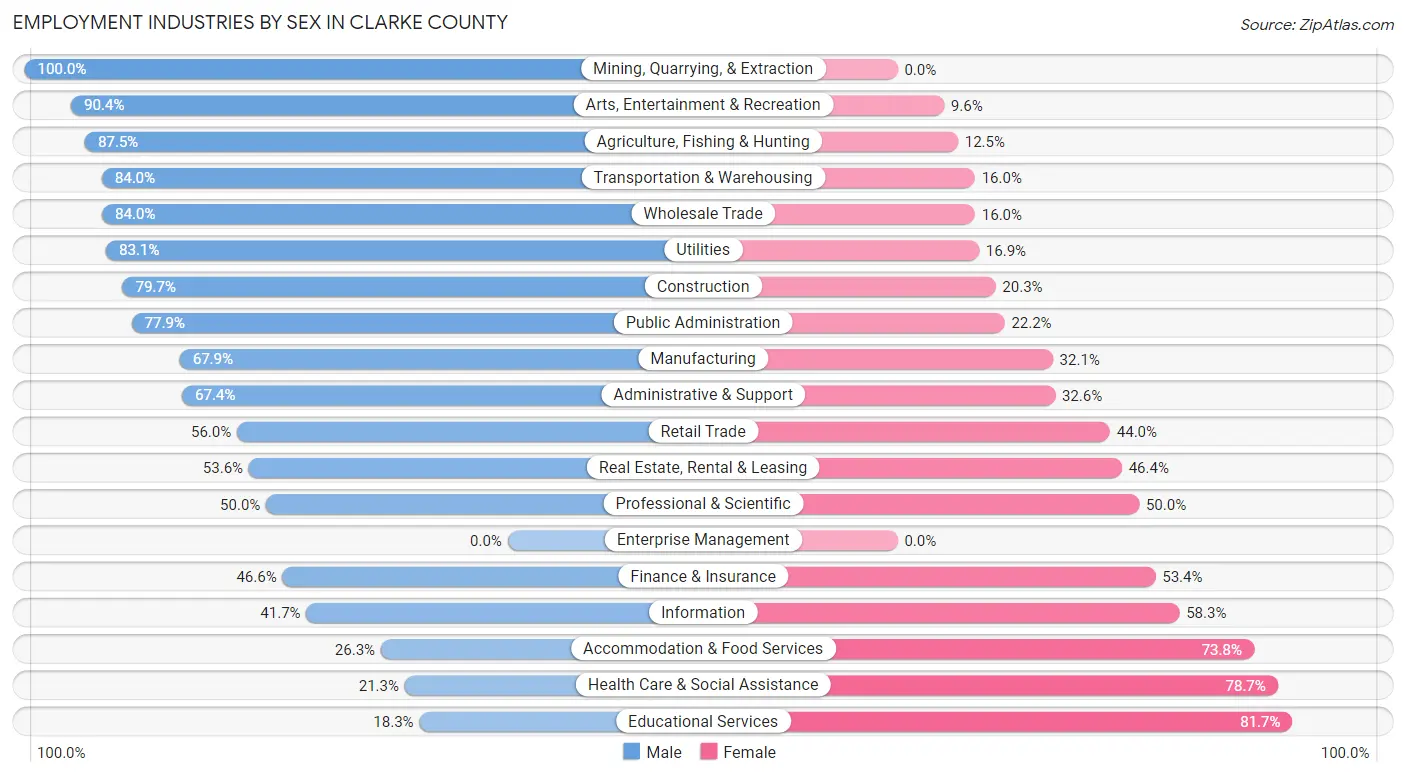
Employment Industries by Sex in Clarke County
The Clarke County industries that see more men than women are Mining, Quarrying, & Extraction (100.0%), Arts, Entertainment & Recreation (90.4%), and Agriculture, Fishing & Hunting (87.5%), whereas the industries that tend to have a higher number of women are Educational Services (81.7%), Health Care & Social Assistance (78.7%), and Accommodation & Food Services (73.8%).
| Industry | Male | Female |
| Agriculture, Fishing & Hunting | 119 (87.5%) | 17 (12.5%) |
| Mining, Quarrying, & Extraction | 317 (100.0%) | 0 (0.0%) |
| Construction | 224 (79.7%) | 57 (20.3%) |
| Manufacturing | 621 (67.9%) | 294 (32.1%) |
| Wholesale Trade | 110 (84.0%) | 21 (16.0%) |
| Retail Trade | 316 (56.0%) | 248 (44.0%) |
| Transportation & Warehousing | 252 (84.0%) | 48 (16.0%) |
| Utilities | 69 (83.1%) | 14 (16.9%) |
| Information | 5 (41.7%) | 7 (58.3%) |
| Finance & Insurance | 138 (46.6%) | 158 (53.4%) |
| Real Estate, Rental & Leasing | 15 (53.6%) | 13 (46.4%) |
| Professional & Scientific | 108 (50.0%) | 108 (50.0%) |
| Enterprise Management | 0 (0.0%) | 0 (0.0%) |
| Administrative & Support | 62 (67.4%) | 30 (32.6%) |
| Educational Services | 87 (18.3%) | 389 (81.7%) |
| Health Care & Social Assistance | 319 (21.3%) | 1,178 (78.7%) |
| Arts, Entertainment & Recreation | 47 (90.4%) | 5 (9.6%) |
| Accommodation & Food Services | 89 (26.3%) | 250 (73.8%) |
| Public Administration | 239 (77.8%) | 68 (22.2%) |
| Total | 3,250 (51.9%) | 3,008 (48.1%) |
Education in Clarke County
School Enrollment in Clarke County
The most common levels of schooling among the 3,513 students in Clarke County are middle school (1,068 | 30.4%), high school (898 | 25.6%), and elementary school (538 | 15.3%).
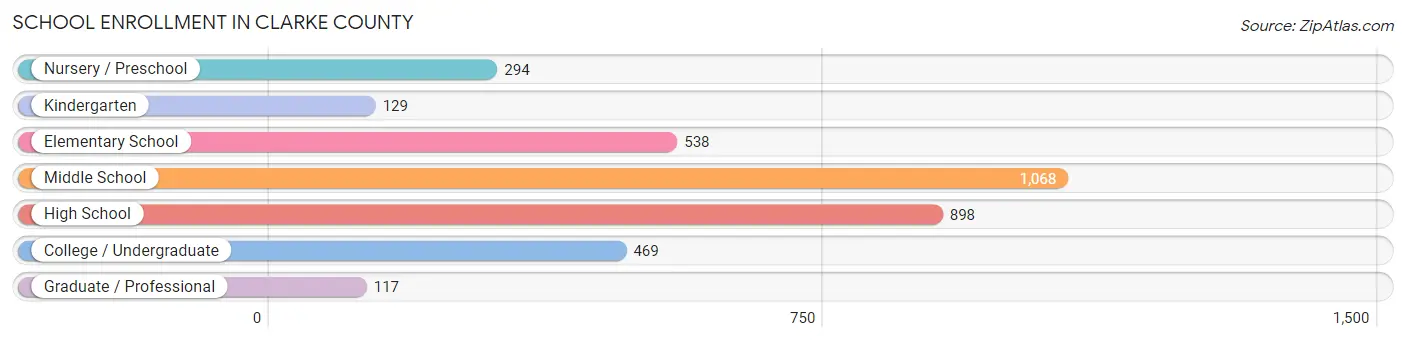
| School Level | # Students | % Students |
| Nursery / Preschool | 294 | 8.4% |
| Kindergarten | 129 | 3.7% |
| Elementary School | 538 | 15.3% |
| Middle School | 1,068 | 30.4% |
| High School | 898 | 25.6% |
| College / Undergraduate | 469 | 13.4% |
| Graduate / Professional | 117 | 3.3% |
| Total | 3,513 | 100.0% |
School Enrollment by Age by Funding Source in Clarke County
Out of a total of 3,513 students who are enrolled in schools in Clarke County, 471 (13.4%) attend a private institution, while the remaining 3,042 (86.6%) are enrolled in public schools. The age group of 20 to 24 year olds has the highest likelihood of being enrolled in private schools, with 70 (23.8% in the age bracket) enrolled. Conversely, the age group of 3 to 4 year olds has the lowest likelihood of being enrolled in a private school, with 254 (100.0% in the age bracket) attending a public institution.
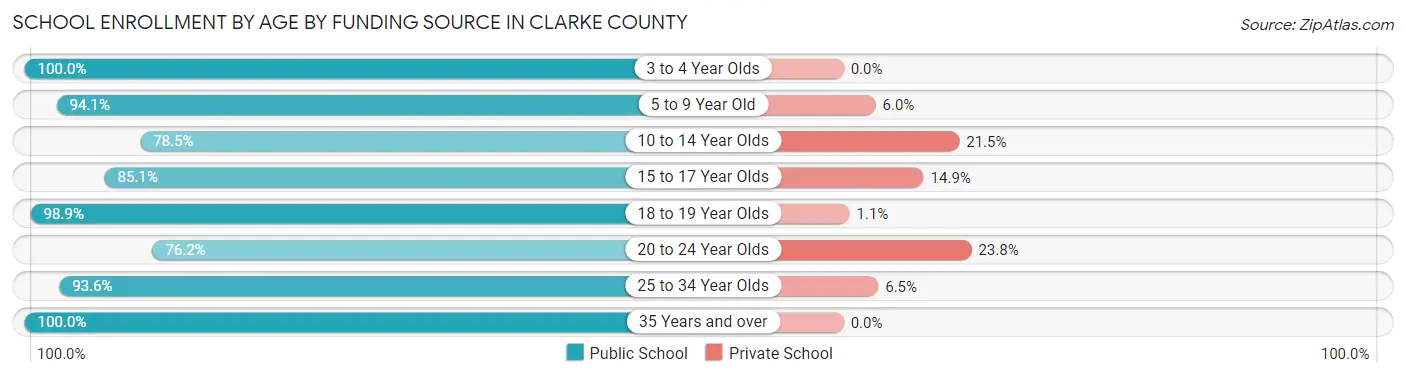
| Age Bracket | Public School | Private School |
| 3 to 4 Year Olds | 254 (100.0%) | 0 (0.0%) |
| 5 to 9 Year Old | 616 (94.1%) | 39 (5.9%) |
| 10 to 14 Year Olds | 969 (78.5%) | 266 (21.5%) |
| 15 to 17 Year Olds | 491 (85.1%) | 86 (14.9%) |
| 18 to 19 Year Olds | 270 (98.9%) | 3 (1.1%) |
| 20 to 24 Year Olds | 224 (76.2%) | 70 (23.8%) |
| 25 to 34 Year Olds | 116 (93.5%) | 8 (6.5%) |
| 35 Years and over | 101 (100.0%) | 0 (0.0%) |
| Total | 3,042 (86.6%) | 471 (13.4%) |
Educational Attainment by Field of Study in Clarke County
Education (375 | 26.8%), business (280 | 20.0%), science & technology (134 | 9.6%), arts & humanities (126 | 9.0%), and bio, nature & agricultural (113 | 8.1%) are the most common fields of study among 1,397 individuals in Clarke County who have obtained a bachelor's degree or higher.
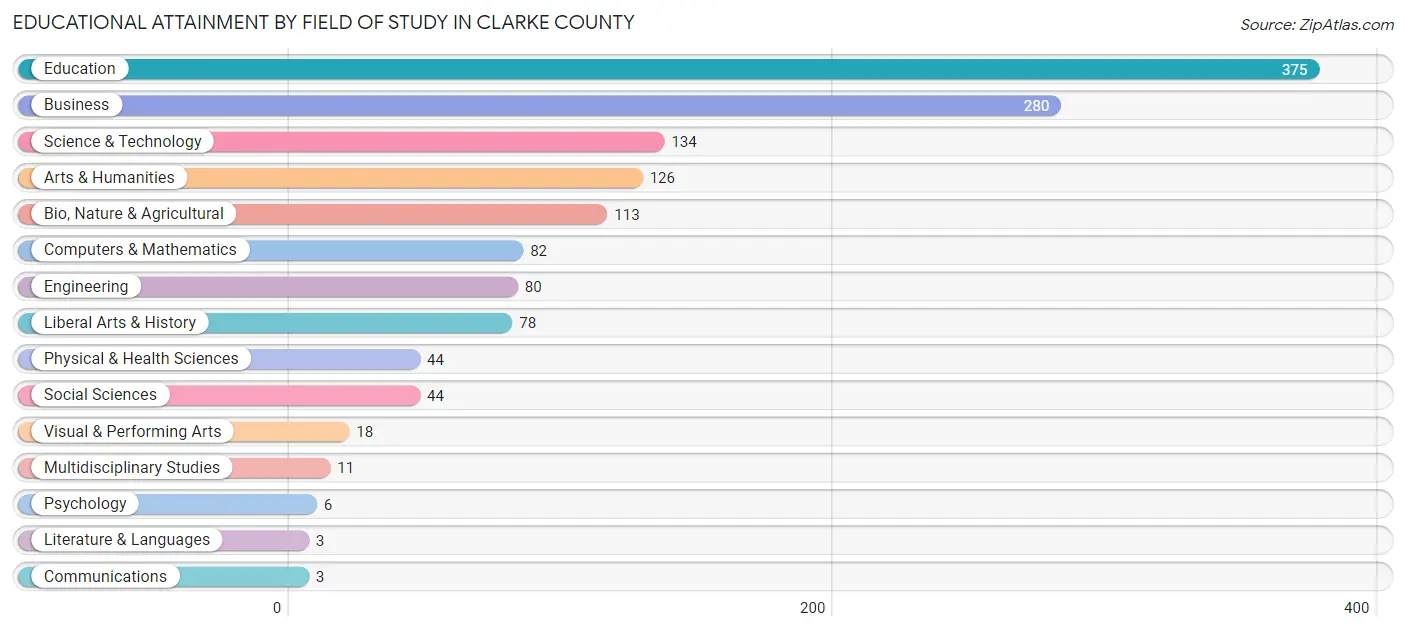
| Field of Study | # Graduates | % Graduates |
| Computers & Mathematics | 82 | 5.9% |
| Bio, Nature & Agricultural | 113 | 8.1% |
| Physical & Health Sciences | 44 | 3.2% |
| Psychology | 6 | 0.4% |
| Social Sciences | 44 | 3.2% |
| Engineering | 80 | 5.7% |
| Multidisciplinary Studies | 11 | 0.8% |
| Science & Technology | 134 | 9.6% |
| Business | 280 | 20.0% |
| Education | 375 | 26.8% |
| Literature & Languages | 3 | 0.2% |
| Liberal Arts & History | 78 | 5.6% |
| Visual & Performing Arts | 18 | 1.3% |
| Communications | 3 | 0.2% |
| Arts & Humanities | 126 | 9.0% |
| Total | 1,397 | 100.0% |
Transportation & Commute in Clarke County
Vehicle Availability by Sex in Clarke County
The most prevalent vehicle ownership categories in Clarke County are males with 2 vehicles (1,176, accounting for 38.1%) and females with 2 vehicles (1,095, making up 40.7%).
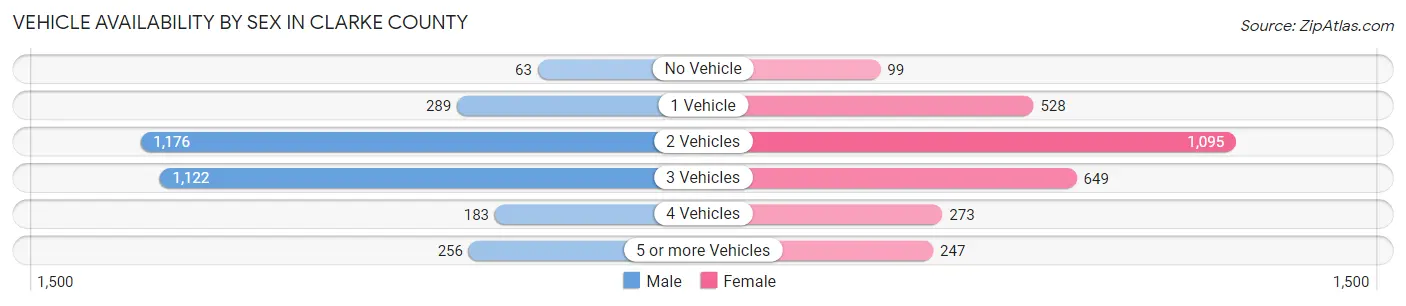
| Vehicles Available | Male | Female |
| No Vehicle | 63 (2.0%) | 99 (3.4%) |
| 1 Vehicle | 289 (9.4%) | 528 (18.3%) |
| 2 Vehicles | 1,176 (38.1%) | 1,095 (37.9%) |
| 3 Vehicles | 1,122 (36.3%) | 649 (22.5%) |
| 4 Vehicles | 183 (5.9%) | 273 (9.4%) |
| 5 or more Vehicles | 256 (8.3%) | 247 (8.5%) |
| Total | 3,089 (100.0%) | 2,891 (100.0%) |
Commute Time in Clarke County
The most frequently occuring commute durations in Clarke County are 30 to 34 minutes (1,061 commuters, 18.1%), 15 to 19 minutes (780 commuters, 13.3%), and 45 to 59 minutes (668 commuters, 11.4%).
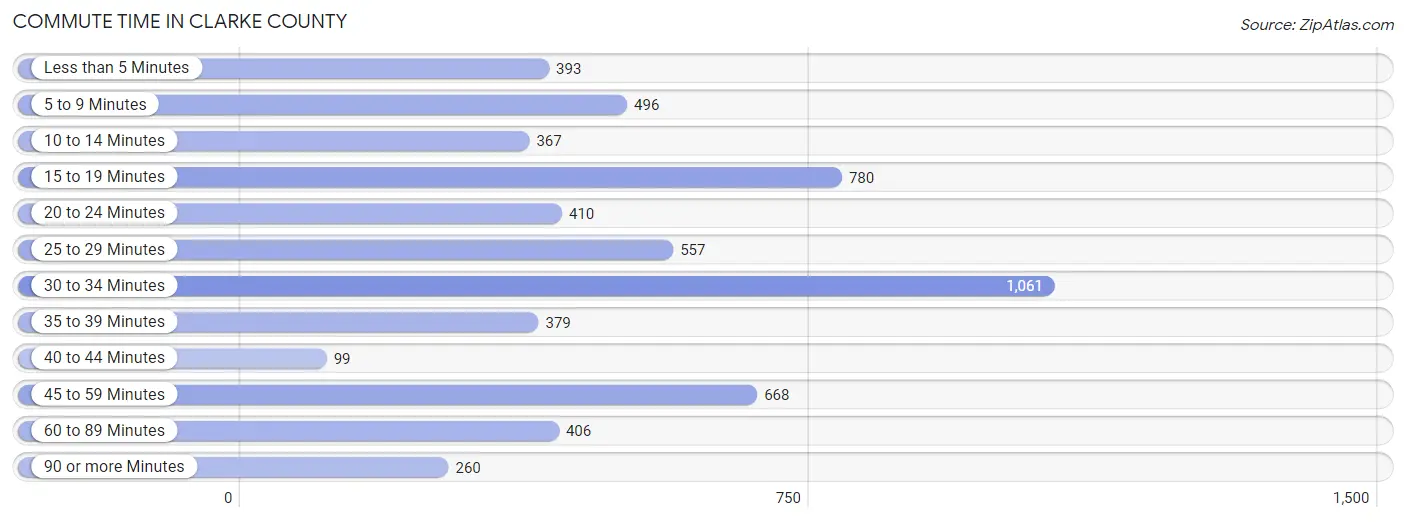
| Commute Time | # Commuters | % Commuters |
| Less than 5 Minutes | 393 | 6.7% |
| 5 to 9 Minutes | 496 | 8.4% |
| 10 to 14 Minutes | 367 | 6.2% |
| 15 to 19 Minutes | 780 | 13.3% |
| 20 to 24 Minutes | 410 | 7.0% |
| 25 to 29 Minutes | 557 | 9.5% |
| 30 to 34 Minutes | 1,061 | 18.1% |
| 35 to 39 Minutes | 379 | 6.5% |
| 40 to 44 Minutes | 99 | 1.7% |
| 45 to 59 Minutes | 668 | 11.4% |
| 60 to 89 Minutes | 406 | 6.9% |
| 90 or more Minutes | 260 | 4.4% |
Commute Time by Sex in Clarke County
The most common commute times in Clarke County are 30 to 34 minutes (594 commuters, 19.4%) for males and 30 to 34 minutes (467 commuters, 16.6%) for females.
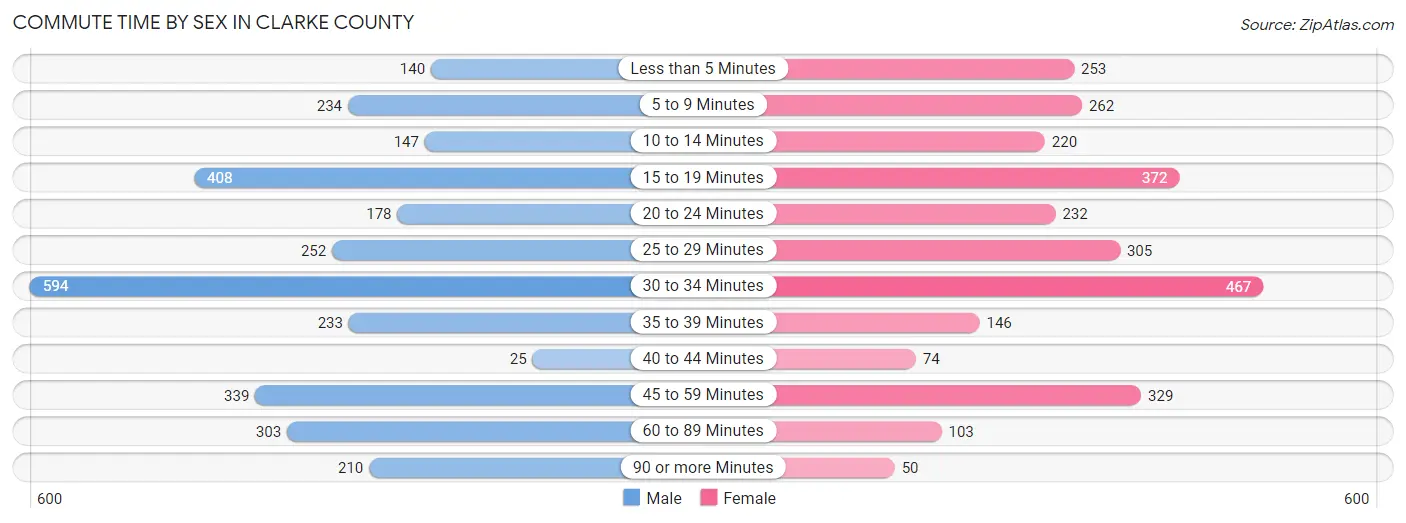
| Commute Time | Male | Female |
| Less than 5 Minutes | 140 (4.6%) | 253 (9.0%) |
| 5 to 9 Minutes | 234 (7.6%) | 262 (9.3%) |
| 10 to 14 Minutes | 147 (4.8%) | 220 (7.8%) |
| 15 to 19 Minutes | 408 (13.3%) | 372 (13.2%) |
| 20 to 24 Minutes | 178 (5.8%) | 232 (8.3%) |
| 25 to 29 Minutes | 252 (8.2%) | 305 (10.8%) |
| 30 to 34 Minutes | 594 (19.4%) | 467 (16.6%) |
| 35 to 39 Minutes | 233 (7.6%) | 146 (5.2%) |
| 40 to 44 Minutes | 25 (0.8%) | 74 (2.6%) |
| 45 to 59 Minutes | 339 (11.1%) | 329 (11.7%) |
| 60 to 89 Minutes | 303 (9.9%) | 103 (3.7%) |
| 90 or more Minutes | 210 (6.9%) | 50 (1.8%) |
Time of Departure to Work by Sex in Clarke County
The most frequent times of departure to work in Clarke County are 12:00 AM to 4:59 AM (457, 14.9%) for males and 7:00 AM to 7:29 AM (690, 24.5%) for females.
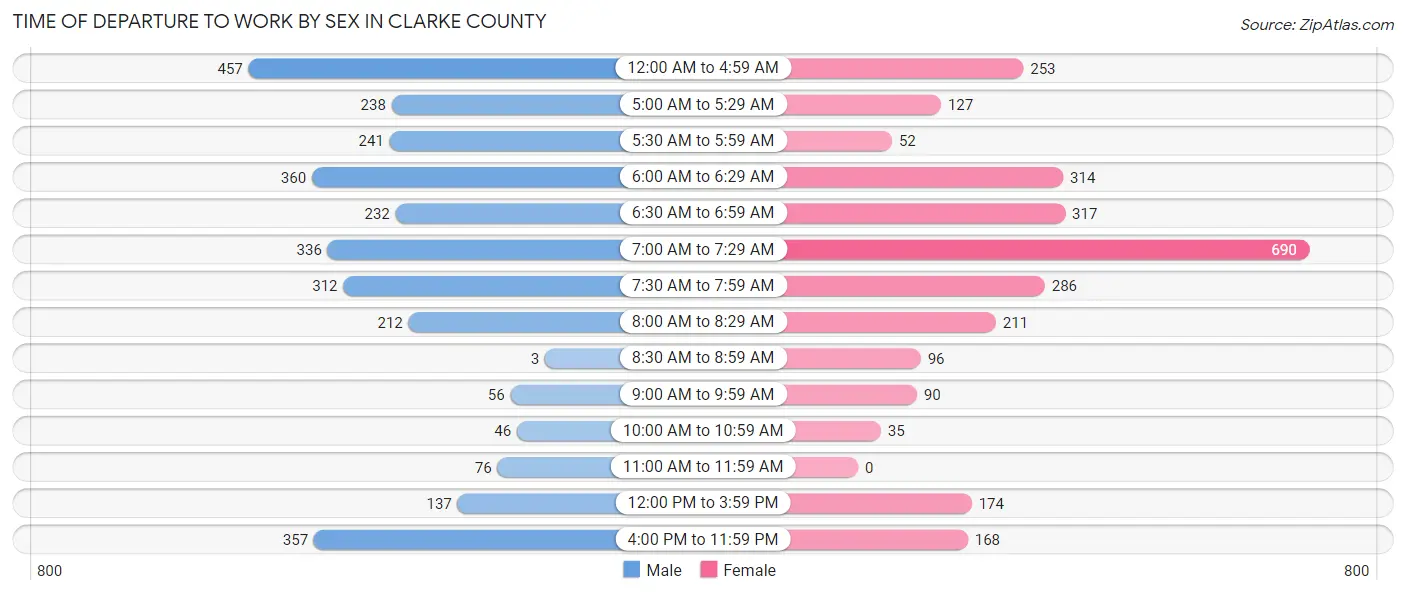
| Time of Departure | Male | Female |
| 12:00 AM to 4:59 AM | 457 (14.9%) | 253 (9.0%) |
| 5:00 AM to 5:29 AM | 238 (7.8%) | 127 (4.5%) |
| 5:30 AM to 5:59 AM | 241 (7.9%) | 52 (1.8%) |
| 6:00 AM to 6:29 AM | 360 (11.7%) | 314 (11.2%) |
| 6:30 AM to 6:59 AM | 232 (7.6%) | 317 (11.3%) |
| 7:00 AM to 7:29 AM | 336 (11.0%) | 690 (24.5%) |
| 7:30 AM to 7:59 AM | 312 (10.2%) | 286 (10.2%) |
| 8:00 AM to 8:29 AM | 212 (6.9%) | 211 (7.5%) |
| 8:30 AM to 8:59 AM | 3 (0.1%) | 96 (3.4%) |
| 9:00 AM to 9:59 AM | 56 (1.8%) | 90 (3.2%) |
| 10:00 AM to 10:59 AM | 46 (1.5%) | 35 (1.2%) |
| 11:00 AM to 11:59 AM | 76 (2.5%) | 0 (0.0%) |
| 12:00 PM to 3:59 PM | 137 (4.5%) | 174 (6.2%) |
| 4:00 PM to 11:59 PM | 357 (11.7%) | 168 (6.0%) |
| Total | 3,063 (100.0%) | 2,813 (100.0%) |
Housing Occupancy in Clarke County
Occupancy by Ownership in Clarke County
Of the total 6,117 dwellings in Clarke County, owner-occupied units account for 5,242 (85.7%), while renter-occupied units make up 875 (14.3%).
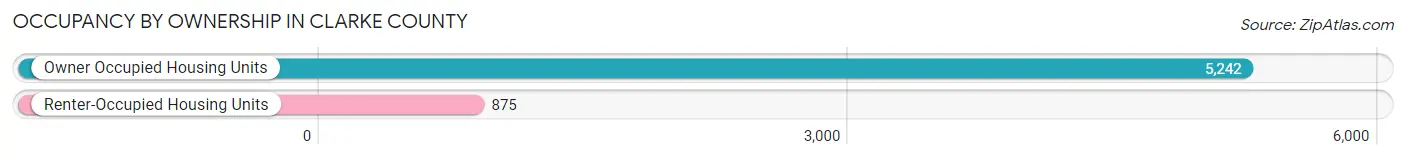
| Occupancy | # Housing Units | % Housing Units |
| Owner Occupied Housing Units | 5,242 | 85.7% |
| Renter-Occupied Housing Units | 875 | 14.3% |
| Total Occupied Housing Units | 6,117 | 100.0% |
Occupancy by Household Size in Clarke County
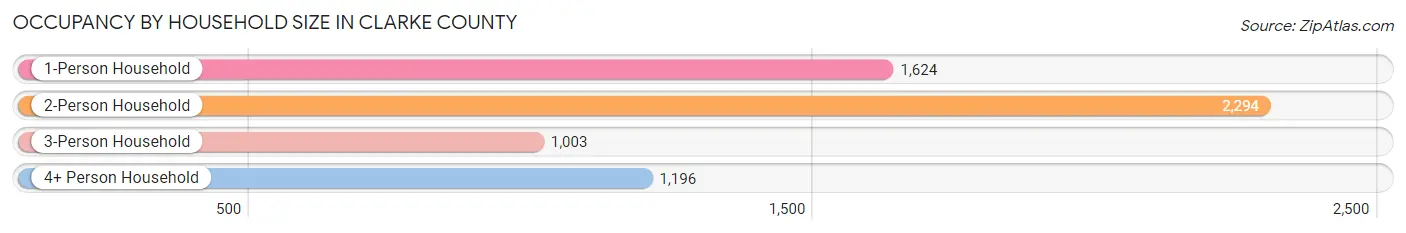
| Household Size | # Housing Units | % Housing Units |
| 1-Person Household | 1,624 | 26.6% |
| 2-Person Household | 2,294 | 37.5% |
| 3-Person Household | 1,003 | 16.4% |
| 4+ Person Household | 1,196 | 19.6% |
| Total Housing Units | 6,117 | 100.0% |
Occupancy by Ownership by Household Size in Clarke County
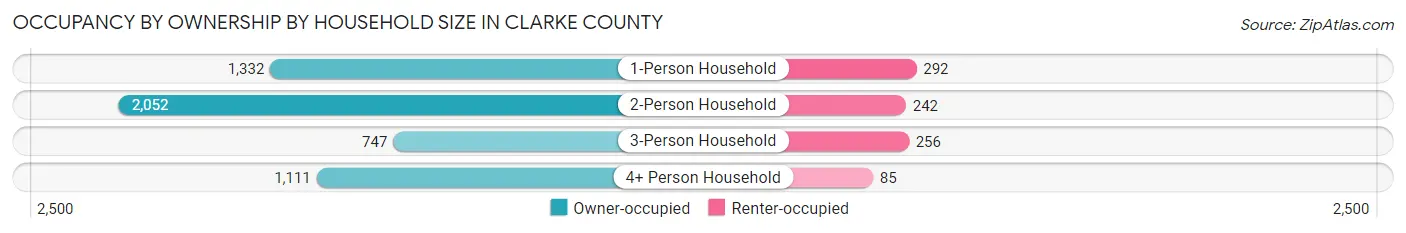
| Household Size | Owner-occupied | Renter-occupied |
| 1-Person Household | 1,332 (82.0%) | 292 (18.0%) |
| 2-Person Household | 2,052 (89.4%) | 242 (10.5%) |
| 3-Person Household | 747 (74.5%) | 256 (25.5%) |
| 4+ Person Household | 1,111 (92.9%) | 85 (7.1%) |
| Total Housing Units | 5,242 (85.7%) | 875 (14.3%) |
Occupancy by Educational Attainment in Clarke County
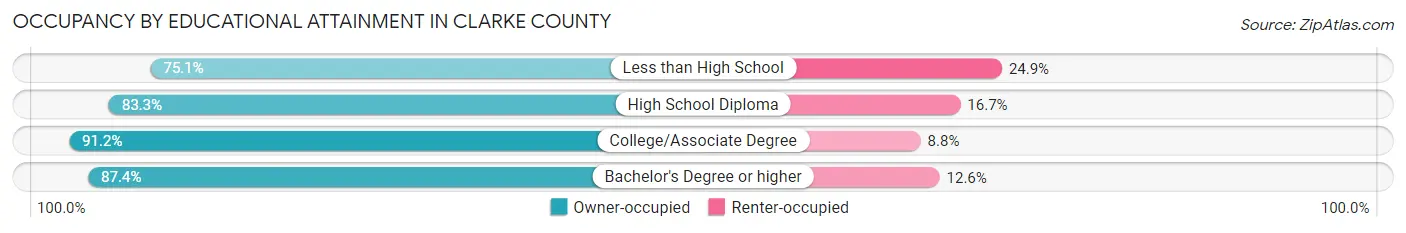
| Household Size | Owner-occupied | Renter-occupied |
| Less than High School | 620 (75.1%) | 206 (24.9%) |
| High School Diploma | 1,766 (83.3%) | 354 (16.7%) |
| College/Associate Degree | 2,036 (91.2%) | 197 (8.8%) |
| Bachelor's Degree or higher | 820 (87.4%) | 118 (12.6%) |
Occupancy by Age of Householder in Clarke County
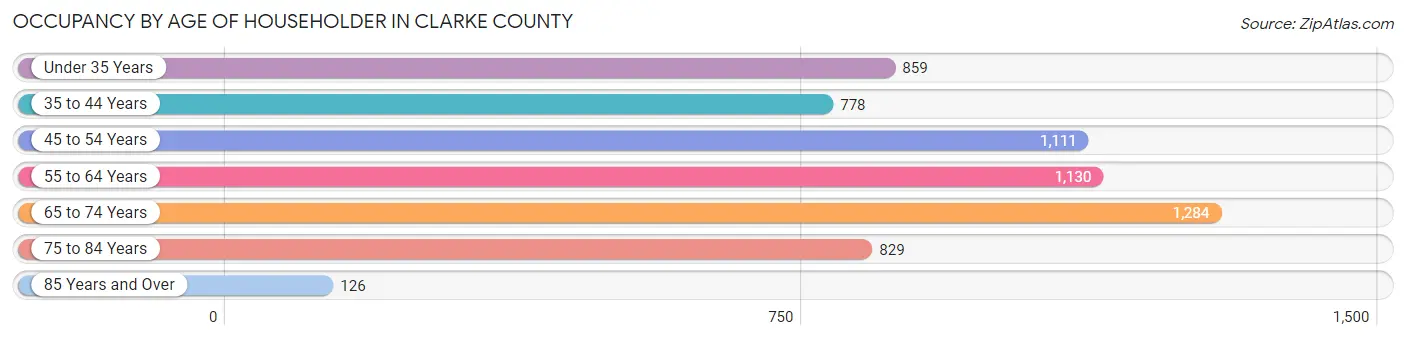
| Age Bracket | # Households | % Households |
| Under 35 Years | 859 | 14.0% |
| 35 to 44 Years | 778 | 12.7% |
| 45 to 54 Years | 1,111 | 18.2% |
| 55 to 64 Years | 1,130 | 18.5% |
| 65 to 74 Years | 1,284 | 21.0% |
| 75 to 84 Years | 829 | 13.6% |
| 85 Years and Over | 126 | 2.1% |
| Total | 6,117 | 100.0% |
Housing Finances in Clarke County
Median Income by Occupancy in Clarke County
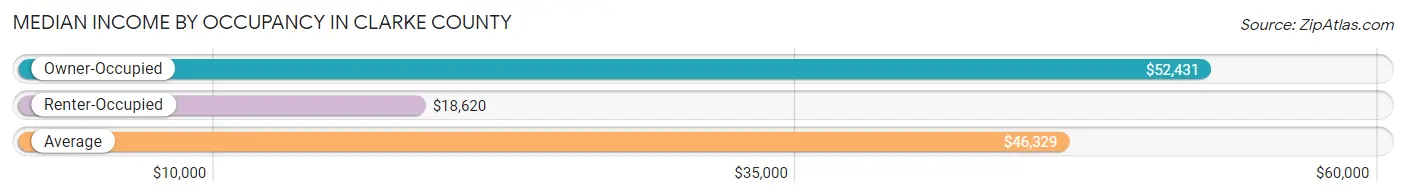
| Occupancy Type | # Households | Median Income |
| Owner-Occupied | 5,242 (85.7%) | $52,431 |
| Renter-Occupied | 875 (14.3%) | $18,620 |
| Average | 6,117 (100.0%) | $46,329 |
Occupancy by Householder Income Bracket in Clarke County
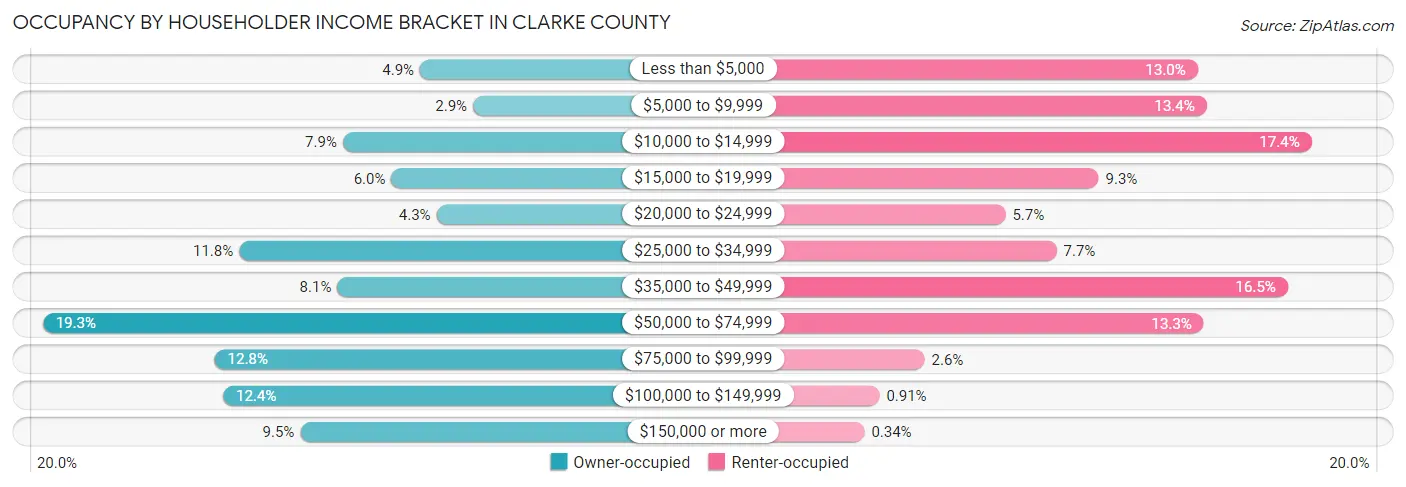
| Income Bracket | Owner-occupied | Renter-occupied |
| Less than $5,000 | 259 (4.9%) | 114 (13.0%) |
| $5,000 to $9,999 | 153 (2.9%) | 117 (13.4%) |
| $10,000 to $14,999 | 413 (7.9%) | 152 (17.4%) |
| $15,000 to $19,999 | 316 (6.0%) | 81 (9.3%) |
| $20,000 to $24,999 | 226 (4.3%) | 50 (5.7%) |
| $25,000 to $34,999 | 620 (11.8%) | 67 (7.7%) |
| $35,000 to $49,999 | 424 (8.1%) | 144 (16.5%) |
| $50,000 to $74,999 | 1,012 (19.3%) | 116 (13.3%) |
| $75,000 to $99,999 | 669 (12.8%) | 23 (2.6%) |
| $100,000 to $149,999 | 652 (12.4%) | 8 (0.9%) |
| $150,000 or more | 498 (9.5%) | 3 (0.3%) |
| Total | 5,242 (100.0%) | 875 (100.0%) |
Monthly Housing Cost Tiers in Clarke County
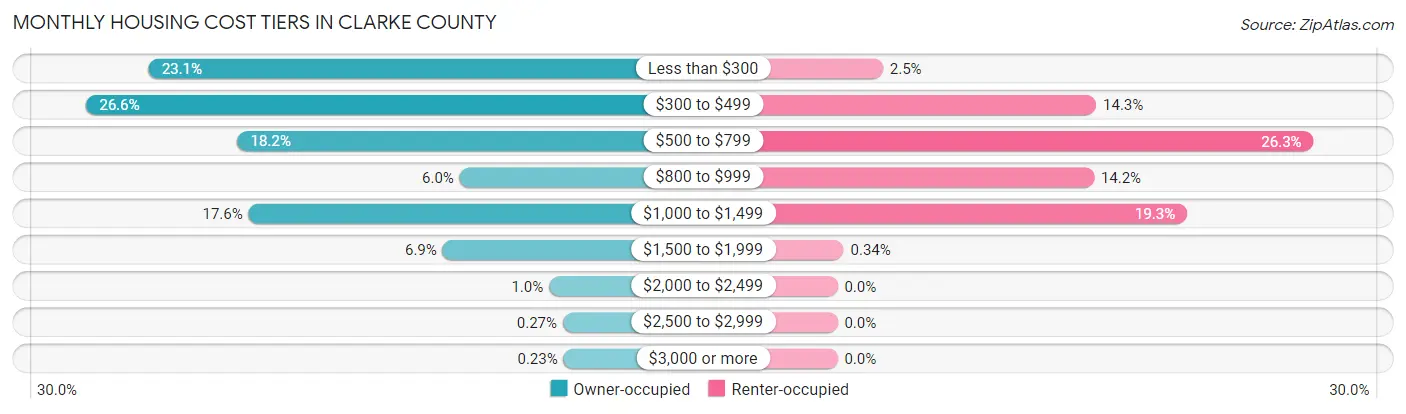
| Monthly Cost | Owner-occupied | Renter-occupied |
| Less than $300 | 1,213 (23.1%) | 22 (2.5%) |
| $300 to $499 | 1,394 (26.6%) | 125 (14.3%) |
| $500 to $799 | 956 (18.2%) | 230 (26.3%) |
| $800 to $999 | 313 (6.0%) | 124 (14.2%) |
| $1,000 to $1,499 | 924 (17.6%) | 169 (19.3%) |
| $1,500 to $1,999 | 362 (6.9%) | 3 (0.3%) |
| $2,000 to $2,499 | 54 (1.0%) | 0 (0.0%) |
| $2,500 to $2,999 | 14 (0.3%) | 0 (0.0%) |
| $3,000 or more | 12 (0.2%) | 0 (0.0%) |
| Total | 5,242 (100.0%) | 875 (100.0%) |
Physical Housing Characteristics in Clarke County
Housing Structures in Clarke County
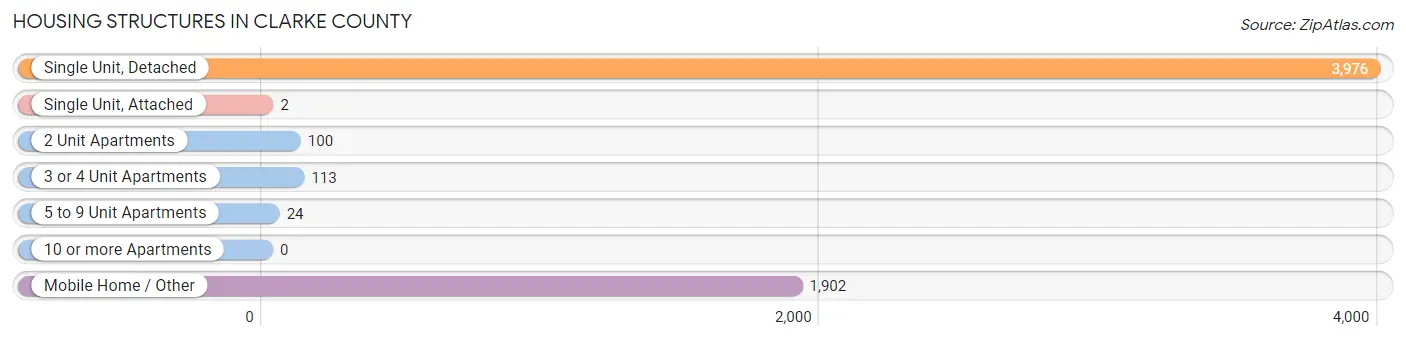
| Structure Type | # Housing Units | % Housing Units |
| Single Unit, Detached | 3,976 | 65.0% |
| Single Unit, Attached | 2 | 0.0% |
| 2 Unit Apartments | 100 | 1.6% |
| 3 or 4 Unit Apartments | 113 | 1.8% |
| 5 to 9 Unit Apartments | 24 | 0.4% |
| 10 or more Apartments | 0 | 0.0% |
| Mobile Home / Other | 1,902 | 31.1% |
| Total | 6,117 | 100.0% |
Housing Structures by Occupancy in Clarke County
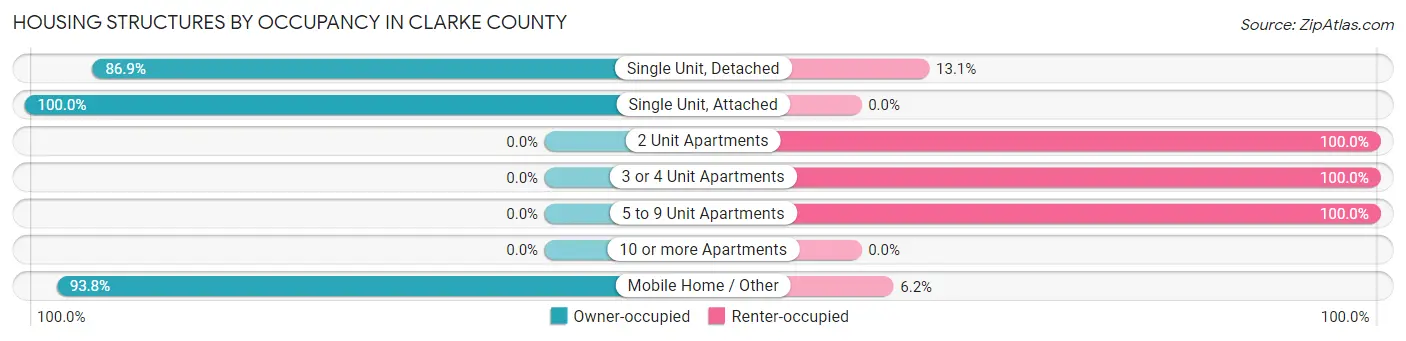
| Structure Type | Owner-occupied | Renter-occupied |
| Single Unit, Detached | 3,456 (86.9%) | 520 (13.1%) |
| Single Unit, Attached | 2 (100.0%) | 0 (0.0%) |
| 2 Unit Apartments | 0 (0.0%) | 100 (100.0%) |
| 3 or 4 Unit Apartments | 0 (0.0%) | 113 (100.0%) |
| 5 to 9 Unit Apartments | 0 (0.0%) | 24 (100.0%) |
| 10 or more Apartments | 0 (0.0%) | 0 (0.0%) |
| Mobile Home / Other | 1,784 (93.8%) | 118 (6.2%) |
| Total | 5,242 (85.7%) | 875 (14.3%) |
Housing Structures by Number of Rooms in Clarke County
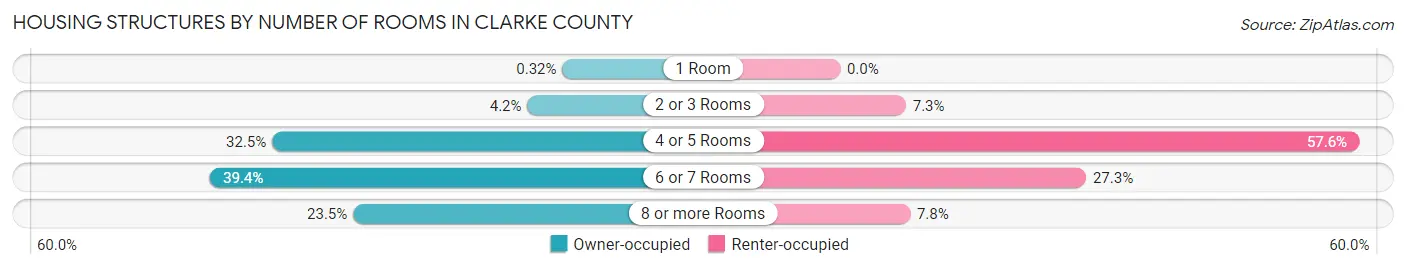
| Number of Rooms | Owner-occupied | Renter-occupied |
| 1 Room | 17 (0.3%) | 0 (0.0%) |
| 2 or 3 Rooms | 220 (4.2%) | 64 (7.3%) |
| 4 or 5 Rooms | 1,705 (32.5%) | 504 (57.6%) |
| 6 or 7 Rooms | 2,066 (39.4%) | 239 (27.3%) |
| 8 or more Rooms | 1,234 (23.5%) | 68 (7.8%) |
| Total | 5,242 (100.0%) | 875 (100.0%) |
Housing Structure by Heating Type in Clarke County
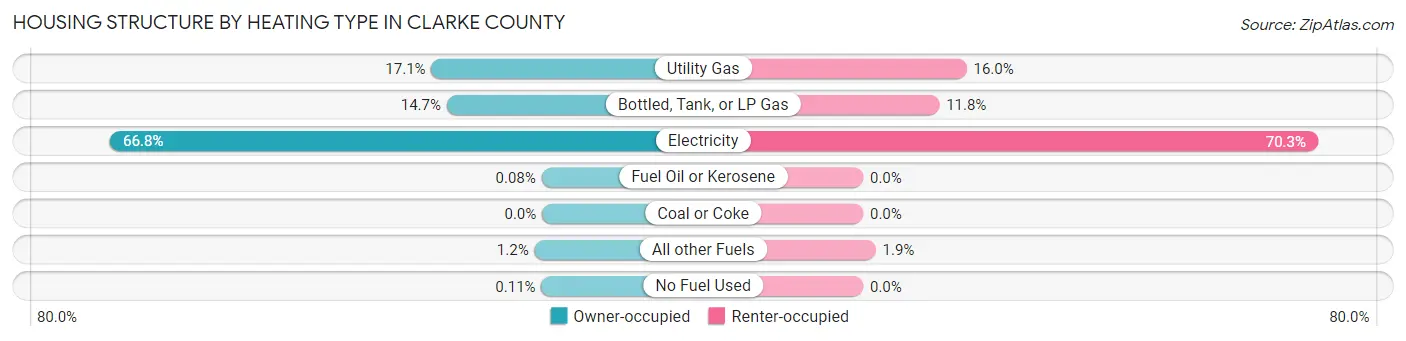
| Heating Type | Owner-occupied | Renter-occupied |
| Utility Gas | 897 (17.1%) | 140 (16.0%) |
| Bottled, Tank, or LP Gas | 772 (14.7%) | 103 (11.8%) |
| Electricity | 3,501 (66.8%) | 615 (70.3%) |
| Fuel Oil or Kerosene | 4 (0.1%) | 0 (0.0%) |
| Coal or Coke | 0 (0.0%) | 0 (0.0%) |
| All other Fuels | 62 (1.2%) | 17 (1.9%) |
| No Fuel Used | 6 (0.1%) | 0 (0.0%) |
| Total | 5,242 (100.0%) | 875 (100.0%) |
Household Vehicle Usage in Clarke County

| Vehicles per Household | Owner-occupied | Renter-occupied |
| No Vehicle | 251 (4.8%) | 167 (19.1%) |
| 1 Vehicle | 1,348 (25.7%) | 467 (53.4%) |
| 2 Vehicles | 2,055 (39.2%) | 123 (14.1%) |
| 3 or more Vehicles | 1,588 (30.3%) | 118 (13.5%) |
| Total | 5,242 (100.0%) | 875 (100.0%) |
Real Estate & Mortgages in Clarke County
Real Estate and Mortgage Overview in Clarke County
| Characteristic | Without Mortgage | With Mortgage |
| Housing Units | 3,497 | 1,745 |
| Median Property Value | $81,600 | $132,000 |
| Median Household Income | $34,774 | $337 |
| Monthly Housing Costs | $380 | $12 |
| Real Estate Taxes | $434 | $231 |
Property Value by Mortgage Status in Clarke County
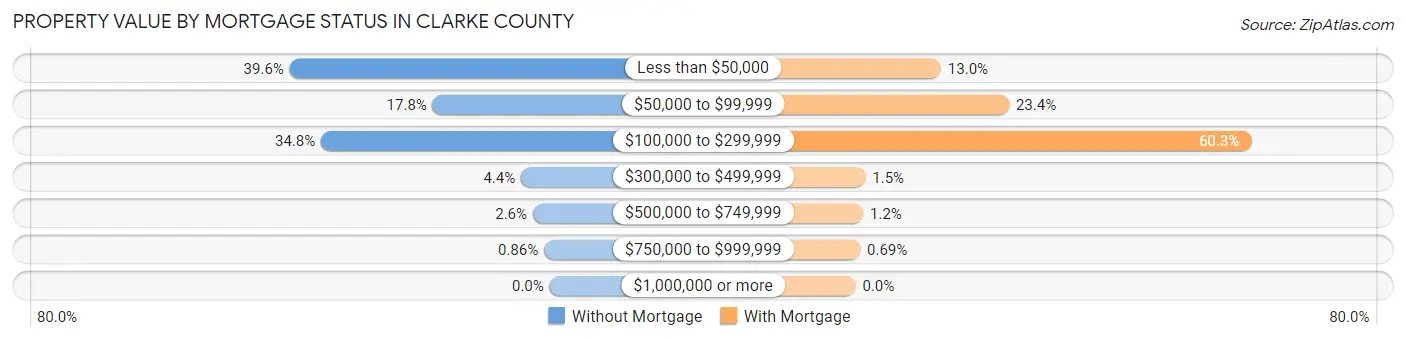
| Property Value | Without Mortgage | With Mortgage |
| Less than $50,000 | 1,385 (39.6%) | 227 (13.0%) |
| $50,000 to $99,999 | 623 (17.8%) | 408 (23.4%) |
| $100,000 to $299,999 | 1,218 (34.8%) | 1,052 (60.3%) |
| $300,000 to $499,999 | 152 (4.3%) | 26 (1.5%) |
| $500,000 to $749,999 | 89 (2.5%) | 20 (1.1%) |
| $750,000 to $999,999 | 30 (0.9%) | 12 (0.7%) |
| $1,000,000 or more | 0 (0.0%) | 0 (0.0%) |
| Total | 3,497 (100.0%) | 1,745 (100.0%) |
Household Income by Mortgage Status in Clarke County
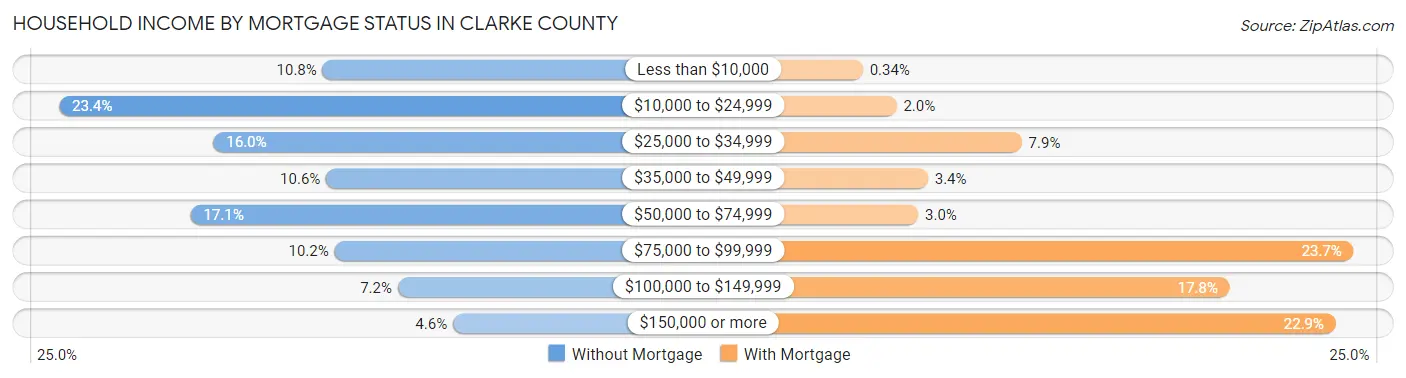
| Household Income | Without Mortgage | With Mortgage |
| Less than $10,000 | 378 (10.8%) | 6 (0.3%) |
| $10,000 to $24,999 | 817 (23.4%) | 34 (1.9%) |
| $25,000 to $34,999 | 560 (16.0%) | 138 (7.9%) |
| $35,000 to $49,999 | 372 (10.6%) | 60 (3.4%) |
| $50,000 to $74,999 | 598 (17.1%) | 52 (3.0%) |
| $75,000 to $99,999 | 358 (10.2%) | 414 (23.7%) |
| $100,000 to $149,999 | 253 (7.2%) | 311 (17.8%) |
| $150,000 or more | 161 (4.6%) | 399 (22.9%) |
| Total | 3,497 (100.0%) | 1,745 (100.0%) |
Property Value to Household Income Ratio in Clarke County
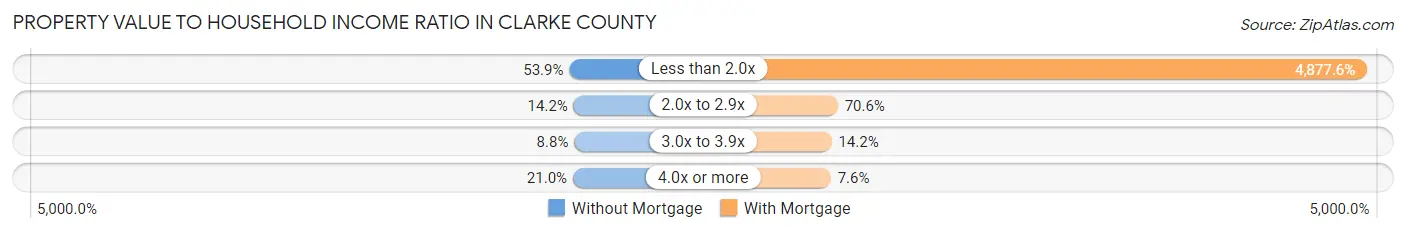
| Value-to-Income Ratio | Without Mortgage | With Mortgage |
| Less than 2.0x | 1,885 (53.9%) | 85,114 (4,877.6%) |
| 2.0x to 2.9x | 497 (14.2%) | 1,232 (70.6%) |
| 3.0x to 3.9x | 309 (8.8%) | 248 (14.2%) |
| 4.0x or more | 734 (21.0%) | 132 (7.6%) |
| Total | 3,497 (100.0%) | 1,745 (100.0%) |
Real Estate Taxes by Mortgage Status in Clarke County
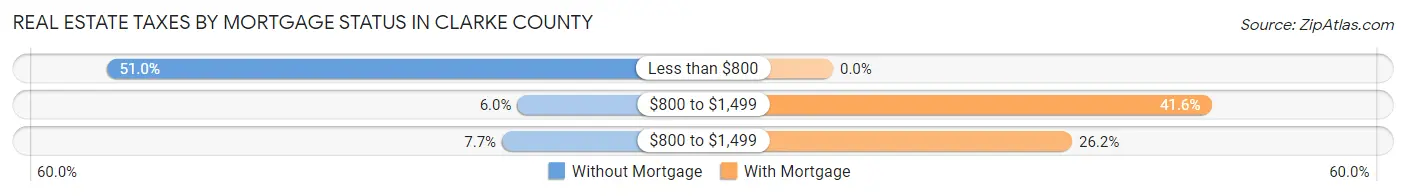
| Property Taxes | Without Mortgage | With Mortgage |
| Less than $800 | 1,784 (51.0%) | 0 (0.0%) |
| $800 to $1,499 | 210 (6.0%) | 725 (41.5%) |
| $800 to $1,499 | 269 (7.7%) | 457 (26.2%) |
| Total | 3,497 (100.0%) | 1,745 (100.0%) |
Health & Disability in Clarke County
Health Insurance Coverage by Age in Clarke County
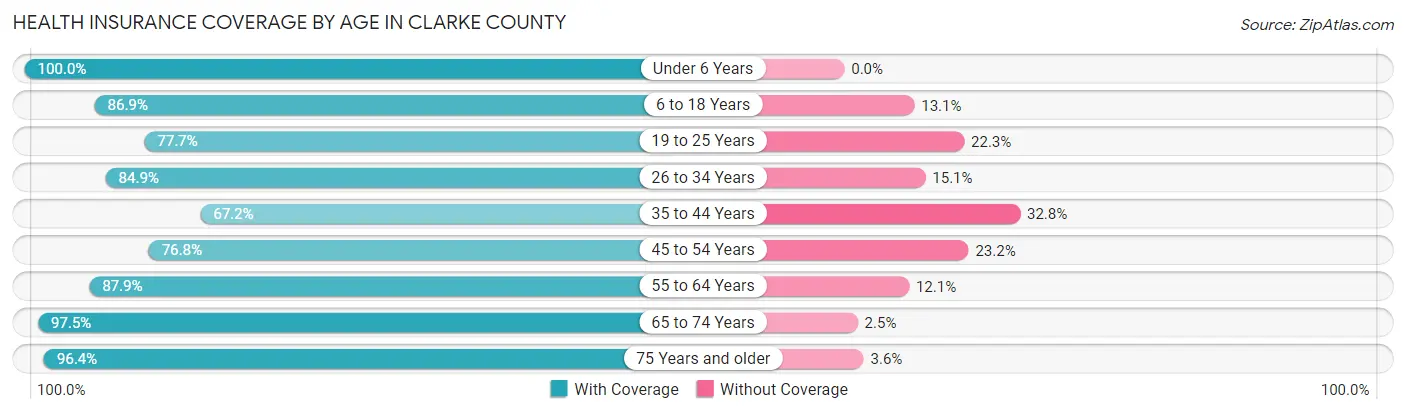
| Age Bracket | With Coverage | Without Coverage |
| Under 6 Years | 1,070 (100.0%) | 0 (0.0%) |
| 6 to 18 Years | 2,291 (86.9%) | 344 (13.1%) |
| 19 to 25 Years | 897 (77.7%) | 258 (22.3%) |
| 26 to 34 Years | 1,454 (84.9%) | 259 (15.1%) |
| 35 to 44 Years | 1,042 (67.2%) | 508 (32.8%) |
| 45 to 54 Years | 1,423 (76.8%) | 429 (23.2%) |
| 55 to 64 Years | 1,991 (87.9%) | 273 (12.1%) |
| 65 to 74 Years | 1,839 (97.5%) | 47 (2.5%) |
| 75 Years and older | 1,259 (96.4%) | 47 (3.6%) |
| Total | 13,266 (86.0%) | 2,165 (14.0%) |
Health Insurance Coverage by Citizenship Status in Clarke County
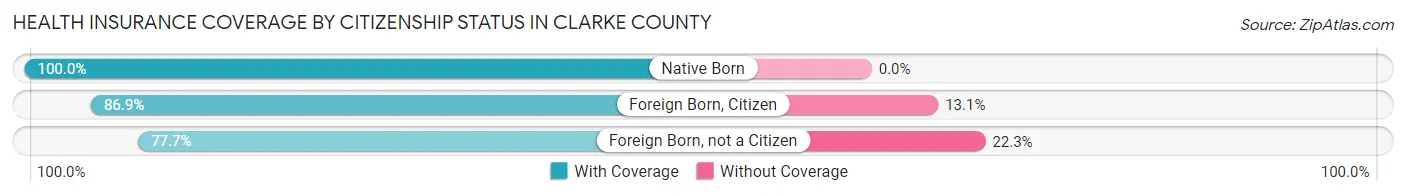
| Citizenship Status | With Coverage | Without Coverage |
| Native Born | 1,070 (100.0%) | 0 (0.0%) |
| Foreign Born, Citizen | 2,291 (86.9%) | 344 (13.1%) |
| Foreign Born, not a Citizen | 897 (77.7%) | 258 (22.3%) |
Health Insurance Coverage by Household Income in Clarke County
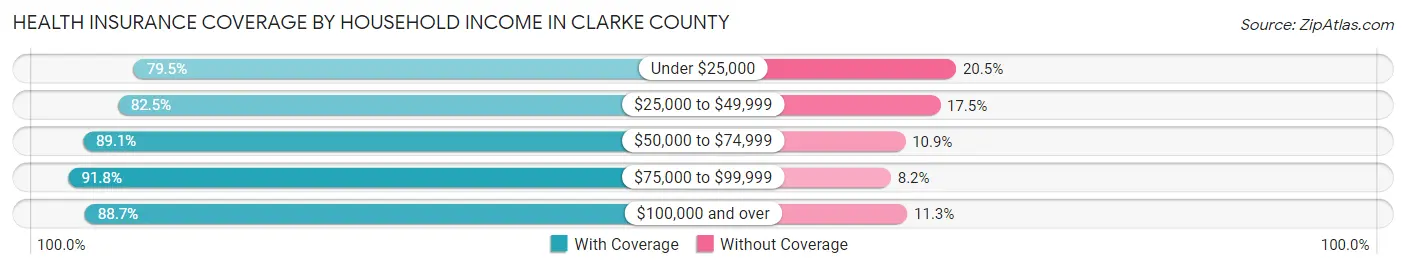
| Household Income | With Coverage | Without Coverage |
| Under $25,000 | 2,884 (79.5%) | 742 (20.5%) |
| $25,000 to $49,999 | 2,150 (82.5%) | 455 (17.5%) |
| $50,000 to $74,999 | 2,654 (89.1%) | 326 (10.9%) |
| $75,000 to $99,999 | 1,816 (91.8%) | 163 (8.2%) |
| $100,000 and over | 3,761 (88.7%) | 479 (11.3%) |
Public vs Private Health Insurance Coverage by Age in Clarke County
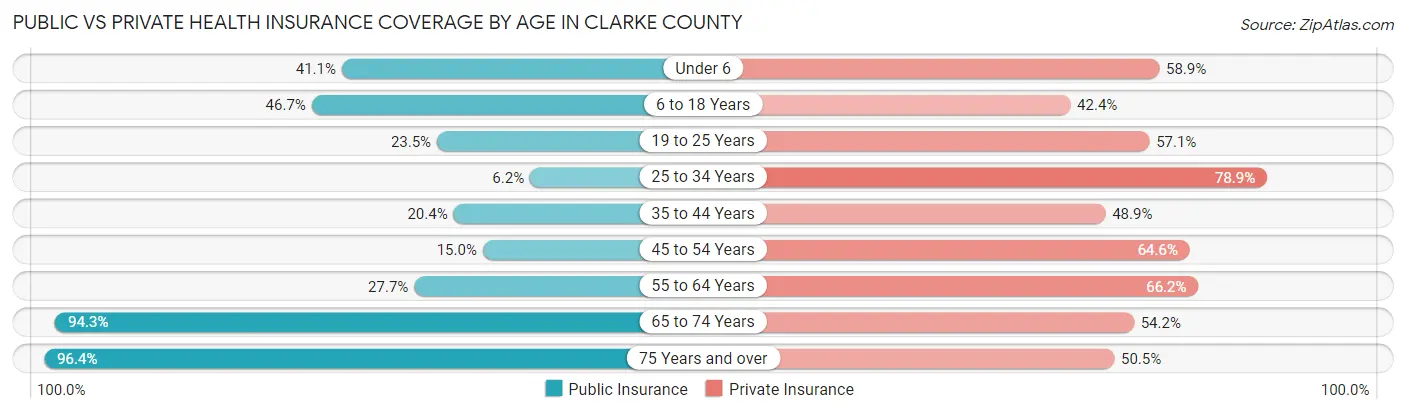
| Age Bracket | Public Insurance | Private Insurance |
| Under 6 | 440 (41.1%) | 630 (58.9%) |
| 6 to 18 Years | 1,231 (46.7%) | 1,117 (42.4%) |
| 19 to 25 Years | 271 (23.5%) | 659 (57.1%) |
| 25 to 34 Years | 106 (6.2%) | 1,352 (78.9%) |
| 35 to 44 Years | 316 (20.4%) | 758 (48.9%) |
| 45 to 54 Years | 277 (15.0%) | 1,196 (64.6%) |
| 55 to 64 Years | 627 (27.7%) | 1,498 (66.2%) |
| 65 to 74 Years | 1,779 (94.3%) | 1,022 (54.2%) |
| 75 Years and over | 1,259 (96.4%) | 660 (50.5%) |
| Total | 6,306 (40.9%) | 8,892 (57.6%) |
Disability Status by Sex by Age in Clarke County
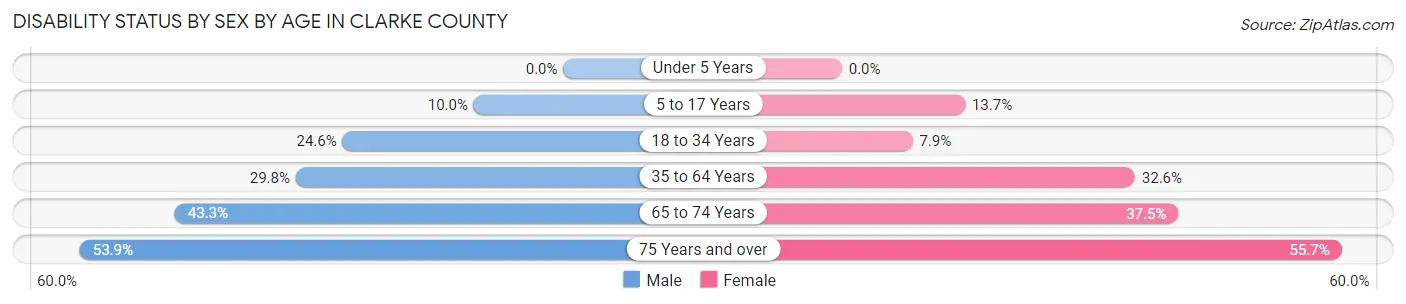
| Age Bracket | Male | Female |
| Under 5 Years | 0 (0.0%) | 0 (0.0%) |
| 5 to 17 Years | 121 (10.0%) | 183 (13.7%) |
| 18 to 34 Years | 360 (24.6%) | 129 (7.9%) |
| 35 to 64 Years | 778 (29.8%) | 997 (32.6%) |
| 65 to 74 Years | 376 (43.3%) | 381 (37.5%) |
| 75 Years and over | 294 (53.8%) | 423 (55.7%) |
Disability Class by Sex by Age in Clarke County
Disability Class: Hearing Difficulty
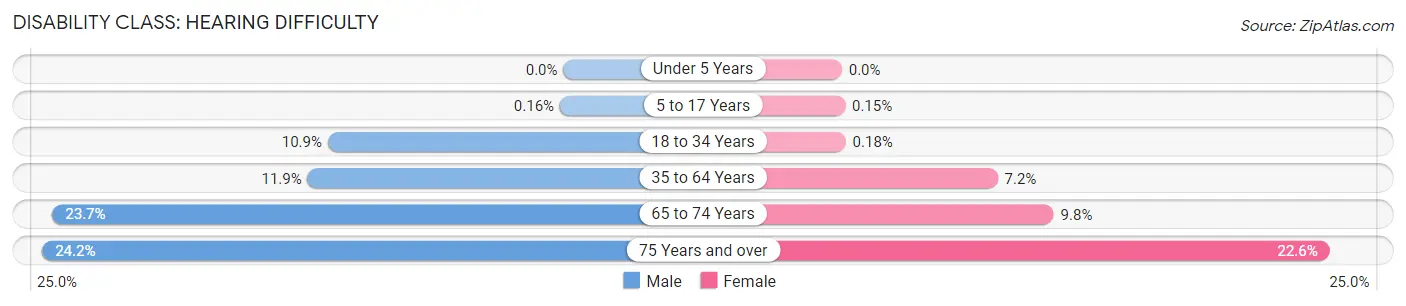
| Age Bracket | Male | Female |
| Under 5 Years | 0 (0.0%) | 0 (0.0%) |
| 5 to 17 Years | 2 (0.2%) | 2 (0.2%) |
| 18 to 34 Years | 160 (10.9%) | 3 (0.2%) |
| 35 to 64 Years | 310 (11.9%) | 221 (7.2%) |
| 65 to 74 Years | 206 (23.7%) | 100 (9.8%) |
| 75 Years and over | 132 (24.2%) | 172 (22.6%) |
Disability Class: Vision Difficulty
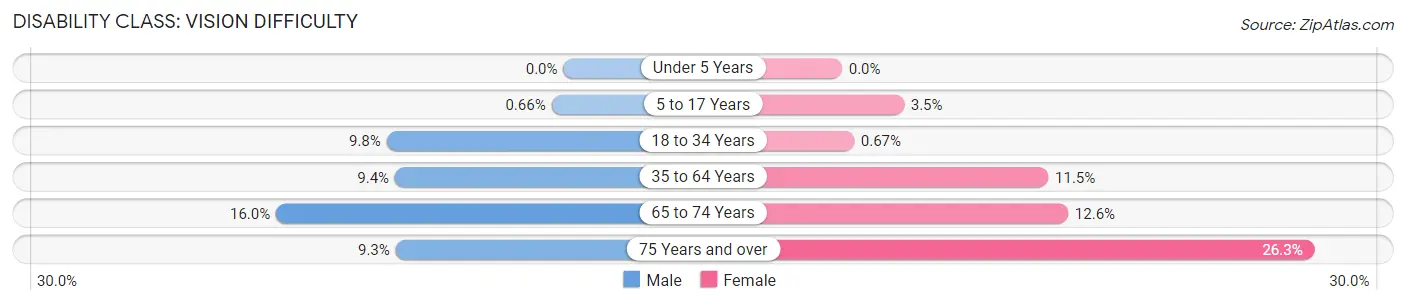
| Age Bracket | Male | Female |
| Under 5 Years | 0 (0.0%) | 0 (0.0%) |
| 5 to 17 Years | 8 (0.7%) | 46 (3.5%) |
| 18 to 34 Years | 144 (9.8%) | 11 (0.7%) |
| 35 to 64 Years | 245 (9.4%) | 351 (11.5%) |
| 65 to 74 Years | 139 (16.0%) | 128 (12.6%) |
| 75 Years and over | 51 (9.3%) | 200 (26.3%) |
Disability Class: Cognitive Difficulty
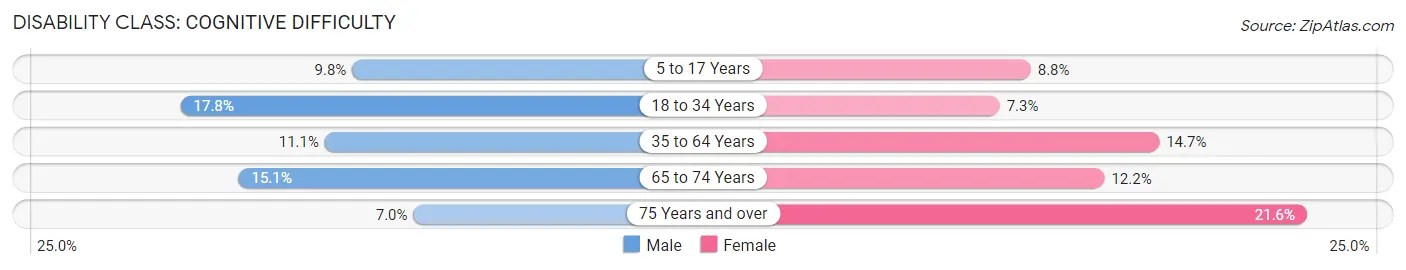
| Age Bracket | Male | Female |
| 5 to 17 Years | 119 (9.8%) | 117 (8.8%) |
| 18 to 34 Years | 260 (17.8%) | 120 (7.3%) |
| 35 to 64 Years | 289 (11.1%) | 450 (14.7%) |
| 65 to 74 Years | 131 (15.1%) | 124 (12.2%) |
| 75 Years and over | 38 (7.0%) | 164 (21.6%) |
Disability Class: Ambulatory Difficulty
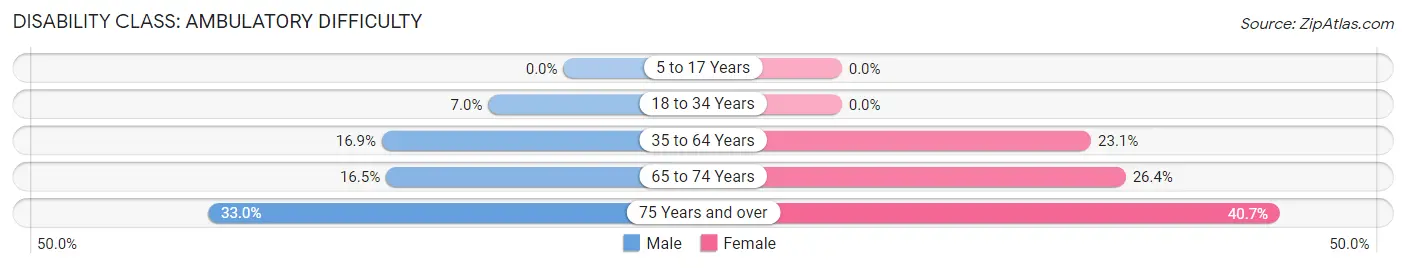
| Age Bracket | Male | Female |
| 5 to 17 Years | 0 (0.0%) | 0 (0.0%) |
| 18 to 34 Years | 102 (7.0%) | 0 (0.0%) |
| 35 to 64 Years | 440 (16.9%) | 707 (23.1%) |
| 65 to 74 Years | 143 (16.5%) | 268 (26.4%) |
| 75 Years and over | 180 (33.0%) | 309 (40.7%) |
Disability Class: Self-Care Difficulty
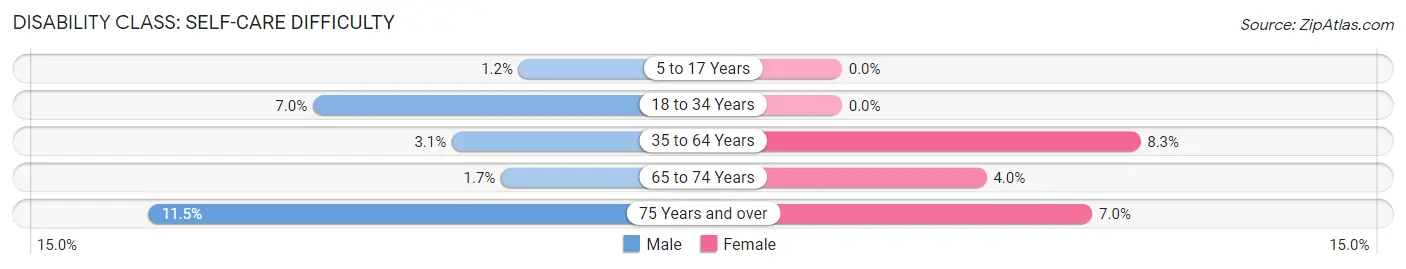
| Age Bracket | Male | Female |
| 5 to 17 Years | 15 (1.2%) | 0 (0.0%) |
| 18 to 34 Years | 102 (7.0%) | 0 (0.0%) |
| 35 to 64 Years | 81 (3.1%) | 254 (8.3%) |
| 65 to 74 Years | 15 (1.7%) | 41 (4.0%) |
| 75 Years and over | 63 (11.5%) | 53 (7.0%) |
Technology Access in Clarke County
Computing Device Access in Clarke County
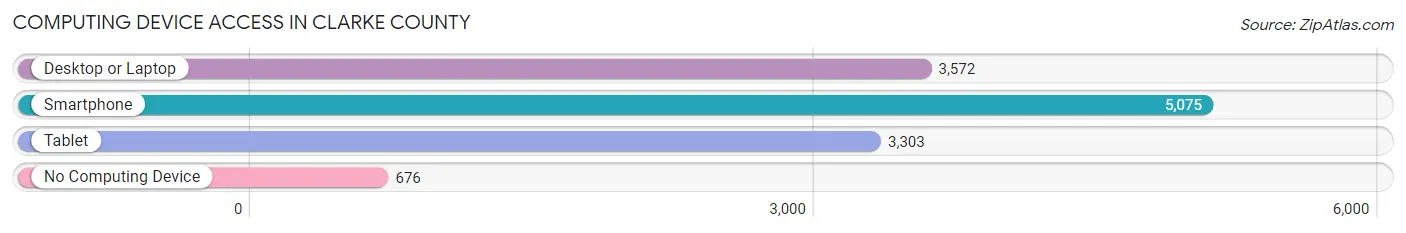
| Device Type | # Households | % Households |
| Desktop or Laptop | 3,572 | 58.4% |
| Smartphone | 5,075 | 83.0% |
| Tablet | 3,303 | 54.0% |
| No Computing Device | 676 | 11.1% |
| Total | 6,117 | 100.0% |
Internet Access in Clarke County
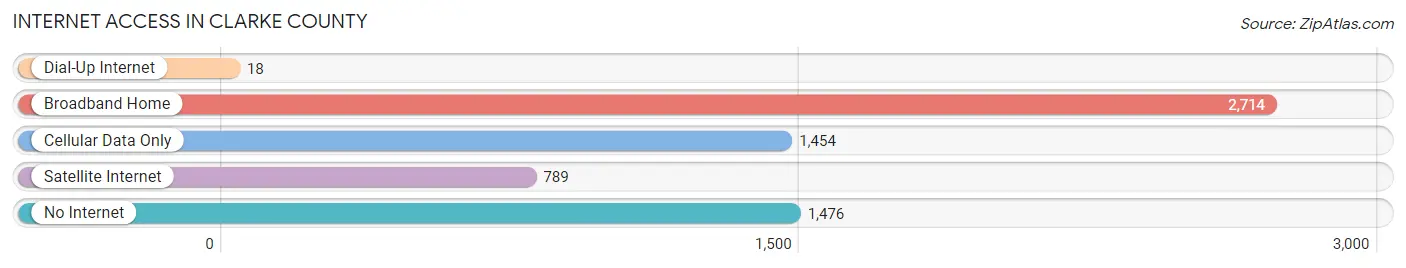
| Internet Type | # Households | % Households |
| Dial-Up Internet | 18 | 0.3% |
| Broadband Home | 2,714 | 44.4% |
| Cellular Data Only | 1,454 | 23.8% |
| Satellite Internet | 789 | 12.9% |
| No Internet | 1,476 | 24.1% |
| Total | 6,117 | 100.0% |
Clarke County Summary
Clarke County is located in the southeastern corner of Mississippi, and is bordered by Jasper, Jones, and Wayne counties. It is part of the Hattiesburg, MS Metropolitan Statistical Area. The county was established in 1833 and named for Joshua G. Clarke, the first Mississippi state auditor. The county seat is Quitman.
Geography
Clarke County covers an area of 576 square miles, of which 574 square miles is land and 2 square miles is water. The county is located in the Coastal Plain region of Mississippi, and is characterized by rolling hills and flat plains. The county is drained by the Chickasawhay River, which flows through the county from north to south. The county is home to several state parks, including Clarkco State Park, which is located in the northern part of the county.
Demographics
As of the 2010 census, there were 16,732 people, 6,541 households, and 4,541 families residing in the county. The population density was 29.2 people per square mile. The racial makeup of the county was 57.3% White, 40.2% African American, 0.3% Native American, 0.3% Asian, 0.1% Pacific Islander, 0.7% from other races, and 1.2% from two or more races. Hispanic or Latino of any race were 1.7% of the population.
The median income for a household in the county was $30,945, and the median income for a family was $37,945. The per capita income for the county was $15,945. About 22.2% of families and 27.2% of the population were below the poverty line, including 37.2% of those under age 18 and 22.2% of those age 65 or over.
Economy
The economy of Clarke County is largely based on agriculture, forestry, and manufacturing. The county is home to several large timber companies, including Weyerhaeuser and International Paper. The county is also home to several manufacturing companies, including a furniture factory and a paper mill.
Agriculture is an important part of the county's economy, with the main crops being cotton, corn, soybeans, and wheat. Livestock production is also important, with cattle, hogs, and poultry being the main animals raised.
The county is also home to several tourist attractions, including the Clarkco State Park, which offers camping, fishing, and hiking opportunities. The county is also home to several historic sites, including the Old Courthouse Museum and the Quitman Historic District.
Conclusion
Clarke County is a rural county located in the southeastern corner of Mississippi. The county is characterized by rolling hills and flat plains, and is home to several state parks and tourist attractions. The economy of the county is largely based on agriculture, forestry, and manufacturing. The county is also home to several historic sites, making it a popular destination for tourists.
Common Questions
What is Per Capita Income in Clarke County?
Per Capita income in Clarke County is $26,435.
What is the Median Family Income in Clarke County?
Median Family Income in Clarke County is $60,057.
What is the Median Household income in Clarke County?
Median Household Income in Clarke County is $46,329.
What is Income or Wage Gap in Clarke County?
Income or Wage Gap in Clarke County is 48.4%.
Women in Clarke County earn 51.6 cents for every dollar earned by a man.
What is Family Income Deficit in Clarke County?
Family Income Deficit in Clarke County is $12,196.
Families that are below poverty line in Clarke County earn $12,196 less on average than the poverty threshold level.
What is Inequality or Gini Index in Clarke County?
Inequality or Gini Index in Clarke County is 0.50.
What is the Total Population of Clarke County?
Total Population of Clarke County is 15,553.
What is the Total Male Population of Clarke County?
Total Male Population of Clarke County is 7,289.
What is the Total Female Population of Clarke County?
Total Female Population of Clarke County is 8,264.
What is the Ratio of Males per 100 Females in Clarke County?
There are 88.20 Males per 100 Females in Clarke County.
What is the Ratio of Females per 100 Males in Clarke County?
There are 113.38 Females per 100 Males in Clarke County.
What is the Median Population Age in Clarke County?
Median Population Age in Clarke County is 42.1 Years.
What is the Average Family Size in Clarke County
Average Family Size in Clarke County is 3.0 People.
What is the Average Household Size in Clarke County
Average Household Size in Clarke County is 2.5 People.
How Large is the Labor Force in Clarke County?
There are 6,685 People in the Labor Forcein in Clarke County.
What is the Percentage of People in the Labor Force in Clarke County?
53.4% of People are in the Labor Force in Clarke County.
What is the Unemployment Rate in Clarke County?
Unemployment Rate in Clarke County is 5.6%.