Claiborne County, MS Map & Demographics
Claiborne County Map
Claiborne County Overview
$17,250
PER CAPITA INCOME
$37,063
AVG FAMILY INCOME
$34,282
AVG HOUSEHOLD INCOME
26.8%
WAGE / INCOME GAP [ % ]
73.2¢/ $1
WAGE / INCOME GAP [ $ ]
0.54
INEQUALITY / GINI INDEX
9,044
TOTAL POPULATION
4,405
MALE POPULATION
4,639
FEMALE POPULATION
94.96
MALES / 100 FEMALES
105.31
FEMALES / 100 MALES
33.9
MEDIAN AGE
4.0
AVG FAMILY SIZE
3.0
AVG HOUSEHOLD SIZE
2,854
LABOR FORCE [ PEOPLE ]
39.3%
PERCENT IN LABOR FORCE
9.0%
UNEMPLOYMENT RATE
Claiborne County Area Codes
Income in Claiborne County
Income Overview in Claiborne County
Per Capita Income in Claiborne County is $17,250, while median incomes of families and households are $37,063 and $34,282 respectively.
| Characteristic | Number | Measure |
| Per Capita Income | 9,044 | $17,250 |
| Median Family Income | 1,678 | $37,063 |
| Mean Family Income | 1,678 | $46,564 |
| Median Household Income | 2,624 | $34,282 |
| Mean Household Income | 2,624 | $51,995 |
| Income Deficit | 1,678 | $0 |
| Wage / Income Gap (%) | 9,044 | 26.80% |
| Wage / Income Gap ($) | 9,044 | 73.20¢ per $1 |
| Gini / Inequality Index | 9,044 | 0.54 |
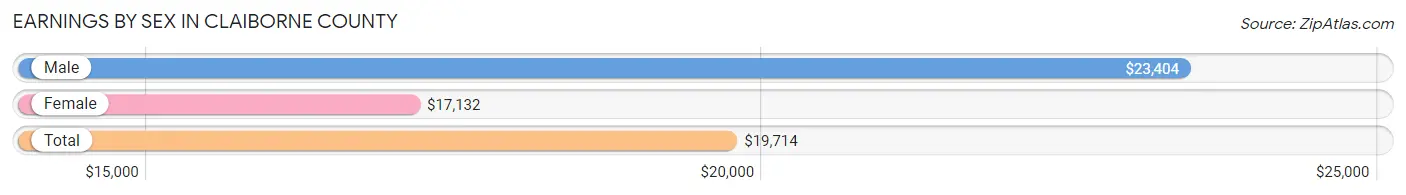
Earnings by Sex in Claiborne County
Average Earnings in Claiborne County are $19,714, $23,404 for men and $17,132 for women, a difference of 26.8%.
| Sex | Number | Average Earnings |
| Male | 1,592 (49.6%) | $23,404 |
| Female | 1,618 (50.4%) | $17,132 |
| Total | 3,210 (100.0%) | $19,714 |
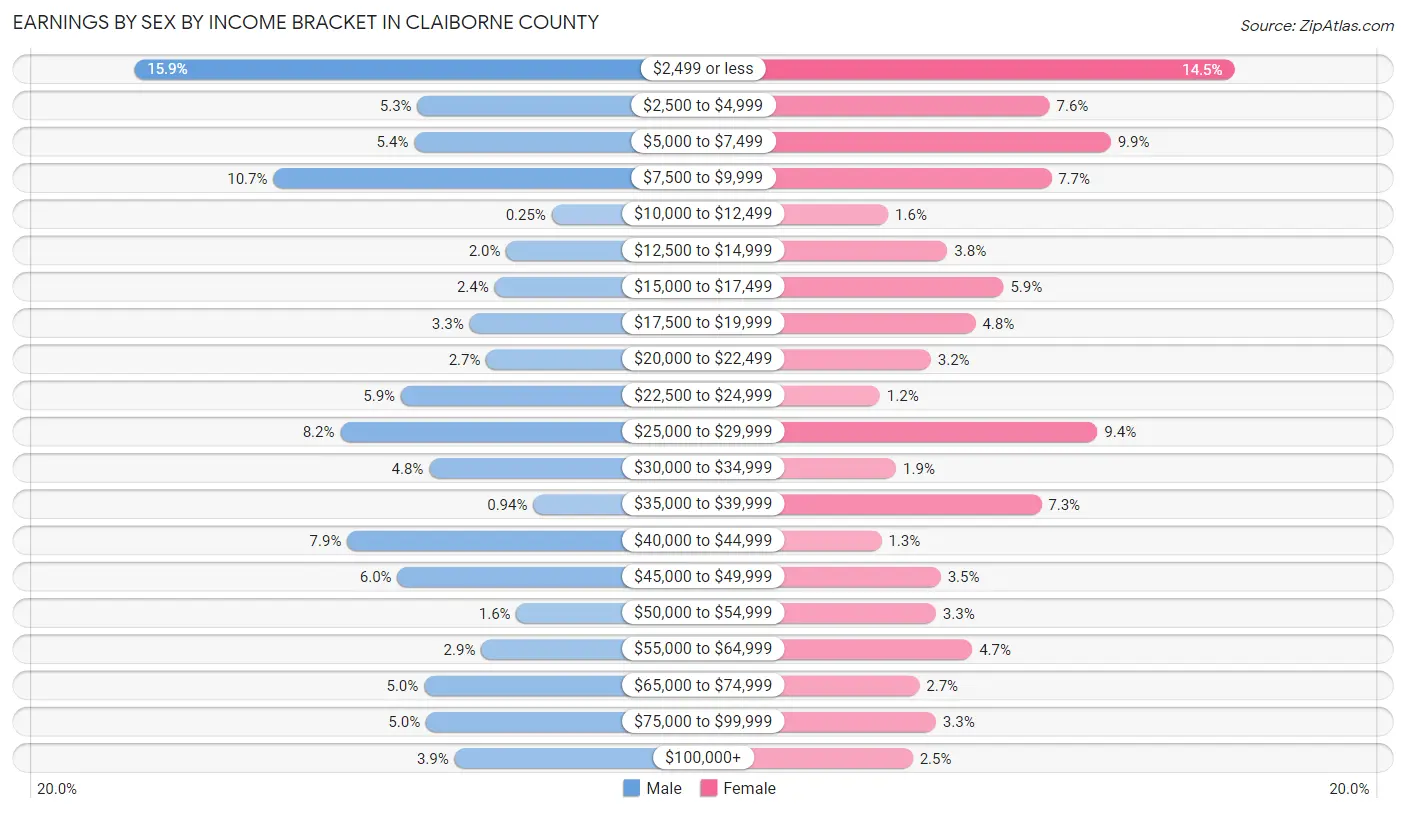
Earnings by Sex by Income Bracket in Claiborne County
The most common earnings brackets in Claiborne County are $2,499 or less for men (253 | 15.9%) and $2,499 or less for women (235 | 14.5%).
| Income | Male | Female |
| $2,499 or less | 253 (15.9%) | 235 (14.5%) |
| $2,500 to $4,999 | 84 (5.3%) | 123 (7.6%) |
| $5,000 to $7,499 | 86 (5.4%) | 160 (9.9%) |
| $7,500 to $9,999 | 170 (10.7%) | 124 (7.7%) |
| $10,000 to $12,499 | 4 (0.3%) | 25 (1.5%) |
| $12,500 to $14,999 | 31 (1.9%) | 61 (3.8%) |
| $15,000 to $17,499 | 38 (2.4%) | 95 (5.9%) |
| $17,500 to $19,999 | 53 (3.3%) | 78 (4.8%) |
| $20,000 to $22,499 | 43 (2.7%) | 51 (3.2%) |
| $22,500 to $24,999 | 94 (5.9%) | 20 (1.2%) |
| $25,000 to $29,999 | 130 (8.2%) | 152 (9.4%) |
| $30,000 to $34,999 | 77 (4.8%) | 30 (1.8%) |
| $35,000 to $39,999 | 15 (0.9%) | 118 (7.3%) |
| $40,000 to $44,999 | 126 (7.9%) | 21 (1.3%) |
| $45,000 to $49,999 | 96 (6.0%) | 57 (3.5%) |
| $50,000 to $54,999 | 25 (1.6%) | 54 (3.3%) |
| $55,000 to $64,999 | 46 (2.9%) | 76 (4.7%) |
| $65,000 to $74,999 | 80 (5.0%) | 44 (2.7%) |
| $75,000 to $99,999 | 79 (5.0%) | 54 (3.3%) |
| $100,000+ | 62 (3.9%) | 40 (2.5%) |
| Total | 1,592 (100.0%) | 1,618 (100.0%) |
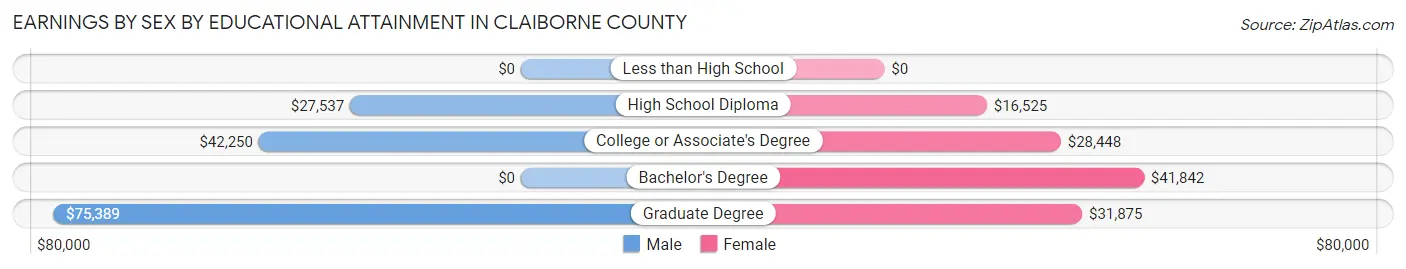
Earnings by Sex by Educational Attainment in Claiborne County
Average earnings in Claiborne County are $33,542 for men and $28,027 for women, a difference of 16.4%. Men with an educational attainment of graduate degree enjoy the highest average annual earnings of $75,389, while those with high school diploma education earn the least with $27,537. Women with an educational attainment of bachelor's degree earn the most with the average annual earnings of $41,842, while those with high school diploma education have the smallest earnings of $16,525.
| Educational Attainment | Male Income | Female Income |
| Less than High School | - | - |
| High School Diploma | $27,537 | $16,525 |
| College or Associate's Degree | $42,250 | $28,448 |
| Bachelor's Degree | - | - |
| Graduate Degree | $75,389 | $31,875 |
| Total | $33,542 | $28,027 |
Family Income in Claiborne County
Family Income Brackets in Claiborne County
According to the Claiborne County family income data, there are 305 families falling into the $50,000 to $74,999 income range, which is the most common income bracket and makes up 18.2% of all families.
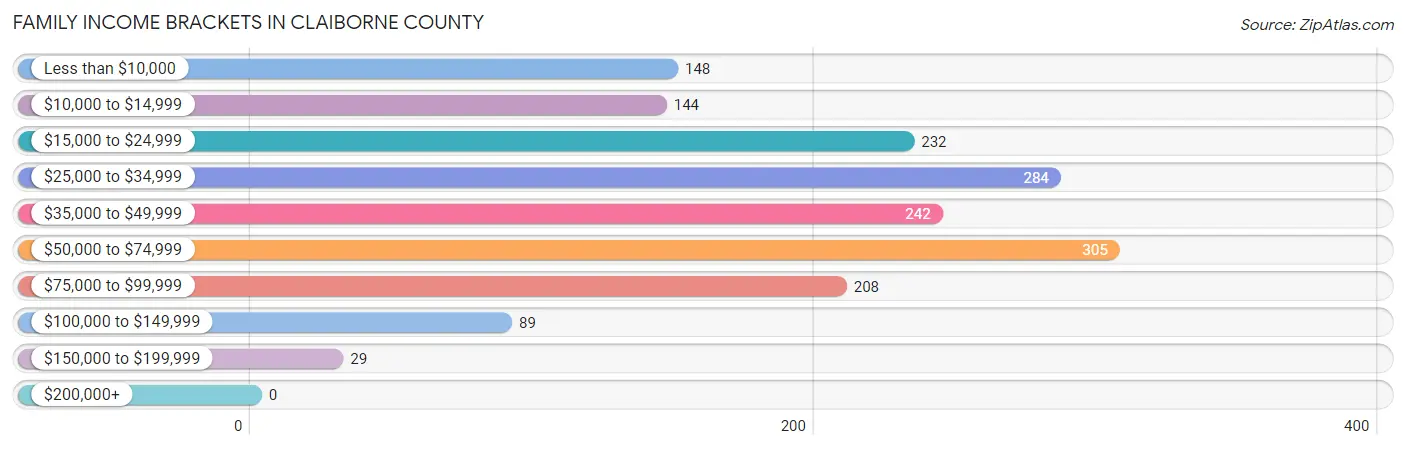
| Income Bracket | # Families | % Families |
| Less than $10,000 | 148 | 8.8% |
| $10,000 to $14,999 | 144 | 8.6% |
| $15,000 to $24,999 | 232 | 13.8% |
| $25,000 to $34,999 | 284 | 16.9% |
| $35,000 to $49,999 | 242 | 14.4% |
| $50,000 to $74,999 | 305 | 18.2% |
| $75,000 to $99,999 | 208 | 12.4% |
| $100,000 to $149,999 | 89 | 5.3% |
| $150,000 to $199,999 | 29 | 1.7% |
| $200,000+ | 0 | 0.0% |
Family Income by Famaliy Size in Claiborne County
4-person families (228 | 13.6%) account for the highest median family income in Claiborne County with $64,500 per family, while 2-person families (942 | 56.1%) have the highest median income of $16,924 per family member.
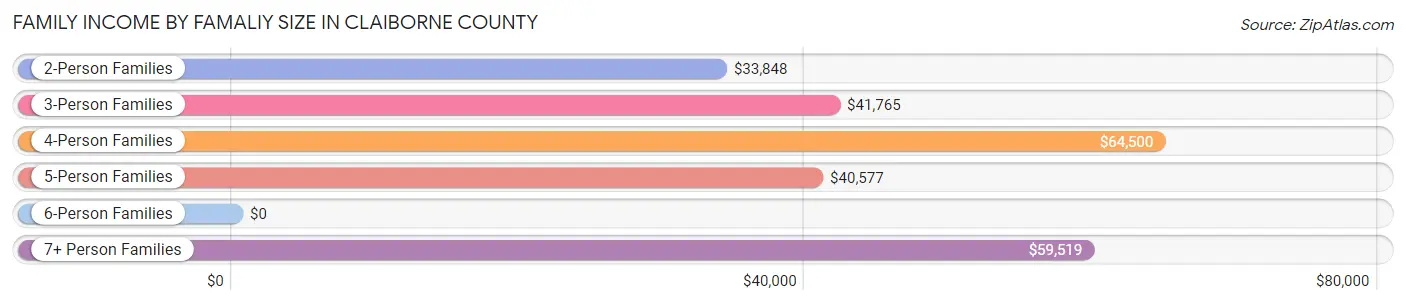
| Income Bracket | # Families | Median Income |
| 2-Person Families | 942 (56.1%) | $33,848 |
| 3-Person Families | 364 (21.7%) | $41,765 |
| 4-Person Families | 228 (13.6%) | $64,500 |
| 5-Person Families | 104 (6.2%) | $40,577 |
| 6-Person Families | 19 (1.1%) | $0 |
| 7+ Person Families | 21 (1.3%) | $59,519 |
| Total | 1,678 (100.0%) | $37,063 |
Family Income by Number of Earners in Claiborne County
The median family income in Claiborne County is $37,063, with families comprising 3+ earners (47) having the highest median family income of $81,339, while families with no earners (560) have the lowest median family income of $19,357, accounting for 2.8% and 33.4% of families, respectively.
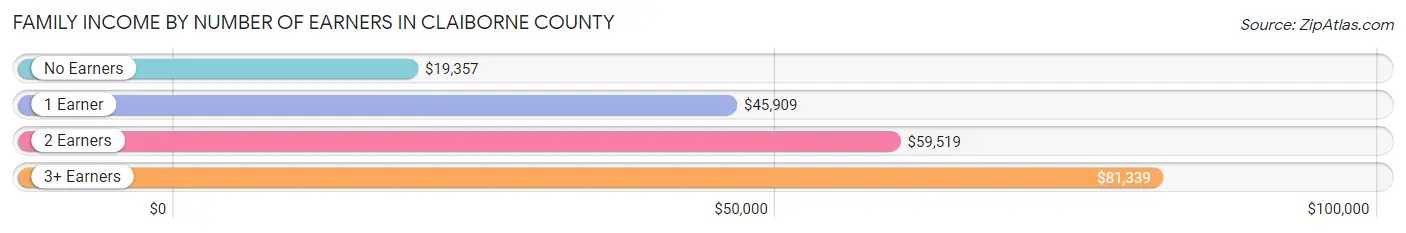
| Number of Earners | # Families | Median Income |
| No Earners | 560 (33.4%) | $19,357 |
| 1 Earner | 690 (41.1%) | $45,909 |
| 2 Earners | 381 (22.7%) | $59,519 |
| 3+ Earners | 47 (2.8%) | $81,339 |
| Total | 1,678 (100.0%) | $37,063 |
Household Income in Claiborne County
Household Income Brackets in Claiborne County
With 451 households falling in the category, the $15,000 to $24,999 income range is the most frequent in Claiborne County, accounting for 17.2% of all households. In contrast, only 29 households (1.1%) fall into the $200,000+ income bracket, making it the least populous group.
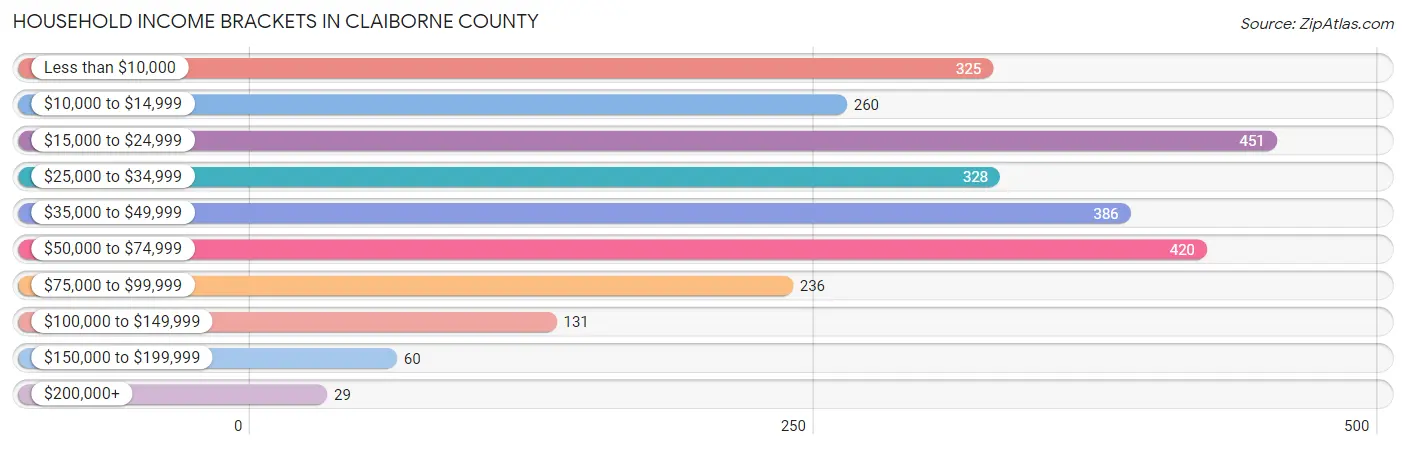
| Income Bracket | # Households | % Households |
| Less than $10,000 | 325 | 12.4% |
| $10,000 to $14,999 | 260 | 9.9% |
| $15,000 to $24,999 | 451 | 17.2% |
| $25,000 to $34,999 | 328 | 12.5% |
| $35,000 to $49,999 | 386 | 14.7% |
| $50,000 to $74,999 | 420 | 16.0% |
| $75,000 to $99,999 | 236 | 9.0% |
| $100,000 to $149,999 | 131 | 5.0% |
| $150,000 to $199,999 | 60 | 2.3% |
| $200,000+ | 29 | 1.1% |
Household Income by Householder Age in Claiborne County
The median household income in Claiborne County is $34,282, with the highest median household income of $41,004 found in the 45 to 64 years age bracket for the primary householder. A total of 931 households (35.5%) fall into this category. Meanwhile, the 65+ years age bracket for the primary householder has the lowest median household income of $30,068, with 1,132 households (43.1%) in this group.
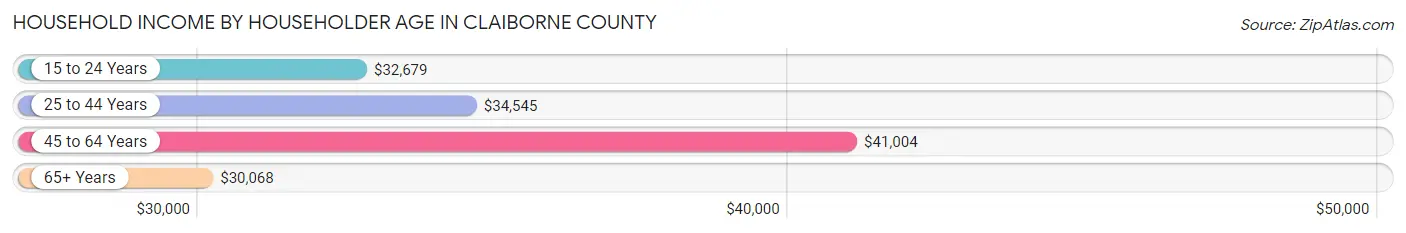
| Income Bracket | # Households | Median Income |
| 15 to 24 Years | 21 (0.8%) | $32,679 |
| 25 to 44 Years | 540 (20.6%) | $34,545 |
| 45 to 64 Years | 931 (35.5%) | $41,004 |
| 65+ Years | 1,132 (43.1%) | $30,068 |
| Total | 2,624 (100.0%) | $34,282 |
Poverty in Claiborne County
Income Below Poverty by Sex and Age in Claiborne County
With 29.3% poverty level for males and 31.5% for females among the residents of Claiborne County, 16 and 17 year old males and 12 to 14 year old females are the most vulnerable to poverty, with 20 males (90.9%) and 36 females (78.3%) in their respective age groups living below the poverty level.
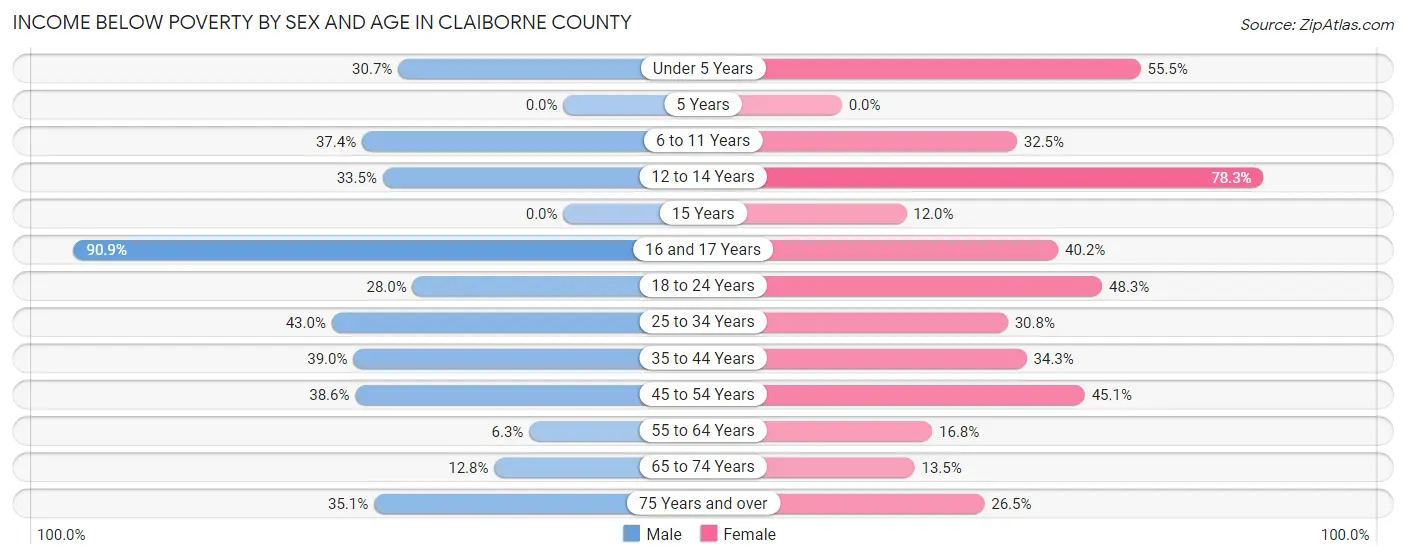
| Age Bracket | Male | Female |
| Under 5 Years | 130 (30.7%) | 71 (55.5%) |
| 5 Years | 0 (0.0%) | 0 (0.0%) |
| 6 to 11 Years | 77 (37.4%) | 141 (32.5%) |
| 12 to 14 Years | 113 (33.5%) | 36 (78.3%) |
| 15 Years | 0 (0.0%) | 14 (12.0%) |
| 16 and 17 Years | 20 (90.9%) | 49 (40.2%) |
| 18 to 24 Years | 131 (28.0%) | 245 (48.3%) |
| 25 to 34 Years | 184 (43.0%) | 85 (30.8%) |
| 35 to 44 Years | 186 (39.0%) | 189 (34.3%) |
| 45 to 54 Years | 134 (38.6%) | 193 (45.1%) |
| 55 to 64 Years | 26 (6.3%) | 92 (16.8%) |
| 65 to 74 Years | 65 (12.8%) | 69 (13.5%) |
| 75 Years and over | 78 (35.1%) | 91 (26.5%) |
| Total | 1,144 (29.3%) | 1,275 (31.5%) |
Income Above Poverty by Sex and Age in Claiborne County
According to the poverty statistics in Claiborne County, males aged 15 years and females aged 5 years are the age groups that are most secure financially, with 100.0% of males and 100.0% of females in these age groups living above the poverty line.
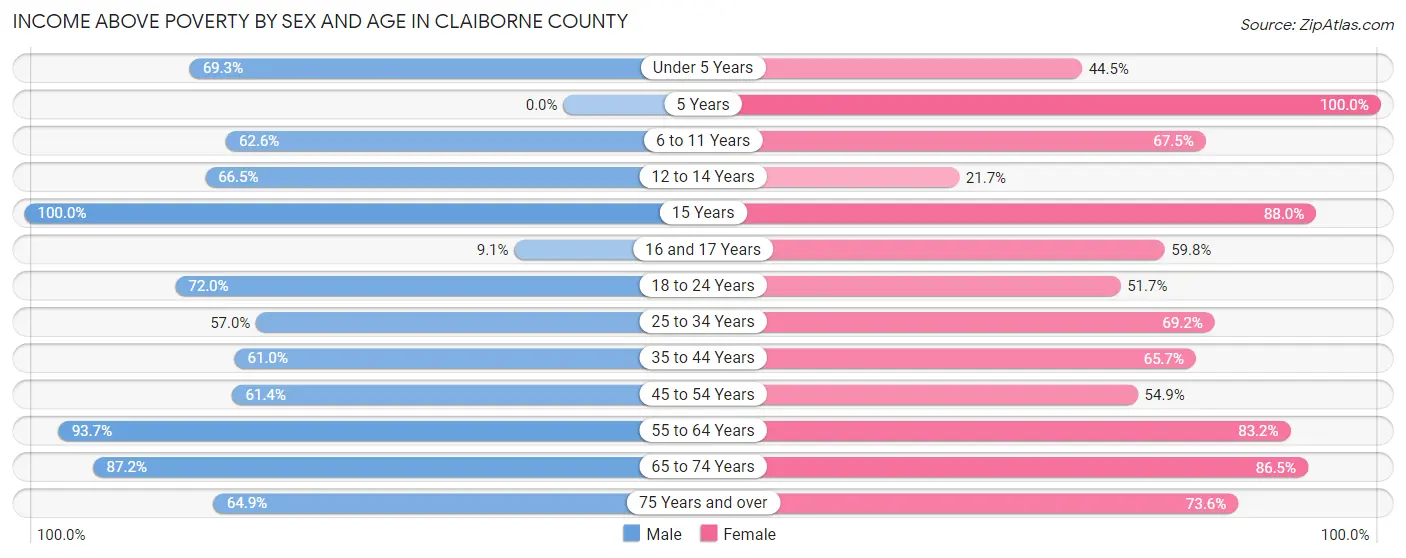
| Age Bracket | Male | Female |
| Under 5 Years | 294 (69.3%) | 57 (44.5%) |
| 5 Years | 0 (0.0%) | 30 (100.0%) |
| 6 to 11 Years | 129 (62.6%) | 293 (67.5%) |
| 12 to 14 Years | 224 (66.5%) | 10 (21.7%) |
| 15 Years | 60 (100.0%) | 103 (88.0%) |
| 16 and 17 Years | 2 (9.1%) | 73 (59.8%) |
| 18 to 24 Years | 337 (72.0%) | 262 (51.7%) |
| 25 to 34 Years | 244 (57.0%) | 191 (69.2%) |
| 35 to 44 Years | 291 (61.0%) | 362 (65.7%) |
| 45 to 54 Years | 213 (61.4%) | 235 (54.9%) |
| 55 to 64 Years | 384 (93.7%) | 457 (83.2%) |
| 65 to 74 Years | 442 (87.2%) | 442 (86.5%) |
| 75 Years and over | 144 (64.9%) | 253 (73.6%) |
| Total | 2,764 (70.7%) | 2,768 (68.5%) |
Income Below Poverty Among Married-Couple Families in Claiborne County
The poverty statistics for married-couple families in Claiborne County show that 13.1% or 131 of the total 997 families live below the poverty line. Families with 3 or 4 children have the highest poverty rate of 77.8%, comprising of 28 families. On the other hand, families with 1 or 2 children have the lowest poverty rate of 1.5%, which includes 3 families.
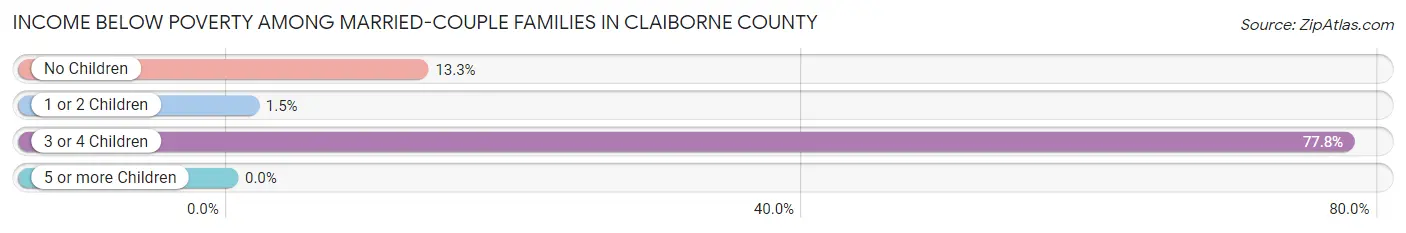
| Children | Above Poverty | Below Poverty |
| No Children | 654 (86.7%) | 100 (13.3%) |
| 1 or 2 Children | 204 (98.6%) | 3 (1.5%) |
| 3 or 4 Children | 8 (22.2%) | 28 (77.8%) |
| 5 or more Children | 0 (0.0%) | 0 (0.0%) |
| Total | 866 (86.9%) | 131 (13.1%) |
Income Below Poverty Among Single-Parent Households in Claiborne County
According to the poverty data in Claiborne County, 69.1% or 38 single-father households and 45.2% or 283 single-mother households are living below the poverty line. Among single-father households, those with no children have the highest poverty rate, with 38 households (69.1%) experiencing poverty. Likewise, among single-mother households, those with 3 or 4 children have the highest poverty rate, with 42 households (87.5%) falling below the poverty line.
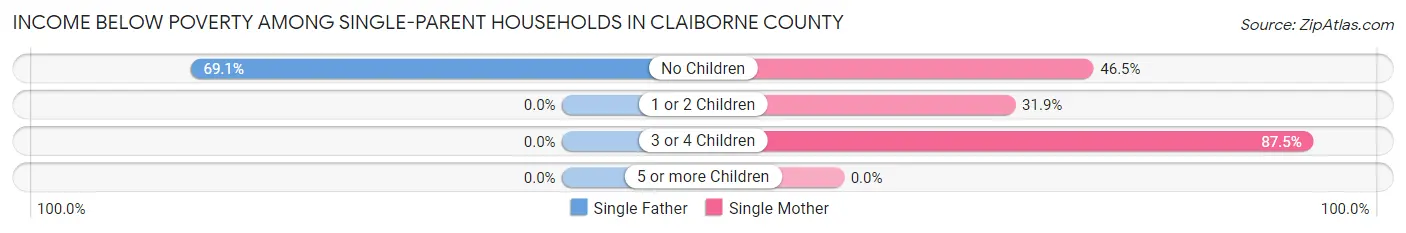
| Children | Single Father | Single Mother |
| No Children | 38 (69.1%) | 180 (46.5%) |
| 1 or 2 Children | 0 (0.0%) | 61 (31.9%) |
| 3 or 4 Children | 0 (0.0%) | 42 (87.5%) |
| 5 or more Children | 0 (0.0%) | 0 (0.0%) |
| Total | 38 (69.1%) | 283 (45.2%) |
Income Below Poverty Among Married-Couple vs Single-Parent Households in Claiborne County
The poverty data for Claiborne County shows that 131 of the married-couple family households (13.1%) and 321 of the single-parent households (47.1%) are living below the poverty level. Within the married-couple family households, those with 3 or 4 children have the highest poverty rate, with 28 households (77.8%) falling below the poverty line. Among the single-parent households, those with 3 or 4 children have the highest poverty rate, with 42 household (87.5%) living below poverty.
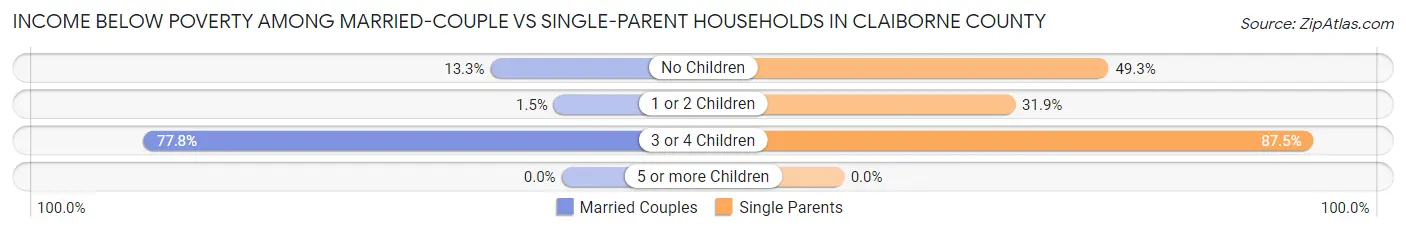
| Children | Married-Couple Families | Single-Parent Households |
| No Children | 100 (13.3%) | 218 (49.3%) |
| 1 or 2 Children | 3 (1.5%) | 61 (31.9%) |
| 3 or 4 Children | 28 (77.8%) | 42 (87.5%) |
| 5 or more Children | 0 (0.0%) | 0 (0.0%) |
| Total | 131 (13.1%) | 321 (47.1%) |
Race in Claiborne County
The most populous races in Claiborne County are Black / African American (7,763 | 85.8%), White / Caucasian (1,008 | 11.2%), and Two or more Races (256 | 2.8%).
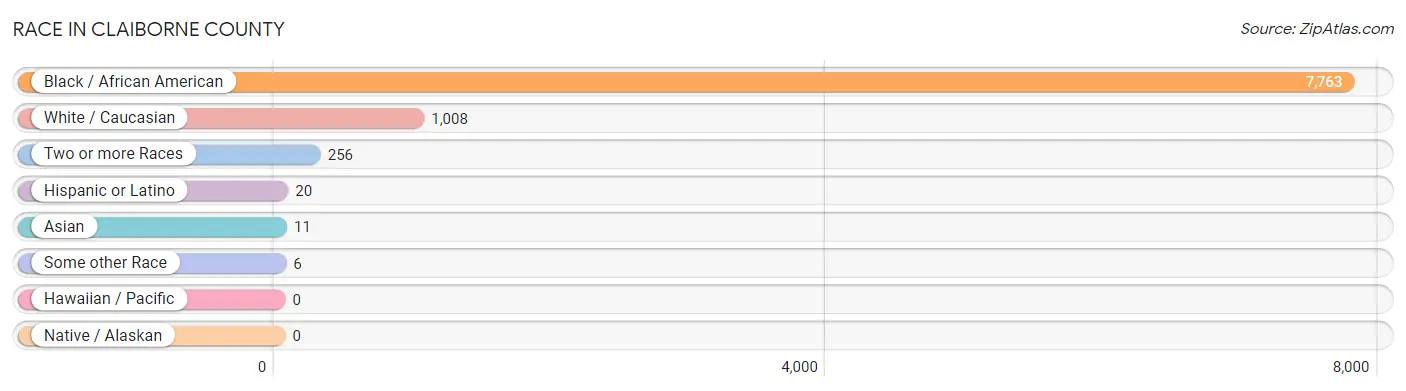
| Race | # Population | % Population |
| Asian | 11 | 0.1% |
| Black / African American | 7,763 | 85.8% |
| Hawaiian / Pacific | 0 | 0.0% |
| Hispanic or Latino | 20 | 0.2% |
| Native / Alaskan | 0 | 0.0% |
| White / Caucasian | 1,008 | 11.2% |
| Two or more Races | 256 | 2.8% |
| Some other Race | 6 | 0.1% |
| Total | 9,044 | 100.0% |
Ancestry in Claiborne County
The most populous ancestries reported in Claiborne County are American (200 | 2.2%), Irish (142 | 1.6%), Subsaharan African (88 | 1.0%), German (79 | 0.9%), and Bhutanese (77 | 0.9%), together accounting for 6.5% of all Claiborne County residents.
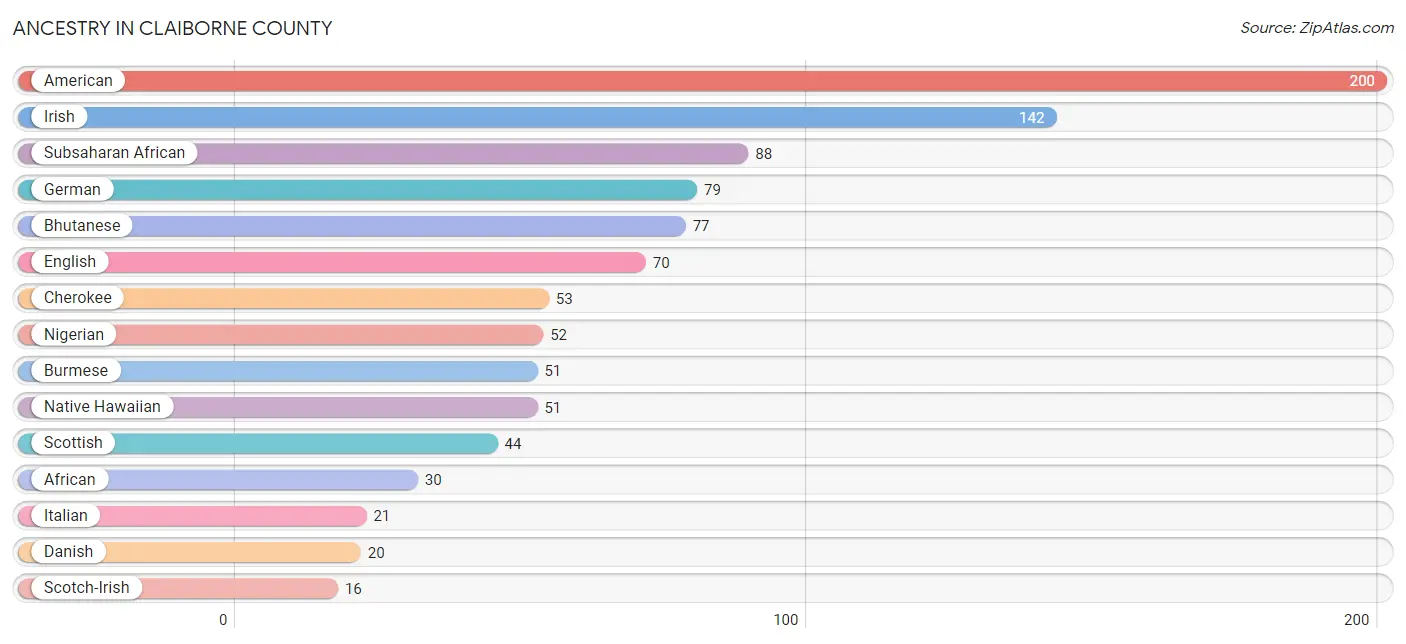
| Ancestry | # Population | % Population |
| African | 30 | 0.3% |
| American | 200 | 2.2% |
| Bhutanese | 77 | 0.9% |
| Burmese | 51 | 0.6% |
| Central American | 4 | 0.0% |
| Cherokee | 53 | 0.6% |
| Danish | 20 | 0.2% |
| English | 70 | 0.8% |
| European | 15 | 0.2% |
| French | 5 | 0.1% |
| German | 79 | 0.9% |
| Ghanaian | 6 | 0.1% |
| Greek | 11 | 0.1% |
| Honduran | 4 | 0.0% |
| Irish | 142 | 1.6% |
| Italian | 21 | 0.2% |
| Native Hawaiian | 51 | 0.6% |
| Nigerian | 52 | 0.6% |
| Puerto Rican | 12 | 0.1% |
| Russian | 10 | 0.1% |
| Scotch-Irish | 16 | 0.2% |
| Scottish | 44 | 0.5% |
| Spanish | 4 | 0.0% |
| Subsaharan African | 88 | 1.0% |
| Ukrainian | 5 | 0.1% | View All 25 Rows |
Immigrants in Claiborne County
The most numerous immigrant groups reported in Claiborne County came from Africa (78 | 0.9%), Western Africa (78 | 0.9%), Nigeria (64 | 0.7%), Ghana (14 | 0.2%), and Asia (11 | 0.1%), together accounting for 2.7% of all Claiborne County residents.
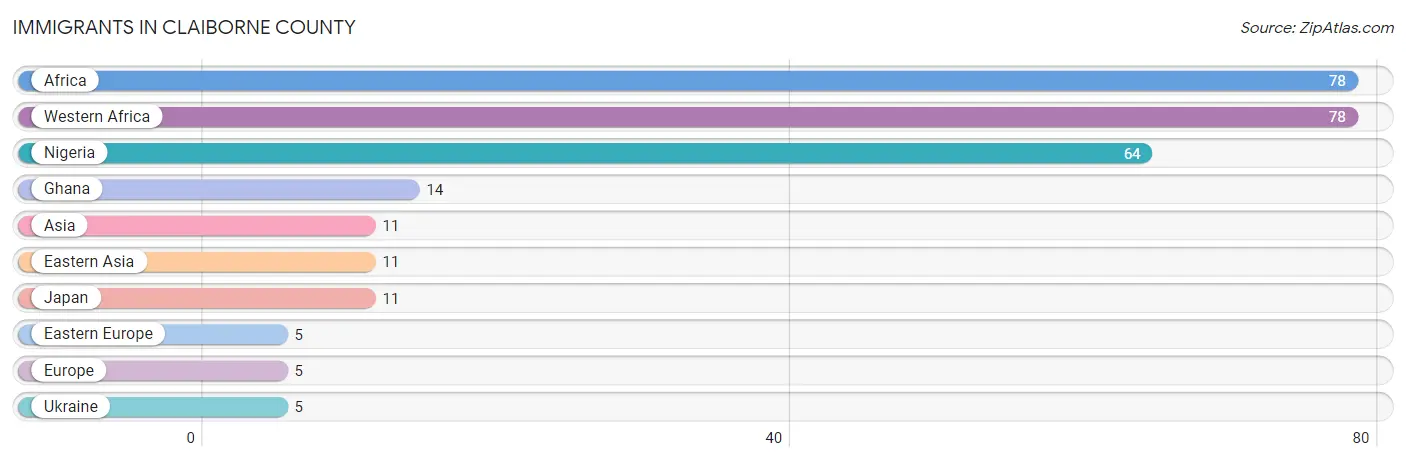
| Immigration Origin | # Population | % Population |
| Africa | 78 | 0.9% |
| Asia | 11 | 0.1% |
| Eastern Asia | 11 | 0.1% |
| Eastern Europe | 5 | 0.1% |
| Europe | 5 | 0.1% |
| Ghana | 14 | 0.2% |
| Japan | 11 | 0.1% |
| Nigeria | 64 | 0.7% |
| Ukraine | 5 | 0.1% |
| Western Africa | 78 | 0.9% | View All 10 Rows |
Sex and Age in Claiborne County
Sex and Age in Claiborne County
The most populous age groups in Claiborne County are 20 to 24 Years (590 | 13.4%) for men and 15 to 19 Years (876 | 18.9%) for women.
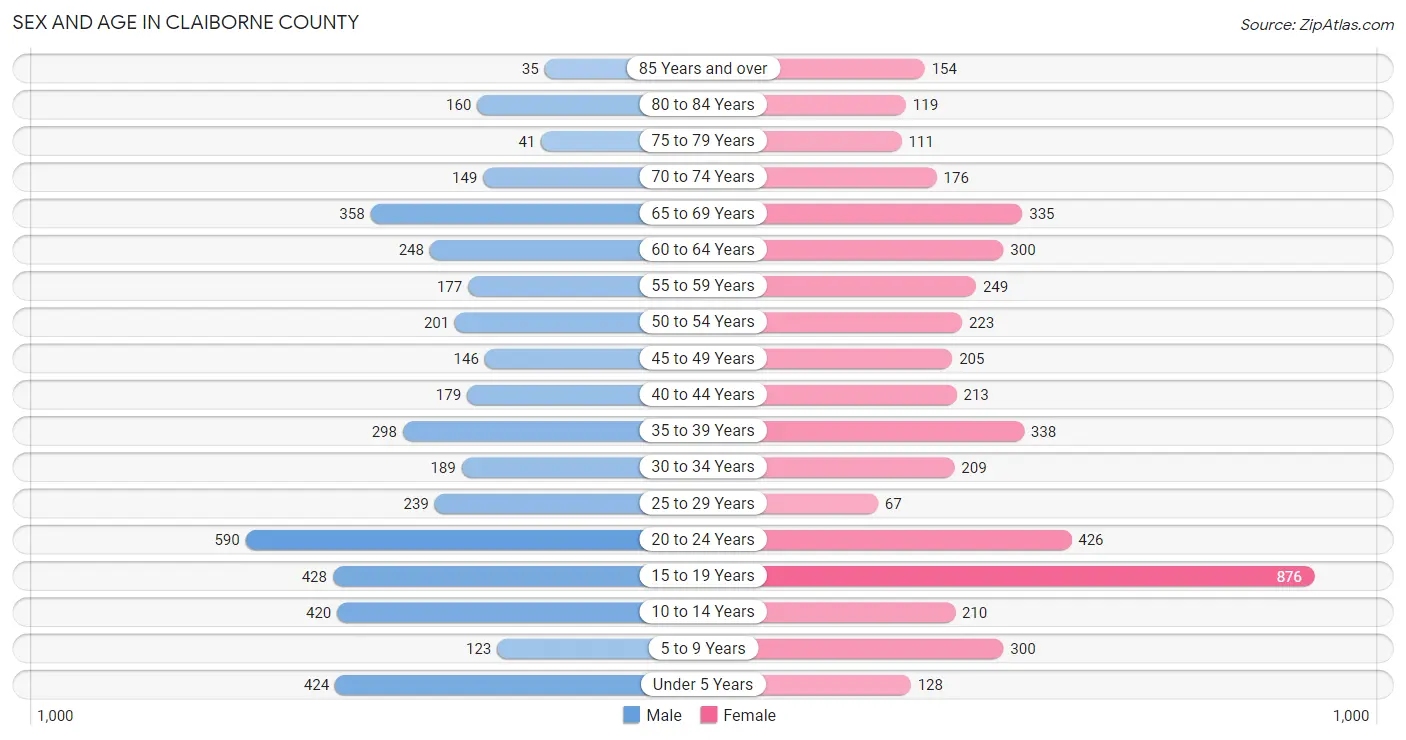
| Age Bracket | Male | Female |
| Under 5 Years | 424 (9.6%) | 128 (2.8%) |
| 5 to 9 Years | 123 (2.8%) | 300 (6.5%) |
| 10 to 14 Years | 420 (9.5%) | 210 (4.5%) |
| 15 to 19 Years | 428 (9.7%) | 876 (18.9%) |
| 20 to 24 Years | 590 (13.4%) | 426 (9.2%) |
| 25 to 29 Years | 239 (5.4%) | 67 (1.4%) |
| 30 to 34 Years | 189 (4.3%) | 209 (4.5%) |
| 35 to 39 Years | 298 (6.8%) | 338 (7.3%) |
| 40 to 44 Years | 179 (4.1%) | 213 (4.6%) |
| 45 to 49 Years | 146 (3.3%) | 205 (4.4%) |
| 50 to 54 Years | 201 (4.6%) | 223 (4.8%) |
| 55 to 59 Years | 177 (4.0%) | 249 (5.4%) |
| 60 to 64 Years | 248 (5.6%) | 300 (6.5%) |
| 65 to 69 Years | 358 (8.1%) | 335 (7.2%) |
| 70 to 74 Years | 149 (3.4%) | 176 (3.8%) |
| 75 to 79 Years | 41 (0.9%) | 111 (2.4%) |
| 80 to 84 Years | 160 (3.6%) | 119 (2.6%) |
| 85 Years and over | 35 (0.8%) | 154 (3.3%) |
| Total | 4,405 (100.0%) | 4,639 (100.0%) |
Families and Households in Claiborne County
Median Family Size in Claiborne County
The median family size in Claiborne County is 3.95 persons per family, with single female/mother families (626 | 37.3%) accounting for the largest median family size of 4.55 persons per family. On the other hand, single male/father families (55 | 3.3%) represent the smallest median family size with 3.24 persons per family.
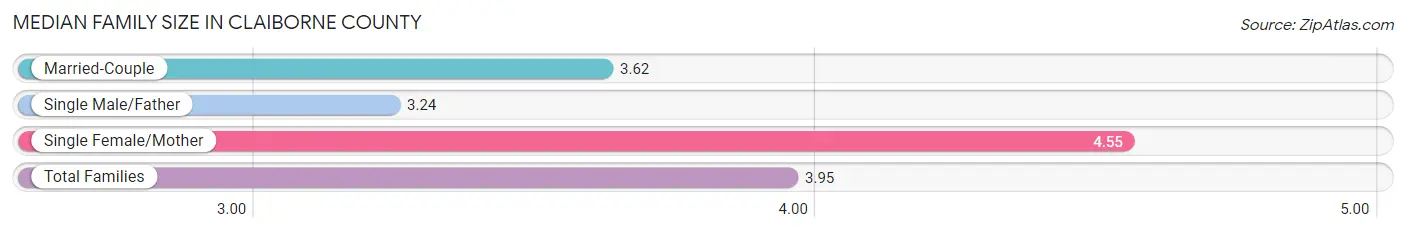
| Family Type | # Families | Family Size |
| Married-Couple | 997 (59.4%) | 3.62 |
| Single Male/Father | 55 (3.3%) | 3.24 |
| Single Female/Mother | 626 (37.3%) | 4.55 |
| Total Families | 1,678 (100.0%) | 3.95 |
Median Household Size in Claiborne County
The median household size in Claiborne County is 3.02 persons per household, with single female/mother households (626 | 23.9%) accounting for the largest median household size of 4.93 persons per household. non-family households (946 | 36.0%) represent the smallest median household size with 1.12 persons per household.

| Household Type | # Households | Household Size |
| Married-Couple | 997 (38.0%) | 3.62 |
| Single Male/Father | 55 (2.1%) | 3.25 |
| Single Female/Mother | 626 (23.9%) | 4.93 |
| Non-family | 946 (36.0%) | 1.12 |
| Total Households | 2,624 (100.0%) | 3.02 |
Household Size by Marriage Status in Claiborne County
Out of a total of 2,624 households in Claiborne County, 1,678 (63.9%) are family households, while 946 (36.0%) are nonfamily households. The most numerous type of family households are 2-person households, comprising 940, and the most common type of nonfamily households are 1-person households, comprising 890.
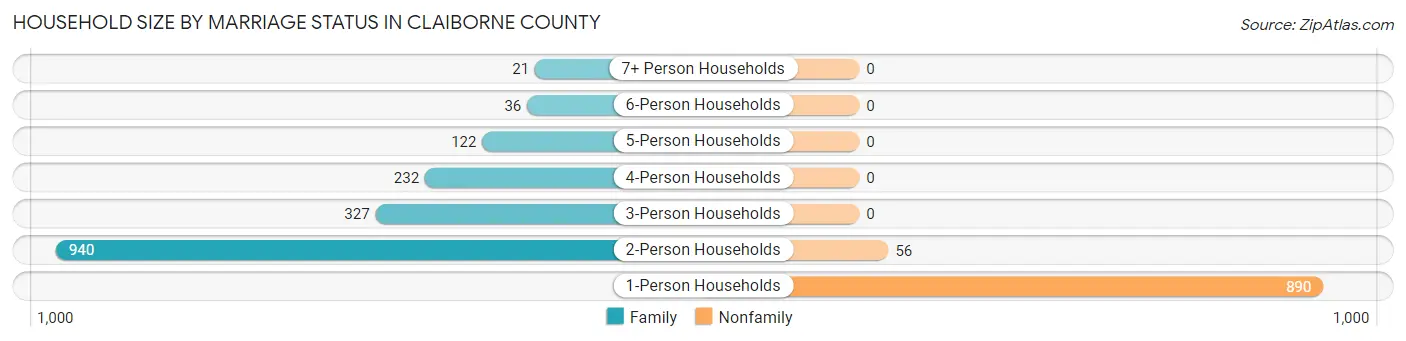
| Household Size | Family Households | Nonfamily Households |
| 1-Person Households | - | 890 (33.9%) |
| 2-Person Households | 940 (35.8%) | 56 (2.1%) |
| 3-Person Households | 327 (12.5%) | 0 (0.0%) |
| 4-Person Households | 232 (8.8%) | 0 (0.0%) |
| 5-Person Households | 122 (4.6%) | 0 (0.0%) |
| 6-Person Households | 36 (1.4%) | 0 (0.0%) |
| 7+ Person Households | 21 (0.8%) | 0 (0.0%) |
| Total | 1,678 (63.9%) | 946 (36.0%) |
Female Fertility in Claiborne County
Fertility by Age in Claiborne County
Average fertility rate in Claiborne County is 17.0 births per 1,000 women. Women in the age bracket of 20 to 34 years have the highest fertility rate with 30.0 births per 1,000 women. Women in the age bracket of 20 to 34 years acount for 51.2% of all women with births.
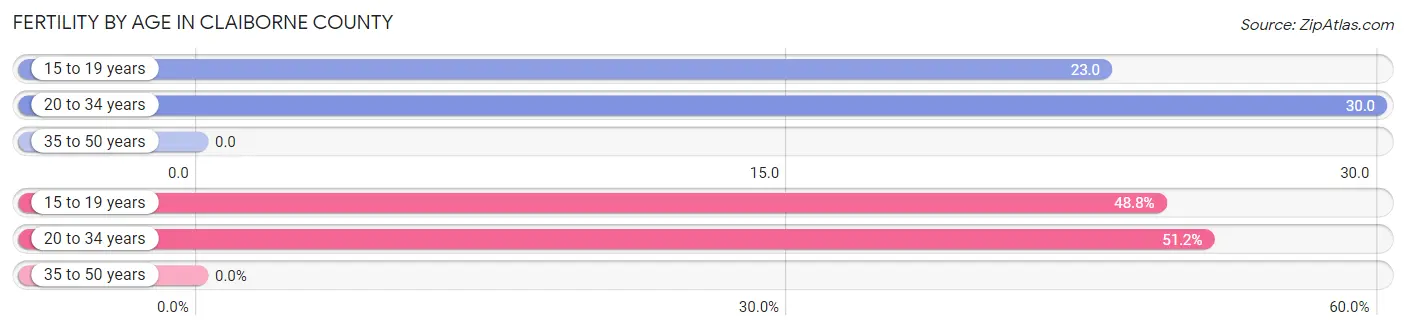
| Age Bracket | Women with Births | Births / 1,000 Women |
| 15 to 19 years | 20 (48.8%) | 23.0 |
| 20 to 34 years | 21 (51.2%) | 30.0 |
| 35 to 50 years | 0 (0.0%) | 0.0 |
| Total | 41 (100.0%) | 17.0 |
Fertility by Age by Marriage Status in Claiborne County
31.7% of women with births (41) in Claiborne County are married. The highest percentage of unmarried women with births falls into 15 to 19 years age bracket with 100.0% of them unmarried at the time of birth, while the lowest percentage of unmarried women with births belong to 20 to 34 years age bracket with 38.1% of them unmarried.
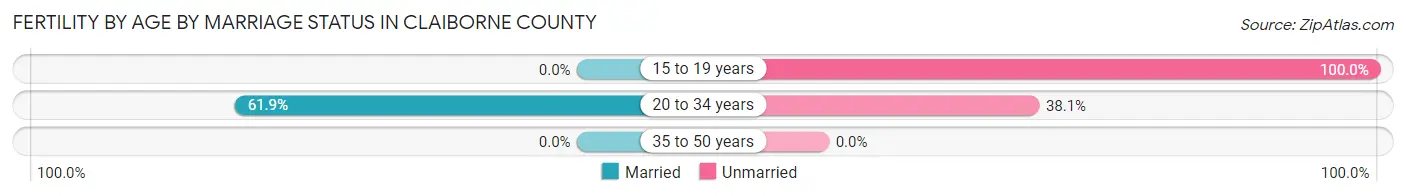
| Age Bracket | Married | Unmarried |
| 15 to 19 years | 0 (0.0%) | 20 (100.0%) |
| 20 to 34 years | 13 (61.9%) | 8 (38.1%) |
| 35 to 50 years | 0 (0.0%) | 0 (0.0%) |
| Total | 13 (31.7%) | 28 (68.3%) |
Fertility by Education in Claiborne County
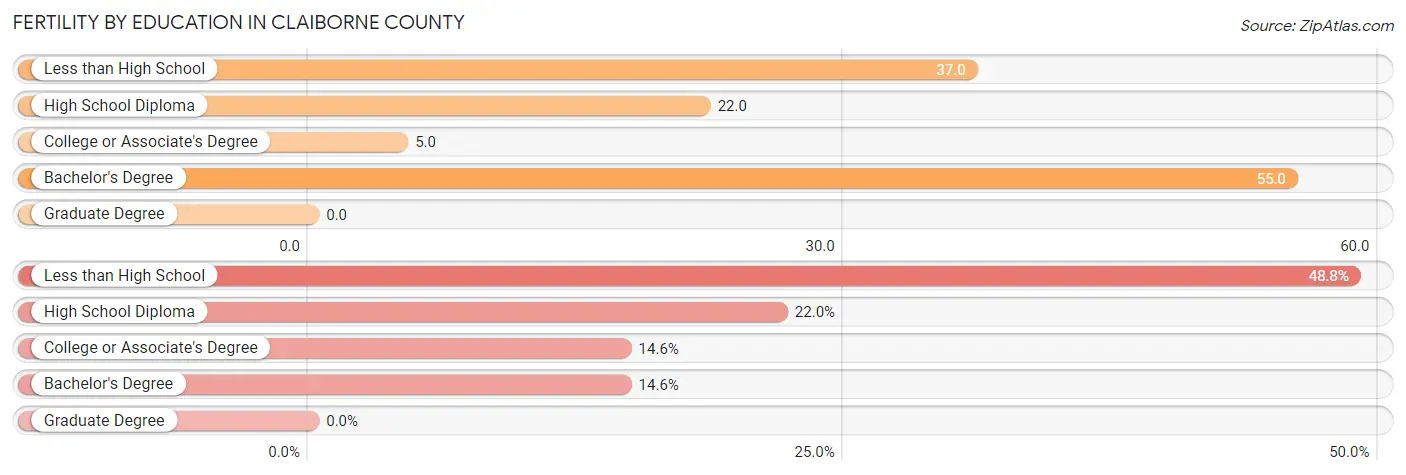
| Educational Attainment | Women with Births | Births / 1,000 Women |
| Less than High School | 20 (48.8%) | 37.0 |
| High School Diploma | 9 (22.0%) | 22.0 |
| College or Associate's Degree | 6 (14.6%) | 5.0 |
| Bachelor's Degree | 6 (14.6%) | 55.0 |
| Graduate Degree | 0 (0.0%) | 0.0 |
| Total | 41 (100.0%) | 17.0 |
Fertility by Education by Marriage Status in Claiborne County
68.3% of women with births in Claiborne County are unmarried. Women with the educational attainment of college or associate's degree are most likely to be married with 100.0% of them married at childbirth, while women with the educational attainment of less than high school are least likely to be married with 100.0% of them unmarried at childbirth.
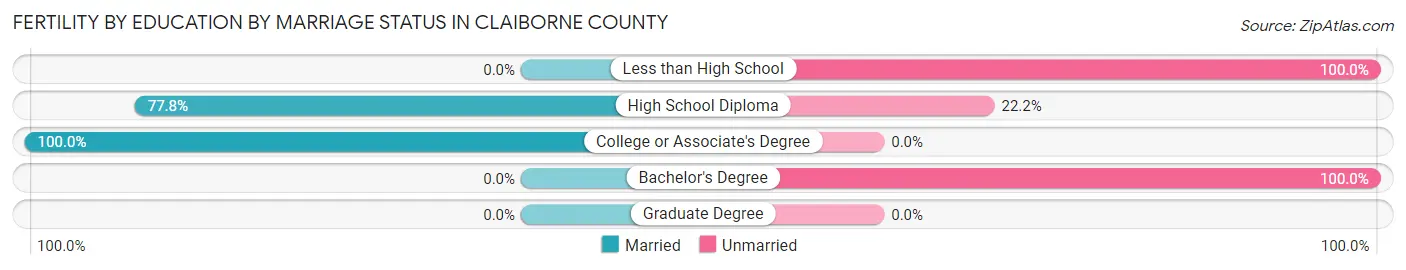
| Educational Attainment | Married | Unmarried |
| Less than High School | 0 (0.0%) | 20 (100.0%) |
| High School Diploma | 7 (77.8%) | 2 (22.2%) |
| College or Associate's Degree | 6 (100.0%) | 0 (0.0%) |
| Bachelor's Degree | 0 (0.0%) | 6 (100.0%) |
| Graduate Degree | 0 (0.0%) | 0 (0.0%) |
| Total | 13 (31.7%) | 28 (68.3%) |
Employment Characteristics in Claiborne County
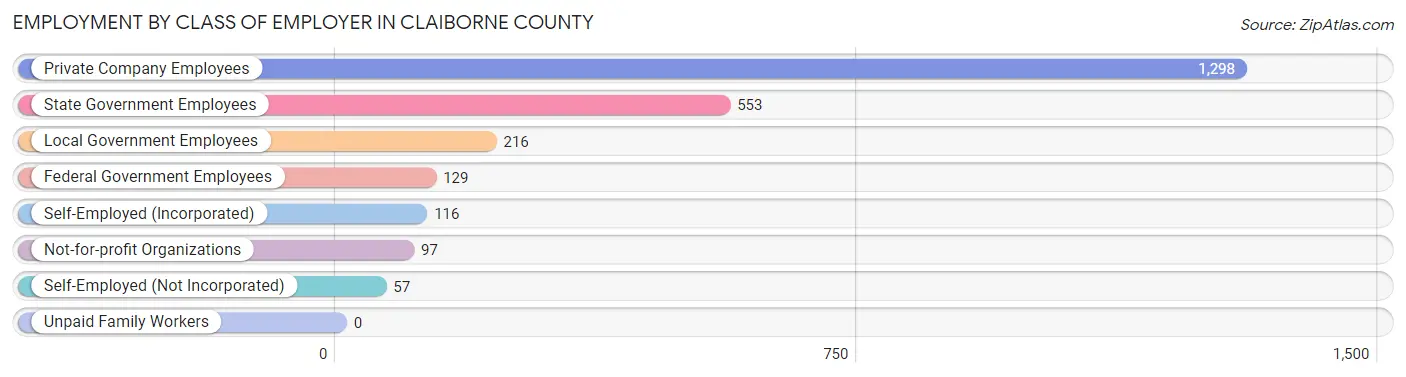
Employment by Class of Employer in Claiborne County
Among the 2,466 employed individuals in Claiborne County, private company employees (1,298 | 52.6%), state government employees (553 | 22.4%), and local government employees (216 | 8.8%) make up the most common classes of employment.
| Employer Class | # Employees | % Employees |
| Private Company Employees | 1,298 | 52.6% |
| Self-Employed (Incorporated) | 116 | 4.7% |
| Self-Employed (Not Incorporated) | 57 | 2.3% |
| Not-for-profit Organizations | 97 | 3.9% |
| Local Government Employees | 216 | 8.8% |
| State Government Employees | 553 | 22.4% |
| Federal Government Employees | 129 | 5.2% |
| Unpaid Family Workers | 0 | 0.0% |
| Total | 2,466 | 100.0% |
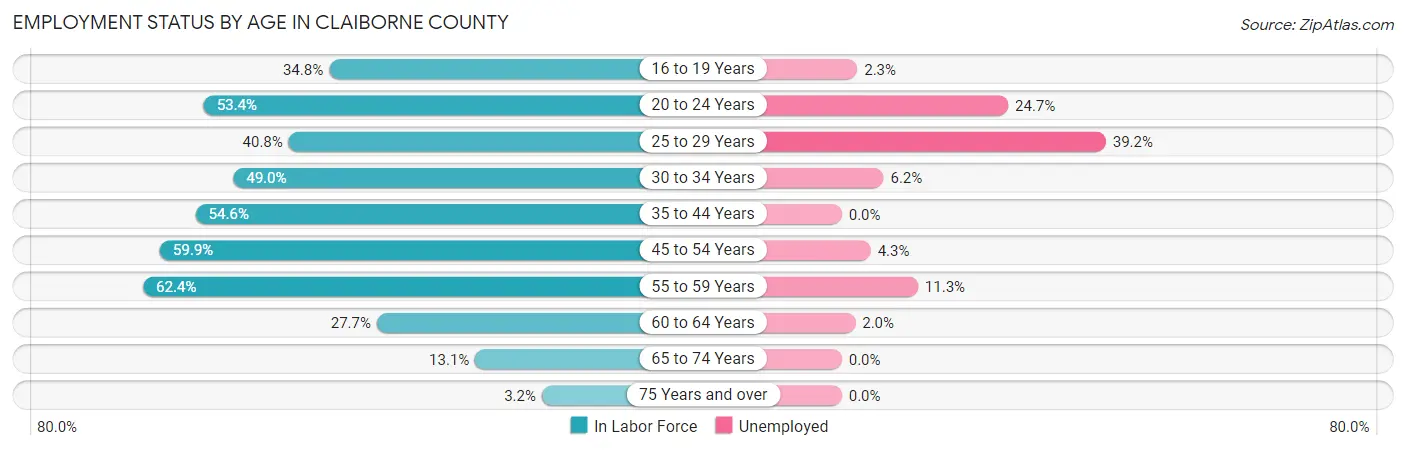
Employment Status by Age in Claiborne County
According to the labor force statistics for Claiborne County, out of the total population over 16 years of age (7,262), 39.3% or 2,854 individuals are in the labor force, with 9.0% or 257 of them unemployed. The age group with the highest labor force participation rate is 55 to 59 years, with 62.4% or 266 individuals in the labor force. Within the labor force, the 25 to 29 years age range has the highest percentage of unemployed individuals, with 39.2% or 49 of them being unemployed.
| Age Bracket | In Labor Force | Unemployed |
| 16 to 19 Years | 392 (34.8%) | 9 (2.3%) |
| 20 to 24 Years | 543 (53.4%) | 134 (24.7%) |
| 25 to 29 Years | 125 (40.8%) | 49 (39.2%) |
| 30 to 34 Years | 195 (49.0%) | 12 (6.2%) |
| 35 to 44 Years | 561 (54.6%) | 0 (0.0%) |
| 45 to 54 Years | 464 (59.9%) | 20 (4.3%) |
| 55 to 59 Years | 266 (62.4%) | 30 (11.3%) |
| 60 to 64 Years | 152 (27.7%) | 3 (2.0%) |
| 65 to 74 Years | 133 (13.1%) | 0 (0.0%) |
| 75 Years and over | 20 (3.2%) | 0 (0.0%) |
| Total | 2,854 (39.3%) | 257 (9.0%) |
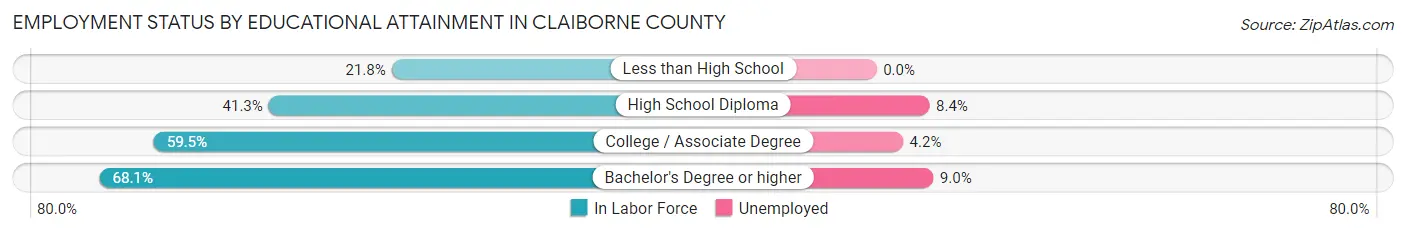
Employment Status by Educational Attainment in Claiborne County
According to labor force statistics for Claiborne County, 50.6% of individuals (1,761) out of the total population between 25 and 64 years of age (3,481) are in the labor force, with 6.5% or 114 of them being unemployed. The group with the highest labor force participation rate are those with the educational attainment of bachelor's degree or higher, with 68.1% or 531 individuals in the labor force. Within the labor force, individuals with bachelor's degree or higher education have the highest percentage of unemployment, with 9.0% or 48 of them being unemployed.
| Educational Attainment | In Labor Force | Unemployed |
| Less than High School | 104 (21.8%) | 0 (0.0%) |
| High School Diploma | 443 (41.3%) | 90 (8.4%) |
| College / Associate Degree | 685 (59.5%) | 48 (4.2%) |
| Bachelor's Degree or higher | 531 (68.1%) | 70 (9.0%) |
| Total | 1,761 (50.6%) | 226 (6.5%) |
Employment Occupations by Sex in Claiborne County
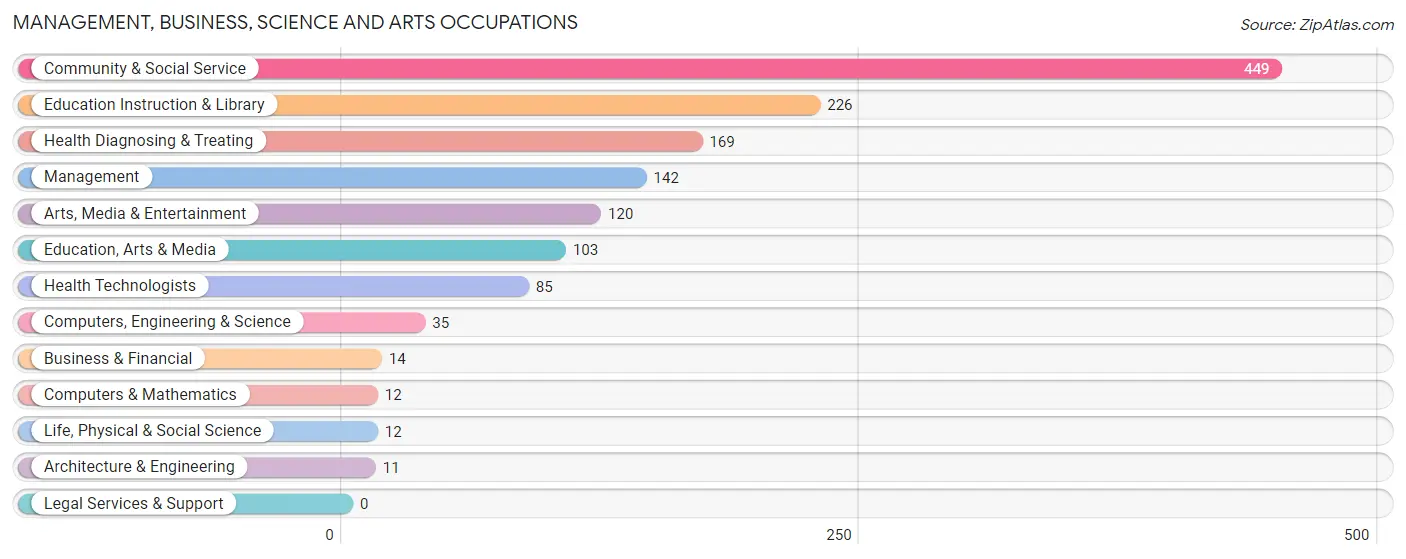
Management, Business, Science and Arts Occupations
The most common Management, Business, Science and Arts occupations in Claiborne County are Community & Social Service (449 | 17.4%), Education Instruction & Library (226 | 8.8%), Health Diagnosing & Treating (169 | 6.6%), Management (142 | 5.5%), and Arts, Media & Entertainment (120 | 4.6%).
Management, Business, Science and Arts Occupations by Sex
Within the Management, Business, Science and Arts occupations in Claiborne County, the most male-oriented occupations are Business & Financial (100.0%), Computers & Mathematics (100.0%), and Architecture & Engineering (100.0%), while the most female-oriented occupations are Life, Physical & Social Science (100.0%), Health Diagnosing & Treating (91.7%), and Education, Arts & Media (90.3%).
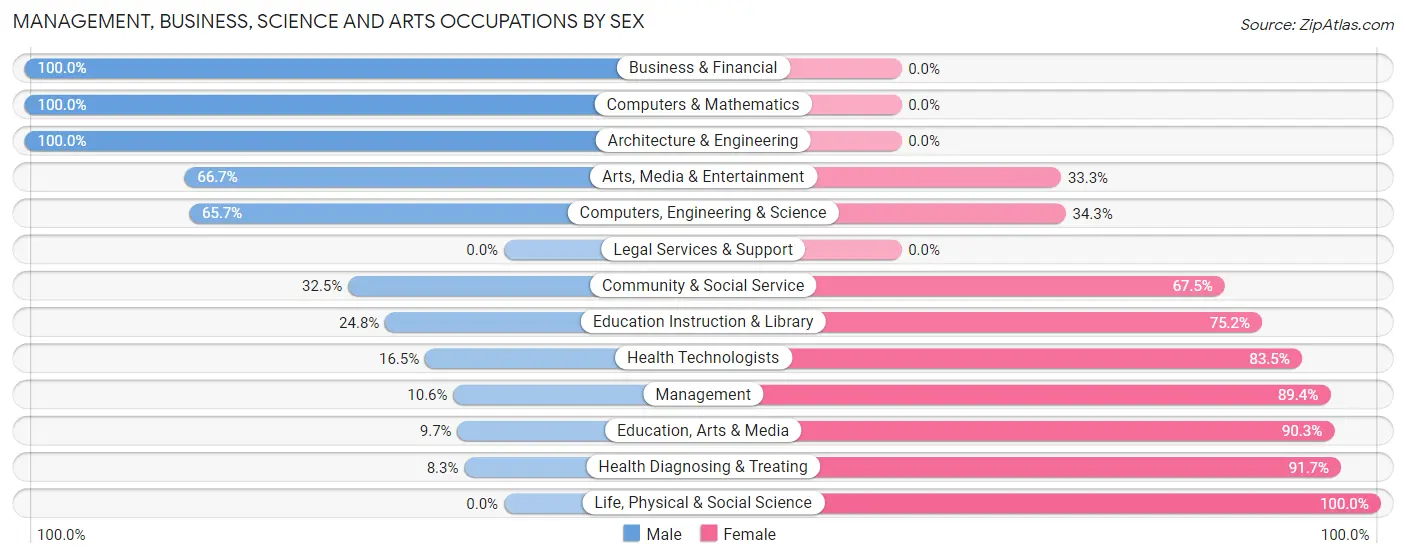
| Occupation | Male | Female |
| Management | 15 (10.6%) | 127 (89.4%) |
| Business & Financial | 14 (100.0%) | 0 (0.0%) |
| Computers, Engineering & Science | 23 (65.7%) | 12 (34.3%) |
| Computers & Mathematics | 12 (100.0%) | 0 (0.0%) |
| Architecture & Engineering | 11 (100.0%) | 0 (0.0%) |
| Life, Physical & Social Science | 0 (0.0%) | 12 (100.0%) |
| Community & Social Service | 146 (32.5%) | 303 (67.5%) |
| Education, Arts & Media | 10 (9.7%) | 93 (90.3%) |
| Legal Services & Support | 0 (0.0%) | 0 (0.0%) |
| Education Instruction & Library | 56 (24.8%) | 170 (75.2%) |
| Arts, Media & Entertainment | 80 (66.7%) | 40 (33.3%) |
| Health Diagnosing & Treating | 14 (8.3%) | 155 (91.7%) |
| Health Technologists | 14 (16.5%) | 71 (83.5%) |
| Total (Category) | 212 (26.2%) | 597 (73.8%) |
| Total (Overall) | 1,115 (43.2%) | 1,463 (56.8%) |
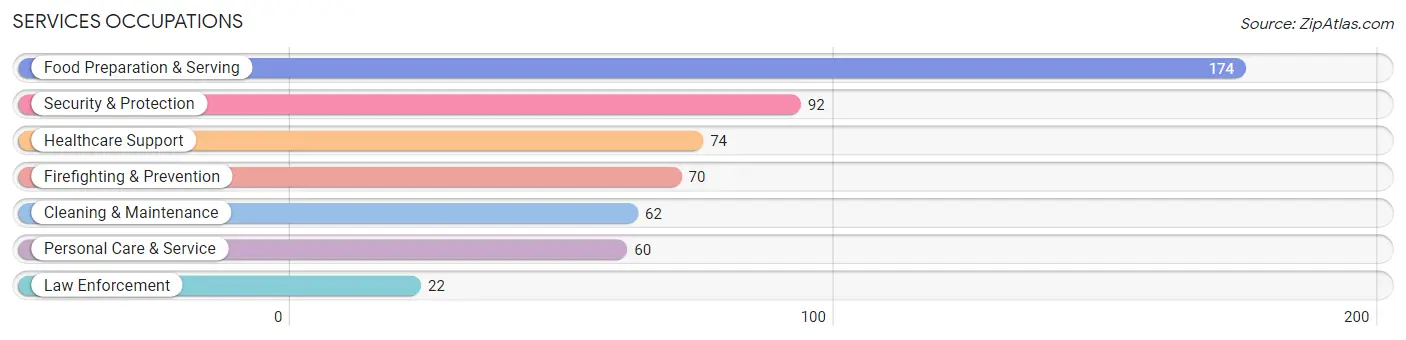
Services Occupations
The most common Services occupations in Claiborne County are Food Preparation & Serving (174 | 6.8%), Security & Protection (92 | 3.6%), Healthcare Support (74 | 2.9%), Firefighting & Prevention (70 | 2.7%), and Cleaning & Maintenance (62 | 2.4%).
Services Occupations by Sex
Within the Services occupations in Claiborne County, the most male-oriented occupations are Cleaning & Maintenance (59.7%), Law Enforcement (59.1%), and Food Preparation & Serving (52.3%), while the most female-oriented occupations are Healthcare Support (100.0%), Firefighting & Prevention (90.0%), and Personal Care & Service (81.7%).
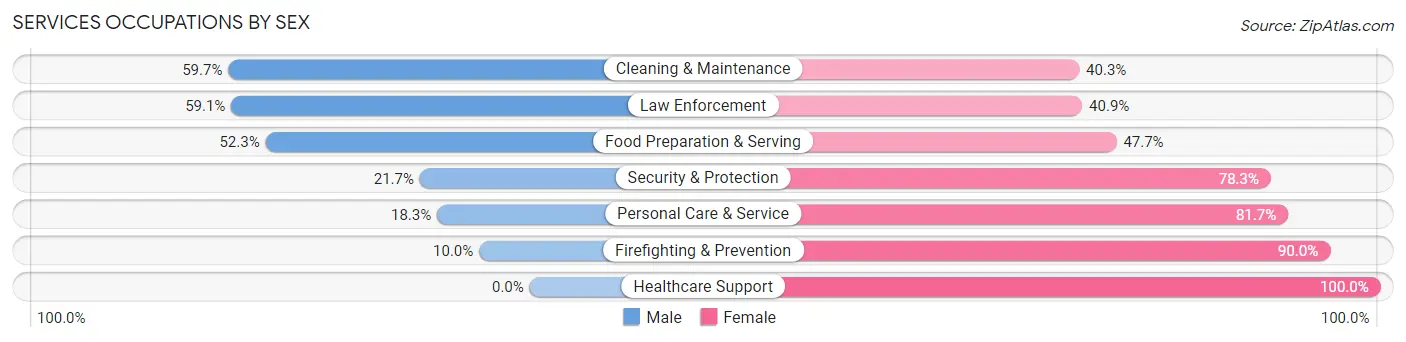
| Occupation | Male | Female |
| Healthcare Support | 0 (0.0%) | 74 (100.0%) |
| Security & Protection | 20 (21.7%) | 72 (78.3%) |
| Firefighting & Prevention | 7 (10.0%) | 63 (90.0%) |
| Law Enforcement | 13 (59.1%) | 9 (40.9%) |
| Food Preparation & Serving | 91 (52.3%) | 83 (47.7%) |
| Cleaning & Maintenance | 37 (59.7%) | 25 (40.3%) |
| Personal Care & Service | 11 (18.3%) | 49 (81.7%) |
| Total (Category) | 159 (34.4%) | 303 (65.6%) |
| Total (Overall) | 1,115 (43.2%) | 1,463 (56.8%) |
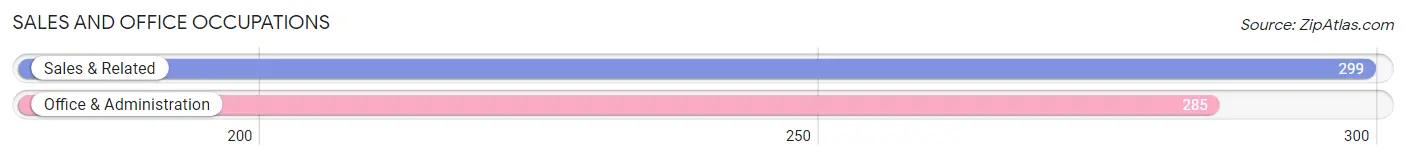
Sales and Office Occupations
The most common Sales and Office occupations in Claiborne County are Sales & Related (299 | 11.6%), and Office & Administration (285 | 11.1%).
Sales and Office Occupations by Sex
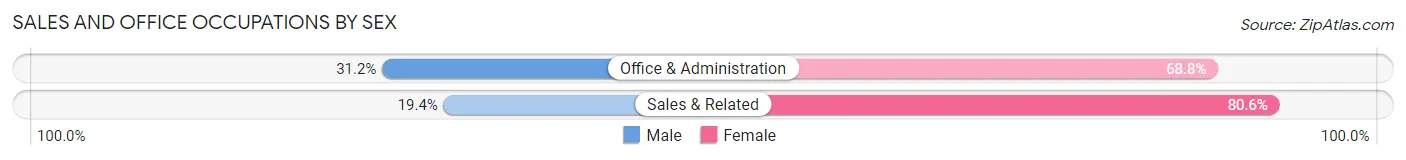
| Occupation | Male | Female |
| Sales & Related | 58 (19.4%) | 241 (80.6%) |
| Office & Administration | 89 (31.2%) | 196 (68.8%) |
| Total (Category) | 147 (25.2%) | 437 (74.8%) |
| Total (Overall) | 1,115 (43.2%) | 1,463 (56.8%) |
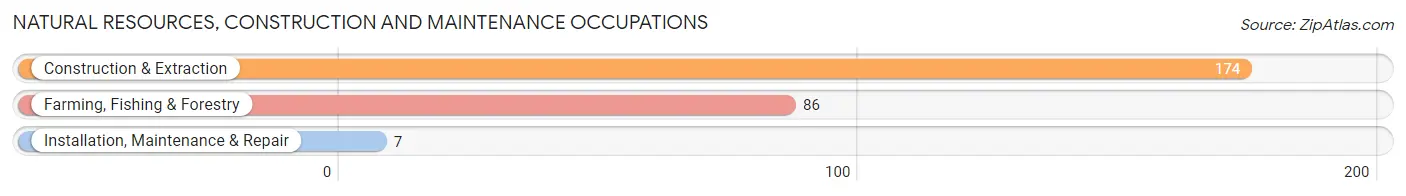
Natural Resources, Construction and Maintenance Occupations
The most common Natural Resources, Construction and Maintenance occupations in Claiborne County are Construction & Extraction (174 | 6.8%), Farming, Fishing & Forestry (86 | 3.3%), and Installation, Maintenance & Repair (7 | 0.3%).
Natural Resources, Construction and Maintenance Occupations by Sex
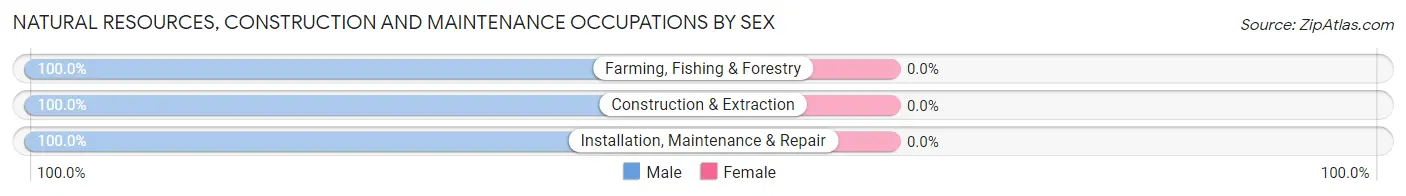
| Occupation | Male | Female |
| Farming, Fishing & Forestry | 86 (100.0%) | 0 (0.0%) |
| Construction & Extraction | 174 (100.0%) | 0 (0.0%) |
| Installation, Maintenance & Repair | 7 (100.0%) | 0 (0.0%) |
| Total (Category) | 267 (100.0%) | 0 (0.0%) |
| Total (Overall) | 1,115 (43.2%) | 1,463 (56.8%) |
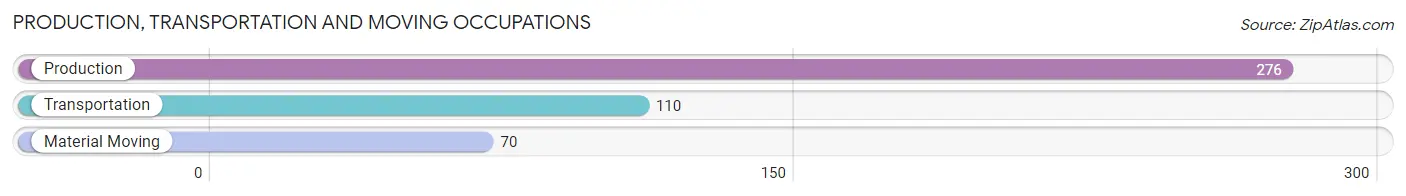
Production, Transportation and Moving Occupations
The most common Production, Transportation and Moving occupations in Claiborne County are Production (276 | 10.7%), Transportation (110 | 4.3%), and Material Moving (70 | 2.7%).
Production, Transportation and Moving Occupations by Sex
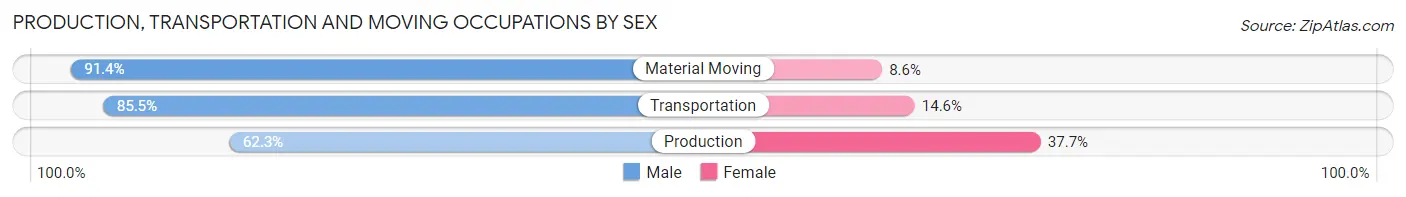
| Occupation | Male | Female |
| Production | 172 (62.3%) | 104 (37.7%) |
| Transportation | 94 (85.5%) | 16 (14.5%) |
| Material Moving | 64 (91.4%) | 6 (8.6%) |
| Total (Category) | 330 (72.4%) | 126 (27.6%) |
| Total (Overall) | 1,115 (43.2%) | 1,463 (56.8%) |
Employment Industries by Sex in Claiborne County
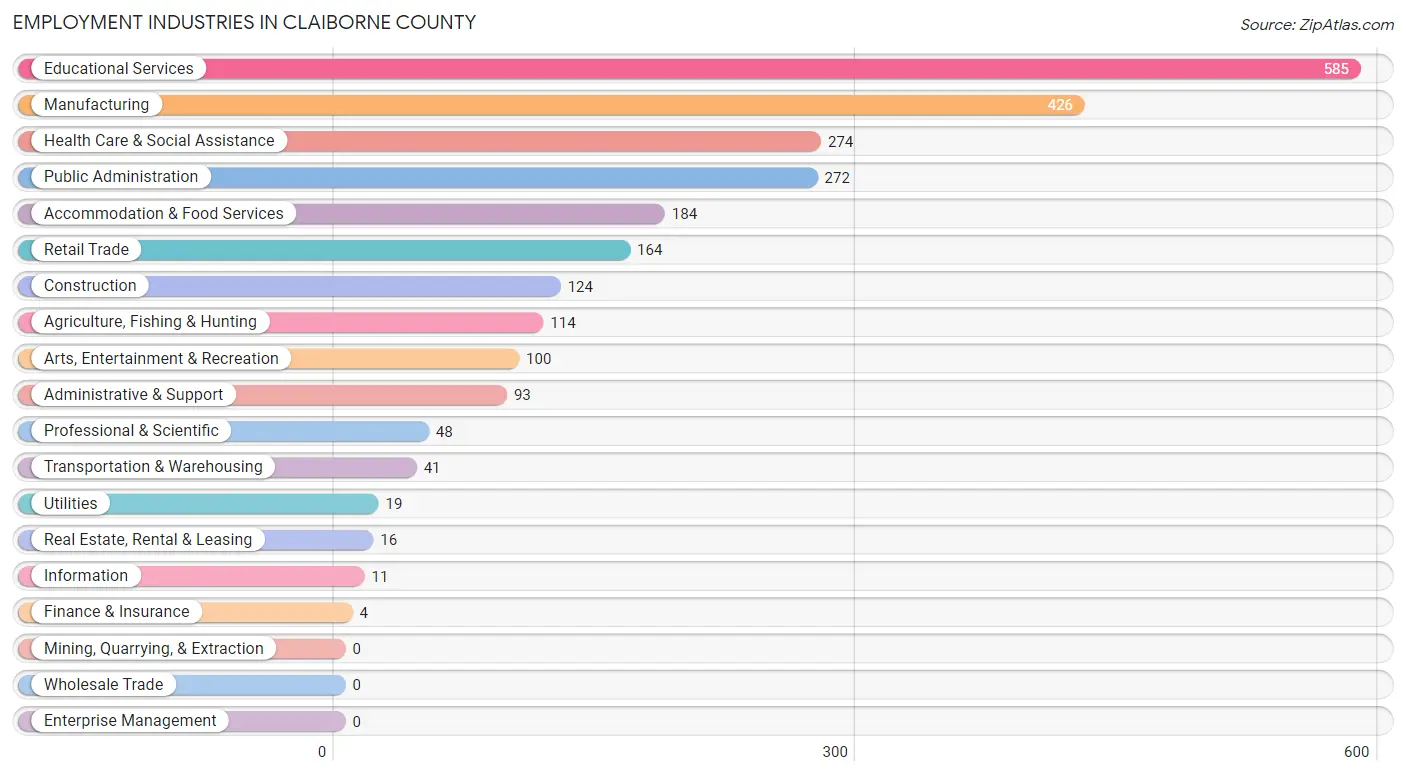
Employment Industries in Claiborne County
The major employment industries in Claiborne County include Educational Services (585 | 22.7%), Manufacturing (426 | 16.5%), Health Care & Social Assistance (274 | 10.6%), Public Administration (272 | 10.5%), and Accommodation & Food Services (184 | 7.1%).
Employment Industries by Sex in Claiborne County
The Claiborne County industries that see more men than women are Construction (100.0%), Transportation & Warehousing (100.0%), and Utilities (100.0%), whereas the industries that tend to have a higher number of women are Information (100.0%), Finance & Insurance (100.0%), and Health Care & Social Assistance (96.7%).
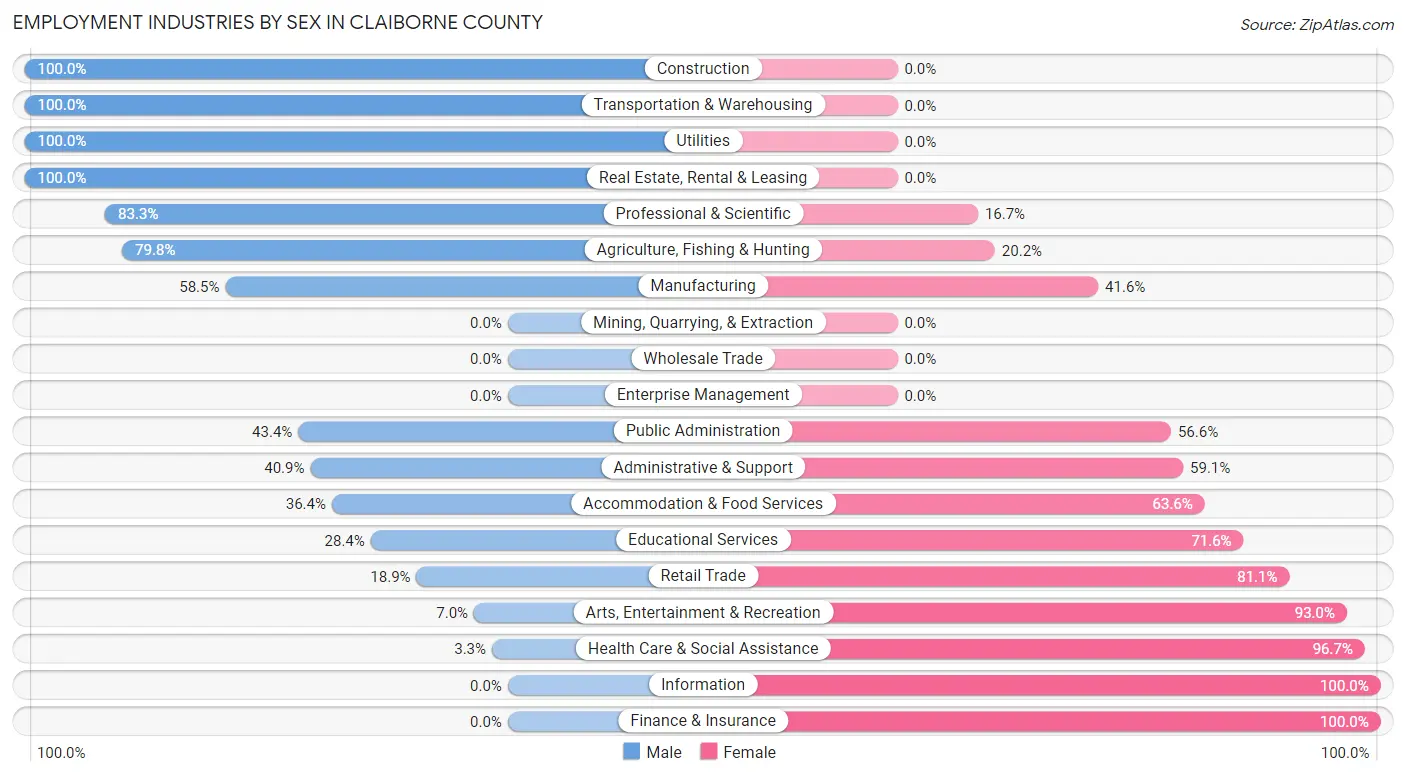
| Industry | Male | Female |
| Agriculture, Fishing & Hunting | 91 (79.8%) | 23 (20.2%) |
| Mining, Quarrying, & Extraction | 0 (0.0%) | 0 (0.0%) |
| Construction | 124 (100.0%) | 0 (0.0%) |
| Manufacturing | 249 (58.5%) | 177 (41.5%) |
| Wholesale Trade | 0 (0.0%) | 0 (0.0%) |
| Retail Trade | 31 (18.9%) | 133 (81.1%) |
| Transportation & Warehousing | 41 (100.0%) | 0 (0.0%) |
| Utilities | 19 (100.0%) | 0 (0.0%) |
| Information | 0 (0.0%) | 11 (100.0%) |
| Finance & Insurance | 0 (0.0%) | 4 (100.0%) |
| Real Estate, Rental & Leasing | 16 (100.0%) | 0 (0.0%) |
| Professional & Scientific | 40 (83.3%) | 8 (16.7%) |
| Enterprise Management | 0 (0.0%) | 0 (0.0%) |
| Administrative & Support | 38 (40.9%) | 55 (59.1%) |
| Educational Services | 166 (28.4%) | 419 (71.6%) |
| Health Care & Social Assistance | 9 (3.3%) | 265 (96.7%) |
| Arts, Entertainment & Recreation | 7 (7.0%) | 93 (93.0%) |
| Accommodation & Food Services | 67 (36.4%) | 117 (63.6%) |
| Public Administration | 118 (43.4%) | 154 (56.6%) |
| Total | 1,115 (43.2%) | 1,463 (56.8%) |
Education in Claiborne County
School Enrollment in Claiborne County
The most common levels of schooling among the 2,979 students in Claiborne County are college / undergraduate (1,304 | 43.8%), middle school (573 | 19.2%), and high school (450 | 15.1%).
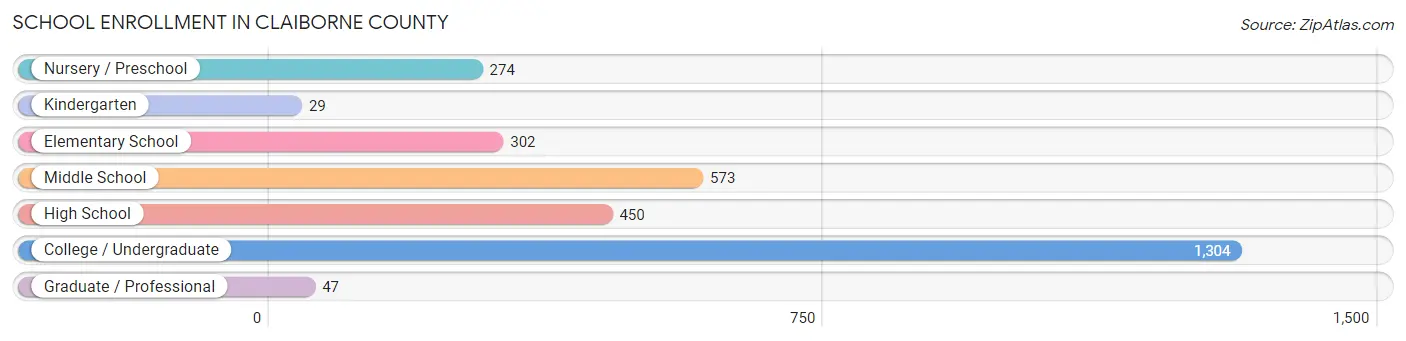
| School Level | # Students | % Students |
| Nursery / Preschool | 274 | 9.2% |
| Kindergarten | 29 | 1.0% |
| Elementary School | 302 | 10.1% |
| Middle School | 573 | 19.2% |
| High School | 450 | 15.1% |
| College / Undergraduate | 1,304 | 43.8% |
| Graduate / Professional | 47 | 1.6% |
| Total | 2,979 | 100.0% |
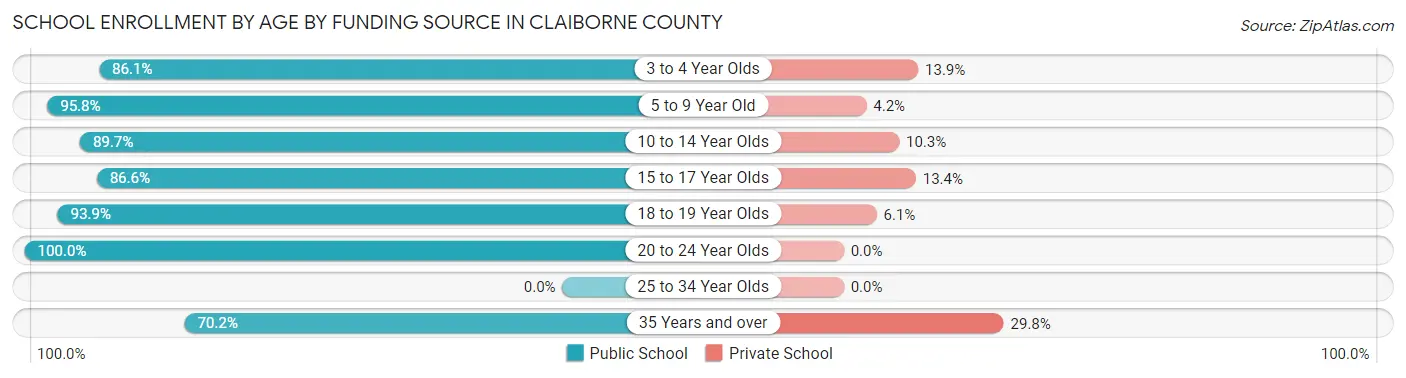
School Enrollment by Age by Funding Source in Claiborne County
Out of a total of 2,979 students who are enrolled in schools in Claiborne County, 229 (7.7%) attend a private institution, while the remaining 2,750 (92.3%) are enrolled in public schools. The age group of 35 years and over has the highest likelihood of being enrolled in private schools, with 28 (29.8% in the age bracket) enrolled. Conversely, the age group of 20 to 24 year olds has the lowest likelihood of being enrolled in a private school, with 645 (100.0% in the age bracket) attending a public institution.
| Age Bracket | Public School | Private School |
| 3 to 4 Year Olds | 236 (86.1%) | 38 (13.9%) |
| 5 to 9 Year Old | 317 (95.8%) | 14 (4.2%) |
| 10 to 14 Year Olds | 565 (89.7%) | 65 (10.3%) |
| 15 to 17 Year Olds | 264 (86.6%) | 41 (13.4%) |
| 18 to 19 Year Olds | 657 (93.9%) | 43 (6.1%) |
| 20 to 24 Year Olds | 645 (100.0%) | 0 (0.0%) |
| 25 to 34 Year Olds | 0 (0.0%) | 0 (0.0%) |
| 35 Years and over | 66 (70.2%) | 28 (29.8%) |
| Total | 2,750 (92.3%) | 229 (7.7%) |
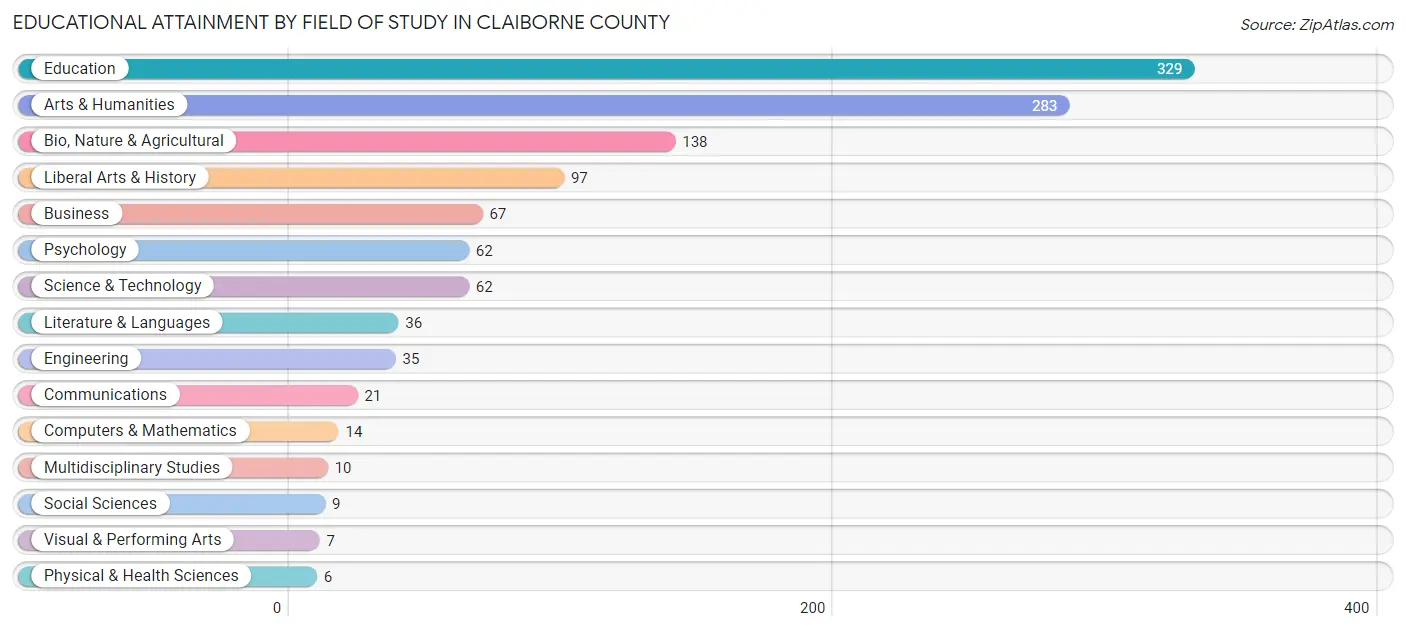
Educational Attainment by Field of Study in Claiborne County
Education (329 | 28.0%), arts & humanities (283 | 24.1%), bio, nature & agricultural (138 | 11.7%), liberal arts & history (97 | 8.3%), and business (67 | 5.7%) are the most common fields of study among 1,176 individuals in Claiborne County who have obtained a bachelor's degree or higher.
| Field of Study | # Graduates | % Graduates |
| Computers & Mathematics | 14 | 1.2% |
| Bio, Nature & Agricultural | 138 | 11.7% |
| Physical & Health Sciences | 6 | 0.5% |
| Psychology | 62 | 5.3% |
| Social Sciences | 9 | 0.8% |
| Engineering | 35 | 3.0% |
| Multidisciplinary Studies | 10 | 0.9% |
| Science & Technology | 62 | 5.3% |
| Business | 67 | 5.7% |
| Education | 329 | 28.0% |
| Literature & Languages | 36 | 3.1% |
| Liberal Arts & History | 97 | 8.3% |
| Visual & Performing Arts | 7 | 0.6% |
| Communications | 21 | 1.8% |
| Arts & Humanities | 283 | 24.1% |
| Total | 1,176 | 100.0% |
Transportation & Commute in Claiborne County
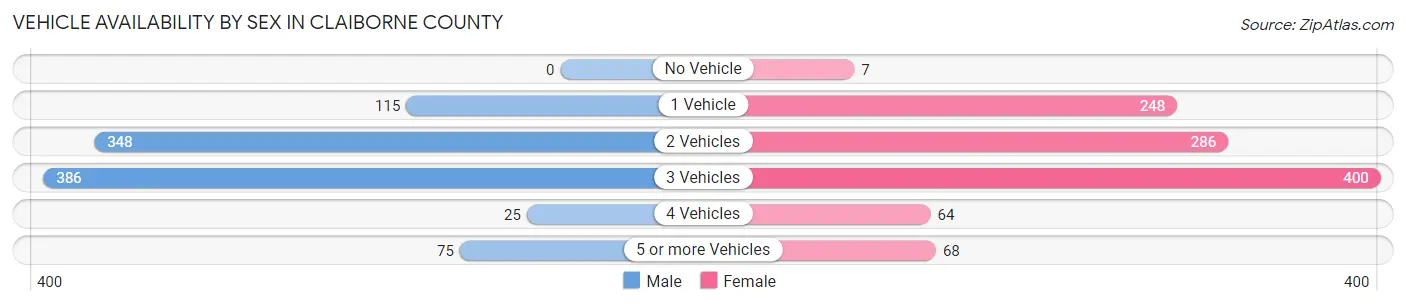
Vehicle Availability by Sex in Claiborne County
The most prevalent vehicle ownership categories in Claiborne County are males with 3 vehicles (386, accounting for 40.7%) and females with 3 vehicles (400, making up 36.0%).
| Vehicles Available | Male | Female |
| No Vehicle | 0 (0.0%) | 7 (0.6%) |
| 1 Vehicle | 115 (12.1%) | 248 (23.1%) |
| 2 Vehicles | 348 (36.7%) | 286 (26.7%) |
| 3 Vehicles | 386 (40.7%) | 400 (37.3%) |
| 4 Vehicles | 25 (2.6%) | 64 (6.0%) |
| 5 or more Vehicles | 75 (7.9%) | 68 (6.3%) |
| Total | 949 (100.0%) | 1,073 (100.0%) |
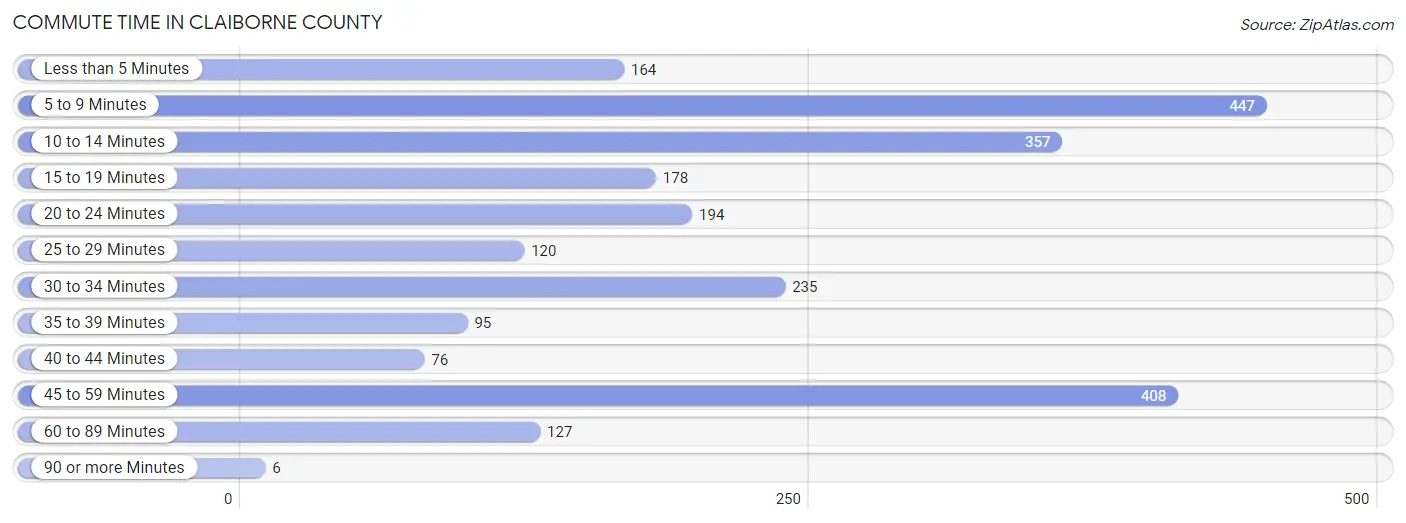
Commute Time in Claiborne County
The most frequently occuring commute durations in Claiborne County are 5 to 9 minutes (447 commuters, 18.6%), 45 to 59 minutes (408 commuters, 17.0%), and 10 to 14 minutes (357 commuters, 14.8%).
| Commute Time | # Commuters | % Commuters |
| Less than 5 Minutes | 164 | 6.8% |
| 5 to 9 Minutes | 447 | 18.6% |
| 10 to 14 Minutes | 357 | 14.8% |
| 15 to 19 Minutes | 178 | 7.4% |
| 20 to 24 Minutes | 194 | 8.1% |
| 25 to 29 Minutes | 120 | 5.0% |
| 30 to 34 Minutes | 235 | 9.8% |
| 35 to 39 Minutes | 95 | 4.0% |
| 40 to 44 Minutes | 76 | 3.2% |
| 45 to 59 Minutes | 408 | 17.0% |
| 60 to 89 Minutes | 127 | 5.3% |
| 90 or more Minutes | 6 | 0.3% |
Commute Time by Sex in Claiborne County
The most common commute times in Claiborne County are 5 to 9 minutes (186 commuters, 17.0%) for males and 5 to 9 minutes (261 commuters, 19.9%) for females.
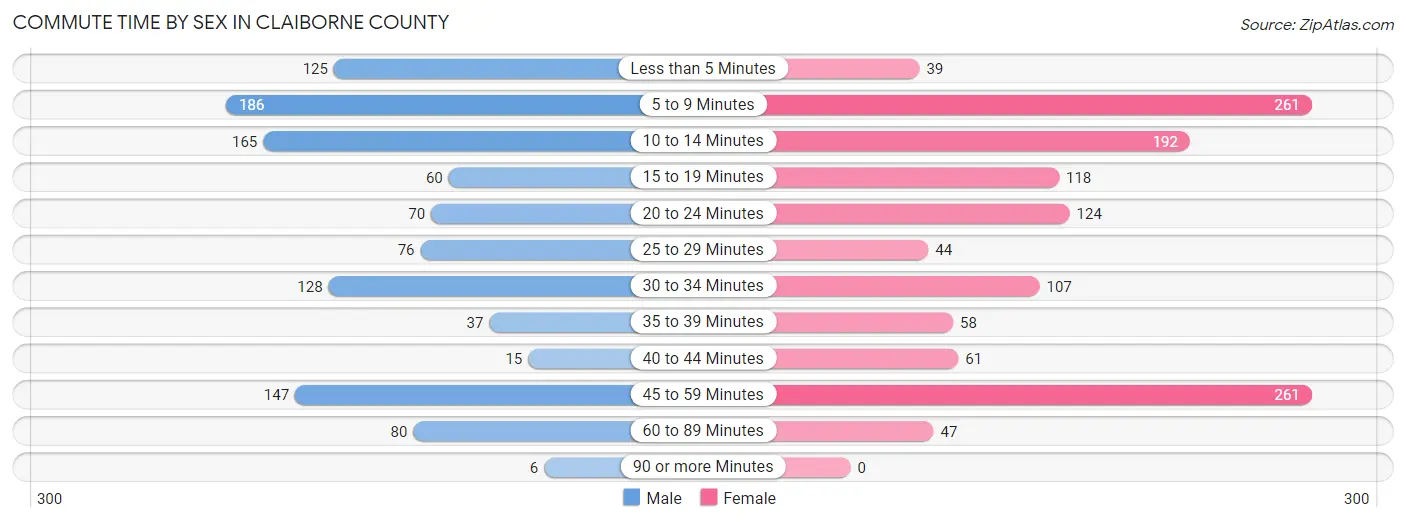
| Commute Time | Male | Female |
| Less than 5 Minutes | 125 (11.4%) | 39 (3.0%) |
| 5 to 9 Minutes | 186 (17.0%) | 261 (19.9%) |
| 10 to 14 Minutes | 165 (15.1%) | 192 (14.6%) |
| 15 to 19 Minutes | 60 (5.5%) | 118 (9.0%) |
| 20 to 24 Minutes | 70 (6.4%) | 124 (9.5%) |
| 25 to 29 Minutes | 76 (6.9%) | 44 (3.4%) |
| 30 to 34 Minutes | 128 (11.7%) | 107 (8.2%) |
| 35 to 39 Minutes | 37 (3.4%) | 58 (4.4%) |
| 40 to 44 Minutes | 15 (1.4%) | 61 (4.6%) |
| 45 to 59 Minutes | 147 (13.4%) | 261 (19.9%) |
| 60 to 89 Minutes | 80 (7.3%) | 47 (3.6%) |
| 90 or more Minutes | 6 (0.5%) | 0 (0.0%) |
Time of Departure to Work by Sex in Claiborne County
The most frequent times of departure to work in Claiborne County are 6:00 AM to 6:29 AM (196, 17.9%) for males and 7:00 AM to 7:29 AM (237, 18.1%) for females.

| Time of Departure | Male | Female |
| 12:00 AM to 4:59 AM | 169 (15.4%) | 15 (1.1%) |
| 5:00 AM to 5:29 AM | 98 (8.9%) | 55 (4.2%) |
| 5:30 AM to 5:59 AM | 60 (5.5%) | 10 (0.8%) |
| 6:00 AM to 6:29 AM | 196 (17.9%) | 149 (11.4%) |
| 6:30 AM to 6:59 AM | 125 (11.4%) | 168 (12.8%) |
| 7:00 AM to 7:29 AM | 39 (3.6%) | 237 (18.1%) |
| 7:30 AM to 7:59 AM | 67 (6.1%) | 207 (15.8%) |
| 8:00 AM to 8:29 AM | 37 (3.4%) | 133 (10.1%) |
| 8:30 AM to 8:59 AM | 26 (2.4%) | 27 (2.1%) |
| 9:00 AM to 9:59 AM | 26 (2.4%) | 18 (1.4%) |
| 10:00 AM to 10:59 AM | 14 (1.3%) | 27 (2.1%) |
| 11:00 AM to 11:59 AM | 5 (0.5%) | 25 (1.9%) |
| 12:00 PM to 3:59 PM | 159 (14.5%) | 169 (12.9%) |
| 4:00 PM to 11:59 PM | 74 (6.8%) | 72 (5.5%) |
| Total | 1,095 (100.0%) | 1,312 (100.0%) |
Housing Occupancy in Claiborne County
Occupancy by Ownership in Claiborne County
Of the total 2,624 dwellings in Claiborne County, owner-occupied units account for 1,980 (75.5%), while renter-occupied units make up 644 (24.5%).
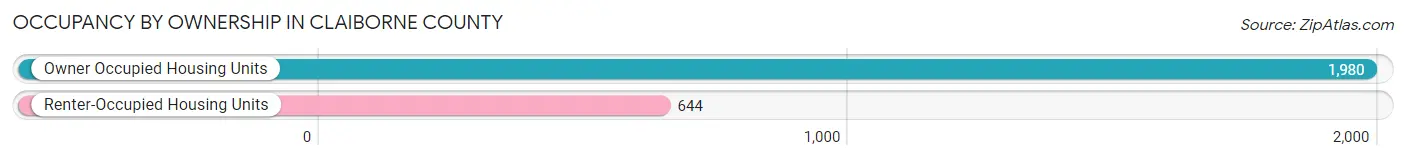
| Occupancy | # Housing Units | % Housing Units |
| Owner Occupied Housing Units | 1,980 | 75.5% |
| Renter-Occupied Housing Units | 644 | 24.5% |
| Total Occupied Housing Units | 2,624 | 100.0% |
Occupancy by Household Size in Claiborne County
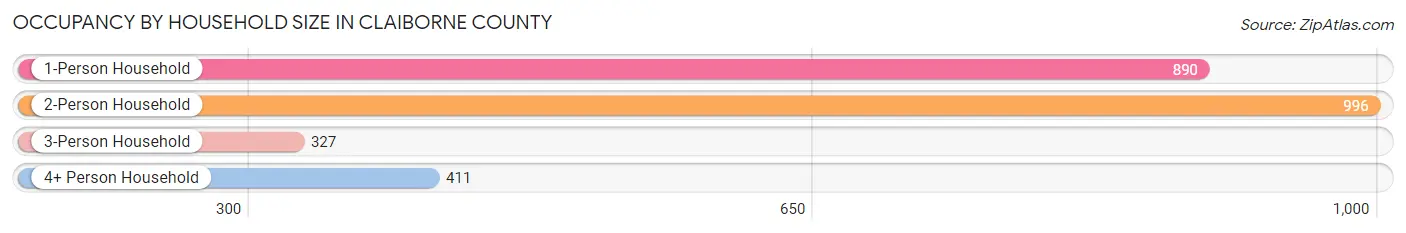
| Household Size | # Housing Units | % Housing Units |
| 1-Person Household | 890 | 33.9% |
| 2-Person Household | 996 | 38.0% |
| 3-Person Household | 327 | 12.5% |
| 4+ Person Household | 411 | 15.7% |
| Total Housing Units | 2,624 | 100.0% |
Occupancy by Ownership by Household Size in Claiborne County
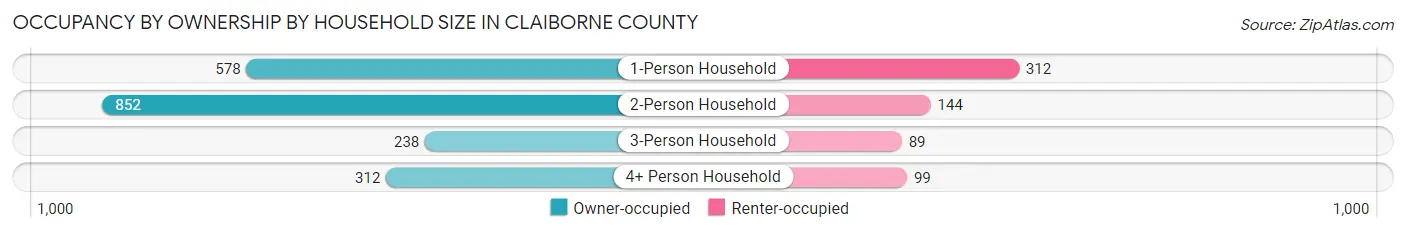
| Household Size | Owner-occupied | Renter-occupied |
| 1-Person Household | 578 (64.9%) | 312 (35.1%) |
| 2-Person Household | 852 (85.5%) | 144 (14.5%) |
| 3-Person Household | 238 (72.8%) | 89 (27.2%) |
| 4+ Person Household | 312 (75.9%) | 99 (24.1%) |
| Total Housing Units | 1,980 (75.5%) | 644 (24.5%) |
Occupancy by Educational Attainment in Claiborne County
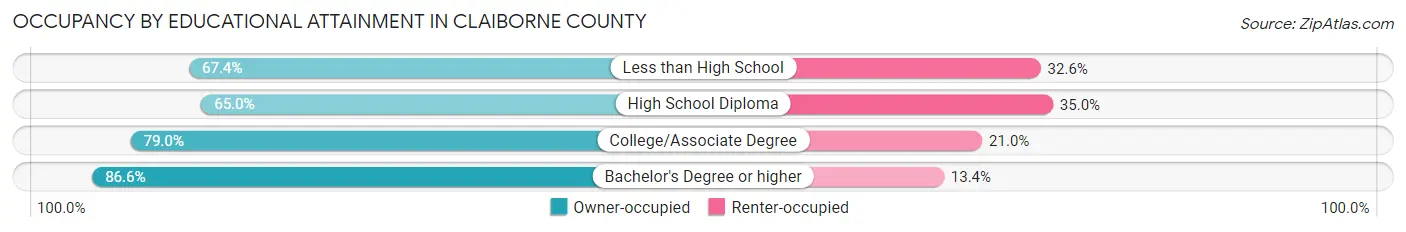
| Household Size | Owner-occupied | Renter-occupied |
| Less than High School | 401 (67.4%) | 194 (32.6%) |
| High School Diploma | 330 (65.0%) | 178 (35.0%) |
| College/Associate Degree | 707 (79.0%) | 188 (21.0%) |
| Bachelor's Degree or higher | 542 (86.6%) | 84 (13.4%) |
Occupancy by Age of Householder in Claiborne County
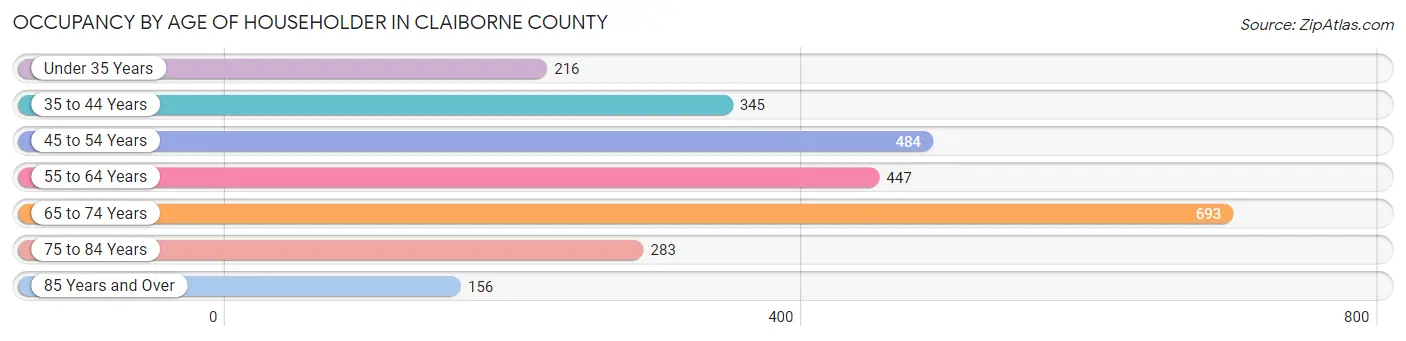
| Age Bracket | # Households | % Households |
| Under 35 Years | 216 | 8.2% |
| 35 to 44 Years | 345 | 13.2% |
| 45 to 54 Years | 484 | 18.4% |
| 55 to 64 Years | 447 | 17.0% |
| 65 to 74 Years | 693 | 26.4% |
| 75 to 84 Years | 283 | 10.8% |
| 85 Years and Over | 156 | 5.9% |
| Total | 2,624 | 100.0% |
Housing Finances in Claiborne County
Median Income by Occupancy in Claiborne County
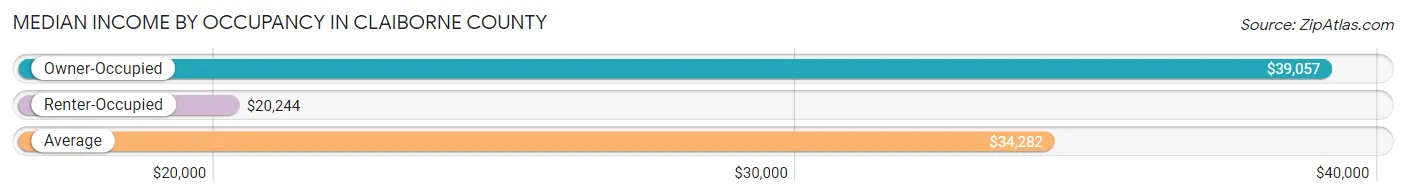
| Occupancy Type | # Households | Median Income |
| Owner-Occupied | 1,980 (75.5%) | $39,057 |
| Renter-Occupied | 644 (24.5%) | $20,244 |
| Average | 2,624 (100.0%) | $34,282 |
Occupancy by Householder Income Bracket in Claiborne County
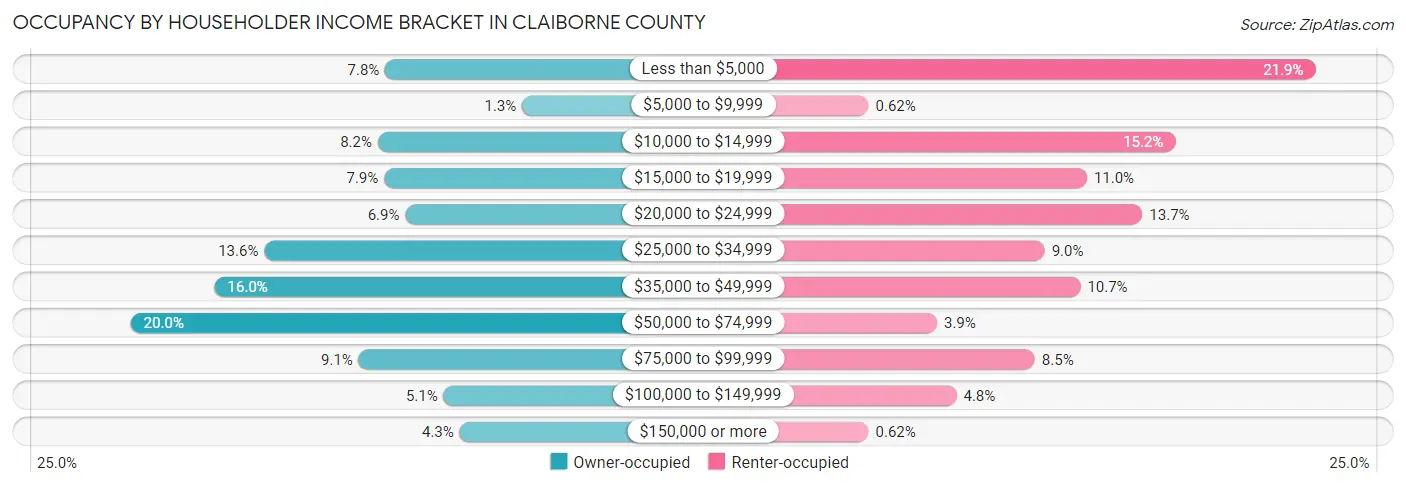
| Income Bracket | Owner-occupied | Renter-occupied |
| Less than $5,000 | 155 (7.8%) | 141 (21.9%) |
| $5,000 to $9,999 | 26 (1.3%) | 4 (0.6%) |
| $10,000 to $14,999 | 162 (8.2%) | 98 (15.2%) |
| $15,000 to $19,999 | 156 (7.9%) | 71 (11.0%) |
| $20,000 to $24,999 | 136 (6.9%) | 88 (13.7%) |
| $25,000 to $34,999 | 269 (13.6%) | 58 (9.0%) |
| $35,000 to $49,999 | 316 (16.0%) | 69 (10.7%) |
| $50,000 to $74,999 | 395 (20.0%) | 25 (3.9%) |
| $75,000 to $99,999 | 180 (9.1%) | 55 (8.5%) |
| $100,000 to $149,999 | 100 (5.1%) | 31 (4.8%) |
| $150,000 or more | 85 (4.3%) | 4 (0.6%) |
| Total | 1,980 (100.0%) | 644 (100.0%) |
Monthly Housing Cost Tiers in Claiborne County
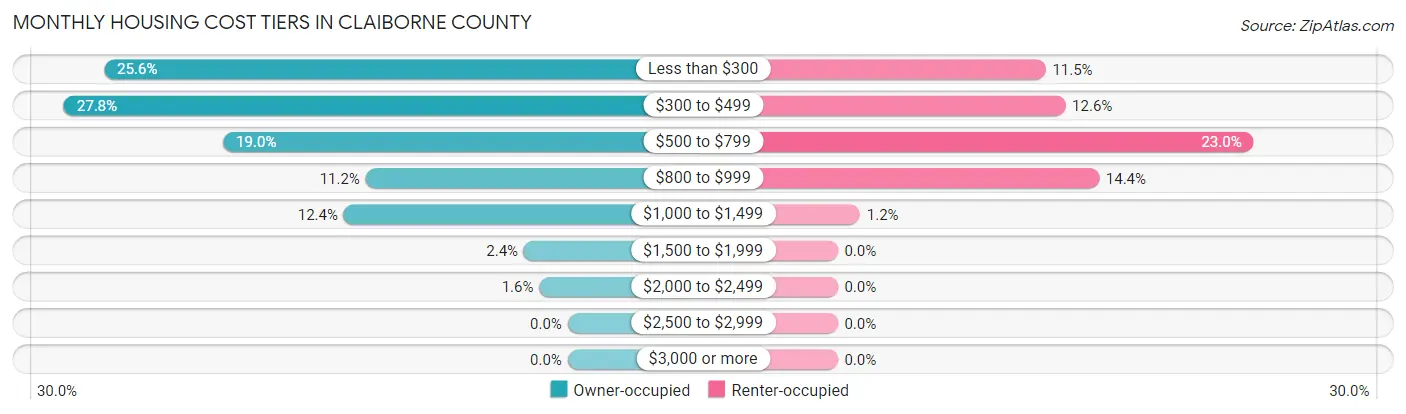
| Monthly Cost | Owner-occupied | Renter-occupied |
| Less than $300 | 507 (25.6%) | 74 (11.5%) |
| $300 to $499 | 551 (27.8%) | 81 (12.6%) |
| $500 to $799 | 377 (19.0%) | 148 (23.0%) |
| $800 to $999 | 221 (11.2%) | 93 (14.4%) |
| $1,000 to $1,499 | 245 (12.4%) | 8 (1.2%) |
| $1,500 to $1,999 | 48 (2.4%) | 0 (0.0%) |
| $2,000 to $2,499 | 31 (1.6%) | 0 (0.0%) |
| $2,500 to $2,999 | 0 (0.0%) | 0 (0.0%) |
| $3,000 or more | 0 (0.0%) | 0 (0.0%) |
| Total | 1,980 (100.0%) | 644 (100.0%) |
Physical Housing Characteristics in Claiborne County
Housing Structures in Claiborne County
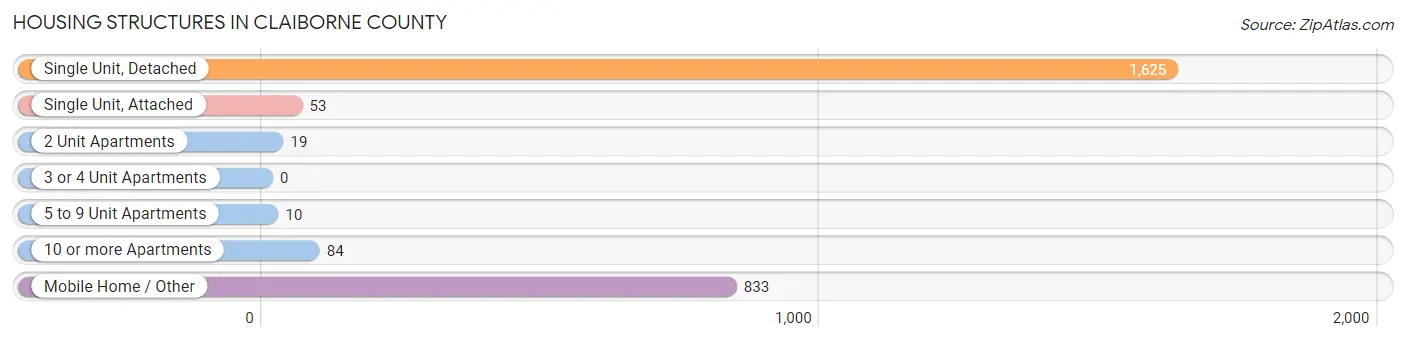
| Structure Type | # Housing Units | % Housing Units |
| Single Unit, Detached | 1,625 | 61.9% |
| Single Unit, Attached | 53 | 2.0% |
| 2 Unit Apartments | 19 | 0.7% |
| 3 or 4 Unit Apartments | 0 | 0.0% |
| 5 to 9 Unit Apartments | 10 | 0.4% |
| 10 or more Apartments | 84 | 3.2% |
| Mobile Home / Other | 833 | 31.8% |
| Total | 2,624 | 100.0% |
Housing Structures by Occupancy in Claiborne County
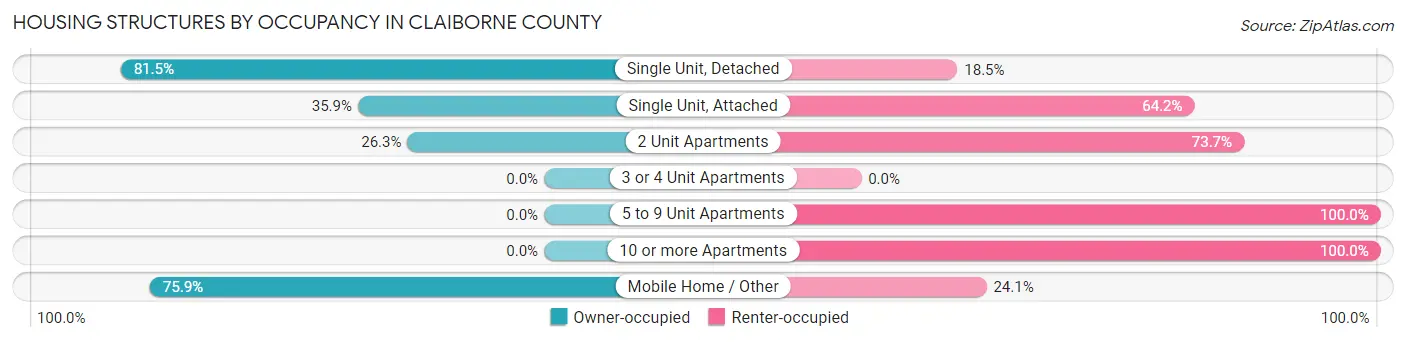
| Structure Type | Owner-occupied | Renter-occupied |
| Single Unit, Detached | 1,324 (81.5%) | 301 (18.5%) |
| Single Unit, Attached | 19 (35.8%) | 34 (64.1%) |
| 2 Unit Apartments | 5 (26.3%) | 14 (73.7%) |
| 3 or 4 Unit Apartments | 0 (0.0%) | 0 (0.0%) |
| 5 to 9 Unit Apartments | 0 (0.0%) | 10 (100.0%) |
| 10 or more Apartments | 0 (0.0%) | 84 (100.0%) |
| Mobile Home / Other | 632 (75.9%) | 201 (24.1%) |
| Total | 1,980 (75.5%) | 644 (24.5%) |
Housing Structures by Number of Rooms in Claiborne County
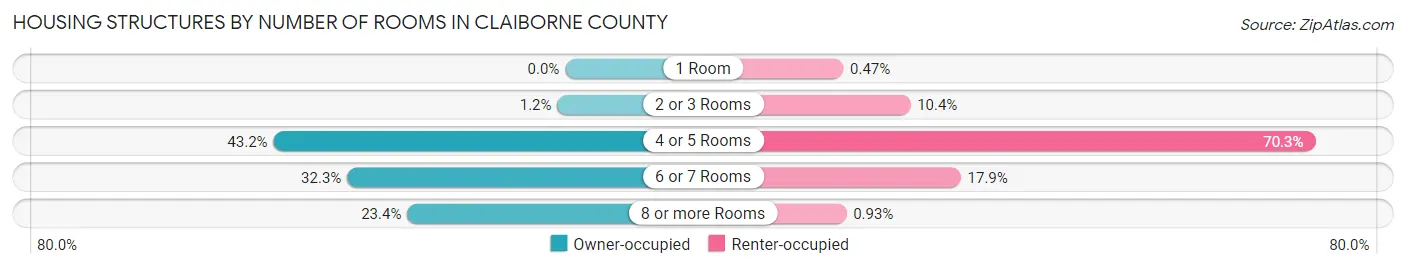
| Number of Rooms | Owner-occupied | Renter-occupied |
| 1 Room | 0 (0.0%) | 3 (0.5%) |
| 2 or 3 Rooms | 23 (1.2%) | 67 (10.4%) |
| 4 or 5 Rooms | 855 (43.2%) | 453 (70.3%) |
| 6 or 7 Rooms | 639 (32.3%) | 115 (17.9%) |
| 8 or more Rooms | 463 (23.4%) | 6 (0.9%) |
| Total | 1,980 (100.0%) | 644 (100.0%) |
Housing Structure by Heating Type in Claiborne County
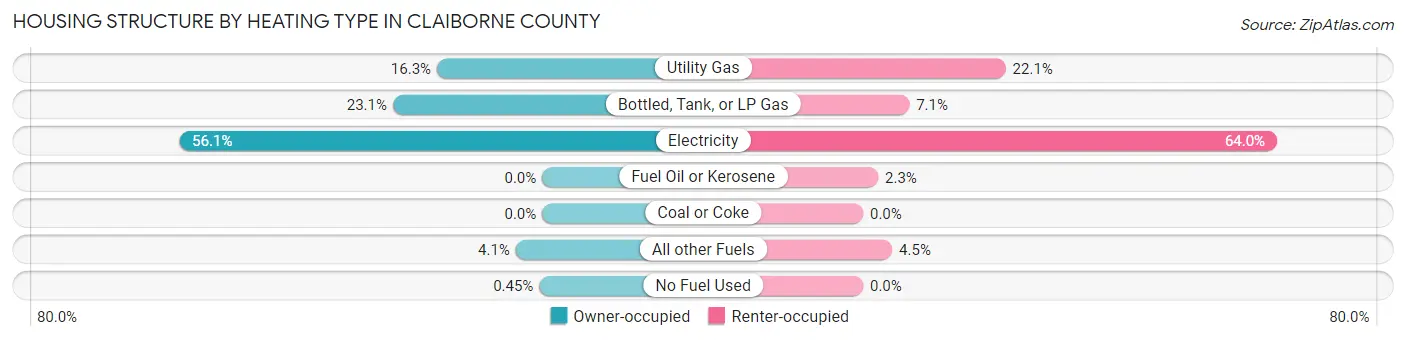
| Heating Type | Owner-occupied | Renter-occupied |
| Utility Gas | 322 (16.3%) | 142 (22.1%) |
| Bottled, Tank, or LP Gas | 457 (23.1%) | 46 (7.1%) |
| Electricity | 1,111 (56.1%) | 412 (64.0%) |
| Fuel Oil or Kerosene | 0 (0.0%) | 15 (2.3%) |
| Coal or Coke | 0 (0.0%) | 0 (0.0%) |
| All other Fuels | 81 (4.1%) | 29 (4.5%) |
| No Fuel Used | 9 (0.4%) | 0 (0.0%) |
| Total | 1,980 (100.0%) | 644 (100.0%) |
Household Vehicle Usage in Claiborne County
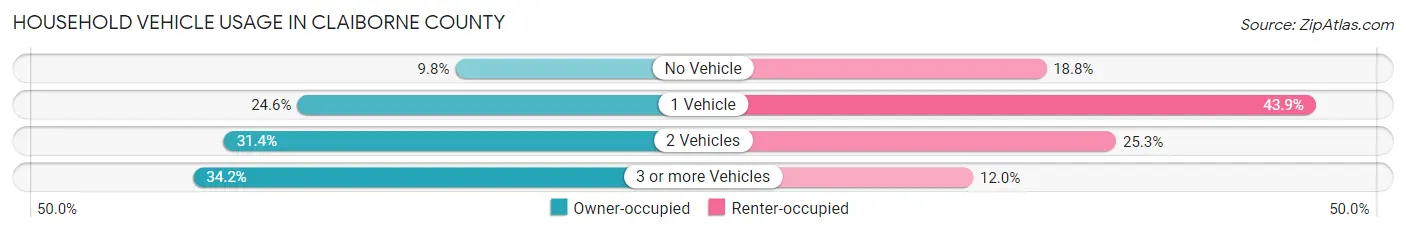
| Vehicles per Household | Owner-occupied | Renter-occupied |
| No Vehicle | 194 (9.8%) | 121 (18.8%) |
| 1 Vehicle | 486 (24.5%) | 283 (43.9%) |
| 2 Vehicles | 622 (31.4%) | 163 (25.3%) |
| 3 or more Vehicles | 678 (34.2%) | 77 (12.0%) |
| Total | 1,980 (100.0%) | 644 (100.0%) |
Real Estate & Mortgages in Claiborne County
Real Estate and Mortgage Overview in Claiborne County
| Characteristic | Without Mortgage | With Mortgage |
| Housing Units | 1,420 | 560 |
| Median Property Value | $61,200 | $88,200 |
| Median Household Income | $34,357 | $43 |
| Monthly Housing Costs | $338 | $0 |
| Real Estate Taxes | $440 | $288 |
Property Value by Mortgage Status in Claiborne County
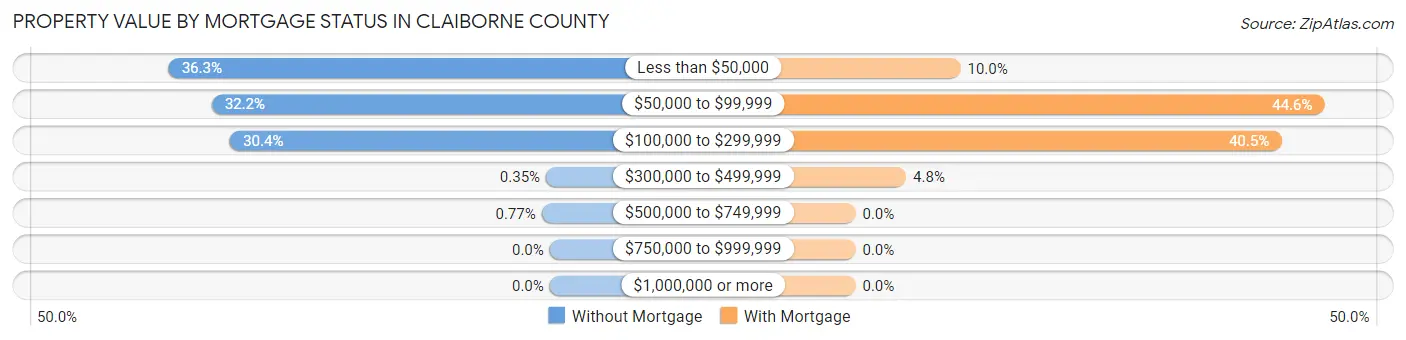
| Property Value | Without Mortgage | With Mortgage |
| Less than $50,000 | 515 (36.3%) | 56 (10.0%) |
| $50,000 to $99,999 | 457 (32.2%) | 250 (44.6%) |
| $100,000 to $299,999 | 432 (30.4%) | 227 (40.5%) |
| $300,000 to $499,999 | 5 (0.4%) | 27 (4.8%) |
| $500,000 to $749,999 | 11 (0.8%) | 0 (0.0%) |
| $750,000 to $999,999 | 0 (0.0%) | 0 (0.0%) |
| $1,000,000 or more | 0 (0.0%) | 0 (0.0%) |
| Total | 1,420 (100.0%) | 560 (100.0%) |
Household Income by Mortgage Status in Claiborne County
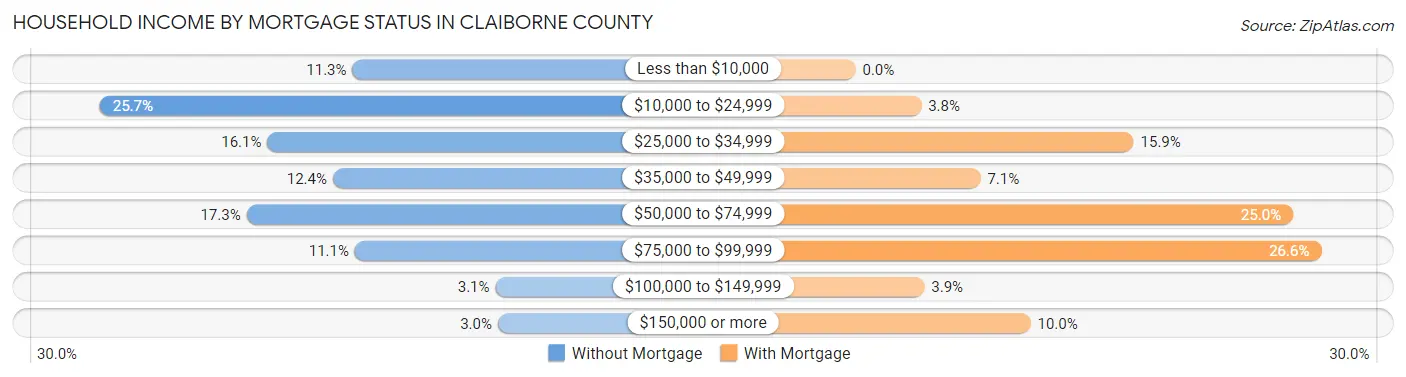
| Household Income | Without Mortgage | With Mortgage |
| Less than $10,000 | 160 (11.3%) | 0 (0.0%) |
| $10,000 to $24,999 | 365 (25.7%) | 21 (3.7%) |
| $25,000 to $34,999 | 229 (16.1%) | 89 (15.9%) |
| $35,000 to $49,999 | 176 (12.4%) | 40 (7.1%) |
| $50,000 to $74,999 | 246 (17.3%) | 140 (25.0%) |
| $75,000 to $99,999 | 158 (11.1%) | 149 (26.6%) |
| $100,000 to $149,999 | 44 (3.1%) | 22 (3.9%) |
| $150,000 or more | 42 (3.0%) | 56 (10.0%) |
| Total | 1,420 (100.0%) | 560 (100.0%) |
Property Value to Household Income Ratio in Claiborne County
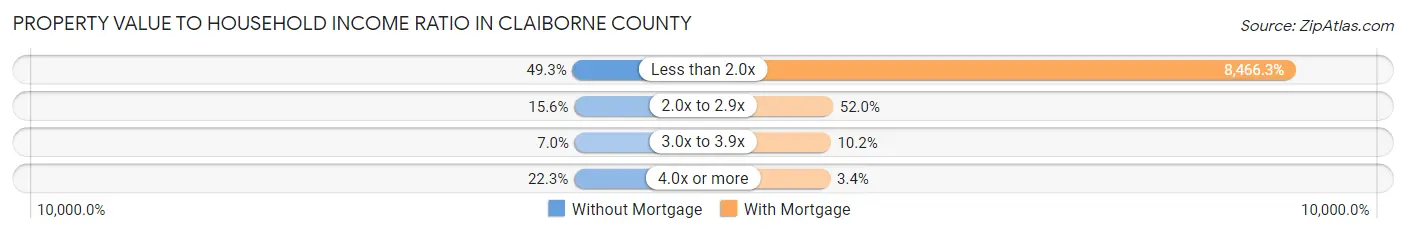
| Value-to-Income Ratio | Without Mortgage | With Mortgage |
| Less than 2.0x | 700 (49.3%) | 47,411 (8,466.2%) |
| 2.0x to 2.9x | 222 (15.6%) | 291 (52.0%) |
| 3.0x to 3.9x | 100 (7.0%) | 57 (10.2%) |
| 4.0x or more | 316 (22.3%) | 19 (3.4%) |
| Total | 1,420 (100.0%) | 560 (100.0%) |
Real Estate Taxes by Mortgage Status in Claiborne County
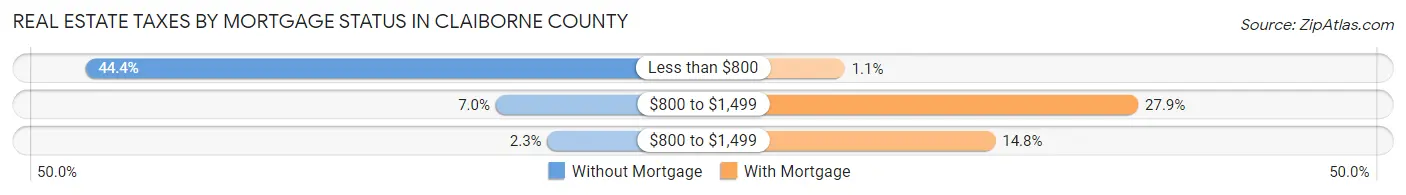
| Property Taxes | Without Mortgage | With Mortgage |
| Less than $800 | 631 (44.4%) | 6 (1.1%) |
| $800 to $1,499 | 99 (7.0%) | 156 (27.9%) |
| $800 to $1,499 | 32 (2.2%) | 83 (14.8%) |
| Total | 1,420 (100.0%) | 560 (100.0%) |
Health & Disability in Claiborne County
Health Insurance Coverage by Age in Claiborne County
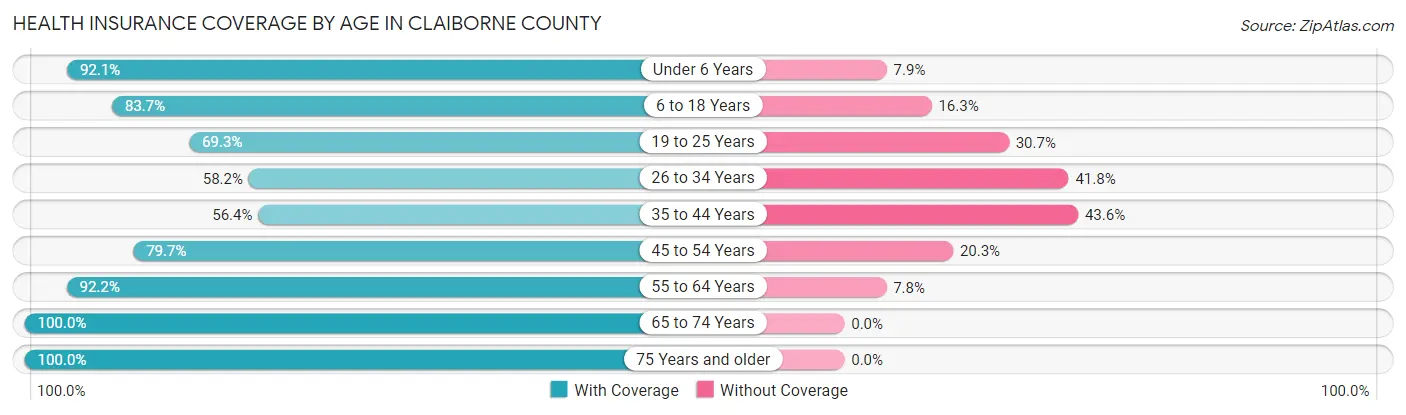
| Age Bracket | With Coverage | Without Coverage |
| Under 6 Years | 536 (92.1%) | 46 (7.9%) |
| 6 to 18 Years | 1,555 (83.7%) | 302 (16.3%) |
| 19 to 25 Years | 1,185 (69.3%) | 524 (30.7%) |
| 26 to 34 Years | 270 (58.2%) | 194 (41.8%) |
| 35 to 44 Years | 580 (56.4%) | 448 (43.6%) |
| 45 to 54 Years | 618 (79.7%) | 157 (20.3%) |
| 55 to 64 Years | 884 (92.2%) | 75 (7.8%) |
| 65 to 74 Years | 1,018 (100.0%) | 0 (0.0%) |
| 75 Years and older | 566 (100.0%) | 0 (0.0%) |
| Total | 7,212 (80.5%) | 1,746 (19.5%) |
Health Insurance Coverage by Citizenship Status in Claiborne County
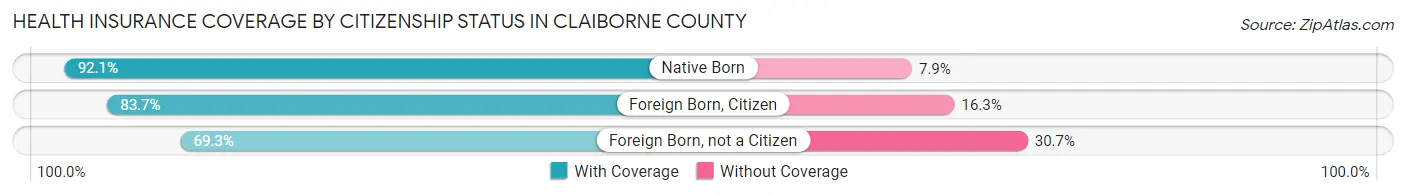
| Citizenship Status | With Coverage | Without Coverage |
| Native Born | 536 (92.1%) | 46 (7.9%) |
| Foreign Born, Citizen | 1,555 (83.7%) | 302 (16.3%) |
| Foreign Born, not a Citizen | 1,185 (69.3%) | 524 (30.7%) |
Health Insurance Coverage by Household Income in Claiborne County
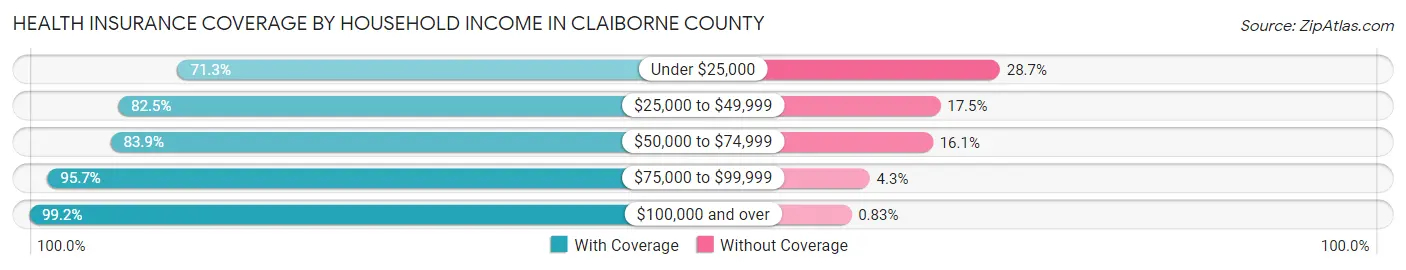
| Household Income | With Coverage | Without Coverage |
| Under $25,000 | 1,722 (71.3%) | 692 (28.7%) |
| $25,000 to $49,999 | 1,827 (82.5%) | 388 (17.5%) |
| $50,000 to $74,999 | 1,334 (83.9%) | 256 (16.1%) |
| $75,000 to $99,999 | 939 (95.7%) | 42 (4.3%) |
| $100,000 and over | 713 (99.2%) | 6 (0.8%) |
Public vs Private Health Insurance Coverage by Age in Claiborne County
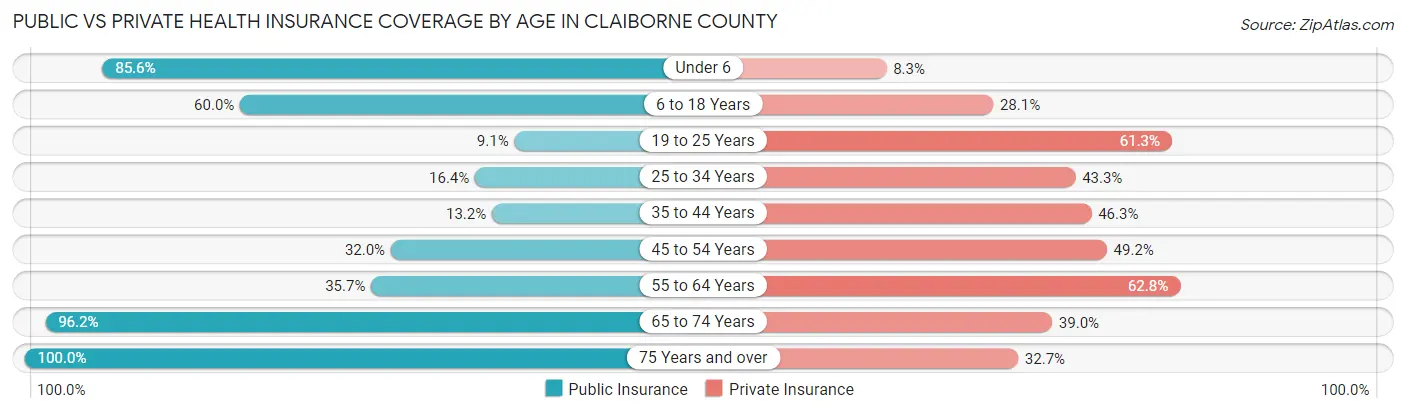
| Age Bracket | Public Insurance | Private Insurance |
| Under 6 | 498 (85.6%) | 48 (8.3%) |
| 6 to 18 Years | 1,114 (60.0%) | 521 (28.1%) |
| 19 to 25 Years | 155 (9.1%) | 1,047 (61.3%) |
| 25 to 34 Years | 76 (16.4%) | 201 (43.3%) |
| 35 to 44 Years | 136 (13.2%) | 476 (46.3%) |
| 45 to 54 Years | 248 (32.0%) | 381 (49.2%) |
| 55 to 64 Years | 342 (35.7%) | 602 (62.8%) |
| 65 to 74 Years | 979 (96.2%) | 397 (39.0%) |
| 75 Years and over | 566 (100.0%) | 185 (32.7%) |
| Total | 4,114 (45.9%) | 3,858 (43.1%) |
Disability Status by Sex by Age in Claiborne County
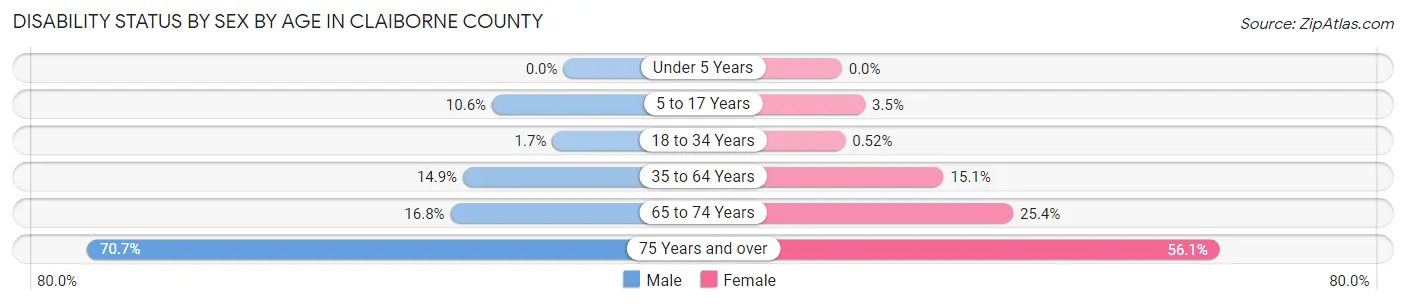
| Age Bracket | Male | Female |
| Under 5 Years | 0 (0.0%) | 0 (0.0%) |
| 5 to 17 Years | 68 (10.6%) | 26 (3.5%) |
| 18 to 34 Years | 22 (1.7%) | 7 (0.5%) |
| 35 to 64 Years | 184 (14.9%) | 231 (15.1%) |
| 65 to 74 Years | 85 (16.8%) | 130 (25.4%) |
| 75 Years and over | 157 (70.7%) | 193 (56.1%) |
Disability Class by Sex by Age in Claiborne County
Disability Class: Hearing Difficulty
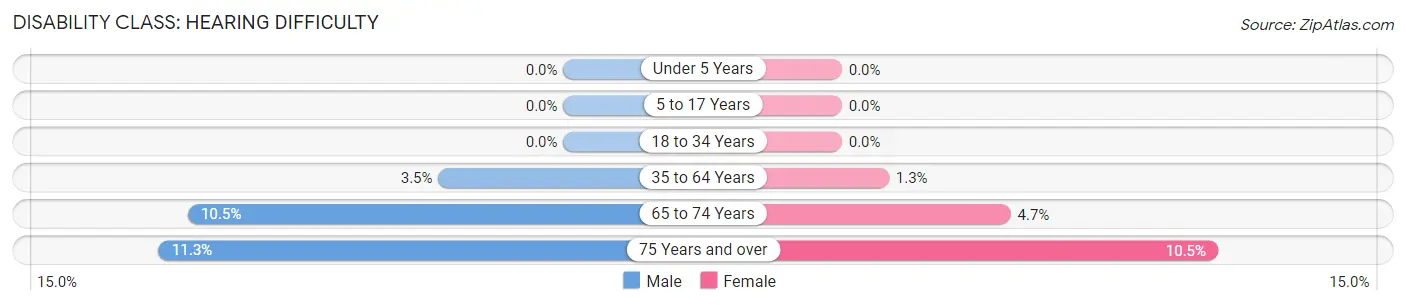
| Age Bracket | Male | Female |
| Under 5 Years | 0 (0.0%) | 0 (0.0%) |
| 5 to 17 Years | 0 (0.0%) | 0 (0.0%) |
| 18 to 34 Years | 0 (0.0%) | 0 (0.0%) |
| 35 to 64 Years | 43 (3.5%) | 20 (1.3%) |
| 65 to 74 Years | 53 (10.4%) | 24 (4.7%) |
| 75 Years and over | 25 (11.3%) | 36 (10.5%) |
Disability Class: Vision Difficulty
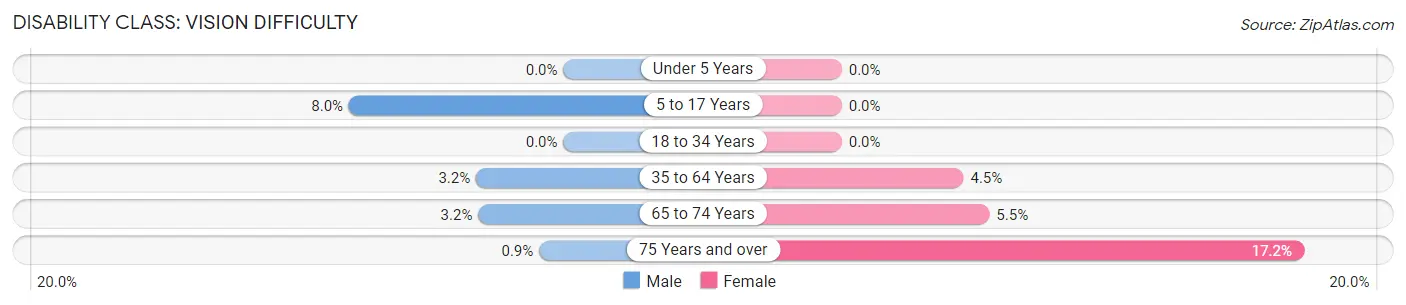
| Age Bracket | Male | Female |
| Under 5 Years | 0 (0.0%) | 0 (0.0%) |
| 5 to 17 Years | 51 (8.0%) | 0 (0.0%) |
| 18 to 34 Years | 0 (0.0%) | 0 (0.0%) |
| 35 to 64 Years | 40 (3.2%) | 69 (4.5%) |
| 65 to 74 Years | 16 (3.2%) | 28 (5.5%) |
| 75 Years and over | 2 (0.9%) | 59 (17.2%) |
Disability Class: Cognitive Difficulty
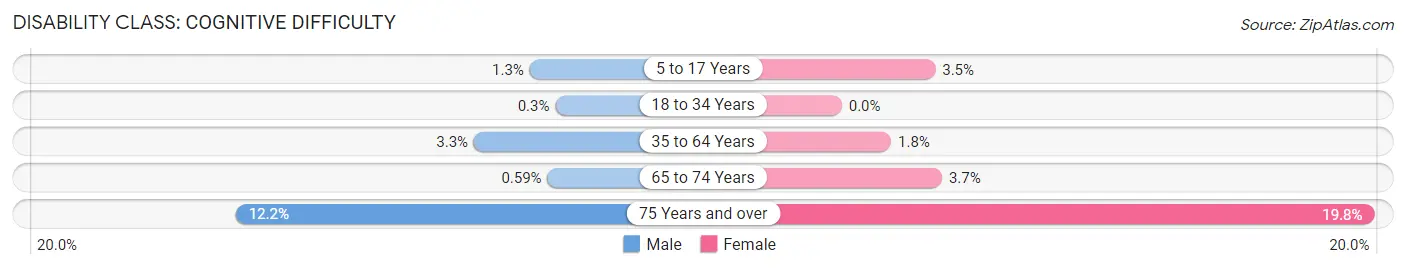
| Age Bracket | Male | Female |
| 5 to 17 Years | 8 (1.3%) | 26 (3.5%) |
| 18 to 34 Years | 4 (0.3%) | 0 (0.0%) |
| 35 to 64 Years | 41 (3.3%) | 28 (1.8%) |
| 65 to 74 Years | 3 (0.6%) | 19 (3.7%) |
| 75 Years and over | 27 (12.2%) | 68 (19.8%) |
Disability Class: Ambulatory Difficulty
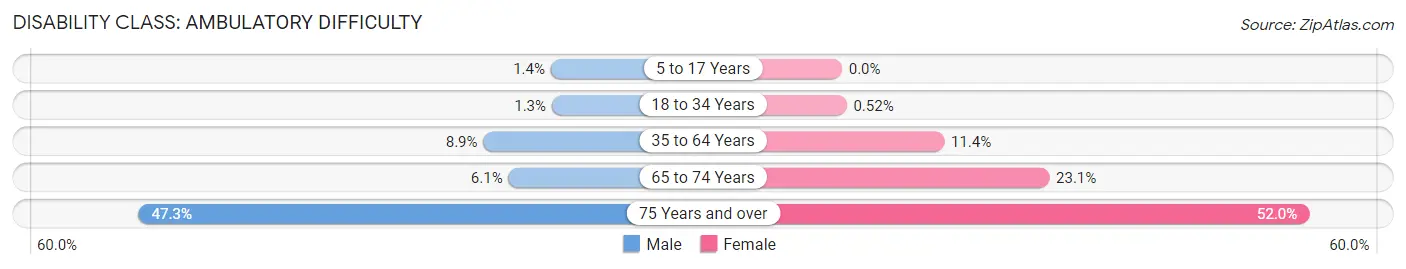
| Age Bracket | Male | Female |
| 5 to 17 Years | 9 (1.4%) | 0 (0.0%) |
| 18 to 34 Years | 17 (1.3%) | 7 (0.5%) |
| 35 to 64 Years | 110 (8.9%) | 174 (11.4%) |
| 65 to 74 Years | 31 (6.1%) | 118 (23.1%) |
| 75 Years and over | 105 (47.3%) | 179 (52.0%) |
Disability Class: Self-Care Difficulty
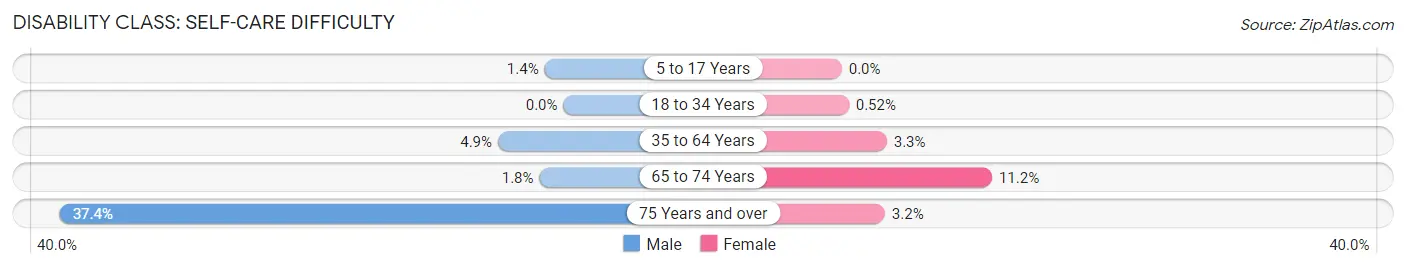
| Age Bracket | Male | Female |
| 5 to 17 Years | 9 (1.4%) | 0 (0.0%) |
| 18 to 34 Years | 0 (0.0%) | 7 (0.5%) |
| 35 to 64 Years | 60 (4.9%) | 51 (3.3%) |
| 65 to 74 Years | 9 (1.8%) | 57 (11.2%) |
| 75 Years and over | 83 (37.4%) | 11 (3.2%) |
Technology Access in Claiborne County
Computing Device Access in Claiborne County
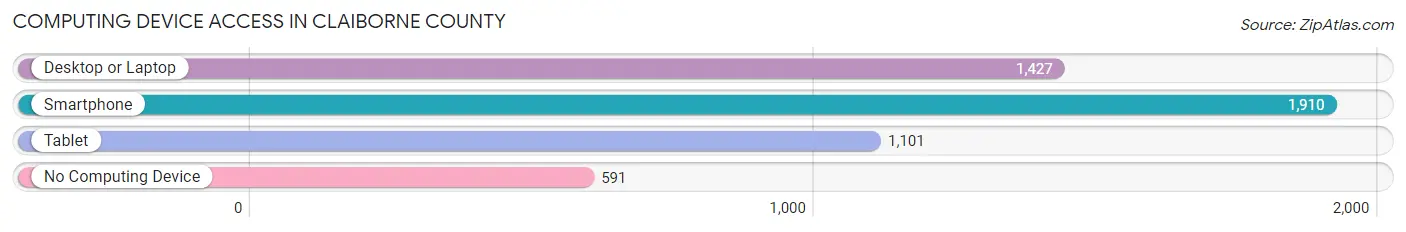
| Device Type | # Households | % Households |
| Desktop or Laptop | 1,427 | 54.4% |
| Smartphone | 1,910 | 72.8% |
| Tablet | 1,101 | 42.0% |
| No Computing Device | 591 | 22.5% |
| Total | 2,624 | 100.0% |
Internet Access in Claiborne County
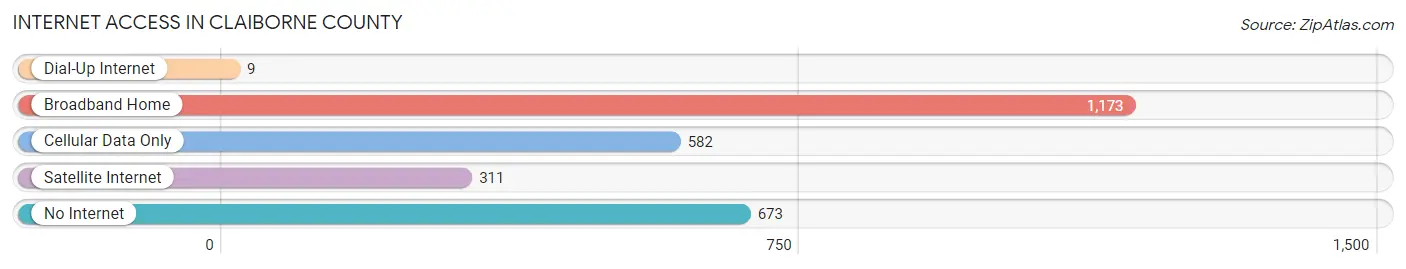
| Internet Type | # Households | % Households |
| Dial-Up Internet | 9 | 0.3% |
| Broadband Home | 1,173 | 44.7% |
| Cellular Data Only | 582 | 22.2% |
| Satellite Internet | 311 | 11.8% |
| No Internet | 673 | 25.7% |
| Total | 2,624 | 100.0% |
Claiborne County Summary
Introduction
Claiborne County is located in the state of Mississippi, in the United States of America. It is bordered by Jefferson County to the north, Copiah County to the east, Hinds County to the south, and Warren County to the west. The county seat is Port Gibson, and the county has a total area of 576 square miles. As of the 2010 census, the population of Claiborne County was 9,604.
History
Claiborne County was established in 1802, and was named after William C.C. Claiborne, the first governor of the Mississippi Territory. The county was originally part of Jefferson County, and was created in order to provide a more convenient location for the county seat. The county was divided into two parts in 1809, with the western part becoming Warren County.
The county was home to several Native American tribes, including the Choctaw, Chickasaw, and Natchez. The first European settlers arrived in the area in the late 1700s, and the county was officially established in 1802.
During the Civil War, Claiborne County was the site of several battles, including the Battle of Port Gibson in 1863. The county was also the site of the Battle of Grand Gulf in 1863, and the Battle of Port Gibson in 1864.
Geography
Claiborne County is located in the southeastern corner of Mississippi, and is bordered by Jefferson County to the north, Copiah County to the east, Hinds County to the south, and Warren County to the west. The county has a total area of 576 square miles, and is mostly rural. The terrain is mostly flat, with some rolling hills in the northern part of the county. The county is drained by the Big Black River, which flows through the county from north to south.
The county is home to several state parks, including the Grand Gulf Military State Park, the Port Gibson Battlefield State Park, and the Natchez Trace State Park. The county is also home to the Claiborne County Wildlife Management Area, which is a popular destination for hunting and fishing.
Economy
The economy of Claiborne County is largely based on agriculture. The county is home to several large farms, and the main crops grown in the county are cotton, soybeans, corn, and wheat. The county is also home to several timber companies, and the lumber industry is an important part of the local economy.
The county is also home to several manufacturing companies, including a furniture factory, a paper mill, and a plastics plant. The county is also home to several small businesses, including restaurants, retail stores, and service providers.
Demographics
As of the 2010 census, the population of Claiborne County was 9,604. The population is mostly white (77.3%), with African Americans making up the largest minority group (20.2%). The median household income in the county is $35,945, and the median age is 38.7 years.
Conclusion
Claiborne County is a rural county located in the southeastern corner of Mississippi. The county has a long history, and was the site of several battles during the Civil War. The economy of the county is largely based on agriculture, and the county is home to several large farms. The population of the county is mostly white, with African Americans making up the largest minority group.
Common Questions
What is Per Capita Income in Claiborne County?
Per Capita income in Claiborne County is $17,250.
What is the Median Family Income in Claiborne County?
Median Family Income in Claiborne County is $37,063.
What is the Median Household income in Claiborne County?
Median Household Income in Claiborne County is $34,282.
What is Income or Wage Gap in Claiborne County?
Income or Wage Gap in Claiborne County is 26.8%.
Women in Claiborne County earn 73.2 cents for every dollar earned by a man.
What is Inequality or Gini Index in Claiborne County?
Inequality or Gini Index in Claiborne County is 0.54.
What is the Total Population of Claiborne County?
Total Population of Claiborne County is 9,044.
What is the Total Male Population of Claiborne County?
Total Male Population of Claiborne County is 4,405.
What is the Total Female Population of Claiborne County?
Total Female Population of Claiborne County is 4,639.
What is the Ratio of Males per 100 Females in Claiborne County?
There are 94.96 Males per 100 Females in Claiborne County.
What is the Ratio of Females per 100 Males in Claiborne County?
There are 105.31 Females per 100 Males in Claiborne County.
What is the Median Population Age in Claiborne County?
Median Population Age in Claiborne County is 33.9 Years.
What is the Average Family Size in Claiborne County
Average Family Size in Claiborne County is 4.0 People.
What is the Average Household Size in Claiborne County
Average Household Size in Claiborne County is 3.0 People.
How Large is the Labor Force in Claiborne County?
There are 2,854 People in the Labor Forcein in Claiborne County.
What is the Percentage of People in the Labor Force in Claiborne County?
39.3% of People are in the Labor Force in Claiborne County.
What is the Unemployment Rate in Claiborne County?
Unemployment Rate in Claiborne County is 9.0%.