Chickasaw County, MS Map & Demographics
Chickasaw County Map
Chickasaw County Overview
$21,968
PER CAPITA INCOME
$49,609
AVG FAMILY INCOME
$40,224
AVG HOUSEHOLD INCOME
36.3%
WAGE / INCOME GAP [ % ]
63.7¢/ $1
WAGE / INCOME GAP [ $ ]
$10,268
FAMILY INCOME DEFICIT
0.47
INEQUALITY / GINI INDEX
17,024
TOTAL POPULATION
8,270
MALE POPULATION
8,754
FEMALE POPULATION
94.47
MALES / 100 FEMALES
105.85
FEMALES / 100 MALES
39.3
MEDIAN AGE
3.1
AVG FAMILY SIZE
2.4
AVG HOUSEHOLD SIZE
6,966
LABOR FORCE [ PEOPLE ]
52.5%
PERCENT IN LABOR FORCE
3.1%
UNEMPLOYMENT RATE
Chickasaw County Area Codes
Income in Chickasaw County
Income Overview in Chickasaw County
Per Capita Income in Chickasaw County is $21,968, while median incomes of families and households are $49,609 and $40,224 respectively.
| Characteristic | Number | Measure |
| Per Capita Income | 17,024 | $21,968 |
| Median Family Income | 4,487 | $49,609 |
| Mean Family Income | 4,487 | $61,531 |
| Median Household Income | 6,767 | $40,224 |
| Mean Household Income | 6,767 | $52,908 |
| Income Deficit | 4,487 | $10,268 |
| Wage / Income Gap (%) | 17,024 | 36.33% |
| Wage / Income Gap ($) | 17,024 | 63.67¢ per $1 |
| Gini / Inequality Index | 17,024 | 0.47 |
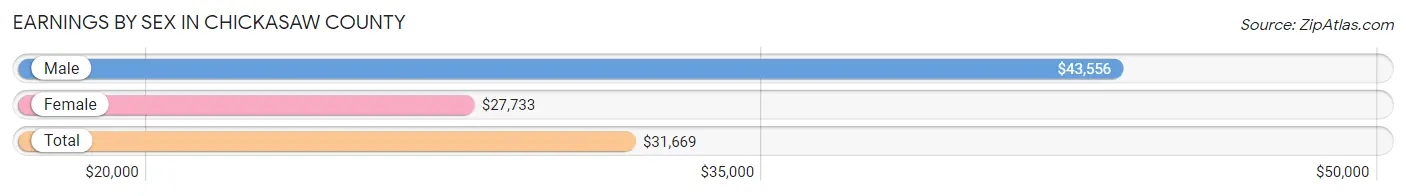
Earnings by Sex in Chickasaw County
Average Earnings in Chickasaw County are $31,669, $43,556 for men and $27,733 for women, a difference of 36.3%.
| Sex | Number | Average Earnings |
| Male | 3,588 (51.1%) | $43,556 |
| Female | 3,438 (48.9%) | $27,733 |
| Total | 7,026 (100.0%) | $31,669 |
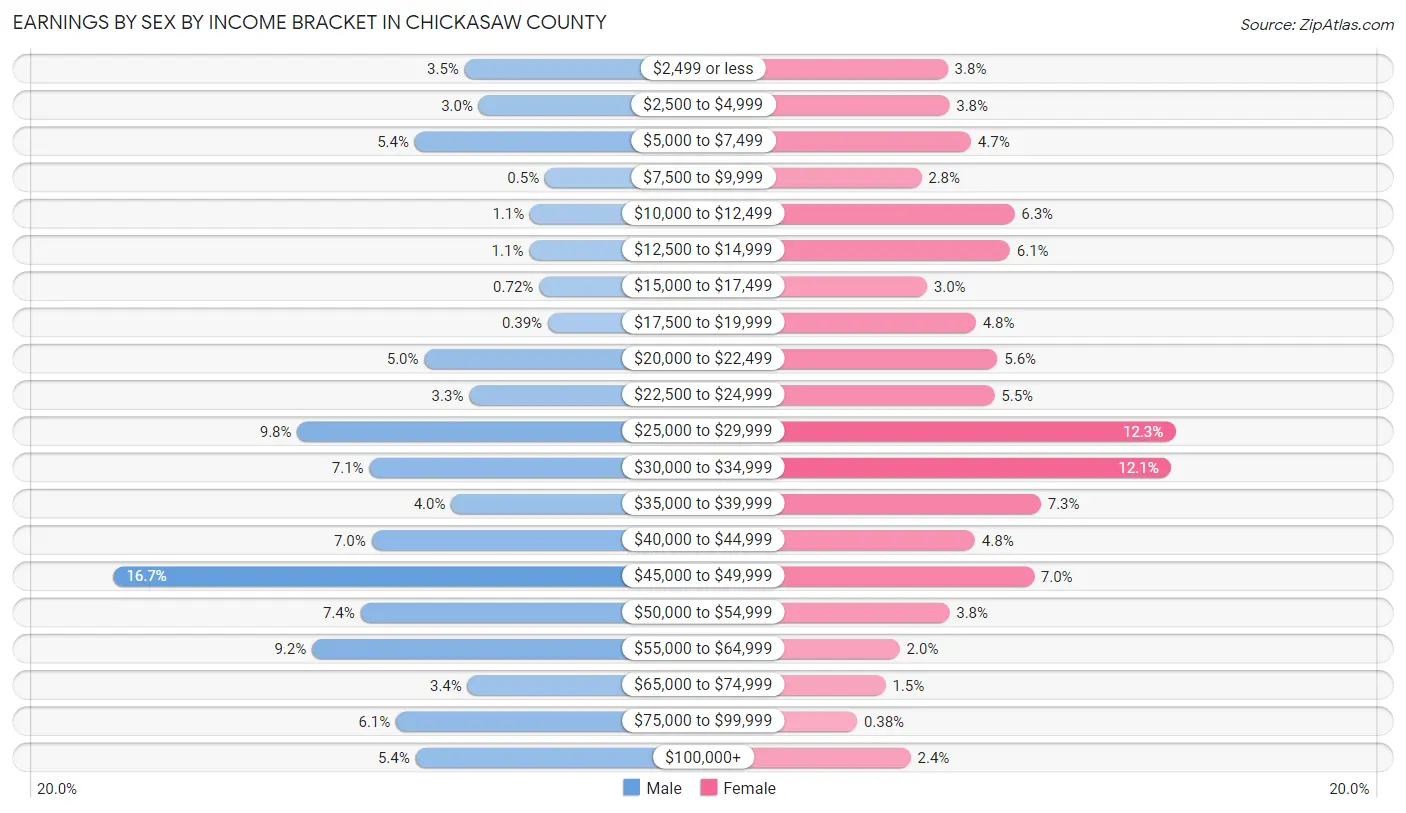
Earnings by Sex by Income Bracket in Chickasaw County
The most common earnings brackets in Chickasaw County are $45,000 to $49,999 for men (598 | 16.7%) and $25,000 to $29,999 for women (423 | 12.3%).
| Income | Male | Female |
| $2,499 or less | 126 (3.5%) | 130 (3.8%) |
| $2,500 to $4,999 | 107 (3.0%) | 132 (3.8%) |
| $5,000 to $7,499 | 193 (5.4%) | 160 (4.6%) |
| $7,500 to $9,999 | 18 (0.5%) | 96 (2.8%) |
| $10,000 to $12,499 | 38 (1.1%) | 216 (6.3%) |
| $12,500 to $14,999 | 39 (1.1%) | 210 (6.1%) |
| $15,000 to $17,499 | 26 (0.7%) | 103 (3.0%) |
| $17,500 to $19,999 | 14 (0.4%) | 166 (4.8%) |
| $20,000 to $22,499 | 180 (5.0%) | 194 (5.6%) |
| $22,500 to $24,999 | 120 (3.3%) | 190 (5.5%) |
| $25,000 to $29,999 | 351 (9.8%) | 423 (12.3%) |
| $30,000 to $34,999 | 254 (7.1%) | 417 (12.1%) |
| $35,000 to $39,999 | 144 (4.0%) | 250 (7.3%) |
| $40,000 to $44,999 | 251 (7.0%) | 165 (4.8%) |
| $45,000 to $49,999 | 598 (16.7%) | 241 (7.0%) |
| $50,000 to $54,999 | 266 (7.4%) | 132 (3.8%) |
| $55,000 to $64,999 | 331 (9.2%) | 68 (2.0%) |
| $65,000 to $74,999 | 122 (3.4%) | 50 (1.5%) |
| $75,000 to $99,999 | 218 (6.1%) | 13 (0.4%) |
| $100,000+ | 192 (5.3%) | 82 (2.4%) |
| Total | 3,588 (100.0%) | 3,438 (100.0%) |
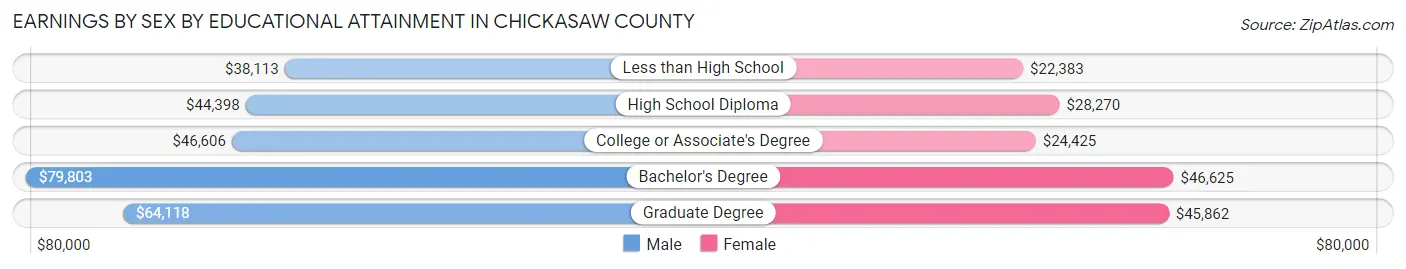
Earnings by Sex by Educational Attainment in Chickasaw County
Average earnings in Chickasaw County are $45,871 for men and $28,980 for women, a difference of 36.8%. Men with an educational attainment of bachelor's degree enjoy the highest average annual earnings of $79,803, while those with less than high school education earn the least with $38,113. Women with an educational attainment of bachelor's degree earn the most with the average annual earnings of $46,625, while those with less than high school education have the smallest earnings of $22,383.
| Educational Attainment | Male Income | Female Income |
| Less than High School | $38,113 | $22,383 |
| High School Diploma | $44,398 | $28,270 |
| College or Associate's Degree | $46,606 | $24,425 |
| Bachelor's Degree | $79,803 | $46,625 |
| Graduate Degree | $64,118 | $45,862 |
| Total | $45,871 | $28,980 |
Family Income in Chickasaw County
Family Income Brackets in Chickasaw County
According to the Chickasaw County family income data, there are 817 families falling into the $35,000 to $49,999 income range, which is the most common income bracket and makes up 18.2% of all families. Conversely, the $200,000+ income bracket is the least frequent group with only 49 families (1.1%) belonging to this category.
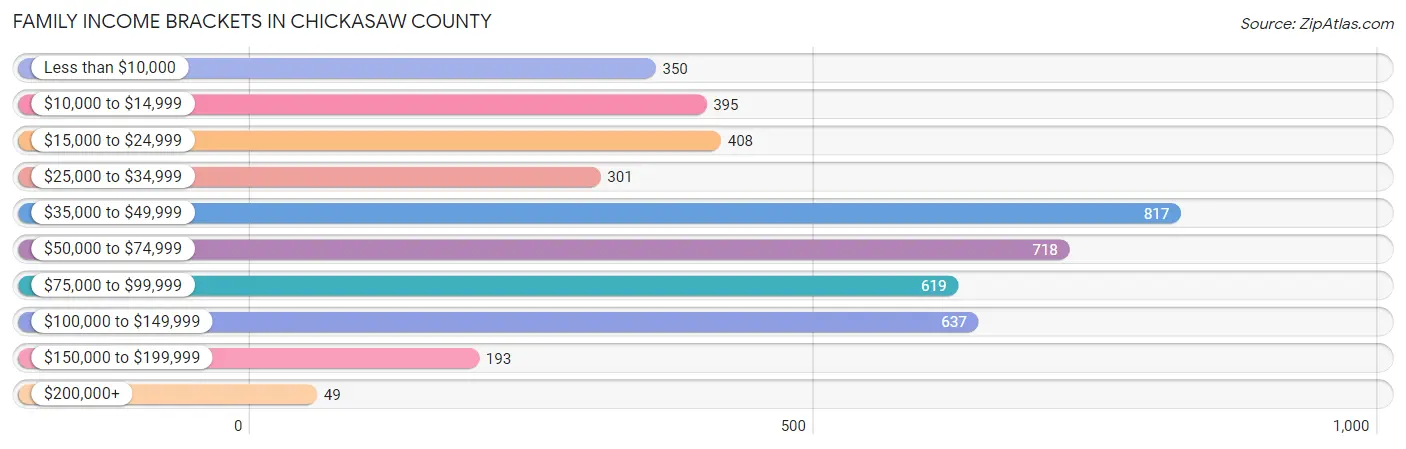
| Income Bracket | # Families | % Families |
| Less than $10,000 | 350 | 7.8% |
| $10,000 to $14,999 | 395 | 8.8% |
| $15,000 to $24,999 | 408 | 9.1% |
| $25,000 to $34,999 | 301 | 6.7% |
| $35,000 to $49,999 | 817 | 18.2% |
| $50,000 to $74,999 | 718 | 16.0% |
| $75,000 to $99,999 | 619 | 13.8% |
| $100,000 to $149,999 | 637 | 14.2% |
| $150,000 to $199,999 | 193 | 4.3% |
| $200,000+ | 49 | 1.1% |
Family Income by Famaliy Size in Chickasaw County
5-person families (239 | 5.3%) account for the highest median family income in Chickasaw County with $84,917 per family, while 2-person families (1,969 | 43.9%) have the highest median income of $22,548 per family member.
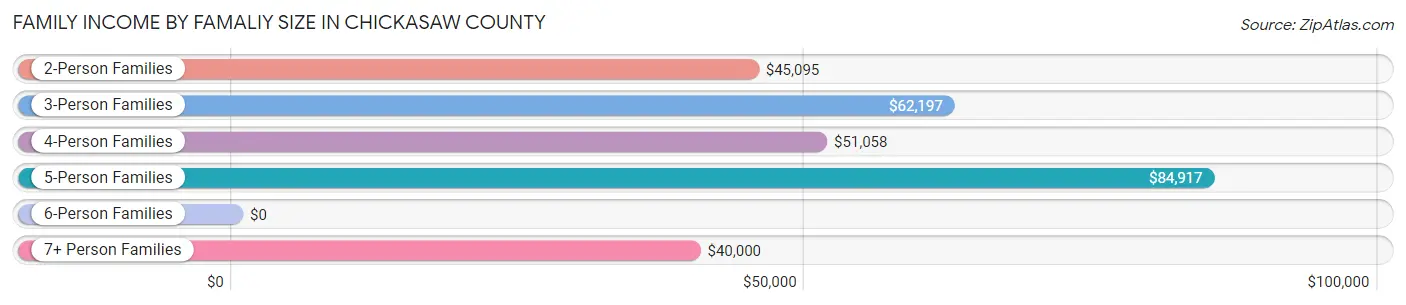
| Income Bracket | # Families | Median Income |
| 2-Person Families | 1,969 (43.9%) | $45,095 |
| 3-Person Families | 1,248 (27.8%) | $62,197 |
| 4-Person Families | 940 (20.9%) | $51,058 |
| 5-Person Families | 239 (5.3%) | $84,917 |
| 6-Person Families | 59 (1.3%) | $0 |
| 7+ Person Families | 32 (0.7%) | $40,000 |
| Total | 4,487 (100.0%) | $49,609 |
Family Income by Number of Earners in Chickasaw County
The median family income in Chickasaw County is $49,609, with families comprising 3+ earners (350) having the highest median family income of $101,514, while families with no earners (1,198) have the lowest median family income of $17,813, accounting for 7.8% and 26.7% of families, respectively.
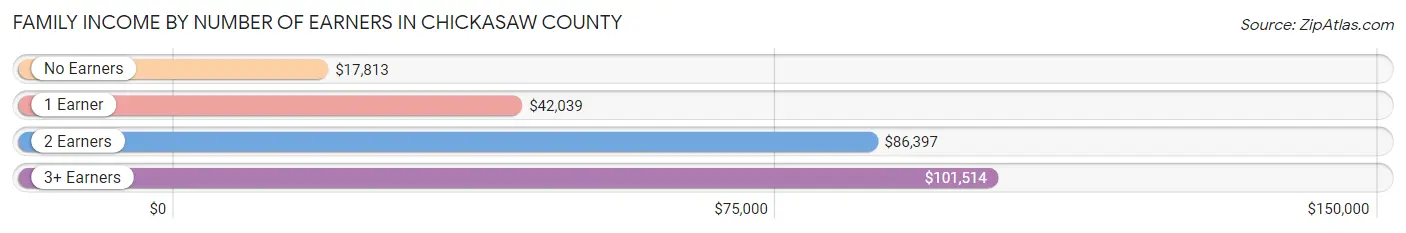
| Number of Earners | # Families | Median Income |
| No Earners | 1,198 (26.7%) | $17,813 |
| 1 Earner | 1,431 (31.9%) | $42,039 |
| 2 Earners | 1,508 (33.6%) | $86,397 |
| 3+ Earners | 350 (7.8%) | $101,514 |
| Total | 4,487 (100.0%) | $49,609 |
Household Income in Chickasaw County
Household Income Brackets in Chickasaw County
With 1,171 households falling in the category, the $35,000 to $49,999 income range is the most frequent in Chickasaw County, accounting for 17.3% of all households. In contrast, only 61 households (0.9%) fall into the $200,000+ income bracket, making it the least populous group.
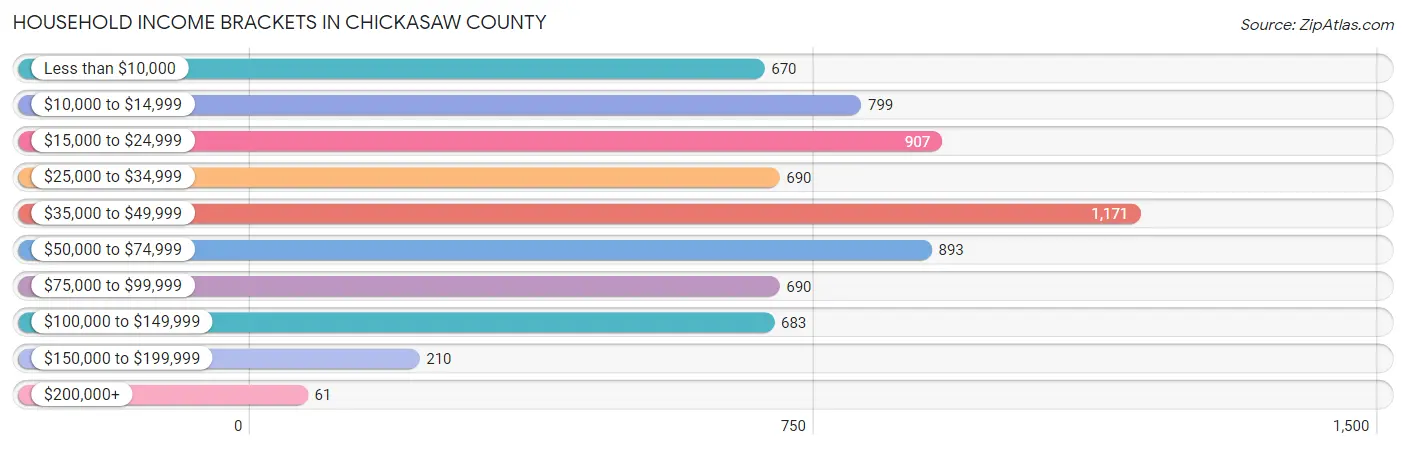
| Income Bracket | # Households | % Households |
| Less than $10,000 | 670 | 9.9% |
| $10,000 to $14,999 | 799 | 11.8% |
| $15,000 to $24,999 | 907 | 13.4% |
| $25,000 to $34,999 | 690 | 10.2% |
| $35,000 to $49,999 | 1,171 | 17.3% |
| $50,000 to $74,999 | 893 | 13.2% |
| $75,000 to $99,999 | 690 | 10.2% |
| $100,000 to $149,999 | 683 | 10.1% |
| $150,000 to $199,999 | 210 | 3.1% |
| $200,000+ | 61 | 0.9% |
Household Income by Householder Age in Chickasaw County
The median household income in Chickasaw County is $40,224, with the highest median household income of $46,038 found in the 45 to 64 years age bracket for the primary householder. A total of 2,368 households (35.0%) fall into this category. Meanwhile, the 15 to 24 years age bracket for the primary householder has the lowest median household income of $21,235, with 232 households (3.4%) in this group.
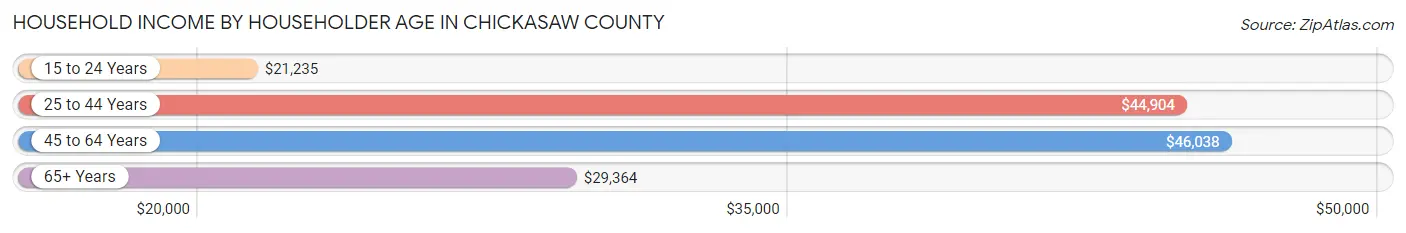
| Income Bracket | # Households | Median Income |
| 15 to 24 Years | 232 (3.4%) | $21,235 |
| 25 to 44 Years | 2,032 (30.0%) | $44,904 |
| 45 to 64 Years | 2,368 (35.0%) | $46,038 |
| 65+ Years | 2,135 (31.6%) | $29,364 |
| Total | 6,767 (100.0%) | $40,224 |
Poverty in Chickasaw County
Income Below Poverty by Sex and Age in Chickasaw County
With 22.4% poverty level for males and 30.5% for females among the residents of Chickasaw County, 15 year old males and under 5 year old females are the most vulnerable to poverty, with 82 males (75.9%) and 383 females (57.9%) in their respective age groups living below the poverty level.
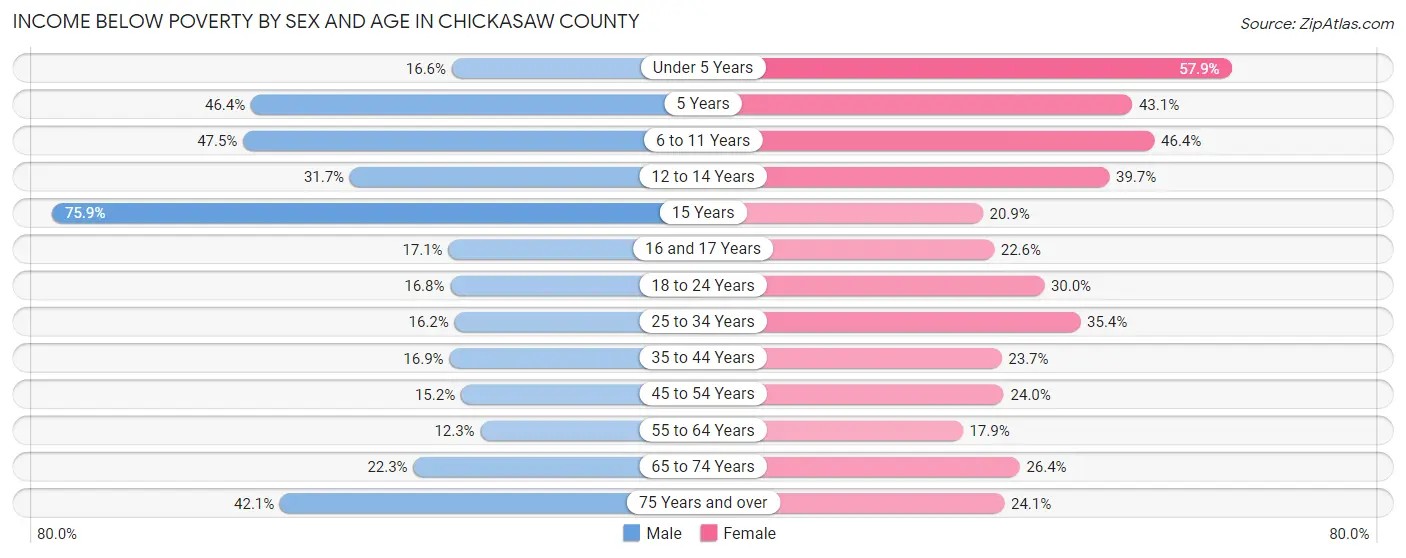
| Age Bracket | Male | Female |
| Under 5 Years | 101 (16.6%) | 383 (57.9%) |
| 5 Years | 32 (46.4%) | 78 (43.1%) |
| 6 to 11 Years | 338 (47.5%) | 263 (46.4%) |
| 12 to 14 Years | 109 (31.7%) | 173 (39.7%) |
| 15 Years | 82 (75.9%) | 14 (20.9%) |
| 16 and 17 Years | 36 (17.1%) | 58 (22.6%) |
| 18 to 24 Years | 118 (16.8%) | 181 (30.0%) |
| 25 to 34 Years | 156 (16.2%) | 390 (35.4%) |
| 35 to 44 Years | 157 (16.9%) | 217 (23.7%) |
| 45 to 54 Years | 140 (15.2%) | 255 (24.0%) |
| 55 to 64 Years | 114 (12.3%) | 202 (17.9%) |
| 65 to 74 Years | 217 (22.3%) | 234 (26.4%) |
| 75 Years and over | 151 (42.1%) | 193 (24.1%) |
| Total | 1,751 (22.4%) | 2,641 (30.5%) |
Income Above Poverty by Sex and Age in Chickasaw County
According to the poverty statistics in Chickasaw County, males aged 55 to 64 years and females aged 55 to 64 years are the age groups that are most secure financially, with 87.7% of males and 82.1% of females in these age groups living above the poverty line.
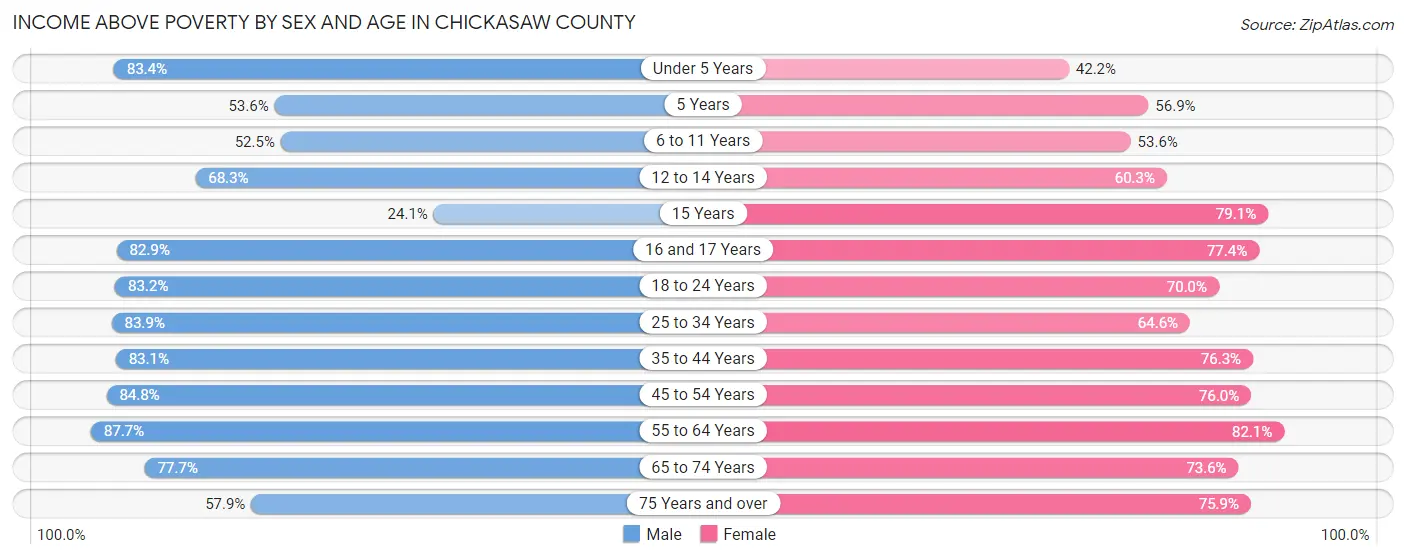
| Age Bracket | Male | Female |
| Under 5 Years | 509 (83.4%) | 279 (42.1%) |
| 5 Years | 37 (53.6%) | 103 (56.9%) |
| 6 to 11 Years | 373 (52.5%) | 304 (53.6%) |
| 12 to 14 Years | 235 (68.3%) | 263 (60.3%) |
| 15 Years | 26 (24.1%) | 53 (79.1%) |
| 16 and 17 Years | 175 (82.9%) | 199 (77.4%) |
| 18 to 24 Years | 585 (83.2%) | 422 (70.0%) |
| 25 to 34 Years | 810 (83.9%) | 712 (64.6%) |
| 35 to 44 Years | 771 (83.1%) | 699 (76.3%) |
| 45 to 54 Years | 781 (84.8%) | 806 (76.0%) |
| 55 to 64 Years | 812 (87.7%) | 925 (82.1%) |
| 65 to 74 Years | 758 (77.7%) | 653 (73.6%) |
| 75 Years and over | 208 (57.9%) | 608 (75.9%) |
| Total | 6,080 (77.6%) | 6,026 (69.5%) |
Income Below Poverty Among Married-Couple Families in Chickasaw County
The poverty statistics for married-couple families in Chickasaw County show that 14.2% or 401 of the total 2,831 families live below the poverty line. Families with no children have the highest poverty rate of 17.7%, comprising of 295 families. On the other hand, families with 3 or 4 children have the lowest poverty rate of 5.3%, which includes 8 families.
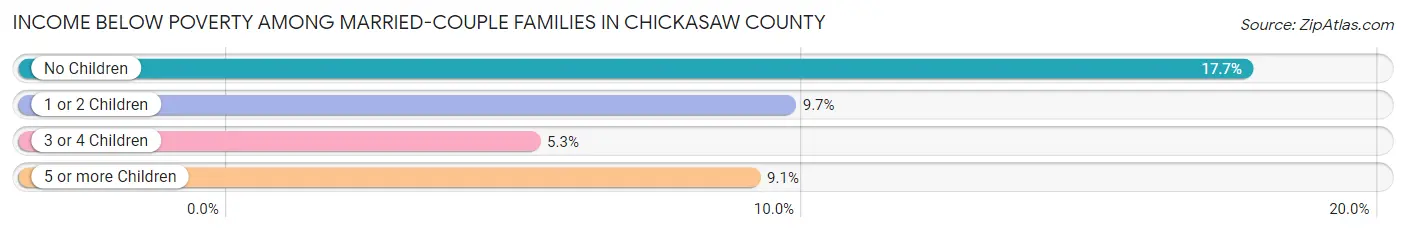
| Children | Above Poverty | Below Poverty |
| No Children | 1,374 (82.3%) | 295 (17.7%) |
| 1 or 2 Children | 902 (90.3%) | 97 (9.7%) |
| 3 or 4 Children | 144 (94.7%) | 8 (5.3%) |
| 5 or more Children | 10 (90.9%) | 1 (9.1%) |
| Total | 2,430 (85.8%) | 401 (14.2%) |
Income Below Poverty Among Single-Parent Households in Chickasaw County
According to the poverty data in Chickasaw County, 23.1% or 109 single-father households and 52.3% or 620 single-mother households are living below the poverty line. Among single-father households, those with 1 or 2 children have the highest poverty rate, with 49 households (40.5%) experiencing poverty. Likewise, among single-mother households, those with 5 or more children have the highest poverty rate, with 39 households (100.0%) falling below the poverty line.
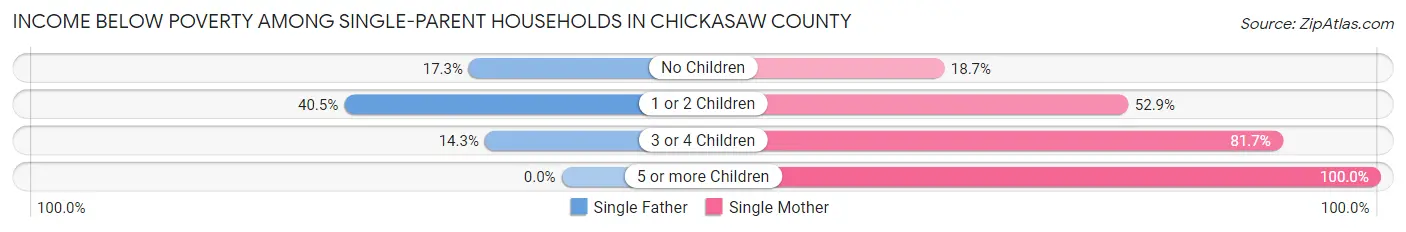
| Children | Single Father | Single Mother |
| No Children | 58 (17.3%) | 50 (18.7%) |
| 1 or 2 Children | 49 (40.5%) | 343 (52.9%) |
| 3 or 4 Children | 2 (14.3%) | 188 (81.7%) |
| 5 or more Children | 0 (0.0%) | 39 (100.0%) |
| Total | 109 (23.1%) | 620 (52.3%) |
Income Below Poverty Among Married-Couple vs Single-Parent Households in Chickasaw County
The poverty data for Chickasaw County shows that 401 of the married-couple family households (14.2%) and 729 of the single-parent households (44.0%) are living below the poverty level. Within the married-couple family households, those with no children have the highest poverty rate, with 295 households (17.7%) falling below the poverty line. Among the single-parent households, those with 5 or more children have the highest poverty rate, with 39 household (100.0%) living below poverty.
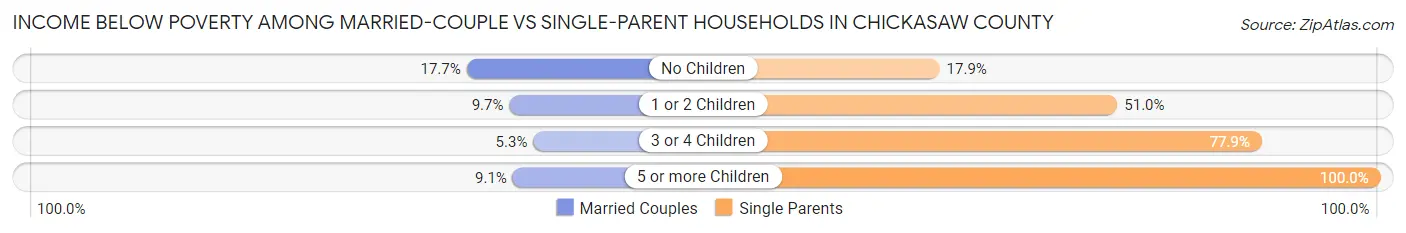
| Children | Married-Couple Families | Single-Parent Households |
| No Children | 295 (17.7%) | 108 (17.9%) |
| 1 or 2 Children | 97 (9.7%) | 392 (51.0%) |
| 3 or 4 Children | 8 (5.3%) | 190 (77.9%) |
| 5 or more Children | 1 (9.1%) | 39 (100.0%) |
| Total | 401 (14.2%) | 729 (44.0%) |
Race in Chickasaw County
The most populous races in Chickasaw County are White / Caucasian (8,557 | 50.3%), Black / African American (7,517 | 44.2%), and Hispanic or Latino (864 | 5.1%).
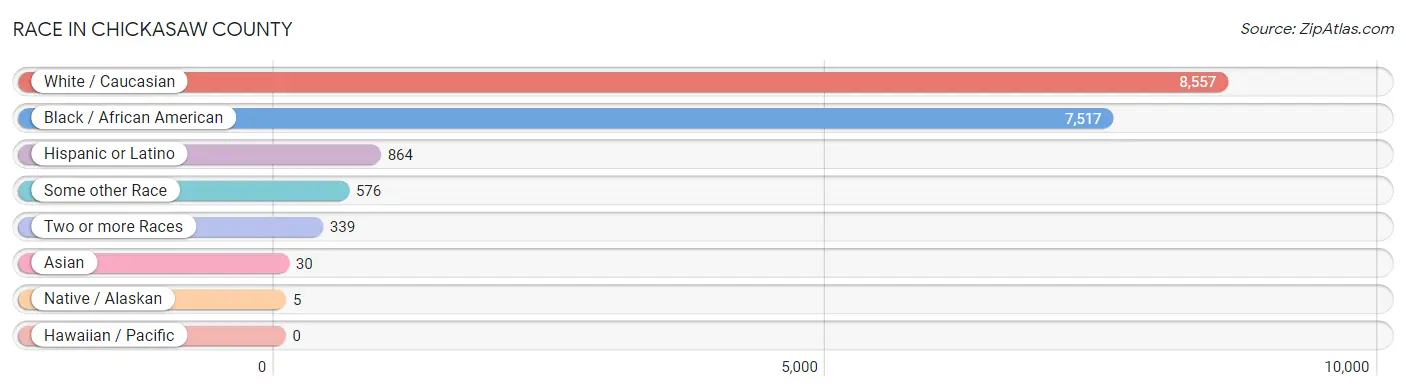
| Race | # Population | % Population |
| Asian | 30 | 0.2% |
| Black / African American | 7,517 | 44.2% |
| Hawaiian / Pacific | 0 | 0.0% |
| Hispanic or Latino | 864 | 5.1% |
| Native / Alaskan | 5 | 0.0% |
| White / Caucasian | 8,557 | 50.3% |
| Two or more Races | 339 | 2.0% |
| Some other Race | 576 | 3.4% |
| Total | 17,024 | 100.0% |
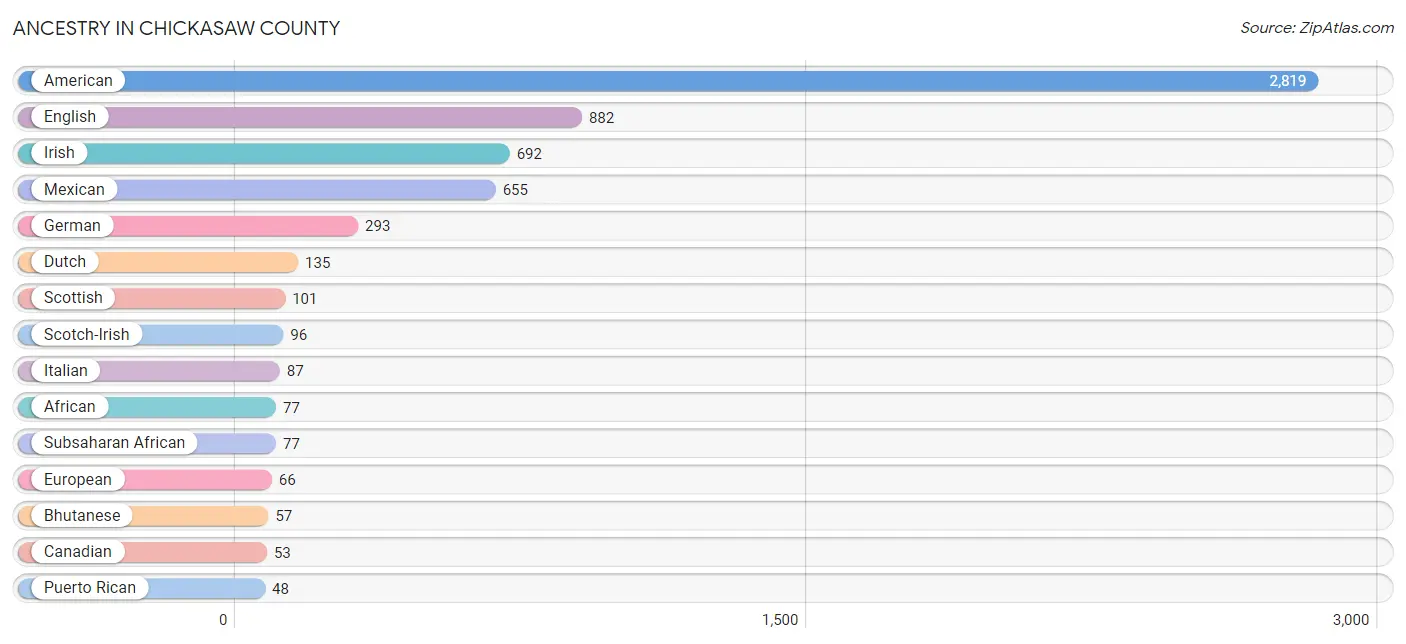
Ancestry in Chickasaw County
The most populous ancestries reported in Chickasaw County are American (2,819 | 16.6%), English (882 | 5.2%), Irish (692 | 4.1%), Mexican (655 | 3.8%), and German (293 | 1.7%), together accounting for 31.4% of all Chickasaw County residents.
| Ancestry | # Population | % Population |
| African | 77 | 0.4% |
| American | 2,819 | 16.6% |
| Arab | 2 | 0.0% |
| Austrian | 5 | 0.0% |
| Belgian | 44 | 0.3% |
| Bhutanese | 57 | 0.3% |
| Blackfeet | 27 | 0.2% |
| British | 3 | 0.0% |
| Canadian | 53 | 0.3% |
| Cherokee | 6 | 0.0% |
| Chickasaw | 1 | 0.0% |
| Dutch | 135 | 0.8% |
| Eastern European | 3 | 0.0% |
| English | 882 | 5.2% |
| European | 66 | 0.4% |
| French | 29 | 0.2% |
| French Canadian | 1 | 0.0% |
| German | 293 | 1.7% |
| Greek | 3 | 0.0% |
| Hungarian | 5 | 0.0% |
| Irish | 692 | 4.1% |
| Italian | 87 | 0.5% |
| Korean | 32 | 0.2% |
| Mexican | 655 | 3.8% |
| Norwegian | 25 | 0.2% |
| Polish | 1 | 0.0% |
| Portuguese | 35 | 0.2% |
| Potawatomi | 5 | 0.0% |
| Puerto Rican | 48 | 0.3% |
| Russian | 4 | 0.0% |
| Scotch-Irish | 96 | 0.6% |
| Scottish | 101 | 0.6% |
| Slovak | 1 | 0.0% |
| Subsaharan African | 77 | 0.4% |
| Swedish | 1 | 0.0% |
| Welsh | 23 | 0.1% | View All 36 Rows |
Immigrants in Chickasaw County
The most numerous immigrant groups reported in Chickasaw County came from Central America (390 | 2.3%), Latin America (390 | 2.3%), Mexico (333 | 2.0%), Honduras (57 | 0.3%), and Asia (30 | 0.2%), together accounting for 7.0% of all Chickasaw County residents.
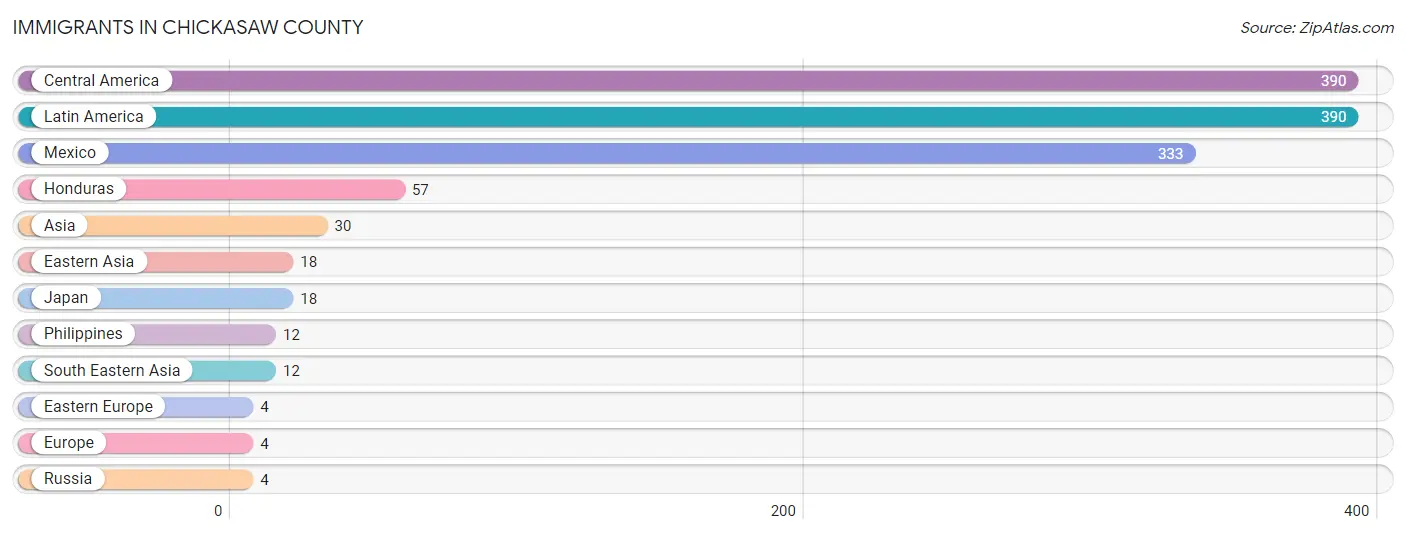
| Immigration Origin | # Population | % Population |
| Asia | 30 | 0.2% |
| Central America | 390 | 2.3% |
| Eastern Asia | 18 | 0.1% |
| Eastern Europe | 4 | 0.0% |
| Europe | 4 | 0.0% |
| Honduras | 57 | 0.3% |
| Japan | 18 | 0.1% |
| Latin America | 390 | 2.3% |
| Mexico | 333 | 2.0% |
| Philippines | 12 | 0.1% |
| Russia | 4 | 0.0% |
| South Eastern Asia | 12 | 0.1% | View All 12 Rows |
Sex and Age in Chickasaw County
Sex and Age in Chickasaw County
The most populous age groups in Chickasaw County are 10 to 14 Years (695 | 8.4%) for men and 60 to 64 Years (727 | 8.3%) for women.
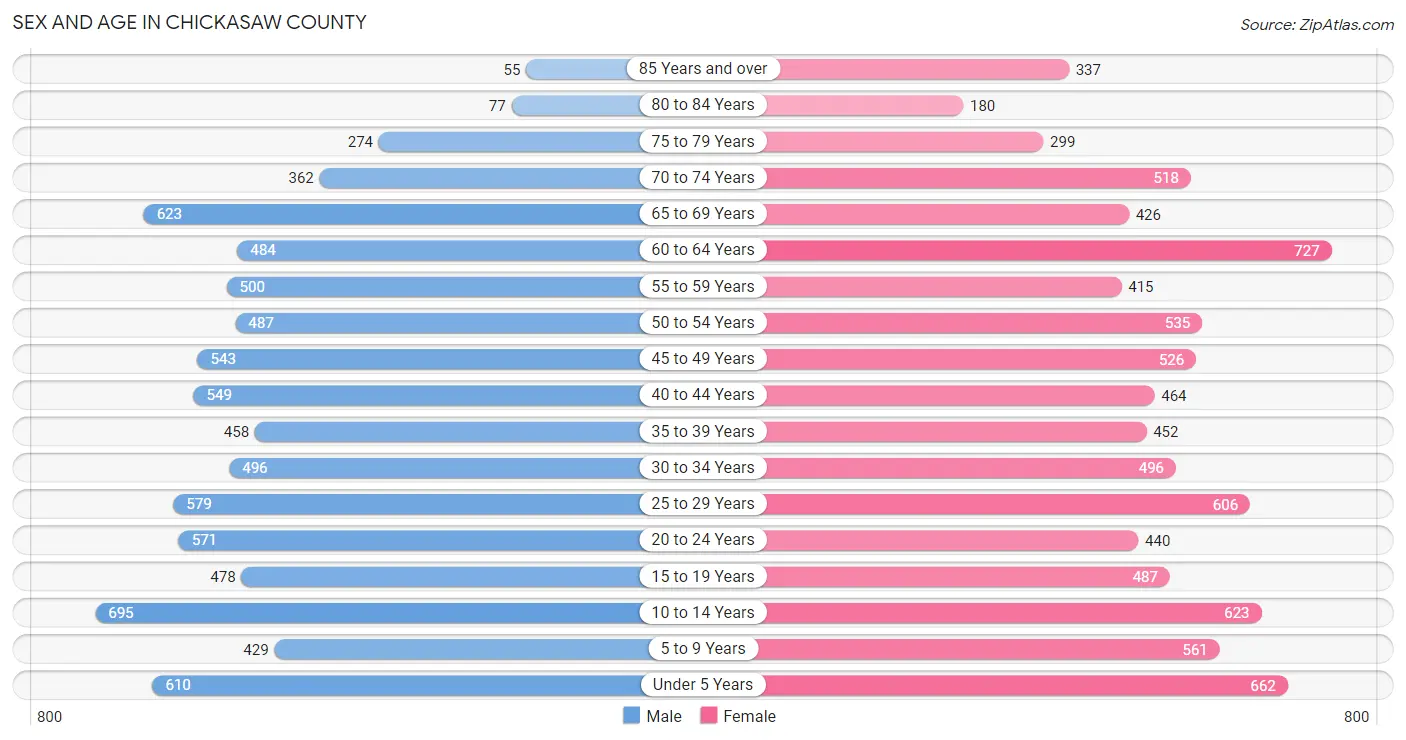
| Age Bracket | Male | Female |
| Under 5 Years | 610 (7.4%) | 662 (7.6%) |
| 5 to 9 Years | 429 (5.2%) | 561 (6.4%) |
| 10 to 14 Years | 695 (8.4%) | 623 (7.1%) |
| 15 to 19 Years | 478 (5.8%) | 487 (5.6%) |
| 20 to 24 Years | 571 (6.9%) | 440 (5.0%) |
| 25 to 29 Years | 579 (7.0%) | 606 (6.9%) |
| 30 to 34 Years | 496 (6.0%) | 496 (5.7%) |
| 35 to 39 Years | 458 (5.5%) | 452 (5.2%) |
| 40 to 44 Years | 549 (6.6%) | 464 (5.3%) |
| 45 to 49 Years | 543 (6.6%) | 526 (6.0%) |
| 50 to 54 Years | 487 (5.9%) | 535 (6.1%) |
| 55 to 59 Years | 500 (6.0%) | 415 (4.7%) |
| 60 to 64 Years | 484 (5.9%) | 727 (8.3%) |
| 65 to 69 Years | 623 (7.5%) | 426 (4.9%) |
| 70 to 74 Years | 362 (4.4%) | 518 (5.9%) |
| 75 to 79 Years | 274 (3.3%) | 299 (3.4%) |
| 80 to 84 Years | 77 (0.9%) | 180 (2.1%) |
| 85 Years and over | 55 (0.7%) | 337 (3.8%) |
| Total | 8,270 (100.0%) | 8,754 (100.0%) |
Families and Households in Chickasaw County
Median Family Size in Chickasaw County
The median family size in Chickasaw County is 3.09 persons per family, with single female/mother families (1,185 | 26.4%) accounting for the largest median family size of 3.36 persons per family. On the other hand, single male/father families (471 | 10.5%) represent the smallest median family size with 2.63 persons per family.
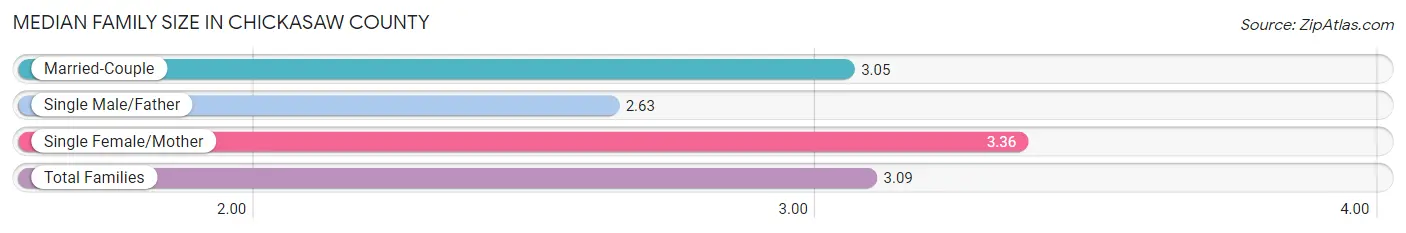
| Family Type | # Families | Family Size |
| Married-Couple | 2,831 (63.1%) | 3.05 |
| Single Male/Father | 471 (10.5%) | 2.63 |
| Single Female/Mother | 1,185 (26.4%) | 3.36 |
| Total Families | 4,487 (100.0%) | 3.09 |
Median Household Size in Chickasaw County
The median household size in Chickasaw County is 2.44 persons per household, with single female/mother households (1,185 | 17.5%) accounting for the largest median household size of 3.53 persons per household. non-family households (2,280 | 33.7%) represent the smallest median household size with 1.06 persons per household.
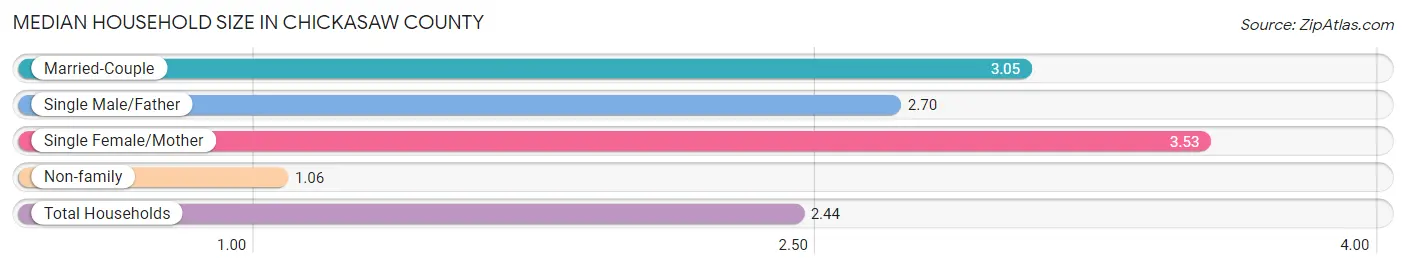
| Household Type | # Households | Household Size |
| Married-Couple | 2,831 (41.8%) | 3.05 |
| Single Male/Father | 471 (7.0%) | 2.70 |
| Single Female/Mother | 1,185 (17.5%) | 3.53 |
| Non-family | 2,280 (33.7%) | 1.06 |
| Total Households | 6,767 (100.0%) | 2.44 |
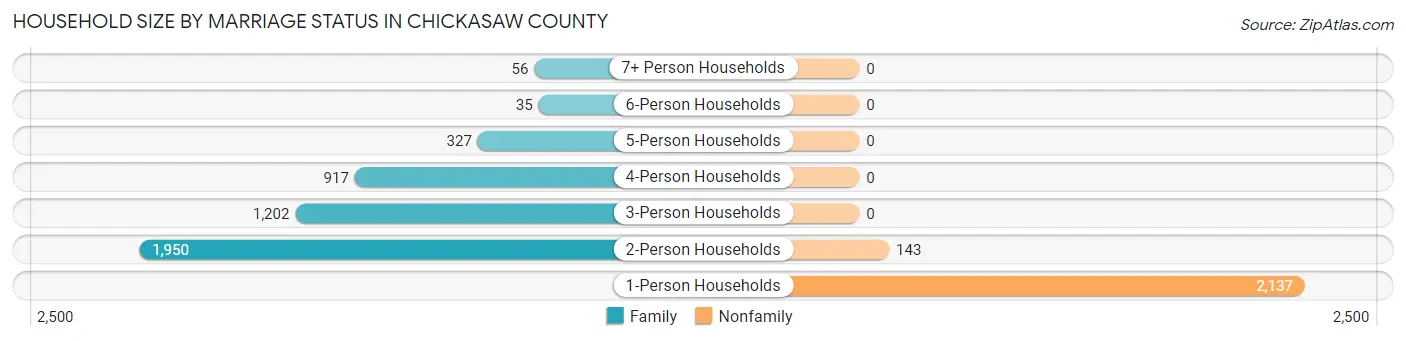
Household Size by Marriage Status in Chickasaw County
Out of a total of 6,767 households in Chickasaw County, 4,487 (66.3%) are family households, while 2,280 (33.7%) are nonfamily households. The most numerous type of family households are 2-person households, comprising 1,950, and the most common type of nonfamily households are 1-person households, comprising 2,137.
| Household Size | Family Households | Nonfamily Households |
| 1-Person Households | - | 2,137 (31.6%) |
| 2-Person Households | 1,950 (28.8%) | 143 (2.1%) |
| 3-Person Households | 1,202 (17.8%) | 0 (0.0%) |
| 4-Person Households | 917 (13.6%) | 0 (0.0%) |
| 5-Person Households | 327 (4.8%) | 0 (0.0%) |
| 6-Person Households | 35 (0.5%) | 0 (0.0%) |
| 7+ Person Households | 56 (0.8%) | 0 (0.0%) |
| Total | 4,487 (66.3%) | 2,280 (33.7%) |
Female Fertility in Chickasaw County
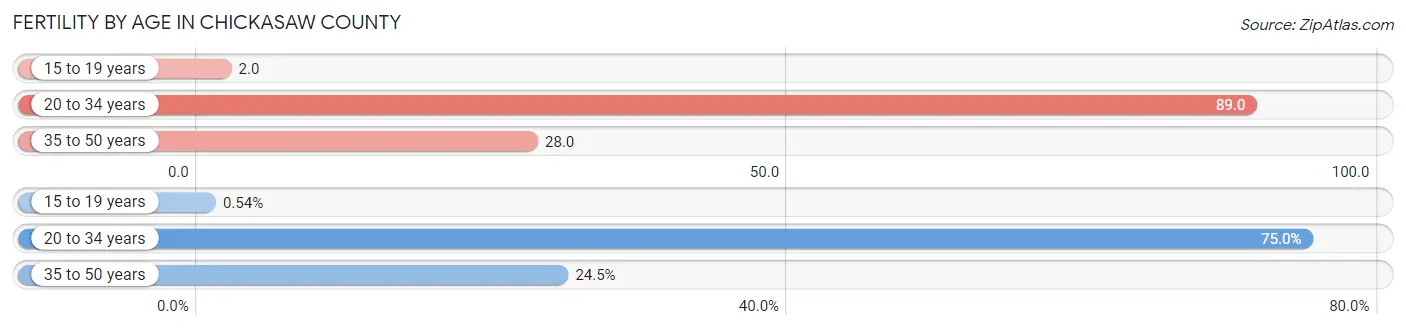
Fertility by Age in Chickasaw County
Average fertility rate in Chickasaw County is 51.0 births per 1,000 women. Women in the age bracket of 20 to 34 years have the highest fertility rate with 89.0 births per 1,000 women. Women in the age bracket of 20 to 34 years acount for 75.0% of all women with births.
| Age Bracket | Women with Births | Births / 1,000 Women |
| 15 to 19 years | 1 (0.5%) | 2.0 |
| 20 to 34 years | 138 (75.0%) | 89.0 |
| 35 to 50 years | 45 (24.5%) | 28.0 |
| Total | 184 (100.0%) | 51.0 |
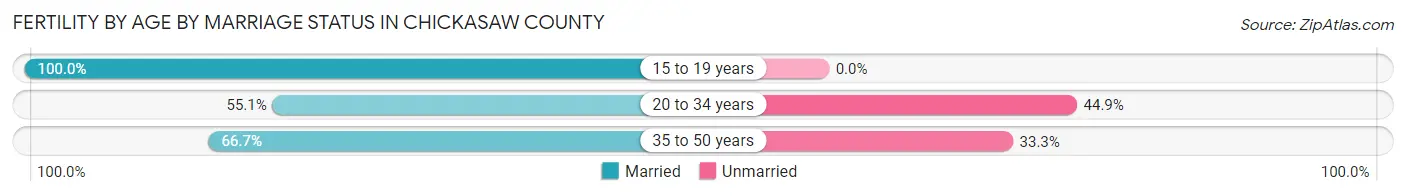
Fertility by Age by Marriage Status in Chickasaw County
58.2% of women with births (184) in Chickasaw County are married. The highest percentage of unmarried women with births falls into 20 to 34 years age bracket with 44.9% of them unmarried at the time of birth, while the lowest percentage of unmarried women with births belong to 15 to 19 years age bracket with 0.0% of them unmarried.
| Age Bracket | Married | Unmarried |
| 15 to 19 years | 1 (100.0%) | 0 (0.0%) |
| 20 to 34 years | 76 (55.1%) | 62 (44.9%) |
| 35 to 50 years | 30 (66.7%) | 15 (33.3%) |
| Total | 107 (58.2%) | 77 (41.8%) |
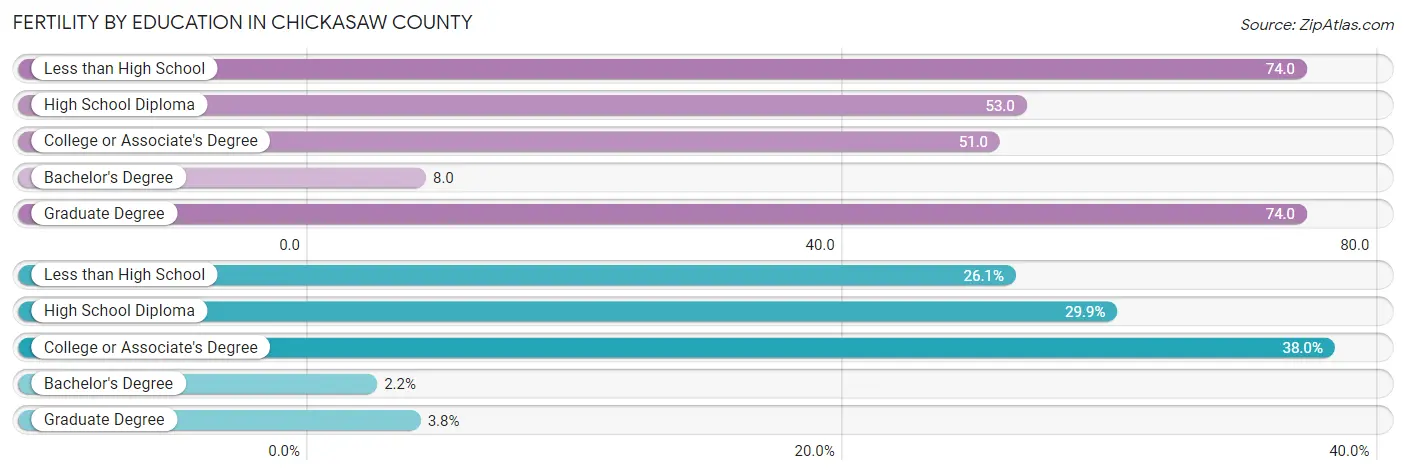
Fertility by Education in Chickasaw County
Average fertility rate in Chickasaw County is 51.0 births per 1,000 women. Women with the education attainment of less than high school have the highest fertility rate of 74.0 births per 1,000 women, while women with the education attainment of bachelor's degree have the lowest fertility at 8.0 births per 1,000 women. Women with the education attainment of college or associate's degree represent 38.0% of all women with births.
| Educational Attainment | Women with Births | Births / 1,000 Women |
| Less than High School | 48 (26.1%) | 74.0 |
| High School Diploma | 55 (29.9%) | 53.0 |
| College or Associate's Degree | 70 (38.0%) | 51.0 |
| Bachelor's Degree | 4 (2.2%) | 8.0 |
| Graduate Degree | 7 (3.8%) | 74.0 |
| Total | 184 (100.0%) | 51.0 |
Fertility by Education by Marriage Status in Chickasaw County
41.8% of women with births in Chickasaw County are unmarried. Women with the educational attainment of bachelor's degree are most likely to be married with 100.0% of them married at childbirth, while women with the educational attainment of high school diploma are least likely to be married with 85.5% of them unmarried at childbirth.
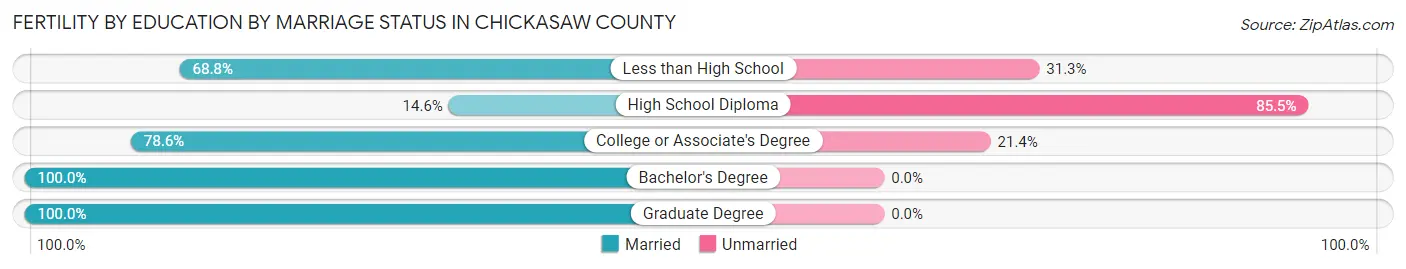
| Educational Attainment | Married | Unmarried |
| Less than High School | 33 (68.8%) | 15 (31.2%) |
| High School Diploma | 8 (14.5%) | 47 (85.5%) |
| College or Associate's Degree | 55 (78.6%) | 15 (21.4%) |
| Bachelor's Degree | 4 (100.0%) | 0 (0.0%) |
| Graduate Degree | 7 (100.0%) | 0 (0.0%) |
| Total | 107 (58.2%) | 77 (41.8%) |
Employment Characteristics in Chickasaw County
Employment by Class of Employer in Chickasaw County
Among the 6,566 employed individuals in Chickasaw County, private company employees (4,678 | 71.3%), self-employed (not incorporated) (724 | 11.0%), and local government employees (423 | 6.4%) make up the most common classes of employment.
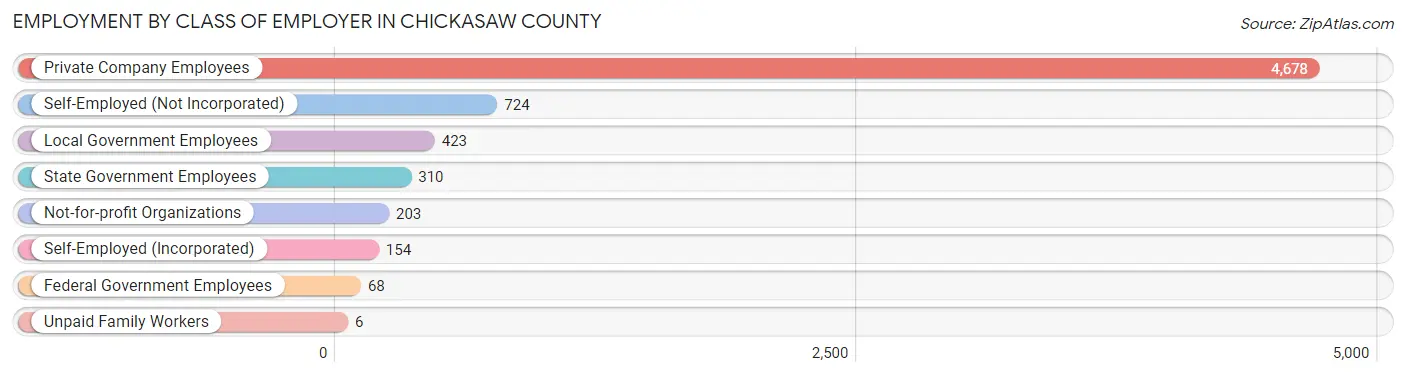
| Employer Class | # Employees | % Employees |
| Private Company Employees | 4,678 | 71.3% |
| Self-Employed (Incorporated) | 154 | 2.4% |
| Self-Employed (Not Incorporated) | 724 | 11.0% |
| Not-for-profit Organizations | 203 | 3.1% |
| Local Government Employees | 423 | 6.4% |
| State Government Employees | 310 | 4.7% |
| Federal Government Employees | 68 | 1.0% |
| Unpaid Family Workers | 6 | 0.1% |
| Total | 6,566 | 100.0% |
Employment Status by Age in Chickasaw County
According to the labor force statistics for Chickasaw County, out of the total population over 16 years of age (13,269), 52.5% or 6,966 individuals are in the labor force, with 3.1% or 216 of them unemployed. The age group with the highest labor force participation rate is 35 to 44 years, with 79.2% or 1,523 individuals in the labor force. Within the labor force, the 75 years and over age range has the highest percentage of unemployed individuals, with 16.2% or 12 of them being unemployed.
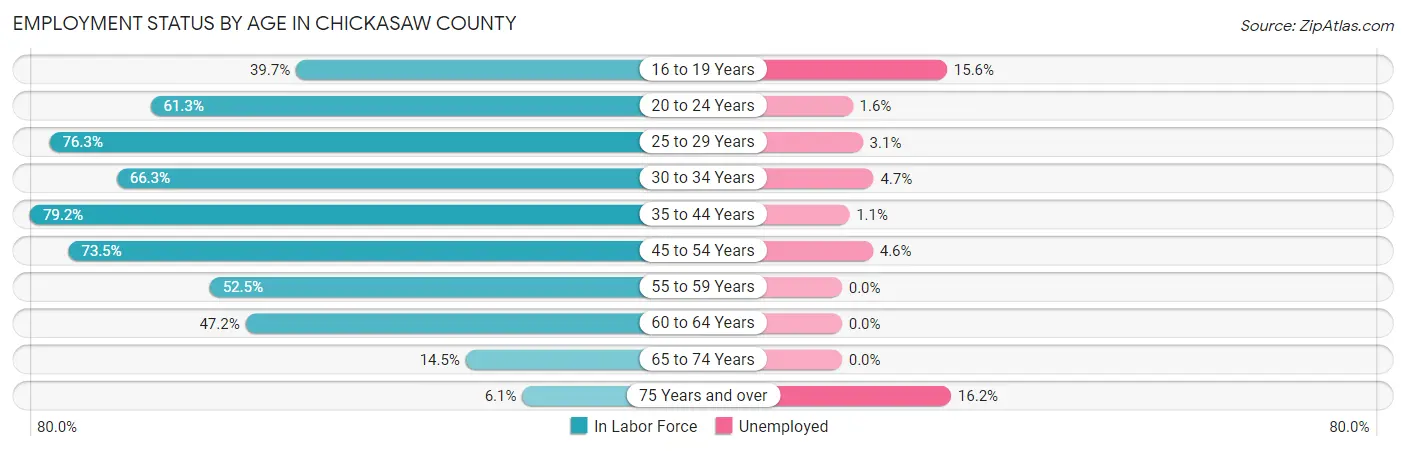
| Age Bracket | In Labor Force | Unemployed |
| 16 to 19 Years | 314 (39.7%) | 49 (15.6%) |
| 20 to 24 Years | 620 (61.3%) | 10 (1.6%) |
| 25 to 29 Years | 904 (76.3%) | 28 (3.1%) |
| 30 to 34 Years | 658 (66.3%) | 31 (4.7%) |
| 35 to 44 Years | 1,523 (79.2%) | 17 (1.1%) |
| 45 to 54 Years | 1,537 (73.5%) | 71 (4.6%) |
| 55 to 59 Years | 480 (52.5%) | 0 (0.0%) |
| 60 to 64 Years | 572 (47.2%) | 0 (0.0%) |
| 65 to 74 Years | 280 (14.5%) | 0 (0.0%) |
| 75 Years and over | 75 (6.1%) | 12 (16.2%) |
| Total | 6,966 (52.5%) | 216 (3.1%) |
Employment Status by Educational Attainment in Chickasaw County
According to labor force statistics for Chickasaw County, 68.2% of individuals (5,672) out of the total population between 25 and 64 years of age (8,317) are in the labor force, with 2.6% or 147 of them being unemployed. The group with the highest labor force participation rate are those with the educational attainment of bachelor's degree or higher, with 89.5% or 892 individuals in the labor force. Within the labor force, individuals with high school diploma education have the highest percentage of unemployment, with 3.9% or 74 of them being unemployed.
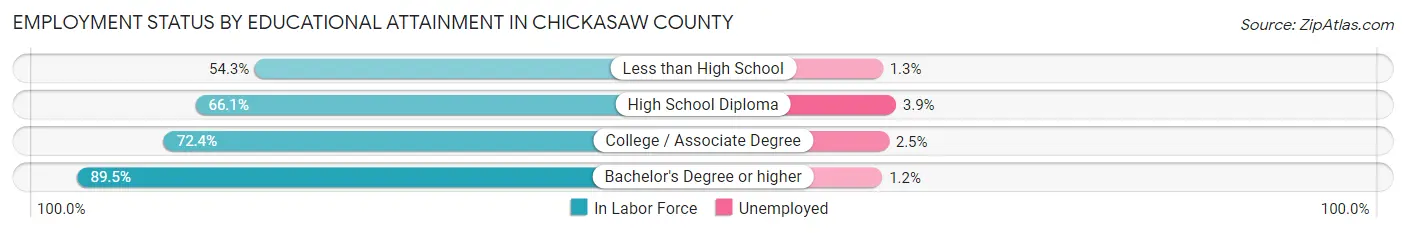
| Educational Attainment | In Labor Force | Unemployed |
| Less than High School | 1,013 (54.3%) | 24 (1.3%) |
| High School Diploma | 1,903 (66.1%) | 112 (3.9%) |
| College / Associate Degree | 1,865 (72.4%) | 64 (2.5%) |
| Bachelor's Degree or higher | 892 (89.5%) | 12 (1.2%) |
| Total | 5,672 (68.2%) | 216 (2.6%) |
Employment Occupations by Sex in Chickasaw County
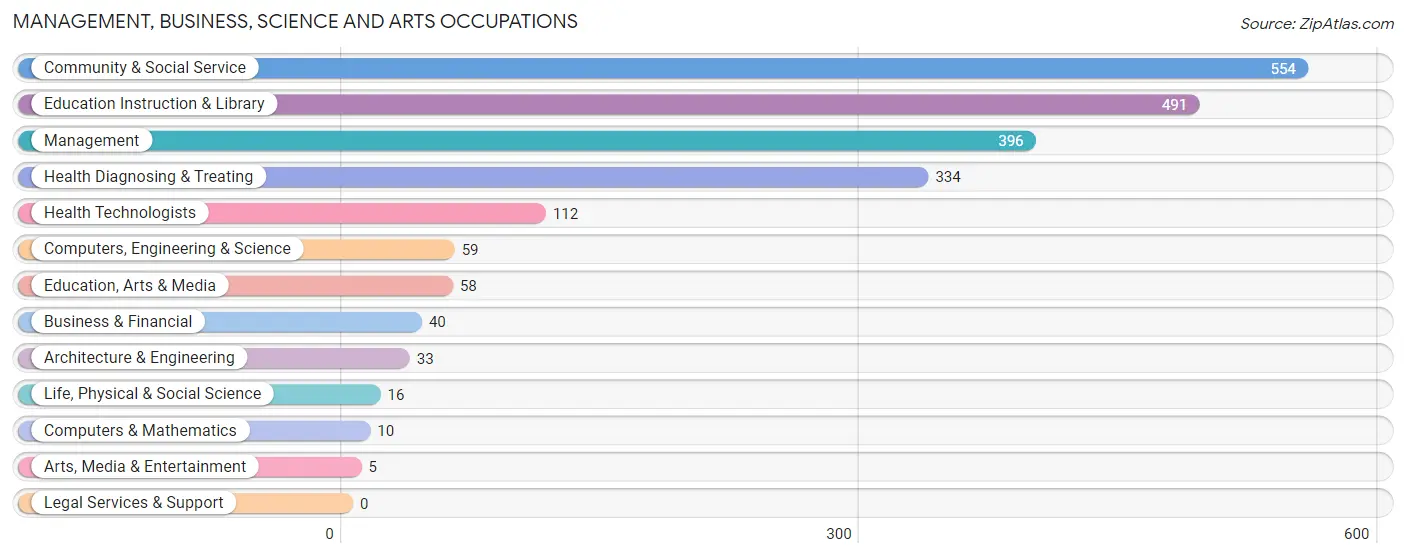
Management, Business, Science and Arts Occupations
The most common Management, Business, Science and Arts occupations in Chickasaw County are Community & Social Service (554 | 8.2%), Education Instruction & Library (491 | 7.3%), Management (396 | 5.9%), Health Diagnosing & Treating (334 | 5.0%), and Health Technologists (112 | 1.7%).
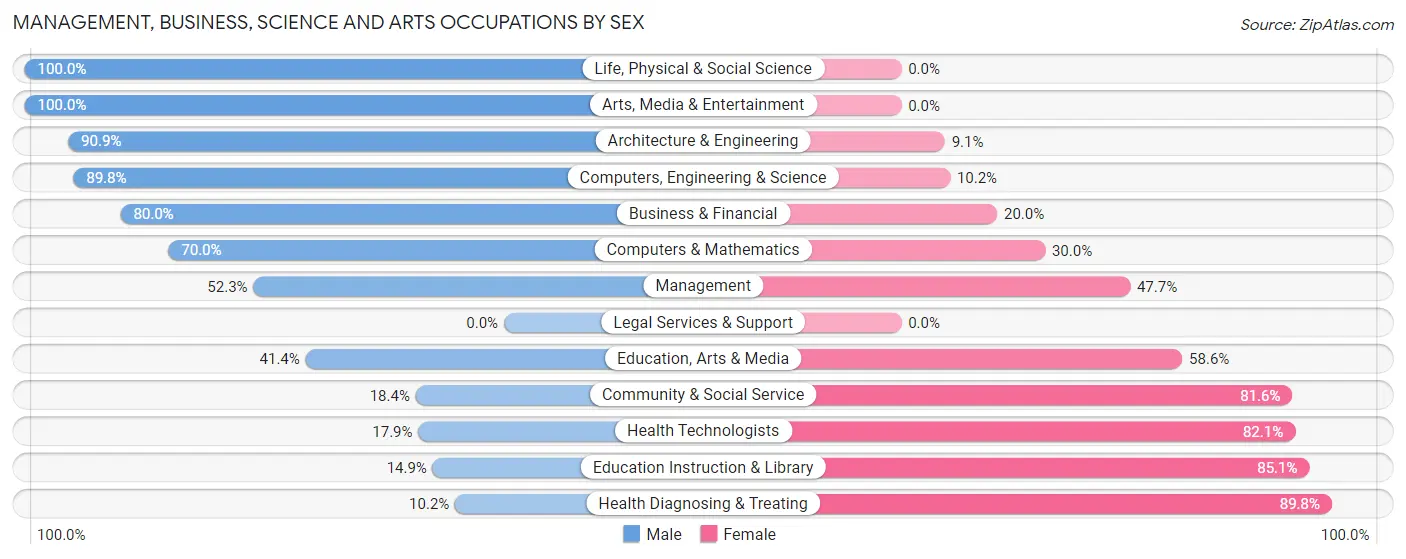
Management, Business, Science and Arts Occupations by Sex
Within the Management, Business, Science and Arts occupations in Chickasaw County, the most male-oriented occupations are Life, Physical & Social Science (100.0%), Arts, Media & Entertainment (100.0%), and Architecture & Engineering (90.9%), while the most female-oriented occupations are Health Diagnosing & Treating (89.8%), Education Instruction & Library (85.1%), and Health Technologists (82.1%).
| Occupation | Male | Female |
| Management | 207 (52.3%) | 189 (47.7%) |
| Business & Financial | 32 (80.0%) | 8 (20.0%) |
| Computers, Engineering & Science | 53 (89.8%) | 6 (10.2%) |
| Computers & Mathematics | 7 (70.0%) | 3 (30.0%) |
| Architecture & Engineering | 30 (90.9%) | 3 (9.1%) |
| Life, Physical & Social Science | 16 (100.0%) | 0 (0.0%) |
| Community & Social Service | 102 (18.4%) | 452 (81.6%) |
| Education, Arts & Media | 24 (41.4%) | 34 (58.6%) |
| Legal Services & Support | 0 (0.0%) | 0 (0.0%) |
| Education Instruction & Library | 73 (14.9%) | 418 (85.1%) |
| Arts, Media & Entertainment | 5 (100.0%) | 0 (0.0%) |
| Health Diagnosing & Treating | 34 (10.2%) | 300 (89.8%) |
| Health Technologists | 20 (17.9%) | 92 (82.1%) |
| Total (Category) | 428 (30.9%) | 955 (69.1%) |
| Total (Overall) | 3,437 (51.0%) | 3,306 (49.0%) |
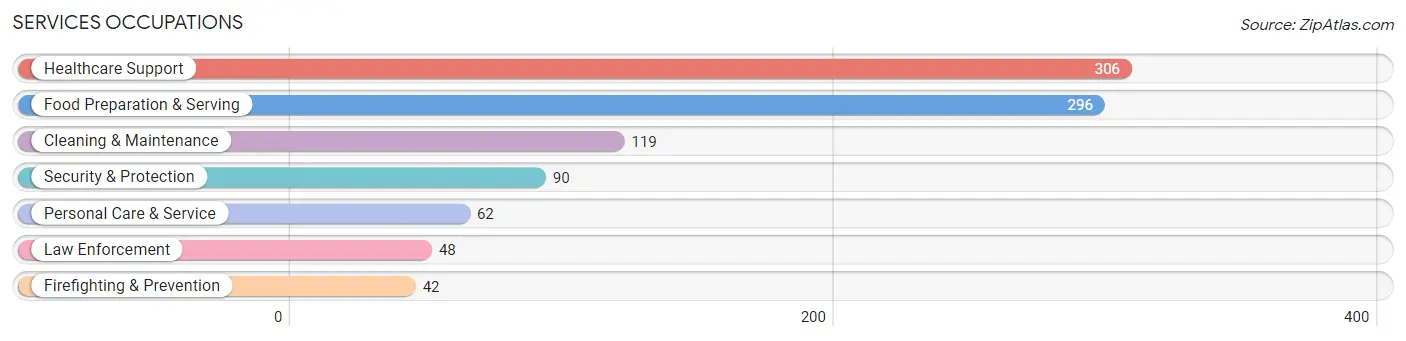
Services Occupations
The most common Services occupations in Chickasaw County are Healthcare Support (306 | 4.5%), Food Preparation & Serving (296 | 4.4%), Cleaning & Maintenance (119 | 1.8%), Security & Protection (90 | 1.3%), and Personal Care & Service (62 | 0.9%).
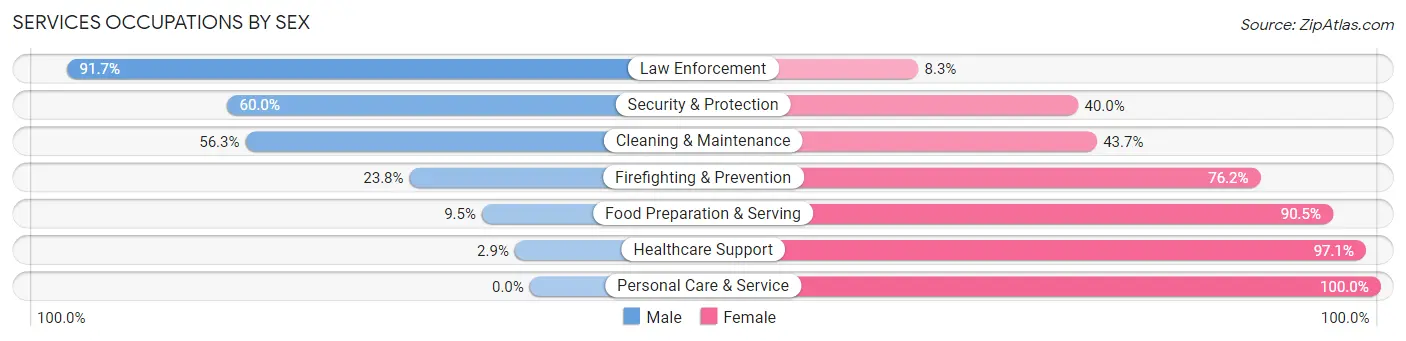
Services Occupations by Sex
Within the Services occupations in Chickasaw County, the most male-oriented occupations are Law Enforcement (91.7%), Security & Protection (60.0%), and Cleaning & Maintenance (56.3%), while the most female-oriented occupations are Personal Care & Service (100.0%), Healthcare Support (97.1%), and Food Preparation & Serving (90.5%).
| Occupation | Male | Female |
| Healthcare Support | 9 (2.9%) | 297 (97.1%) |
| Security & Protection | 54 (60.0%) | 36 (40.0%) |
| Firefighting & Prevention | 10 (23.8%) | 32 (76.2%) |
| Law Enforcement | 44 (91.7%) | 4 (8.3%) |
| Food Preparation & Serving | 28 (9.5%) | 268 (90.5%) |
| Cleaning & Maintenance | 67 (56.3%) | 52 (43.7%) |
| Personal Care & Service | 0 (0.0%) | 62 (100.0%) |
| Total (Category) | 158 (18.1%) | 715 (81.9%) |
| Total (Overall) | 3,437 (51.0%) | 3,306 (49.0%) |
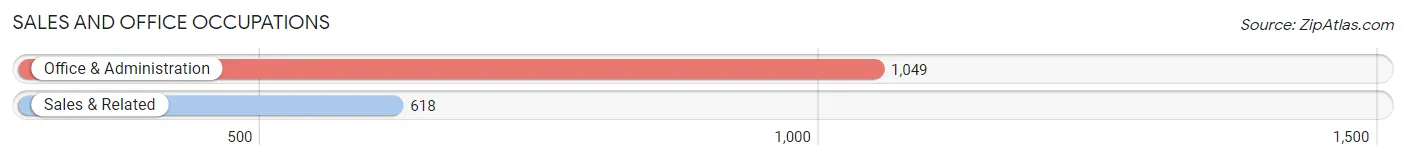
Sales and Office Occupations
The most common Sales and Office occupations in Chickasaw County are Office & Administration (1,049 | 15.6%), and Sales & Related (618 | 9.2%).
Sales and Office Occupations by Sex
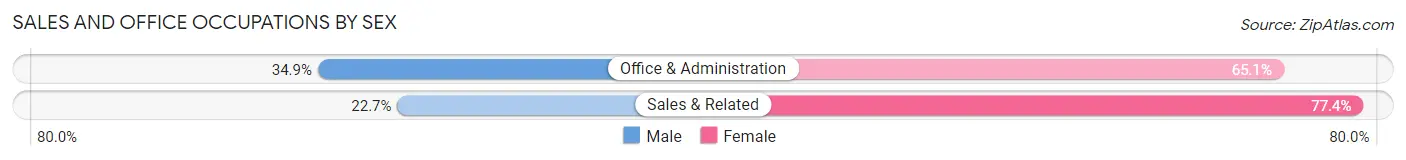
| Occupation | Male | Female |
| Sales & Related | 140 (22.7%) | 478 (77.3%) |
| Office & Administration | 366 (34.9%) | 683 (65.1%) |
| Total (Category) | 506 (30.3%) | 1,161 (69.7%) |
| Total (Overall) | 3,437 (51.0%) | 3,306 (49.0%) |
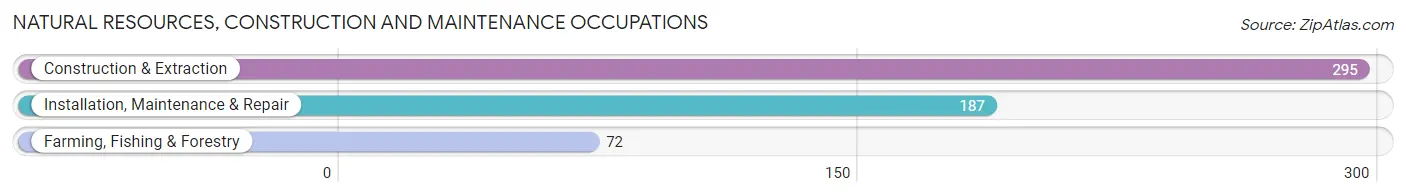
Natural Resources, Construction and Maintenance Occupations
The most common Natural Resources, Construction and Maintenance occupations in Chickasaw County are Construction & Extraction (295 | 4.4%), Installation, Maintenance & Repair (187 | 2.8%), and Farming, Fishing & Forestry (72 | 1.1%).
Natural Resources, Construction and Maintenance Occupations by Sex
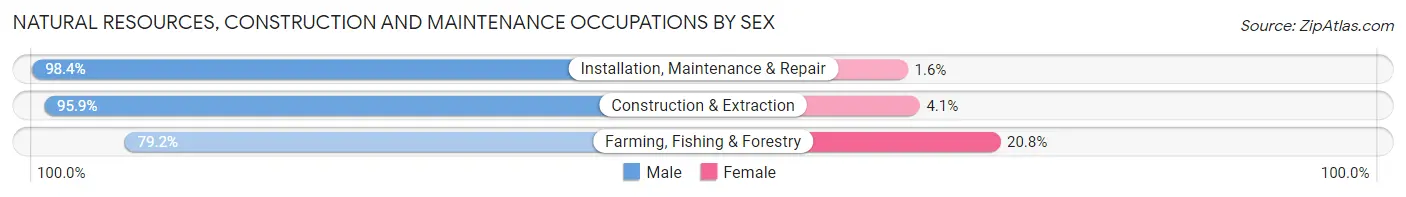
| Occupation | Male | Female |
| Farming, Fishing & Forestry | 57 (79.2%) | 15 (20.8%) |
| Construction & Extraction | 283 (95.9%) | 12 (4.1%) |
| Installation, Maintenance & Repair | 184 (98.4%) | 3 (1.6%) |
| Total (Category) | 524 (94.6%) | 30 (5.4%) |
| Total (Overall) | 3,437 (51.0%) | 3,306 (49.0%) |
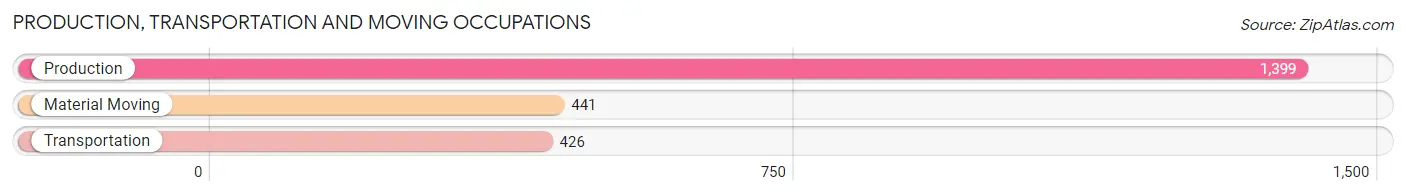
Production, Transportation and Moving Occupations
The most common Production, Transportation and Moving occupations in Chickasaw County are Production (1,399 | 20.7%), Material Moving (441 | 6.5%), and Transportation (426 | 6.3%).
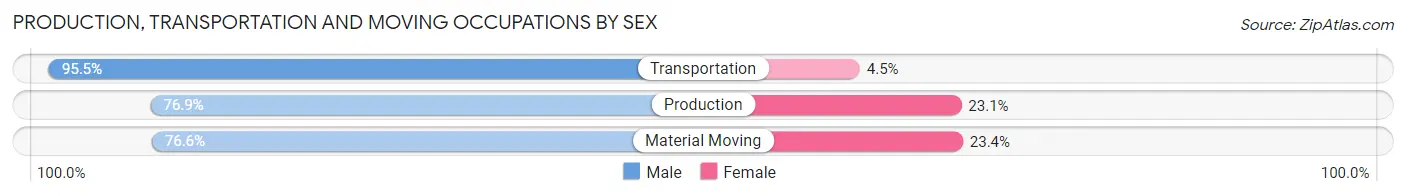
Production, Transportation and Moving Occupations by Sex
| Occupation | Male | Female |
| Production | 1,076 (76.9%) | 323 (23.1%) |
| Transportation | 407 (95.5%) | 19 (4.5%) |
| Material Moving | 338 (76.6%) | 103 (23.4%) |
| Total (Category) | 1,821 (80.4%) | 445 (19.6%) |
| Total (Overall) | 3,437 (51.0%) | 3,306 (49.0%) |
Employment Industries by Sex in Chickasaw County
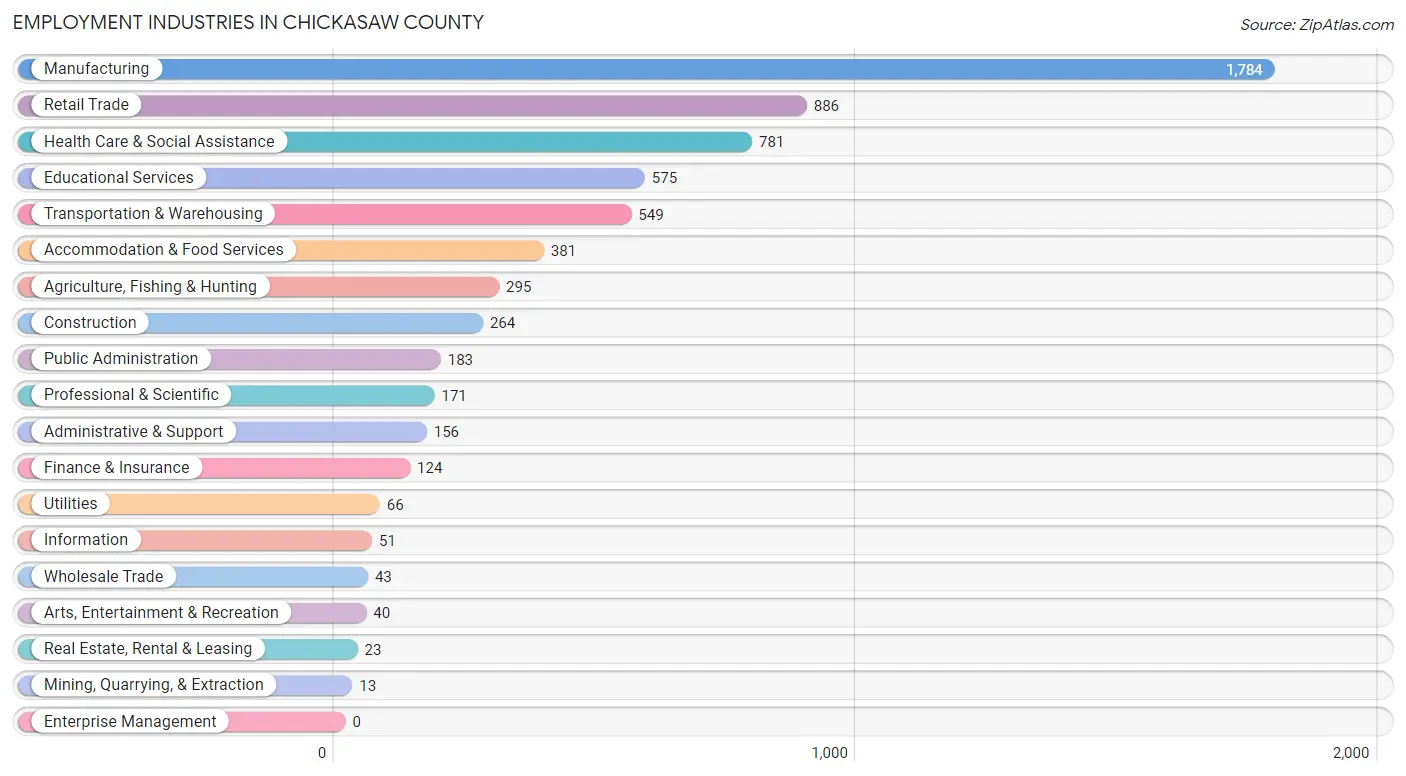
Employment Industries in Chickasaw County
The major employment industries in Chickasaw County include Manufacturing (1,784 | 26.5%), Retail Trade (886 | 13.1%), Health Care & Social Assistance (781 | 11.6%), Educational Services (575 | 8.5%), and Transportation & Warehousing (549 | 8.1%).
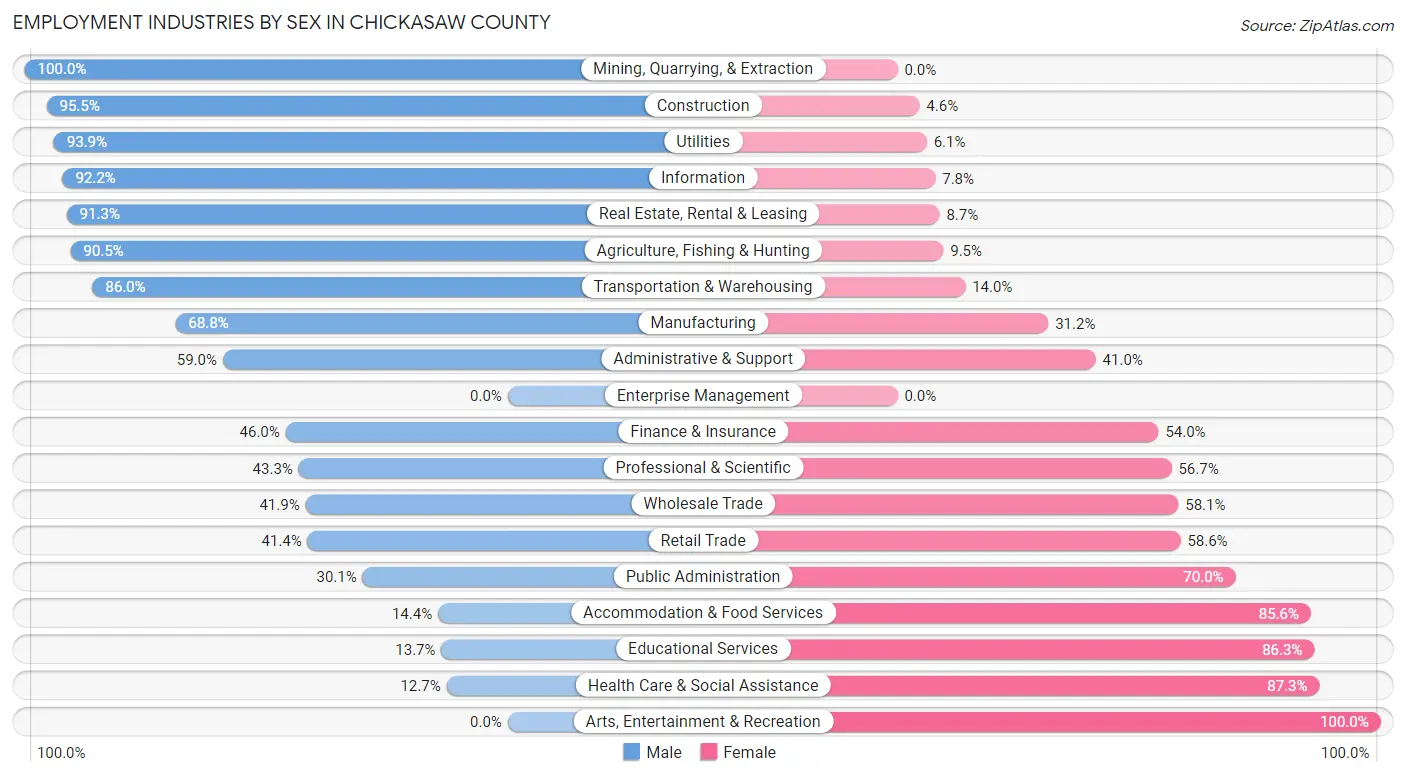
Employment Industries by Sex in Chickasaw County
The Chickasaw County industries that see more men than women are Mining, Quarrying, & Extraction (100.0%), Construction (95.5%), and Utilities (93.9%), whereas the industries that tend to have a higher number of women are Arts, Entertainment & Recreation (100.0%), Health Care & Social Assistance (87.3%), and Educational Services (86.3%).
| Industry | Male | Female |
| Agriculture, Fishing & Hunting | 267 (90.5%) | 28 (9.5%) |
| Mining, Quarrying, & Extraction | 13 (100.0%) | 0 (0.0%) |
| Construction | 252 (95.5%) | 12 (4.5%) |
| Manufacturing | 1,227 (68.8%) | 557 (31.2%) |
| Wholesale Trade | 18 (41.9%) | 25 (58.1%) |
| Retail Trade | 367 (41.4%) | 519 (58.6%) |
| Transportation & Warehousing | 472 (86.0%) | 77 (14.0%) |
| Utilities | 62 (93.9%) | 4 (6.1%) |
| Information | 47 (92.2%) | 4 (7.8%) |
| Finance & Insurance | 57 (46.0%) | 67 (54.0%) |
| Real Estate, Rental & Leasing | 21 (91.3%) | 2 (8.7%) |
| Professional & Scientific | 74 (43.3%) | 97 (56.7%) |
| Enterprise Management | 0 (0.0%) | 0 (0.0%) |
| Administrative & Support | 92 (59.0%) | 64 (41.0%) |
| Educational Services | 79 (13.7%) | 496 (86.3%) |
| Health Care & Social Assistance | 99 (12.7%) | 682 (87.3%) |
| Arts, Entertainment & Recreation | 0 (0.0%) | 40 (100.0%) |
| Accommodation & Food Services | 55 (14.4%) | 326 (85.6%) |
| Public Administration | 55 (30.0%) | 128 (70.0%) |
| Total | 3,437 (51.0%) | 3,306 (49.0%) |
Education in Chickasaw County
School Enrollment in Chickasaw County
The most common levels of schooling among the 3,710 students in Chickasaw County are middle school (934 | 25.2%), elementary school (895 | 24.1%), and high school (806 | 21.7%).
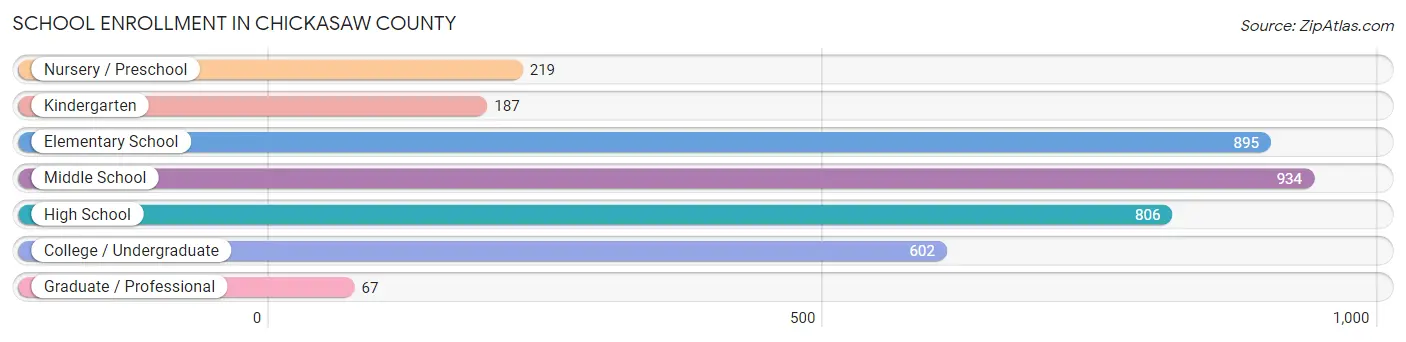
| School Level | # Students | % Students |
| Nursery / Preschool | 219 | 5.9% |
| Kindergarten | 187 | 5.0% |
| Elementary School | 895 | 24.1% |
| Middle School | 934 | 25.2% |
| High School | 806 | 21.7% |
| College / Undergraduate | 602 | 16.2% |
| Graduate / Professional | 67 | 1.8% |
| Total | 3,710 | 100.0% |
School Enrollment by Age by Funding Source in Chickasaw County
Out of a total of 3,710 students who are enrolled in schools in Chickasaw County, 356 (9.6%) attend a private institution, while the remaining 3,354 (90.4%) are enrolled in public schools. The age group of 18 to 19 year olds has the highest likelihood of being enrolled in private schools, with 71 (27.0% in the age bracket) enrolled. Conversely, the age group of 20 to 24 year olds has the lowest likelihood of being enrolled in a private school, with 272 (100.0% in the age bracket) attending a public institution.
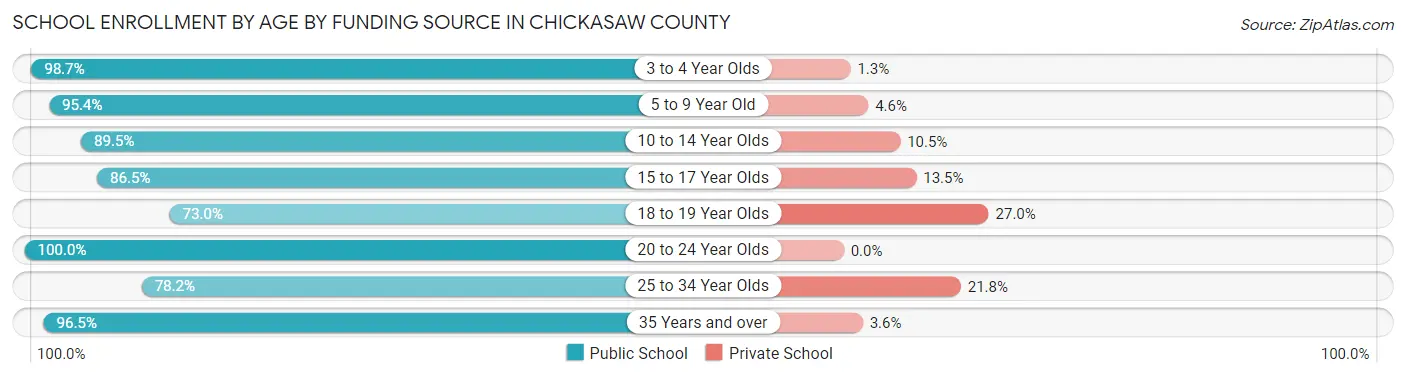
| Age Bracket | Public School | Private School |
| 3 to 4 Year Olds | 157 (98.7%) | 2 (1.3%) |
| 5 to 9 Year Old | 857 (95.4%) | 41 (4.6%) |
| 10 to 14 Year Olds | 1,121 (89.5%) | 132 (10.5%) |
| 15 to 17 Year Olds | 531 (86.5%) | 83 (13.5%) |
| 18 to 19 Year Olds | 192 (73.0%) | 71 (27.0%) |
| 20 to 24 Year Olds | 272 (100.0%) | 0 (0.0%) |
| 25 to 34 Year Olds | 86 (78.2%) | 24 (21.8%) |
| 35 Years and over | 136 (96.5%) | 5 (3.5%) |
| Total | 3,354 (90.4%) | 356 (9.6%) |
Educational Attainment by Field of Study in Chickasaw County
Education (382 | 27.7%), business (255 | 18.5%), science & technology (223 | 16.2%), bio, nature & agricultural (153 | 11.1%), and arts & humanities (141 | 10.2%) are the most common fields of study among 1,377 individuals in Chickasaw County who have obtained a bachelor's degree or higher.
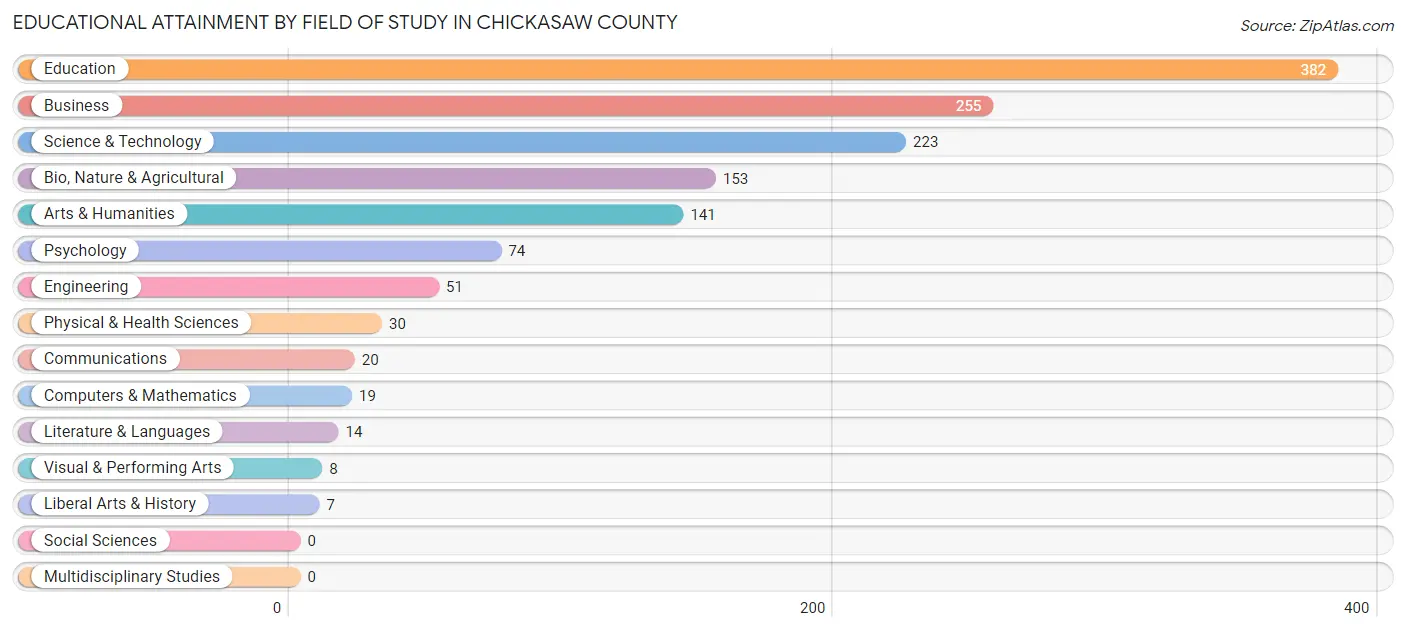
| Field of Study | # Graduates | % Graduates |
| Computers & Mathematics | 19 | 1.4% |
| Bio, Nature & Agricultural | 153 | 11.1% |
| Physical & Health Sciences | 30 | 2.2% |
| Psychology | 74 | 5.4% |
| Social Sciences | 0 | 0.0% |
| Engineering | 51 | 3.7% |
| Multidisciplinary Studies | 0 | 0.0% |
| Science & Technology | 223 | 16.2% |
| Business | 255 | 18.5% |
| Education | 382 | 27.7% |
| Literature & Languages | 14 | 1.0% |
| Liberal Arts & History | 7 | 0.5% |
| Visual & Performing Arts | 8 | 0.6% |
| Communications | 20 | 1.5% |
| Arts & Humanities | 141 | 10.2% |
| Total | 1,377 | 100.0% |
Transportation & Commute in Chickasaw County
Vehicle Availability by Sex in Chickasaw County
The most prevalent vehicle ownership categories in Chickasaw County are males with 2 vehicles (1,287, accounting for 37.9%) and females with 2 vehicles (1,133, making up 40.6%).
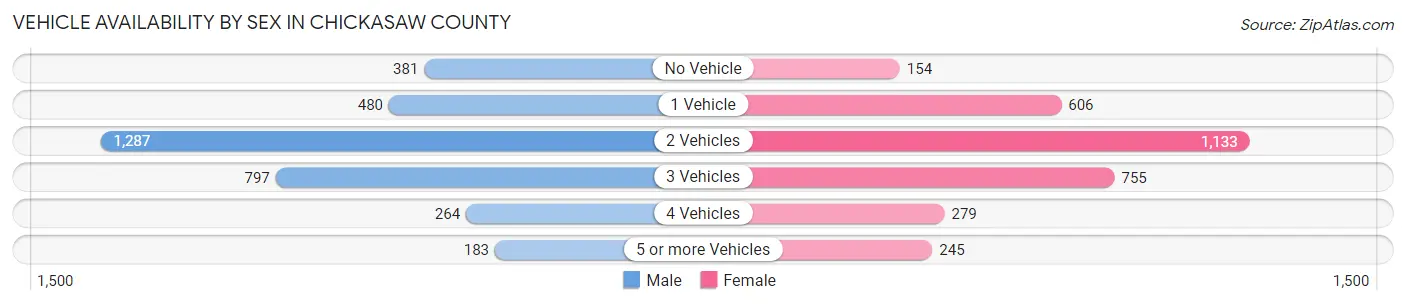
| Vehicles Available | Male | Female |
| No Vehicle | 381 (11.2%) | 154 (4.9%) |
| 1 Vehicle | 480 (14.1%) | 606 (19.1%) |
| 2 Vehicles | 1,287 (37.9%) | 1,133 (35.7%) |
| 3 Vehicles | 797 (23.5%) | 755 (23.8%) |
| 4 Vehicles | 264 (7.8%) | 279 (8.8%) |
| 5 or more Vehicles | 183 (5.4%) | 245 (7.7%) |
| Total | 3,392 (100.0%) | 3,172 (100.0%) |
Commute Time in Chickasaw County
The most frequently occuring commute durations in Chickasaw County are 5 to 9 minutes (1,030 commuters, 16.1%), 10 to 14 minutes (899 commuters, 14.1%), and 15 to 19 minutes (859 commuters, 13.4%).
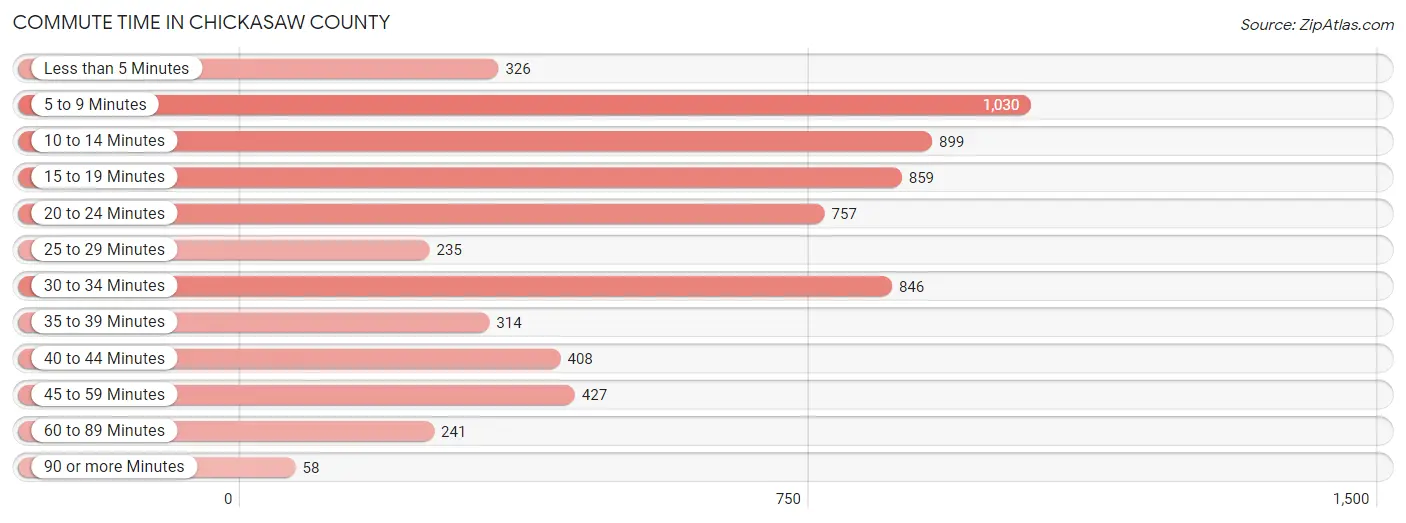
| Commute Time | # Commuters | % Commuters |
| Less than 5 Minutes | 326 | 5.1% |
| 5 to 9 Minutes | 1,030 | 16.1% |
| 10 to 14 Minutes | 899 | 14.1% |
| 15 to 19 Minutes | 859 | 13.4% |
| 20 to 24 Minutes | 757 | 11.8% |
| 25 to 29 Minutes | 235 | 3.7% |
| 30 to 34 Minutes | 846 | 13.2% |
| 35 to 39 Minutes | 314 | 4.9% |
| 40 to 44 Minutes | 408 | 6.4% |
| 45 to 59 Minutes | 427 | 6.7% |
| 60 to 89 Minutes | 241 | 3.8% |
| 90 or more Minutes | 58 | 0.9% |
Commute Time by Sex in Chickasaw County
The most common commute times in Chickasaw County are 30 to 34 minutes (574 commuters, 17.6%) for males and 10 to 14 minutes (547 commuters, 17.5%) for females.
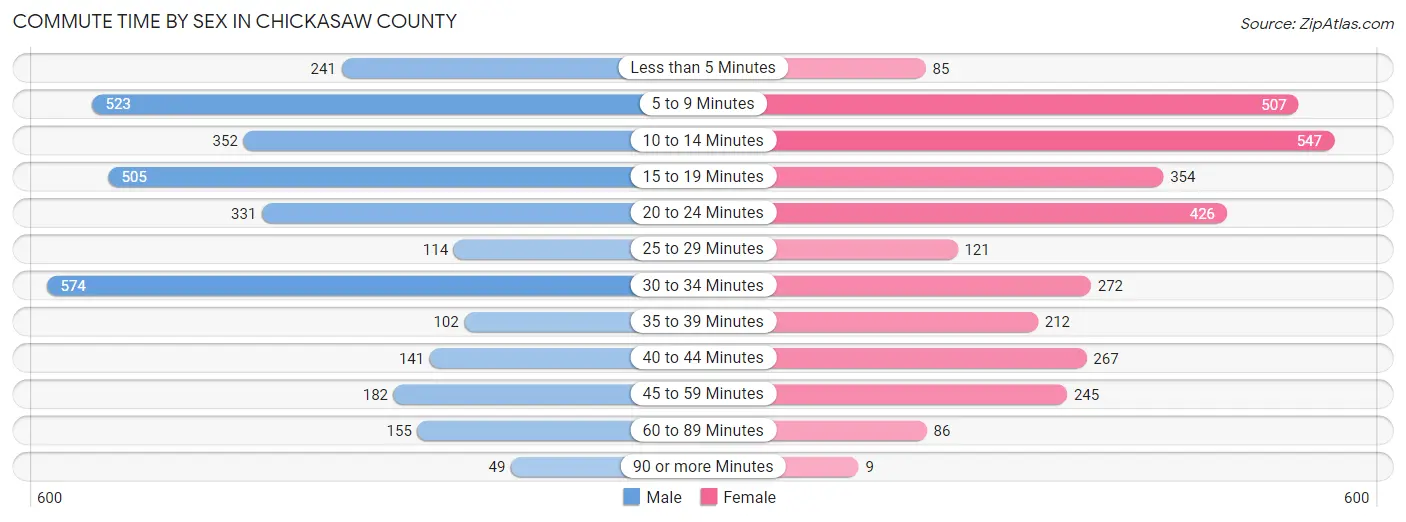
| Commute Time | Male | Female |
| Less than 5 Minutes | 241 (7.4%) | 85 (2.7%) |
| 5 to 9 Minutes | 523 (16.0%) | 507 (16.2%) |
| 10 to 14 Minutes | 352 (10.8%) | 547 (17.5%) |
| 15 to 19 Minutes | 505 (15.4%) | 354 (11.3%) |
| 20 to 24 Minutes | 331 (10.1%) | 426 (13.6%) |
| 25 to 29 Minutes | 114 (3.5%) | 121 (3.9%) |
| 30 to 34 Minutes | 574 (17.6%) | 272 (8.7%) |
| 35 to 39 Minutes | 102 (3.1%) | 212 (6.8%) |
| 40 to 44 Minutes | 141 (4.3%) | 267 (8.5%) |
| 45 to 59 Minutes | 182 (5.6%) | 245 (7.8%) |
| 60 to 89 Minutes | 155 (4.7%) | 86 (2.8%) |
| 90 or more Minutes | 49 (1.5%) | 9 (0.3%) |
Time of Departure to Work by Sex in Chickasaw County
The most frequent times of departure to work in Chickasaw County are 7:00 AM to 7:29 AM (539, 16.5%) for males and 7:30 AM to 7:59 AM (570, 18.2%) for females.
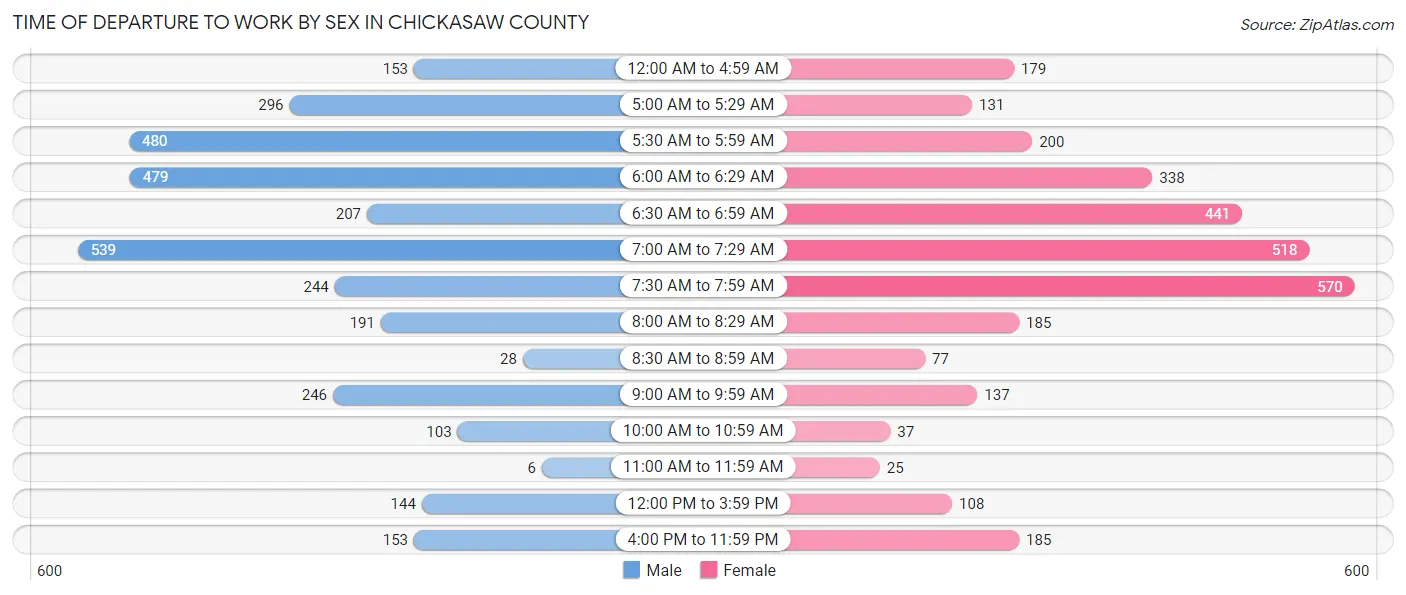
| Time of Departure | Male | Female |
| 12:00 AM to 4:59 AM | 153 (4.7%) | 179 (5.7%) |
| 5:00 AM to 5:29 AM | 296 (9.0%) | 131 (4.2%) |
| 5:30 AM to 5:59 AM | 480 (14.7%) | 200 (6.4%) |
| 6:00 AM to 6:29 AM | 479 (14.6%) | 338 (10.8%) |
| 6:30 AM to 6:59 AM | 207 (6.3%) | 441 (14.1%) |
| 7:00 AM to 7:29 AM | 539 (16.5%) | 518 (16.5%) |
| 7:30 AM to 7:59 AM | 244 (7.5%) | 570 (18.2%) |
| 8:00 AM to 8:29 AM | 191 (5.8%) | 185 (5.9%) |
| 8:30 AM to 8:59 AM | 28 (0.9%) | 77 (2.5%) |
| 9:00 AM to 9:59 AM | 246 (7.5%) | 137 (4.4%) |
| 10:00 AM to 10:59 AM | 103 (3.2%) | 37 (1.2%) |
| 11:00 AM to 11:59 AM | 6 (0.2%) | 25 (0.8%) |
| 12:00 PM to 3:59 PM | 144 (4.4%) | 108 (3.5%) |
| 4:00 PM to 11:59 PM | 153 (4.7%) | 185 (5.9%) |
| Total | 3,269 (100.0%) | 3,131 (100.0%) |
Housing Occupancy in Chickasaw County
Occupancy by Ownership in Chickasaw County
Of the total 6,767 dwellings in Chickasaw County, owner-occupied units account for 4,590 (67.8%), while renter-occupied units make up 2,177 (32.2%).
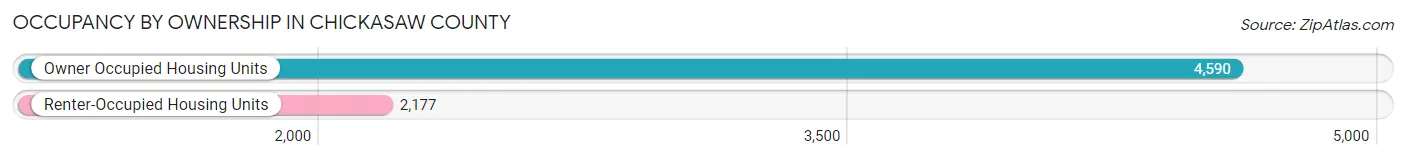
| Occupancy | # Housing Units | % Housing Units |
| Owner Occupied Housing Units | 4,590 | 67.8% |
| Renter-Occupied Housing Units | 2,177 | 32.2% |
| Total Occupied Housing Units | 6,767 | 100.0% |
Occupancy by Household Size in Chickasaw County
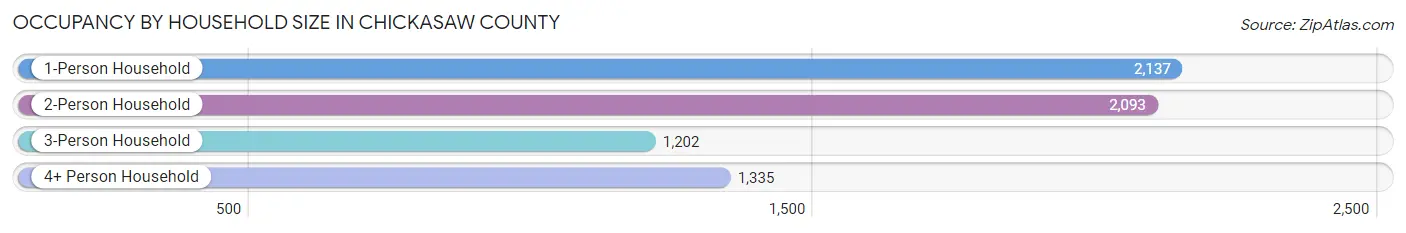
| Household Size | # Housing Units | % Housing Units |
| 1-Person Household | 2,137 | 31.6% |
| 2-Person Household | 2,093 | 30.9% |
| 3-Person Household | 1,202 | 17.8% |
| 4+ Person Household | 1,335 | 19.7% |
| Total Housing Units | 6,767 | 100.0% |
Occupancy by Ownership by Household Size in Chickasaw County
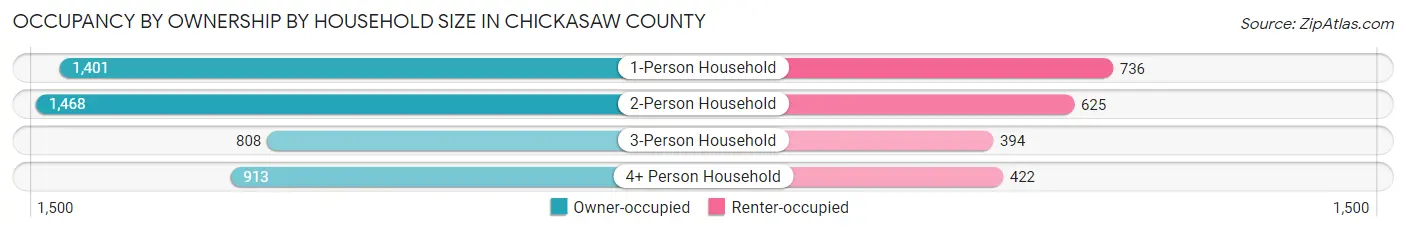
| Household Size | Owner-occupied | Renter-occupied |
| 1-Person Household | 1,401 (65.6%) | 736 (34.4%) |
| 2-Person Household | 1,468 (70.1%) | 625 (29.9%) |
| 3-Person Household | 808 (67.2%) | 394 (32.8%) |
| 4+ Person Household | 913 (68.4%) | 422 (31.6%) |
| Total Housing Units | 4,590 (67.8%) | 2,177 (32.2%) |
Occupancy by Educational Attainment in Chickasaw County
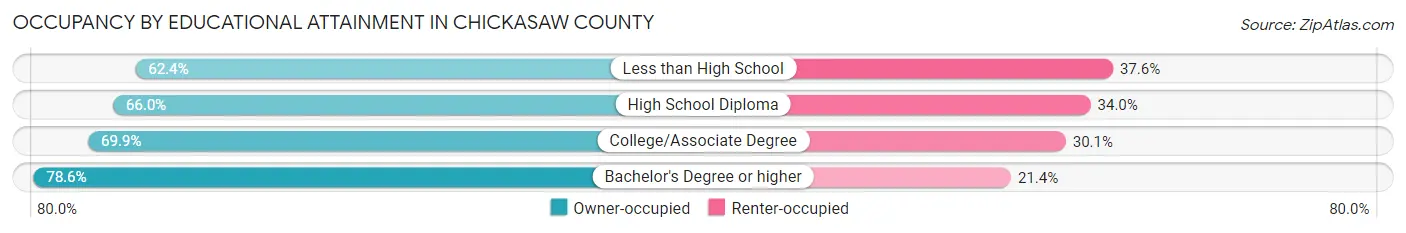
| Household Size | Owner-occupied | Renter-occupied |
| Less than High School | 1,029 (62.4%) | 619 (37.6%) |
| High School Diploma | 1,438 (66.0%) | 741 (34.0%) |
| College/Associate Degree | 1,513 (69.9%) | 651 (30.1%) |
| Bachelor's Degree or higher | 610 (78.6%) | 166 (21.4%) |
Occupancy by Age of Householder in Chickasaw County
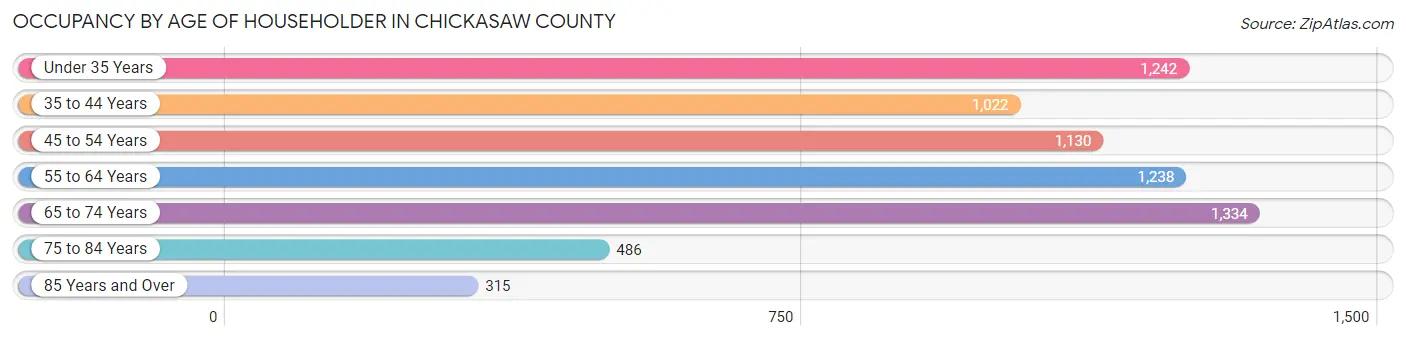
| Age Bracket | # Households | % Households |
| Under 35 Years | 1,242 | 18.3% |
| 35 to 44 Years | 1,022 | 15.1% |
| 45 to 54 Years | 1,130 | 16.7% |
| 55 to 64 Years | 1,238 | 18.3% |
| 65 to 74 Years | 1,334 | 19.7% |
| 75 to 84 Years | 486 | 7.2% |
| 85 Years and Over | 315 | 4.6% |
| Total | 6,767 | 100.0% |
Housing Finances in Chickasaw County
Median Income by Occupancy in Chickasaw County
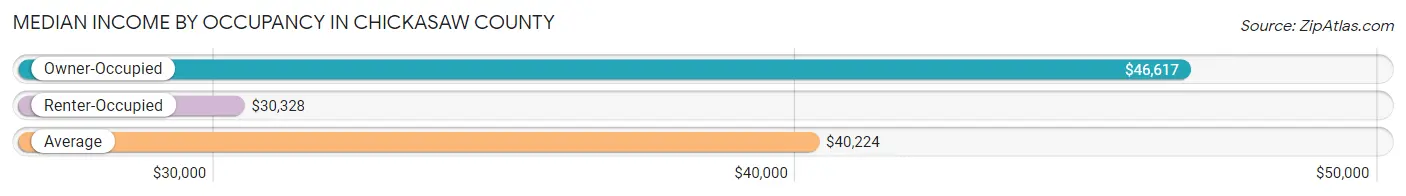
| Occupancy Type | # Households | Median Income |
| Owner-Occupied | 4,590 (67.8%) | $46,617 |
| Renter-Occupied | 2,177 (32.2%) | $30,328 |
| Average | 6,767 (100.0%) | $40,224 |
Occupancy by Householder Income Bracket in Chickasaw County
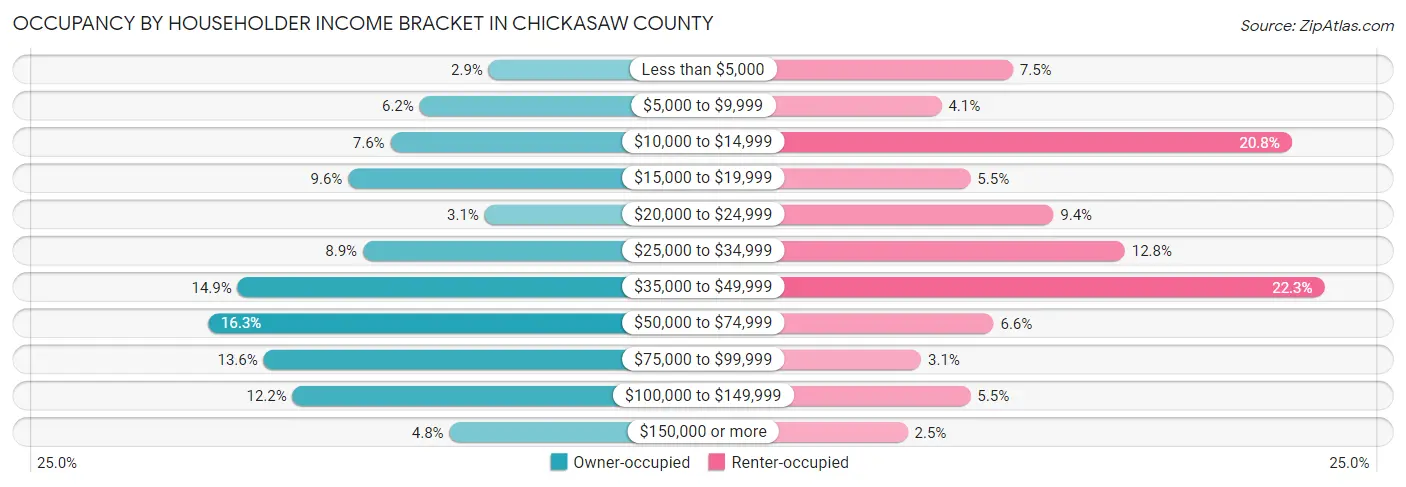
| Income Bracket | Owner-occupied | Renter-occupied |
| Less than $5,000 | 133 (2.9%) | 163 (7.5%) |
| $5,000 to $9,999 | 284 (6.2%) | 89 (4.1%) |
| $10,000 to $14,999 | 348 (7.6%) | 452 (20.8%) |
| $15,000 to $19,999 | 440 (9.6%) | 119 (5.5%) |
| $20,000 to $24,999 | 142 (3.1%) | 205 (9.4%) |
| $25,000 to $34,999 | 408 (8.9%) | 279 (12.8%) |
| $35,000 to $49,999 | 682 (14.9%) | 486 (22.3%) |
| $50,000 to $74,999 | 747 (16.3%) | 143 (6.6%) |
| $75,000 to $99,999 | 625 (13.6%) | 68 (3.1%) |
| $100,000 to $149,999 | 562 (12.2%) | 119 (5.5%) |
| $150,000 or more | 219 (4.8%) | 54 (2.5%) |
| Total | 4,590 (100.0%) | 2,177 (100.0%) |
Monthly Housing Cost Tiers in Chickasaw County
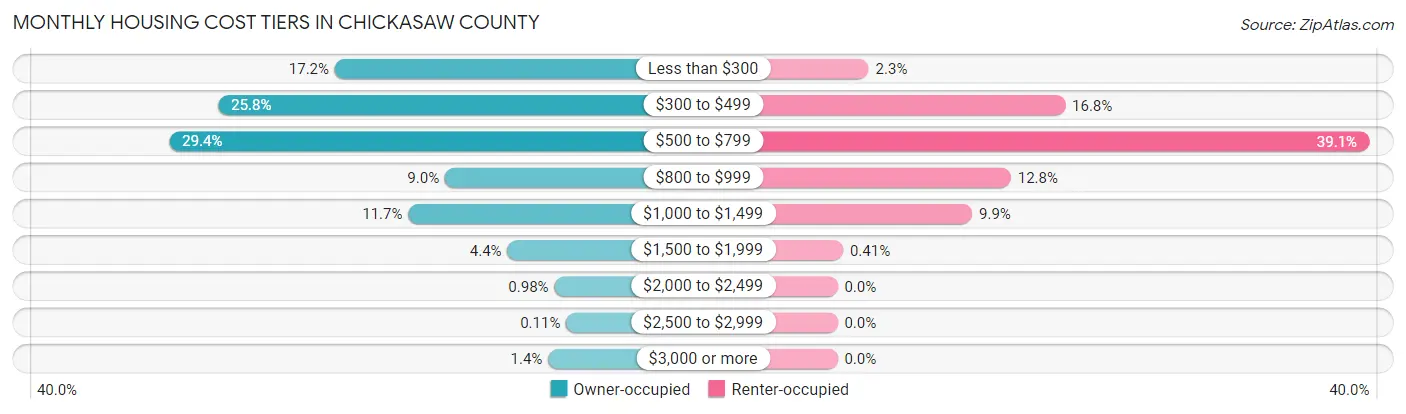
| Monthly Cost | Owner-occupied | Renter-occupied |
| Less than $300 | 787 (17.2%) | 50 (2.3%) |
| $300 to $499 | 1,182 (25.8%) | 365 (16.8%) |
| $500 to $799 | 1,347 (29.3%) | 852 (39.1%) |
| $800 to $999 | 415 (9.0%) | 278 (12.8%) |
| $1,000 to $1,499 | 539 (11.7%) | 216 (9.9%) |
| $1,500 to $1,999 | 204 (4.4%) | 9 (0.4%) |
| $2,000 to $2,499 | 45 (1.0%) | 0 (0.0%) |
| $2,500 to $2,999 | 5 (0.1%) | 0 (0.0%) |
| $3,000 or more | 66 (1.4%) | 0 (0.0%) |
| Total | 4,590 (100.0%) | 2,177 (100.0%) |
Physical Housing Characteristics in Chickasaw County
Housing Structures in Chickasaw County
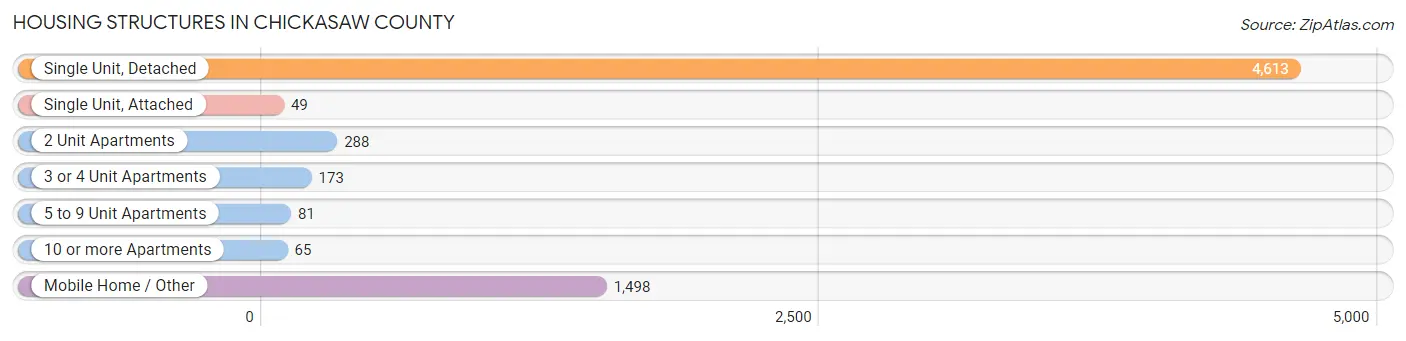
| Structure Type | # Housing Units | % Housing Units |
| Single Unit, Detached | 4,613 | 68.2% |
| Single Unit, Attached | 49 | 0.7% |
| 2 Unit Apartments | 288 | 4.3% |
| 3 or 4 Unit Apartments | 173 | 2.6% |
| 5 to 9 Unit Apartments | 81 | 1.2% |
| 10 or more Apartments | 65 | 1.0% |
| Mobile Home / Other | 1,498 | 22.1% |
| Total | 6,767 | 100.0% |
Housing Structures by Occupancy in Chickasaw County
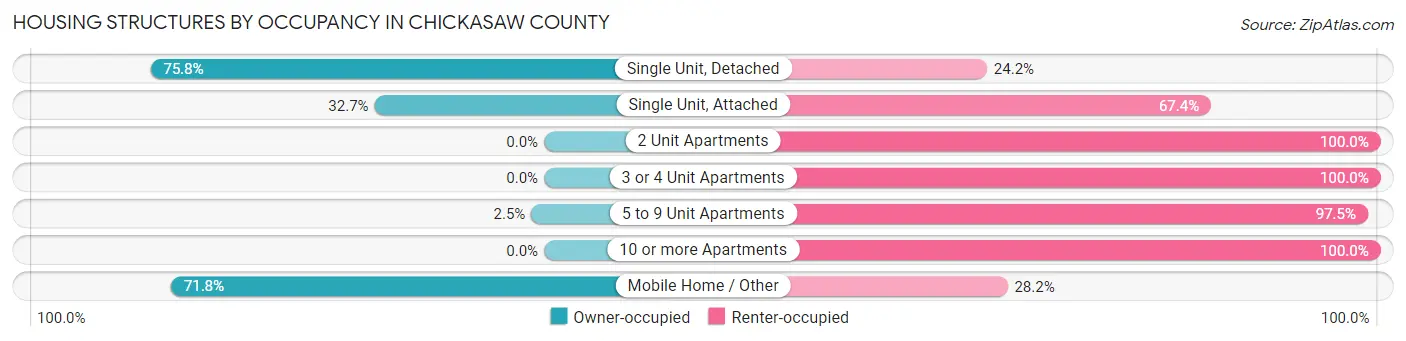
| Structure Type | Owner-occupied | Renter-occupied |
| Single Unit, Detached | 3,496 (75.8%) | 1,117 (24.2%) |
| Single Unit, Attached | 16 (32.7%) | 33 (67.3%) |
| 2 Unit Apartments | 0 (0.0%) | 288 (100.0%) |
| 3 or 4 Unit Apartments | 0 (0.0%) | 173 (100.0%) |
| 5 to 9 Unit Apartments | 2 (2.5%) | 79 (97.5%) |
| 10 or more Apartments | 0 (0.0%) | 65 (100.0%) |
| Mobile Home / Other | 1,076 (71.8%) | 422 (28.2%) |
| Total | 4,590 (67.8%) | 2,177 (32.2%) |
Housing Structures by Number of Rooms in Chickasaw County
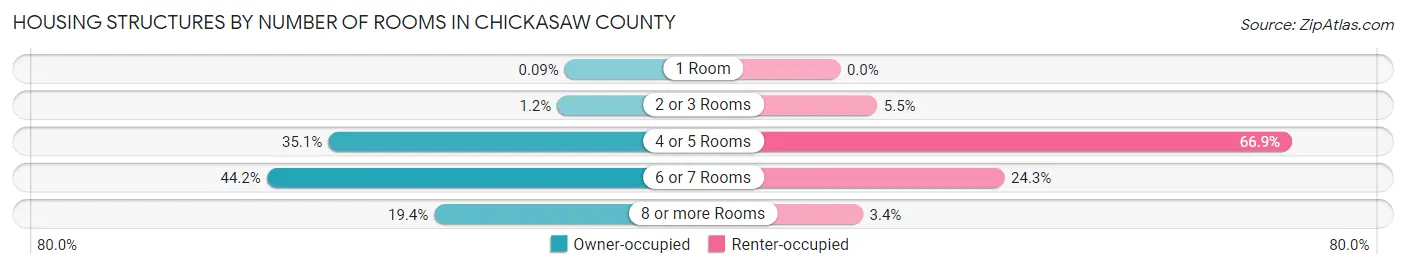
| Number of Rooms | Owner-occupied | Renter-occupied |
| 1 Room | 4 (0.1%) | 0 (0.0%) |
| 2 or 3 Rooms | 55 (1.2%) | 119 (5.5%) |
| 4 or 5 Rooms | 1,611 (35.1%) | 1,456 (66.9%) |
| 6 or 7 Rooms | 2,029 (44.2%) | 529 (24.3%) |
| 8 or more Rooms | 891 (19.4%) | 73 (3.4%) |
| Total | 4,590 (100.0%) | 2,177 (100.0%) |
Housing Structure by Heating Type in Chickasaw County
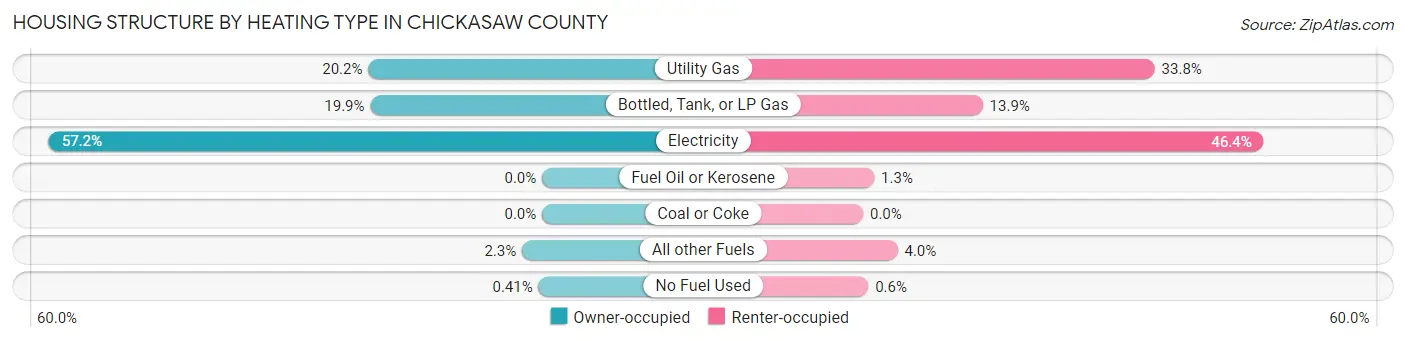
| Heating Type | Owner-occupied | Renter-occupied |
| Utility Gas | 925 (20.2%) | 736 (33.8%) |
| Bottled, Tank, or LP Gas | 914 (19.9%) | 302 (13.9%) |
| Electricity | 2,625 (57.2%) | 1,011 (46.4%) |
| Fuel Oil or Kerosene | 0 (0.0%) | 28 (1.3%) |
| Coal or Coke | 0 (0.0%) | 0 (0.0%) |
| All other Fuels | 107 (2.3%) | 87 (4.0%) |
| No Fuel Used | 19 (0.4%) | 13 (0.6%) |
| Total | 4,590 (100.0%) | 2,177 (100.0%) |
Household Vehicle Usage in Chickasaw County
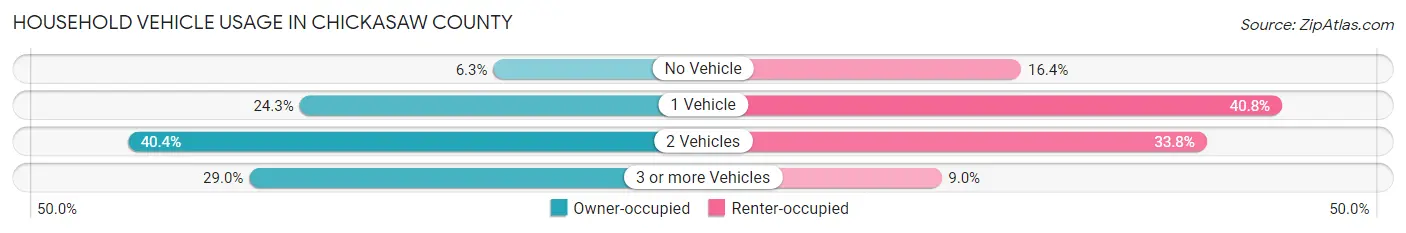
| Vehicles per Household | Owner-occupied | Renter-occupied |
| No Vehicle | 287 (6.2%) | 358 (16.4%) |
| 1 Vehicle | 1,117 (24.3%) | 888 (40.8%) |
| 2 Vehicles | 1,853 (40.4%) | 735 (33.8%) |
| 3 or more Vehicles | 1,333 (29.0%) | 196 (9.0%) |
| Total | 4,590 (100.0%) | 2,177 (100.0%) |
Real Estate & Mortgages in Chickasaw County
Real Estate and Mortgage Overview in Chickasaw County
| Characteristic | Without Mortgage | With Mortgage |
| Housing Units | 2,766 | 1,824 |
| Median Property Value | $81,800 | $94,600 |
| Median Household Income | $36,000 | $100 |
| Monthly Housing Costs | $400 | $66 |
| Real Estate Taxes | $576 | $419 |
Property Value by Mortgage Status in Chickasaw County
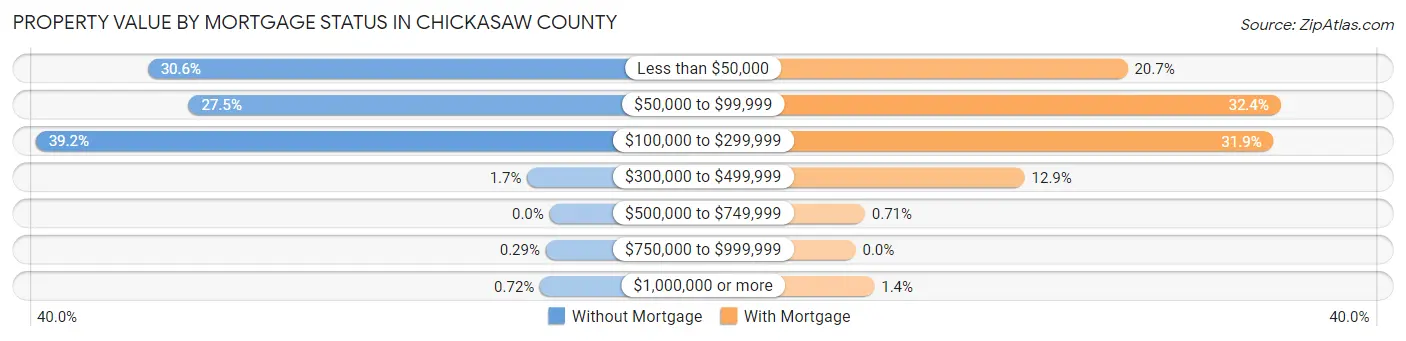
| Property Value | Without Mortgage | With Mortgage |
| Less than $50,000 | 847 (30.6%) | 378 (20.7%) |
| $50,000 to $99,999 | 761 (27.5%) | 591 (32.4%) |
| $100,000 to $299,999 | 1,083 (39.2%) | 581 (31.9%) |
| $300,000 to $499,999 | 47 (1.7%) | 235 (12.9%) |
| $500,000 to $749,999 | 0 (0.0%) | 13 (0.7%) |
| $750,000 to $999,999 | 8 (0.3%) | 0 (0.0%) |
| $1,000,000 or more | 20 (0.7%) | 26 (1.4%) |
| Total | 2,766 (100.0%) | 1,824 (100.0%) |
Household Income by Mortgage Status in Chickasaw County
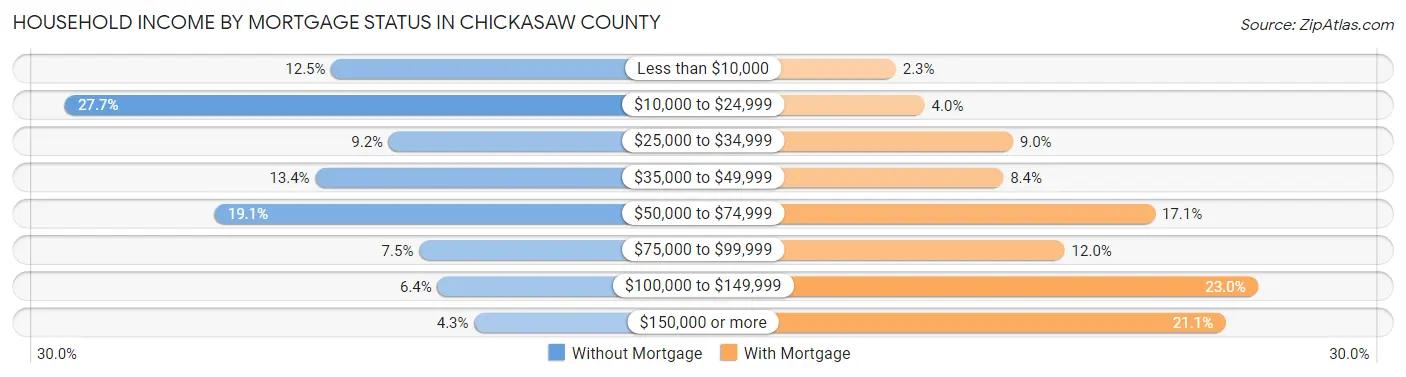
| Household Income | Without Mortgage | With Mortgage |
| Less than $10,000 | 345 (12.5%) | 42 (2.3%) |
| $10,000 to $24,999 | 766 (27.7%) | 72 (4.0%) |
| $25,000 to $34,999 | 254 (9.2%) | 164 (9.0%) |
| $35,000 to $49,999 | 370 (13.4%) | 154 (8.4%) |
| $50,000 to $74,999 | 529 (19.1%) | 312 (17.1%) |
| $75,000 to $99,999 | 206 (7.4%) | 218 (11.9%) |
| $100,000 to $149,999 | 177 (6.4%) | 419 (23.0%) |
| $150,000 or more | 119 (4.3%) | 385 (21.1%) |
| Total | 2,766 (100.0%) | 1,824 (100.0%) |
Property Value to Household Income Ratio in Chickasaw County
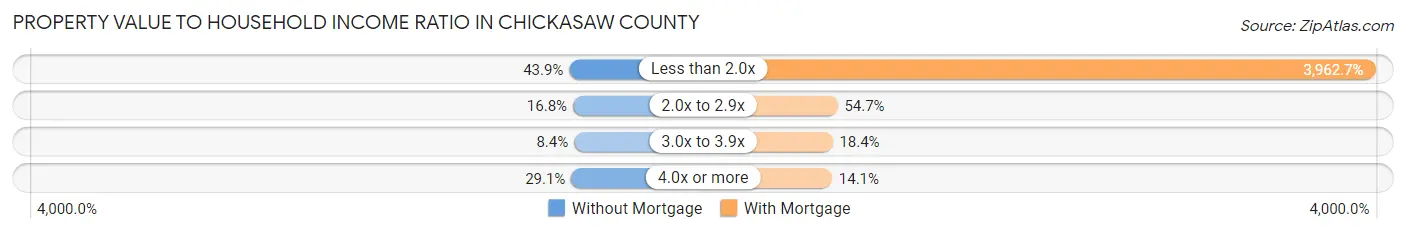
| Value-to-Income Ratio | Without Mortgage | With Mortgage |
| Less than 2.0x | 1,215 (43.9%) | 72,279 (3,962.7%) |
| 2.0x to 2.9x | 465 (16.8%) | 998 (54.7%) |
| 3.0x to 3.9x | 233 (8.4%) | 335 (18.4%) |
| 4.0x or more | 806 (29.1%) | 258 (14.1%) |
| Total | 2,766 (100.0%) | 1,824 (100.0%) |
Real Estate Taxes by Mortgage Status in Chickasaw County
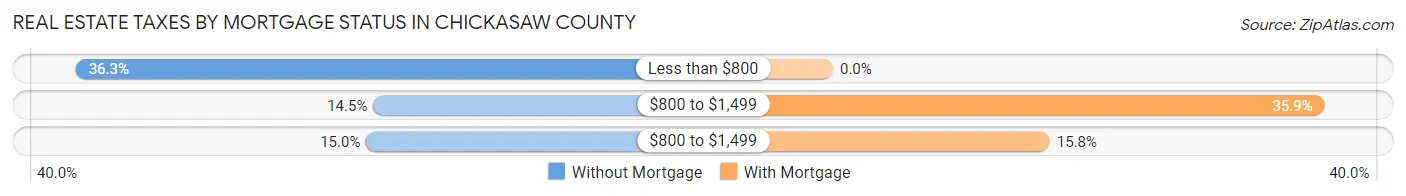
| Property Taxes | Without Mortgage | With Mortgage |
| Less than $800 | 1,003 (36.3%) | 0 (0.0%) |
| $800 to $1,499 | 402 (14.5%) | 655 (35.9%) |
| $800 to $1,499 | 416 (15.0%) | 289 (15.8%) |
| Total | 2,766 (100.0%) | 1,824 (100.0%) |
Health & Disability in Chickasaw County
Health Insurance Coverage by Age in Chickasaw County
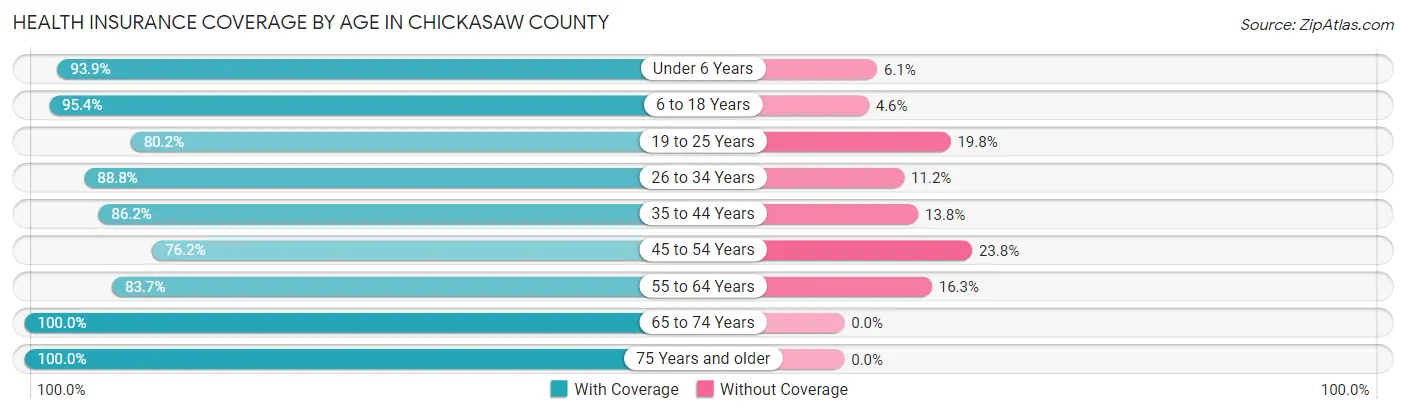
| Age Bracket | With Coverage | Without Coverage |
| Under 6 Years | 1,429 (93.9%) | 93 (6.1%) |
| 6 to 18 Years | 2,757 (95.4%) | 132 (4.6%) |
| 19 to 25 Years | 1,053 (80.2%) | 260 (19.8%) |
| 26 to 34 Years | 1,664 (88.8%) | 209 (11.2%) |
| 35 to 44 Years | 1,590 (86.2%) | 254 (13.8%) |
| 45 to 54 Years | 1,510 (76.2%) | 472 (23.8%) |
| 55 to 64 Years | 1,718 (83.7%) | 335 (16.3%) |
| 65 to 74 Years | 1,862 (100.0%) | 0 (0.0%) |
| 75 Years and older | 1,160 (100.0%) | 0 (0.0%) |
| Total | 14,743 (89.4%) | 1,755 (10.6%) |
Health Insurance Coverage by Citizenship Status in Chickasaw County
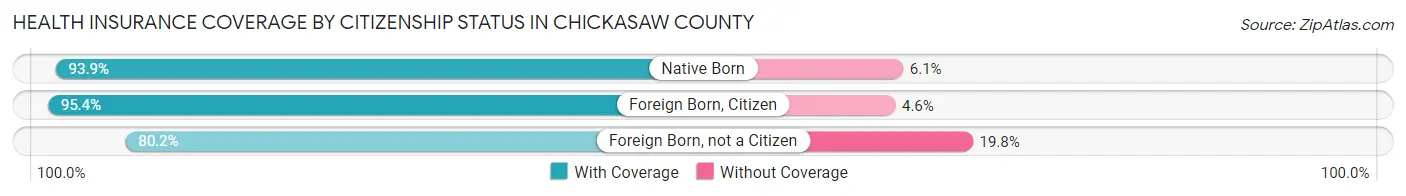
| Citizenship Status | With Coverage | Without Coverage |
| Native Born | 1,429 (93.9%) | 93 (6.1%) |
| Foreign Born, Citizen | 2,757 (95.4%) | 132 (4.6%) |
| Foreign Born, not a Citizen | 1,053 (80.2%) | 260 (19.8%) |
Health Insurance Coverage by Household Income in Chickasaw County
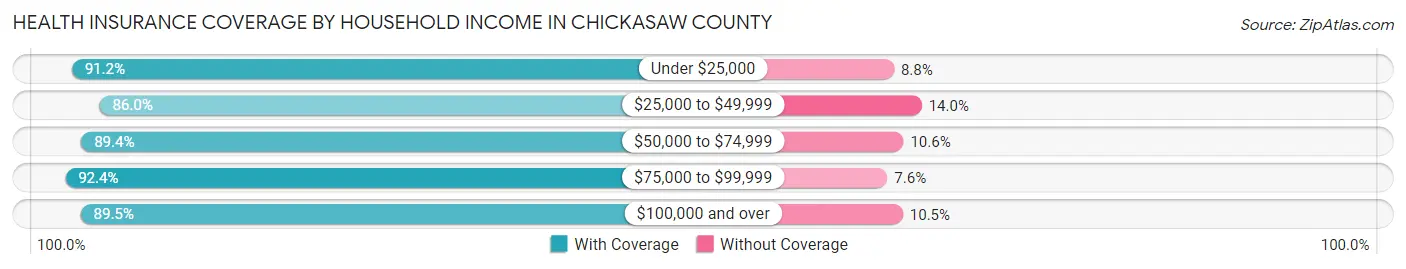
| Household Income | With Coverage | Without Coverage |
| Under $25,000 | 3,972 (91.2%) | 385 (8.8%) |
| $25,000 to $49,999 | 3,661 (86.0%) | 598 (14.0%) |
| $50,000 to $74,999 | 2,180 (89.4%) | 259 (10.6%) |
| $75,000 to $99,999 | 2,124 (92.4%) | 175 (7.6%) |
| $100,000 and over | 2,804 (89.5%) | 329 (10.5%) |
Public vs Private Health Insurance Coverage by Age in Chickasaw County
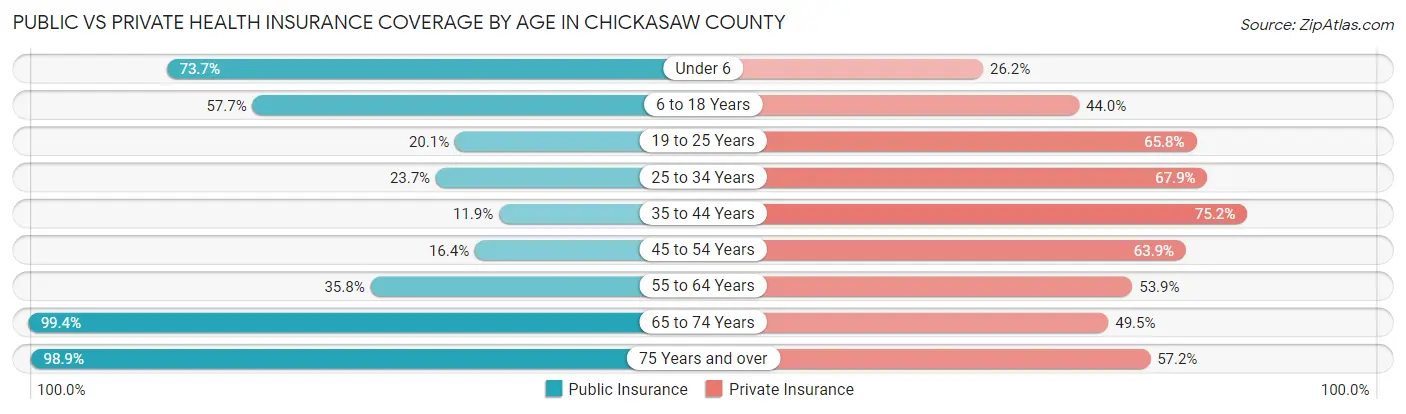
| Age Bracket | Public Insurance | Private Insurance |
| Under 6 | 1,121 (73.7%) | 399 (26.2%) |
| 6 to 18 Years | 1,667 (57.7%) | 1,272 (44.0%) |
| 19 to 25 Years | 264 (20.1%) | 864 (65.8%) |
| 25 to 34 Years | 443 (23.6%) | 1,271 (67.9%) |
| 35 to 44 Years | 220 (11.9%) | 1,387 (75.2%) |
| 45 to 54 Years | 325 (16.4%) | 1,266 (63.9%) |
| 55 to 64 Years | 735 (35.8%) | 1,107 (53.9%) |
| 65 to 74 Years | 1,851 (99.4%) | 921 (49.5%) |
| 75 Years and over | 1,147 (98.9%) | 664 (57.2%) |
| Total | 7,773 (47.1%) | 9,151 (55.5%) |
Disability Status by Sex by Age in Chickasaw County
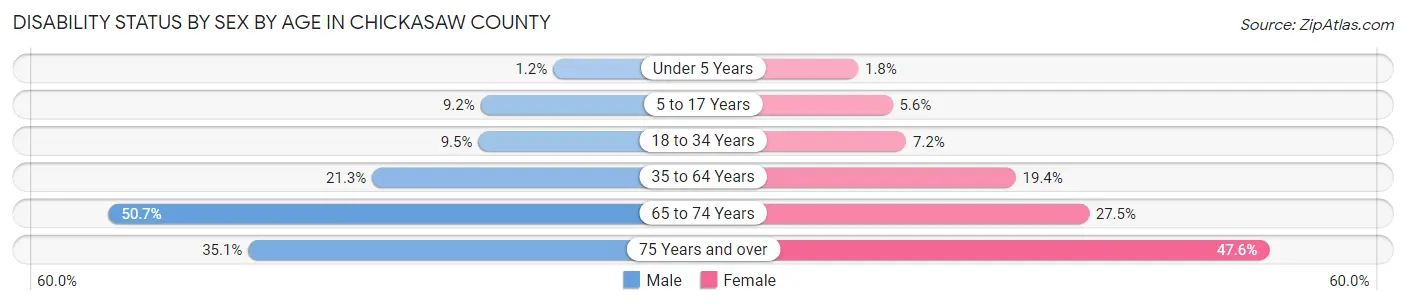
| Age Bracket | Male | Female |
| Under 5 Years | 7 (1.1%) | 12 (1.8%) |
| 5 to 17 Years | 133 (9.2%) | 85 (5.6%) |
| 18 to 34 Years | 158 (9.5%) | 122 (7.2%) |
| 35 to 64 Years | 591 (21.3%) | 601 (19.4%) |
| 65 to 74 Years | 494 (50.7%) | 244 (27.5%) |
| 75 Years and over | 126 (35.1%) | 381 (47.6%) |
Disability Class by Sex by Age in Chickasaw County
Disability Class: Hearing Difficulty
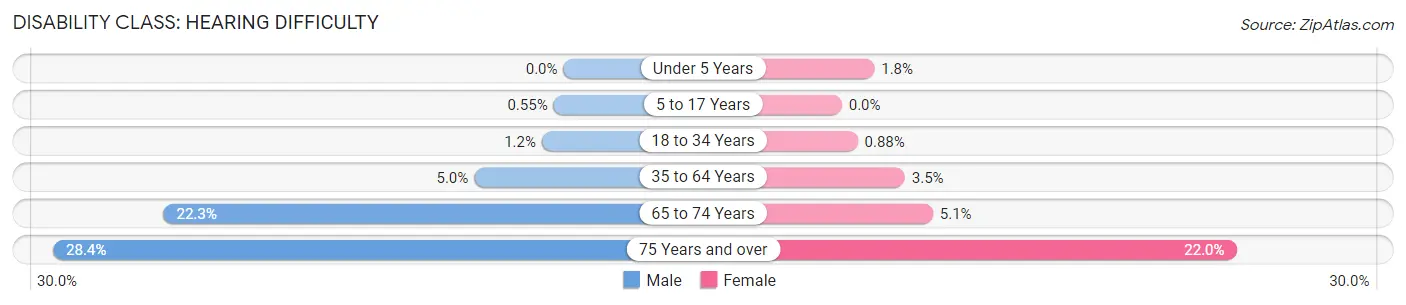
| Age Bracket | Male | Female |
| Under 5 Years | 0 (0.0%) | 12 (1.8%) |
| 5 to 17 Years | 8 (0.5%) | 0 (0.0%) |
| 18 to 34 Years | 20 (1.2%) | 15 (0.9%) |
| 35 to 64 Years | 138 (5.0%) | 109 (3.5%) |
| 65 to 74 Years | 217 (22.3%) | 45 (5.1%) |
| 75 Years and over | 102 (28.4%) | 176 (22.0%) |
Disability Class: Vision Difficulty
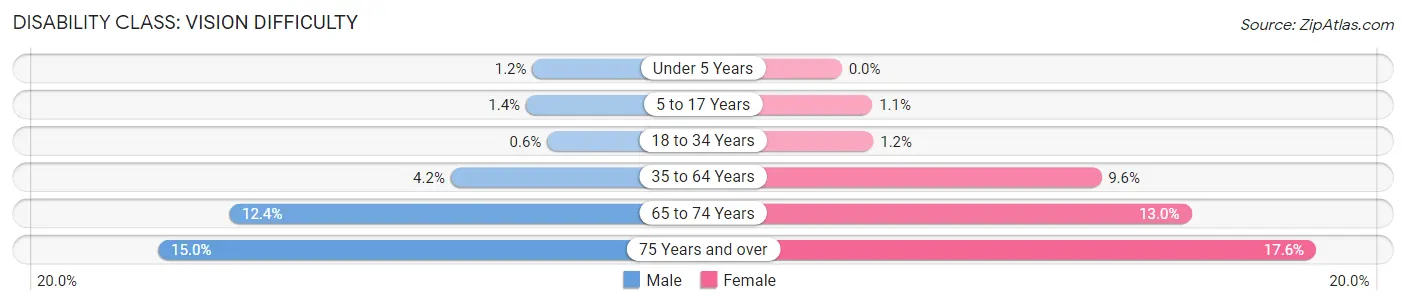
| Age Bracket | Male | Female |
| Under 5 Years | 7 (1.1%) | 0 (0.0%) |
| 5 to 17 Years | 20 (1.4%) | 17 (1.1%) |
| 18 to 34 Years | 10 (0.6%) | 20 (1.2%) |
| 35 to 64 Years | 116 (4.2%) | 299 (9.6%) |
| 65 to 74 Years | 121 (12.4%) | 115 (13.0%) |
| 75 Years and over | 54 (15.0%) | 141 (17.6%) |
Disability Class: Cognitive Difficulty
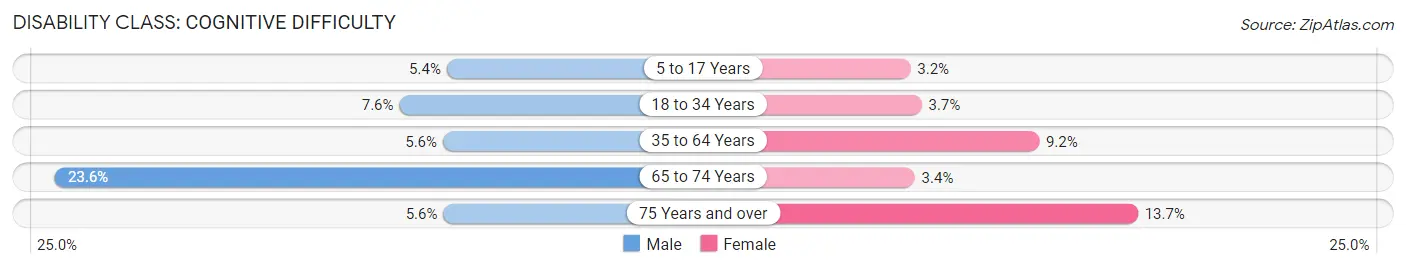
| Age Bracket | Male | Female |
| 5 to 17 Years | 78 (5.4%) | 48 (3.2%) |
| 18 to 34 Years | 127 (7.6%) | 63 (3.7%) |
| 35 to 64 Years | 155 (5.6%) | 284 (9.1%) |
| 65 to 74 Years | 230 (23.6%) | 30 (3.4%) |
| 75 Years and over | 20 (5.6%) | 110 (13.7%) |
Disability Class: Ambulatory Difficulty
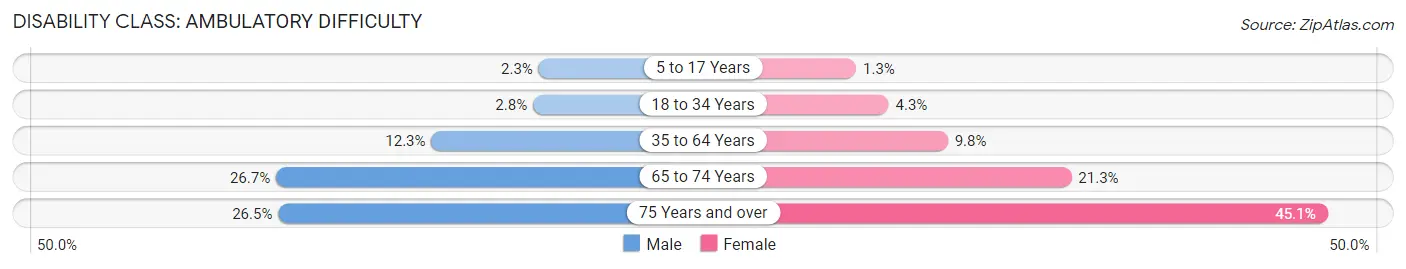
| Age Bracket | Male | Female |
| 5 to 17 Years | 33 (2.3%) | 20 (1.3%) |
| 18 to 34 Years | 47 (2.8%) | 74 (4.3%) |
| 35 to 64 Years | 340 (12.2%) | 305 (9.8%) |
| 65 to 74 Years | 260 (26.7%) | 189 (21.3%) |
| 75 Years and over | 95 (26.5%) | 361 (45.1%) |
Disability Class: Self-Care Difficulty
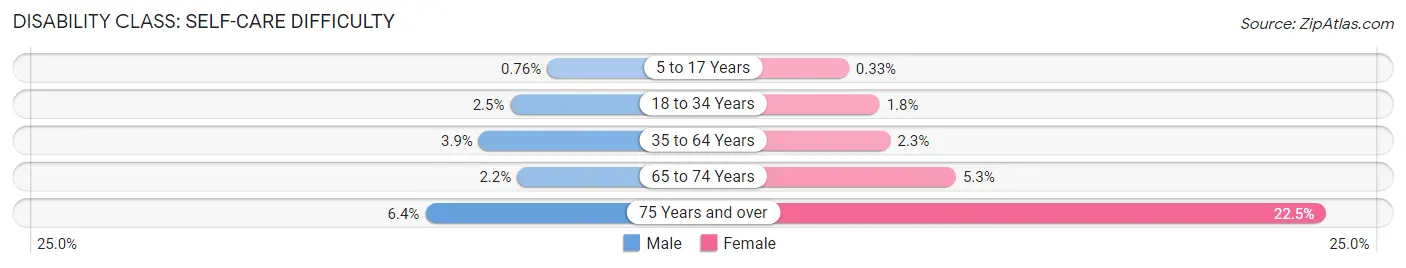
| Age Bracket | Male | Female |
| 5 to 17 Years | 11 (0.8%) | 5 (0.3%) |
| 18 to 34 Years | 41 (2.5%) | 30 (1.8%) |
| 35 to 64 Years | 109 (3.9%) | 70 (2.3%) |
| 65 to 74 Years | 21 (2.1%) | 47 (5.3%) |
| 75 Years and over | 23 (6.4%) | 180 (22.5%) |
Technology Access in Chickasaw County
Computing Device Access in Chickasaw County
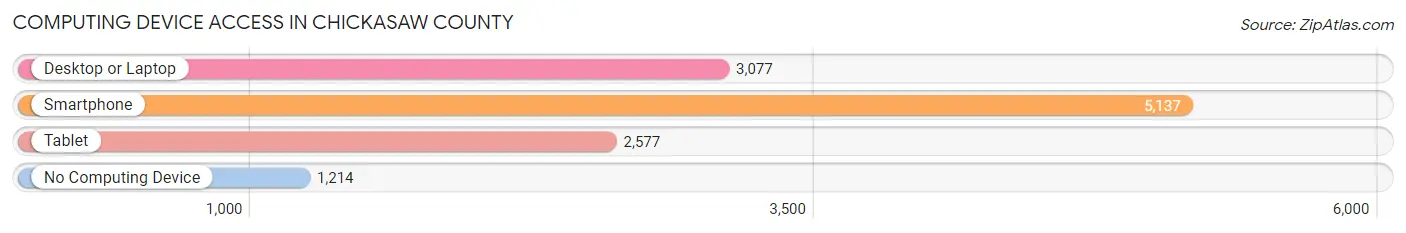
| Device Type | # Households | % Households |
| Desktop or Laptop | 3,077 | 45.5% |
| Smartphone | 5,137 | 75.9% |
| Tablet | 2,577 | 38.1% |
| No Computing Device | 1,214 | 17.9% |
| Total | 6,767 | 100.0% |
Internet Access in Chickasaw County
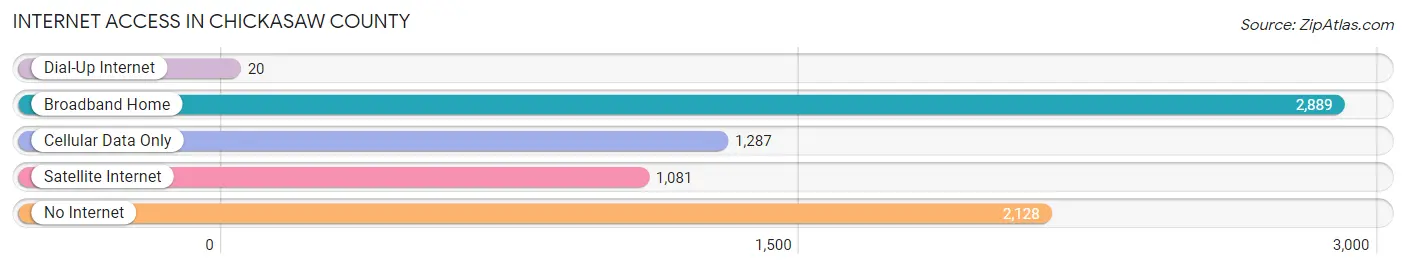
| Internet Type | # Households | % Households |
| Dial-Up Internet | 20 | 0.3% |
| Broadband Home | 2,889 | 42.7% |
| Cellular Data Only | 1,287 | 19.0% |
| Satellite Internet | 1,081 | 16.0% |
| No Internet | 2,128 | 31.5% |
| Total | 6,767 | 100.0% |
Chickasaw County Summary
Chickasaw County is located in the northeastern corner of Mississippi, and is bordered by the states of Tennessee and Alabama. It is part of the Tupelo, MS Metropolitan Statistical Area. The county was established in 1836 and named for the Chickasaw Native American tribe. As of the 2010 census, the population was 17,392.
History
Chickasaw County was established in 1836 from portions of Pontotoc and Itawamba counties. It was named for the Chickasaw Native American tribe, who had inhabited the area for centuries prior to European settlement. The Chickasaw were forcibly removed from the area in the 1830s as part of the Indian Removal Act.
The county was initially sparsely populated, but began to grow in the late 19th century with the arrival of the railroad. The town of Houston was established in 1871 and became the county seat. The county continued to grow throughout the 20th century, and today is home to several small towns and communities.
Geography
Chickasaw County is located in the northeastern corner of Mississippi, and is bordered by the states of Tennessee and Alabama. It is part of the Tupelo, MS Metropolitan Statistical Area. The county covers an area of 576 square miles, and is mostly rural and agricultural. The terrain is mostly flat, with some rolling hills in the northern part of the county. The county is drained by the Tombigbee River, which forms its northern border.
The county is home to several state parks and wildlife areas, including the Tombigbee National Forest, the Natchez Trace State Park, and the Chickasaw State Park.
Economy
The economy of Chickasaw County is largely based on agriculture. The county is home to several large farms, and is a major producer of cotton, soybeans, and corn. The county is also home to several manufacturing plants, including a furniture factory and a paper mill.
The county is home to several small towns and communities, including Houston, Okolona, and Houlka. The county seat is Houston, which is home to several small businesses and shops.
Demographics
As of the 2010 census, the population of Chickasaw County was 17,392. The racial makeup of the county was 79.3% White, 18.3% African American, 0.4% Native American, 0.2% Asian, 0.1% Pacific Islander, 0.7% from other races, and 1.0% from two or more races. Hispanic or Latino of any race were 1.7% of the population.
The median household income in the county was $35,945, and the median family income was $44,945. The per capita income was $17,945. About 19.3% of the population was below the poverty line.
Common Questions
What is Per Capita Income in Chickasaw County?
Per Capita income in Chickasaw County is $21,968.
What is the Median Family Income in Chickasaw County?
Median Family Income in Chickasaw County is $49,609.
What is the Median Household income in Chickasaw County?
Median Household Income in Chickasaw County is $40,224.
What is Income or Wage Gap in Chickasaw County?
Income or Wage Gap in Chickasaw County is 36.3%.
Women in Chickasaw County earn 63.7 cents for every dollar earned by a man.
What is Family Income Deficit in Chickasaw County?
Family Income Deficit in Chickasaw County is $10,268.
Families that are below poverty line in Chickasaw County earn $10,268 less on average than the poverty threshold level.
What is Inequality or Gini Index in Chickasaw County?
Inequality or Gini Index in Chickasaw County is 0.47.
What is the Total Population of Chickasaw County?
Total Population of Chickasaw County is 17,024.
What is the Total Male Population of Chickasaw County?
Total Male Population of Chickasaw County is 8,270.
What is the Total Female Population of Chickasaw County?
Total Female Population of Chickasaw County is 8,754.
What is the Ratio of Males per 100 Females in Chickasaw County?
There are 94.47 Males per 100 Females in Chickasaw County.
What is the Ratio of Females per 100 Males in Chickasaw County?
There are 105.85 Females per 100 Males in Chickasaw County.
What is the Median Population Age in Chickasaw County?
Median Population Age in Chickasaw County is 39.3 Years.
What is the Average Family Size in Chickasaw County
Average Family Size in Chickasaw County is 3.1 People.
What is the Average Household Size in Chickasaw County
Average Household Size in Chickasaw County is 2.4 People.
How Large is the Labor Force in Chickasaw County?
There are 6,966 People in the Labor Forcein in Chickasaw County.
What is the Percentage of People in the Labor Force in Chickasaw County?
52.5% of People are in the Labor Force in Chickasaw County.
What is the Unemployment Rate in Chickasaw County?
Unemployment Rate in Chickasaw County is 3.1%.