Benton County, MS Map & Demographics
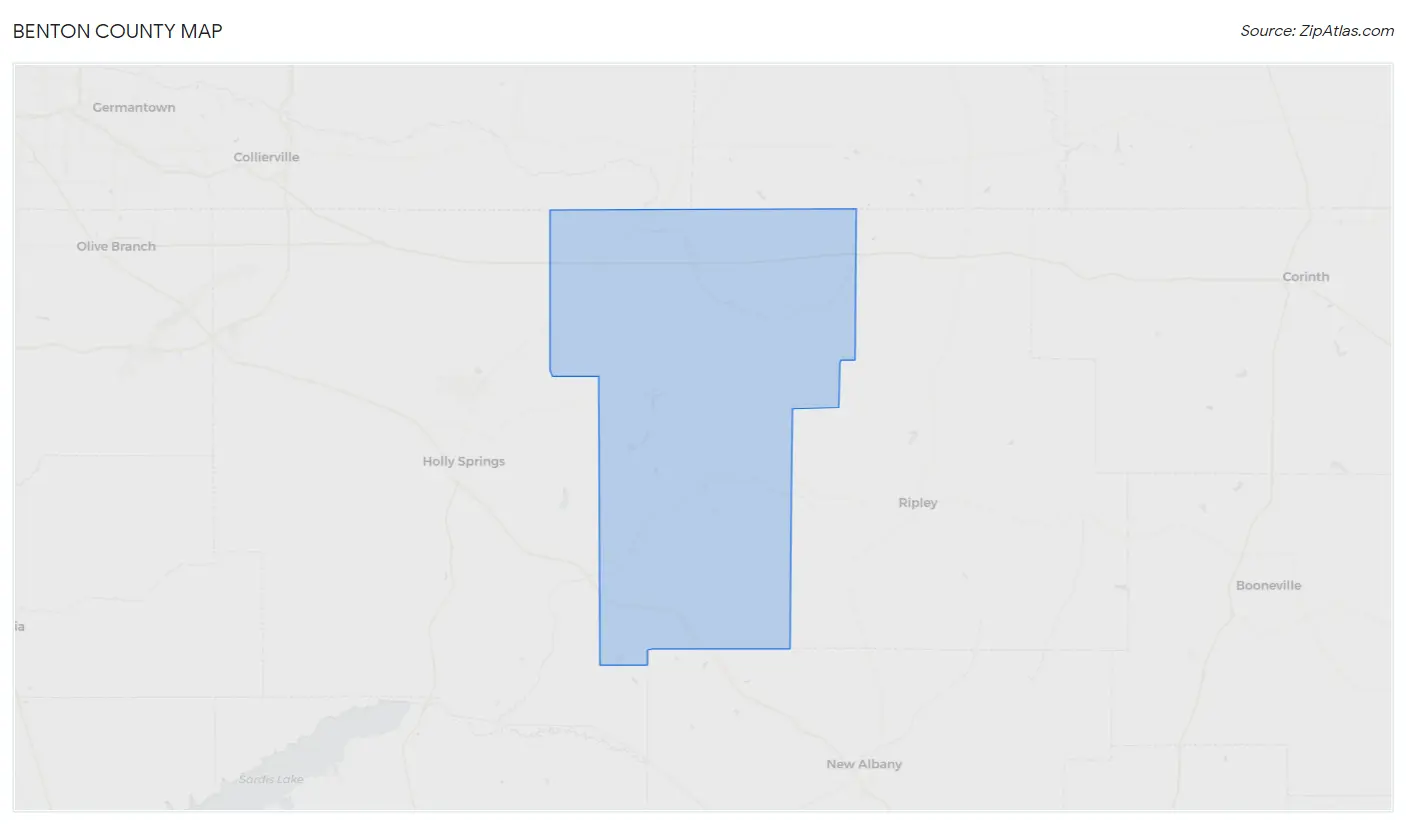
Benton County Map
Benton County Overview
$24,690
PER CAPITA INCOME
$53,118
AVG FAMILY INCOME
$38,750
AVG HOUSEHOLD INCOME
7.0%
WAGE / INCOME GAP [ % ]
93.0¢/ $1
WAGE / INCOME GAP [ $ ]
0.47
INEQUALITY / GINI INDEX
7,637
TOTAL POPULATION
3,780
MALE POPULATION
3,857
FEMALE POPULATION
98.00
MALES / 100 FEMALES
102.04
FEMALES / 100 MALES
41.7
MEDIAN AGE
3.3
AVG FAMILY SIZE
2.4
AVG HOUSEHOLD SIZE
3,401
LABOR FORCE [ PEOPLE ]
54.0%
PERCENT IN LABOR FORCE
4.4%
UNEMPLOYMENT RATE
Benton County Area Codes
Income in Benton County
Income Overview in Benton County
Per Capita Income in Benton County is $24,690, while median incomes of families and households are $53,118 and $38,750 respectively.
| Characteristic | Number | Measure |
| Per Capita Income | 7,637 | $24,690 |
| Median Family Income | 1,922 | $53,118 |
| Mean Family Income | 1,922 | $69,748 |
| Median Household Income | 3,086 | $38,750 |
| Mean Household Income | 3,086 | $55,802 |
| Income Deficit | 1,922 | $0 |
| Wage / Income Gap (%) | 7,637 | 7.01% |
| Wage / Income Gap ($) | 7,637 | 92.99¢ per $1 |
| Gini / Inequality Index | 7,637 | 0.47 |
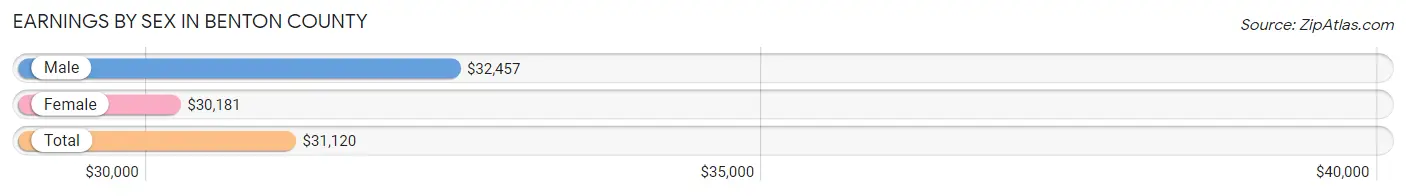
Earnings by Sex in Benton County
Average Earnings in Benton County are $31,120, $32,457 for men and $30,181 for women, a difference of 7.0%.
| Sex | Number | Average Earnings |
| Male | 1,765 (50.5%) | $32,457 |
| Female | 1,730 (49.5%) | $30,181 |
| Total | 3,495 (100.0%) | $31,120 |
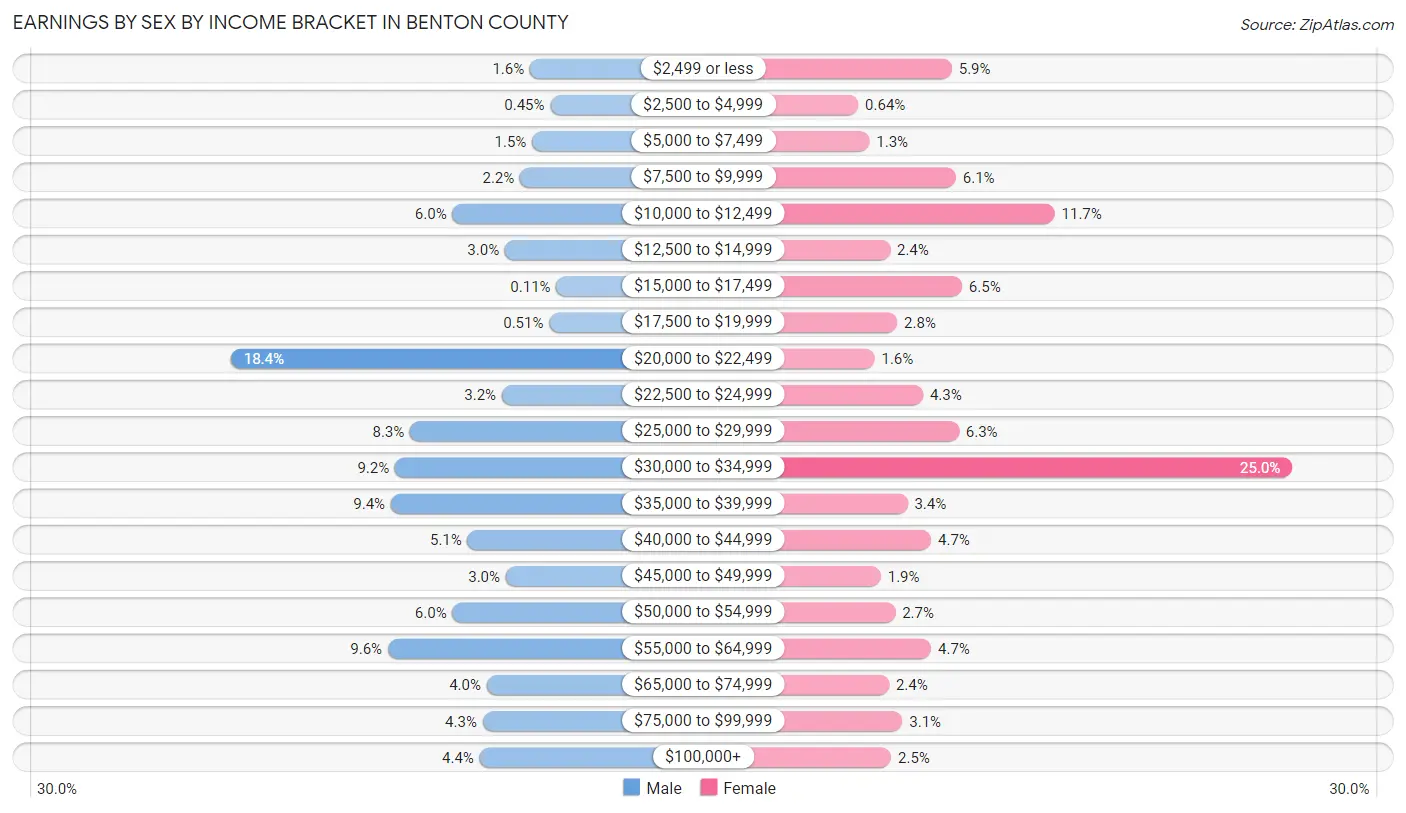
Earnings by Sex by Income Bracket in Benton County
The most common earnings brackets in Benton County are $20,000 to $22,499 for men (325 | 18.4%) and $30,000 to $34,999 for women (433 | 25.0%).
| Income | Male | Female |
| $2,499 or less | 28 (1.6%) | 102 (5.9%) |
| $2,500 to $4,999 | 8 (0.4%) | 11 (0.6%) |
| $5,000 to $7,499 | 26 (1.5%) | 22 (1.3%) |
| $7,500 to $9,999 | 38 (2.1%) | 106 (6.1%) |
| $10,000 to $12,499 | 105 (5.9%) | 202 (11.7%) |
| $12,500 to $14,999 | 53 (3.0%) | 42 (2.4%) |
| $15,000 to $17,499 | 2 (0.1%) | 112 (6.5%) |
| $17,500 to $19,999 | 9 (0.5%) | 49 (2.8%) |
| $20,000 to $22,499 | 325 (18.4%) | 27 (1.6%) |
| $22,500 to $24,999 | 56 (3.2%) | 74 (4.3%) |
| $25,000 to $29,999 | 147 (8.3%) | 109 (6.3%) |
| $30,000 to $34,999 | 162 (9.2%) | 433 (25.0%) |
| $35,000 to $39,999 | 166 (9.4%) | 59 (3.4%) |
| $40,000 to $44,999 | 90 (5.1%) | 82 (4.7%) |
| $45,000 to $49,999 | 52 (2.9%) | 33 (1.9%) |
| $50,000 to $54,999 | 105 (5.9%) | 47 (2.7%) |
| $55,000 to $64,999 | 169 (9.6%) | 82 (4.7%) |
| $65,000 to $74,999 | 71 (4.0%) | 41 (2.4%) |
| $75,000 to $99,999 | 75 (4.3%) | 54 (3.1%) |
| $100,000+ | 78 (4.4%) | 43 (2.5%) |
| Total | 1,765 (100.0%) | 1,730 (100.0%) |
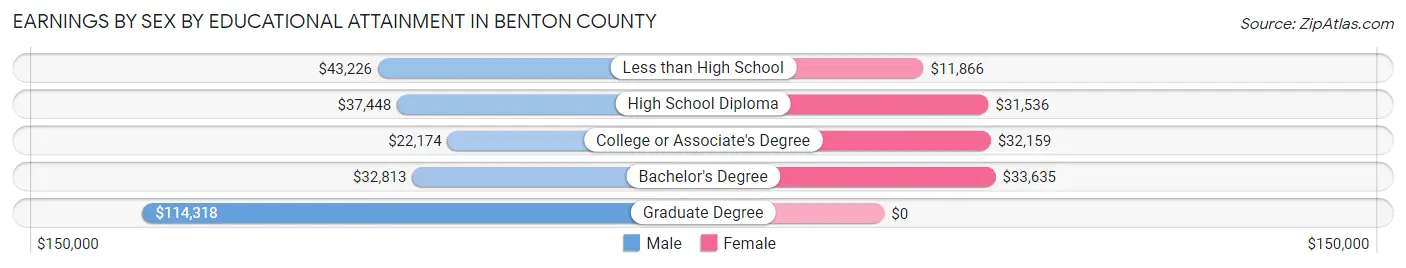
Earnings by Sex by Educational Attainment in Benton County
Average earnings in Benton County are $34,688 for men and $31,317 for women, a difference of 9.7%. Men with an educational attainment of graduate degree enjoy the highest average annual earnings of $114,318, while those with college or associate's degree education earn the least with $22,174. Women with an educational attainment of bachelor's degree earn the most with the average annual earnings of $33,635, while those with less than high school education have the smallest earnings of $11,866.
| Educational Attainment | Male Income | Female Income |
| Less than High School | $43,226 | $11,866 |
| High School Diploma | $37,448 | $31,536 |
| College or Associate's Degree | $22,174 | $32,159 |
| Bachelor's Degree | $32,813 | $33,635 |
| Graduate Degree | $114,318 | $0 |
| Total | $34,688 | $31,317 |
Family Income in Benton County
Family Income Brackets in Benton County
According to the Benton County family income data, there are 436 families falling into the $50,000 to $74,999 income range, which is the most common income bracket and makes up 22.7% of all families. Conversely, the $150,000 to $199,999 income bracket is the least frequent group with only 35 families (1.8%) belonging to this category.
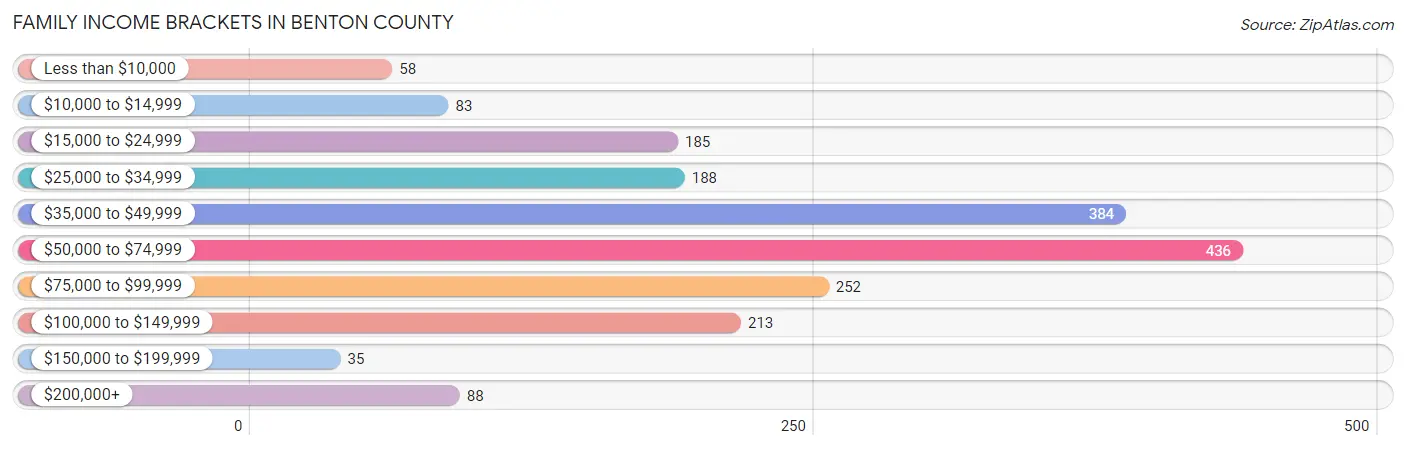
| Income Bracket | # Families | % Families |
| Less than $10,000 | 58 | 3.0% |
| $10,000 to $14,999 | 83 | 4.3% |
| $15,000 to $24,999 | 185 | 9.6% |
| $25,000 to $34,999 | 188 | 9.8% |
| $35,000 to $49,999 | 384 | 20.0% |
| $50,000 to $74,999 | 436 | 22.7% |
| $75,000 to $99,999 | 252 | 13.1% |
| $100,000 to $149,999 | 213 | 11.1% |
| $150,000 to $199,999 | 35 | 1.8% |
| $200,000+ | 88 | 4.6% |
Family Income by Famaliy Size in Benton County
4-person families (350 | 18.2%) account for the highest median family income in Benton County with $87,787 per family, while 3-person families (194 | 10.1%) have the highest median income of $23,611 per family member.
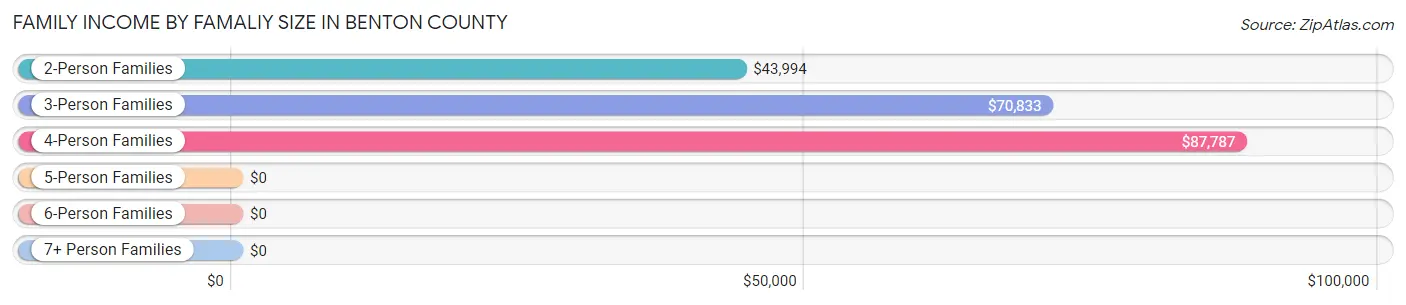
| Income Bracket | # Families | Median Income |
| 2-Person Families | 1,191 (62.0%) | $43,994 |
| 3-Person Families | 194 (10.1%) | $70,833 |
| 4-Person Families | 350 (18.2%) | $87,787 |
| 5-Person Families | 100 (5.2%) | $0 |
| 6-Person Families | 68 (3.5%) | $0 |
| 7+ Person Families | 19 (1.0%) | $0 |
| Total | 1,922 (100.0%) | $53,118 |
Family Income by Number of Earners in Benton County
The median family income in Benton County is $53,118, with families comprising 2 earners (755) having the highest median family income of $87,907, while families with no earners (407) have the lowest median family income of $35,919, accounting for 39.3% and 21.2% of families, respectively.
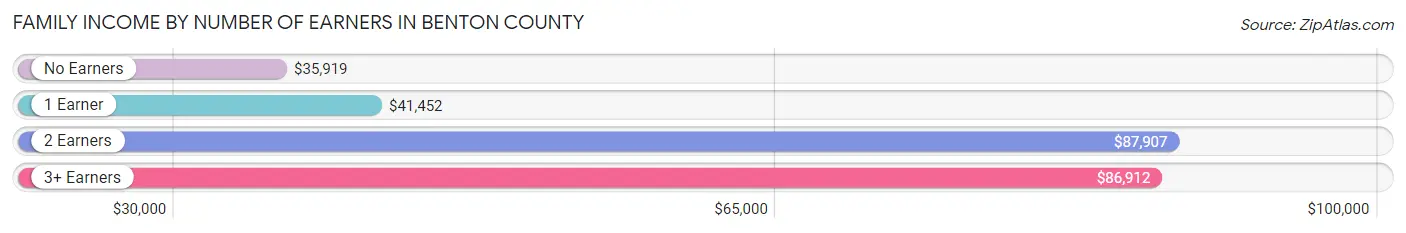
| Number of Earners | # Families | Median Income |
| No Earners | 407 (21.2%) | $35,919 |
| 1 Earner | 680 (35.4%) | $41,452 |
| 2 Earners | 755 (39.3%) | $87,907 |
| 3+ Earners | 80 (4.2%) | $86,912 |
| Total | 1,922 (100.0%) | $53,118 |
Household Income in Benton County
Household Income Brackets in Benton County
With 534 households falling in the category, the $15,000 to $24,999 income range is the most frequent in Benton County, accounting for 17.3% of all households. In contrast, only 37 households (1.2%) fall into the $150,000 to $199,999 income bracket, making it the least populous group.
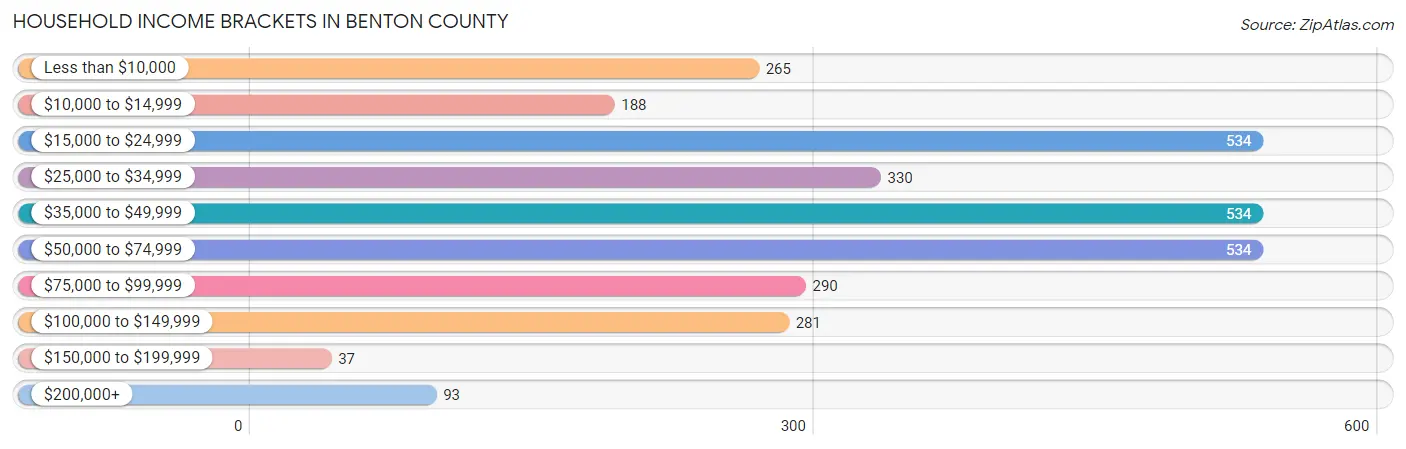
| Income Bracket | # Households | % Households |
| Less than $10,000 | 265 | 8.6% |
| $10,000 to $14,999 | 188 | 6.1% |
| $15,000 to $24,999 | 534 | 17.3% |
| $25,000 to $34,999 | 330 | 10.7% |
| $35,000 to $49,999 | 534 | 17.3% |
| $50,000 to $74,999 | 534 | 17.3% |
| $75,000 to $99,999 | 290 | 9.4% |
| $100,000 to $149,999 | 281 | 9.1% |
| $150,000 to $199,999 | 37 | 1.2% |
| $200,000+ | 93 | 3.0% |
Household Income by Householder Age in Benton County
The median household income in Benton County is $38,750, with the highest median household income of $49,464 found in the 25 to 44 years age bracket for the primary householder. A total of 799 households (25.9%) fall into this category. Meanwhile, the 15 to 24 years age bracket for the primary householder has the lowest median household income of $0, with 106 households (3.4%) in this group.
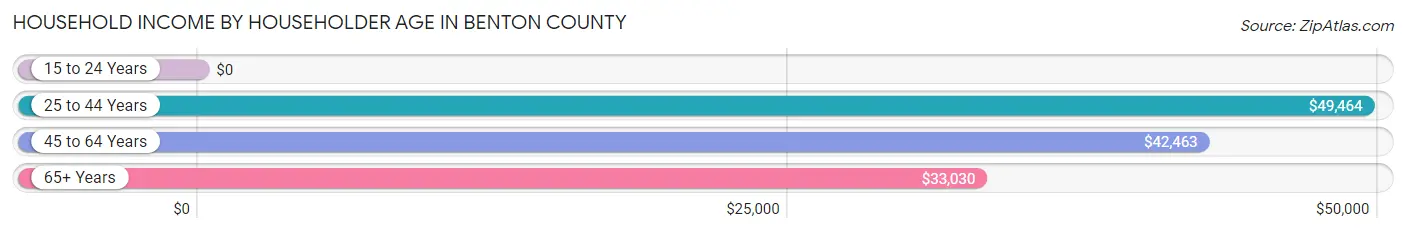
| Income Bracket | # Households | Median Income |
| 15 to 24 Years | 106 (3.4%) | $0 |
| 25 to 44 Years | 799 (25.9%) | $49,464 |
| 45 to 64 Years | 1,101 (35.7%) | $42,463 |
| 65+ Years | 1,080 (35.0%) | $33,030 |
| Total | 3,086 (100.0%) | $38,750 |
Poverty in Benton County
Income Below Poverty by Sex and Age in Benton County
With 14.7% poverty level for males and 20.5% for females among the residents of Benton County, 18 to 24 year old males and under 5 year old females are the most vulnerable to poverty, with 85 males (35.3%) and 102 females (73.4%) in their respective age groups living below the poverty level.
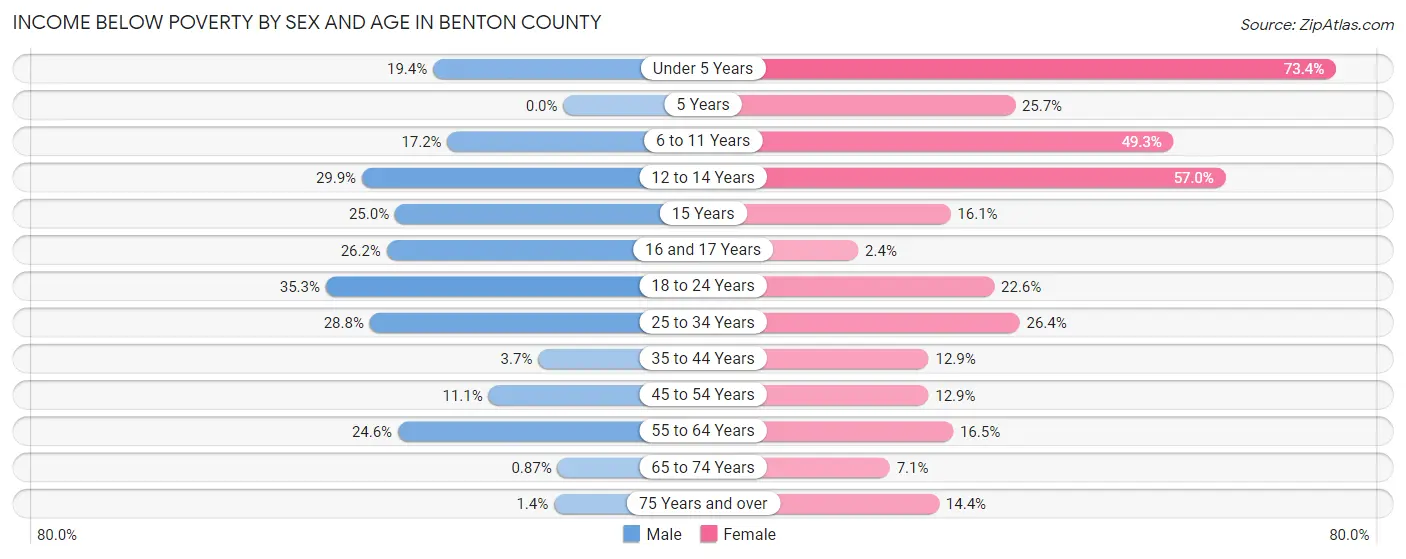
| Age Bracket | Male | Female |
| Under 5 Years | 36 (19.4%) | 102 (73.4%) |
| 5 Years | 0 (0.0%) | 9 (25.7%) |
| 6 to 11 Years | 63 (17.2%) | 136 (49.3%) |
| 12 to 14 Years | 35 (29.9%) | 57 (57.0%) |
| 15 Years | 3 (25.0%) | 5 (16.1%) |
| 16 and 17 Years | 16 (26.2%) | 5 (2.4%) |
| 18 to 24 Years | 85 (35.3%) | 83 (22.6%) |
| 25 to 34 Years | 92 (28.7%) | 94 (26.4%) |
| 35 to 44 Years | 26 (3.7%) | 55 (12.9%) |
| 45 to 54 Years | 44 (11.1%) | 64 (12.9%) |
| 55 to 64 Years | 139 (24.6%) | 89 (16.5%) |
| 65 to 74 Years | 4 (0.9%) | 38 (7.1%) |
| 75 Years and over | 3 (1.4%) | 45 (14.4%) |
| Total | 546 (14.7%) | 782 (20.5%) |
Income Above Poverty by Sex and Age in Benton County
According to the poverty statistics in Benton County, males aged 5 years and females aged 16 and 17 years are the age groups that are most secure financially, with 100.0% of males and 97.6% of females in these age groups living above the poverty line.
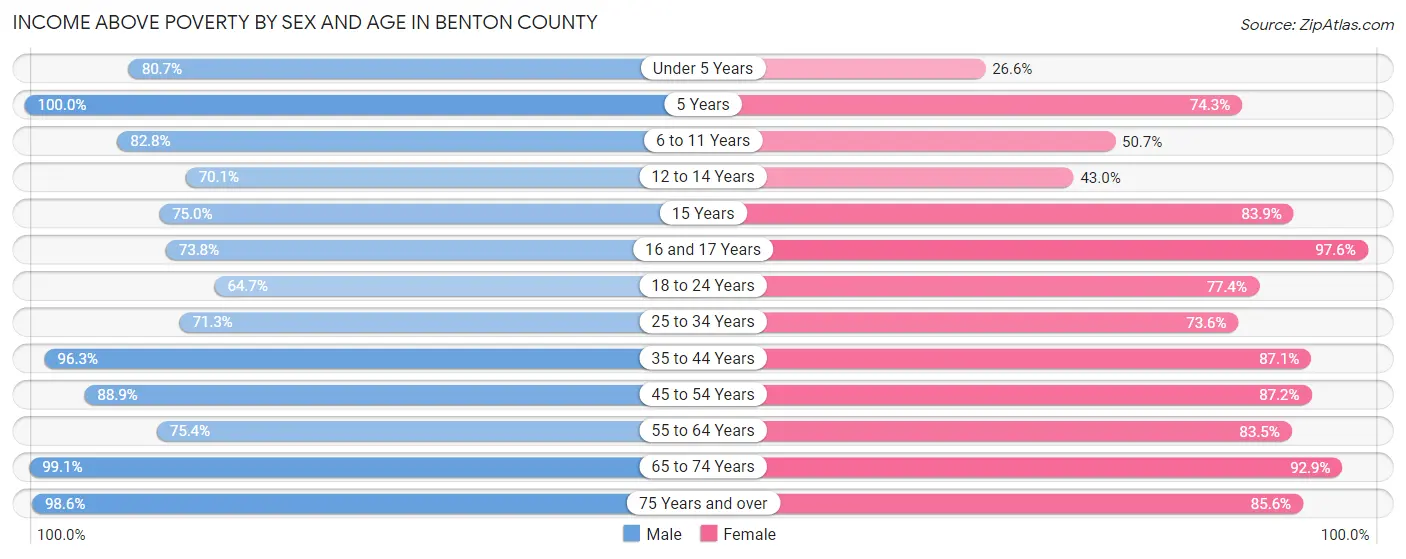
| Age Bracket | Male | Female |
| Under 5 Years | 150 (80.6%) | 37 (26.6%) |
| 5 Years | 74 (100.0%) | 26 (74.3%) |
| 6 to 11 Years | 303 (82.8%) | 140 (50.7%) |
| 12 to 14 Years | 82 (70.1%) | 43 (43.0%) |
| 15 Years | 9 (75.0%) | 26 (83.9%) |
| 16 and 17 Years | 45 (73.8%) | 201 (97.6%) |
| 18 to 24 Years | 156 (64.7%) | 284 (77.4%) |
| 25 to 34 Years | 228 (71.3%) | 262 (73.6%) |
| 35 to 44 Years | 671 (96.3%) | 372 (87.1%) |
| 45 to 54 Years | 352 (88.9%) | 434 (87.2%) |
| 55 to 64 Years | 427 (75.4%) | 450 (83.5%) |
| 65 to 74 Years | 458 (99.1%) | 496 (92.9%) |
| 75 Years and over | 215 (98.6%) | 267 (85.6%) |
| Total | 3,170 (85.3%) | 3,038 (79.5%) |
Income Below Poverty Among Married-Couple Families in Benton County
The poverty statistics for married-couple families in Benton County show that 5.2% or 74 of the total 1,409 families live below the poverty line. Families with 5 or more children have the highest poverty rate of 100.0%, comprising of 19 families. On the other hand, families with 1 or 2 children have the lowest poverty rate of 1.1%, which includes 3 families.
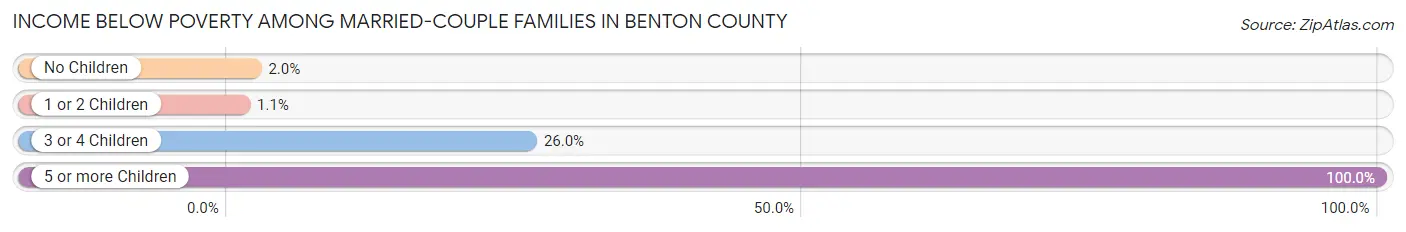
| Children | Above Poverty | Below Poverty |
| No Children | 961 (98.0%) | 20 (2.0%) |
| 1 or 2 Children | 283 (99.0%) | 3 (1.1%) |
| 3 or 4 Children | 91 (74.0%) | 32 (26.0%) |
| 5 or more Children | 0 (0.0%) | 19 (100.0%) |
| Total | 1,335 (94.8%) | 74 (5.2%) |
Income Below Poverty Among Single-Parent Households in Benton County
According to the poverty data in Benton County, 28.0% or 42 single-father households and 23.7% or 86 single-mother households are living below the poverty line. Among single-father households, those with 1 or 2 children have the highest poverty rate, with 42 households (39.3%) experiencing poverty. Likewise, among single-mother households, those with 1 or 2 children have the highest poverty rate, with 67 households (53.2%) falling below the poverty line.
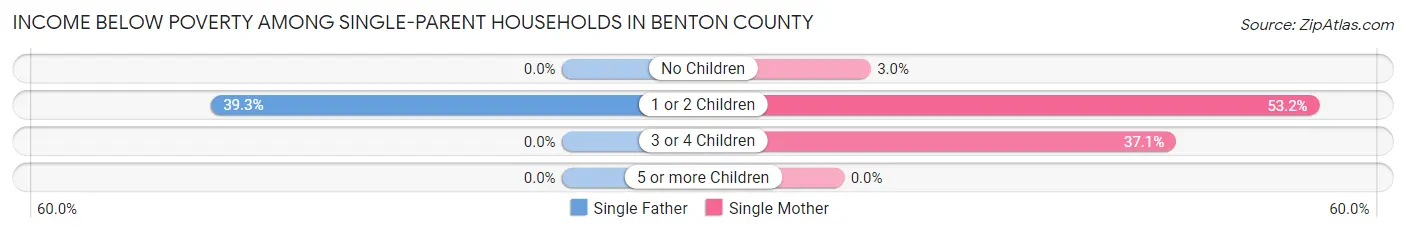
| Children | Single Father | Single Mother |
| No Children | 0 (0.0%) | 6 (3.0%) |
| 1 or 2 Children | 42 (39.3%) | 67 (53.2%) |
| 3 or 4 Children | 0 (0.0%) | 13 (37.1%) |
| 5 or more Children | 0 (0.0%) | 0 (0.0%) |
| Total | 42 (28.0%) | 86 (23.7%) |
Income Below Poverty Among Married-Couple vs Single-Parent Households in Benton County
The poverty data for Benton County shows that 74 of the married-couple family households (5.2%) and 128 of the single-parent households (24.9%) are living below the poverty level. Within the married-couple family households, those with 5 or more children have the highest poverty rate, with 19 households (100.0%) falling below the poverty line. Among the single-parent households, those with 1 or 2 children have the highest poverty rate, with 109 household (46.8%) living below poverty.
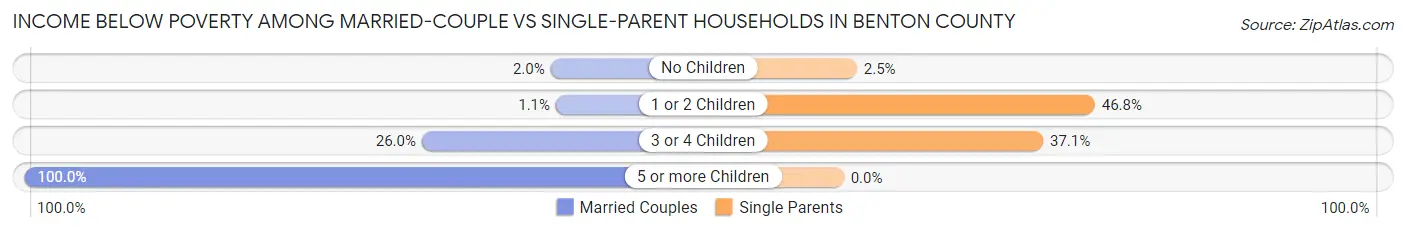
| Children | Married-Couple Families | Single-Parent Households |
| No Children | 20 (2.0%) | 6 (2.5%) |
| 1 or 2 Children | 3 (1.1%) | 109 (46.8%) |
| 3 or 4 Children | 32 (26.0%) | 13 (37.1%) |
| 5 or more Children | 19 (100.0%) | 0 (0.0%) |
| Total | 74 (5.2%) | 128 (24.9%) |
Race in Benton County
The most populous races in Benton County are White / Caucasian (4,645 | 60.8%), Black / African American (2,544 | 33.3%), and Two or more Races (256 | 3.4%).
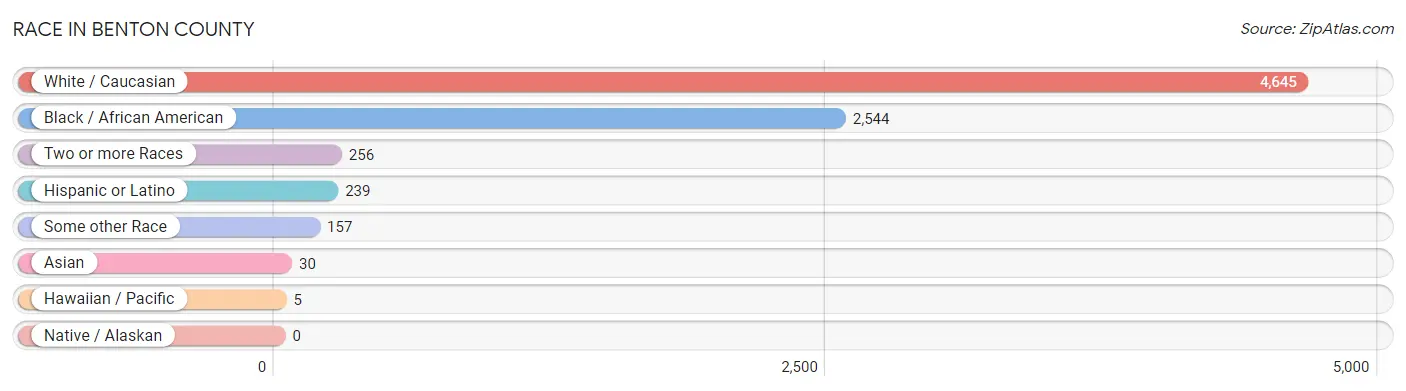
| Race | # Population | % Population |
| Asian | 30 | 0.4% |
| Black / African American | 2,544 | 33.3% |
| Hawaiian / Pacific | 5 | 0.1% |
| Hispanic or Latino | 239 | 3.1% |
| Native / Alaskan | 0 | 0.0% |
| White / Caucasian | 4,645 | 60.8% |
| Two or more Races | 256 | 3.4% |
| Some other Race | 157 | 2.1% |
| Total | 7,637 | 100.0% |
Ancestry in Benton County
The most populous ancestries reported in Benton County are English (1,203 | 15.8%), Irish (672 | 8.8%), American (630 | 8.3%), German (401 | 5.2%), and African (329 | 4.3%), together accounting for 42.4% of all Benton County residents.
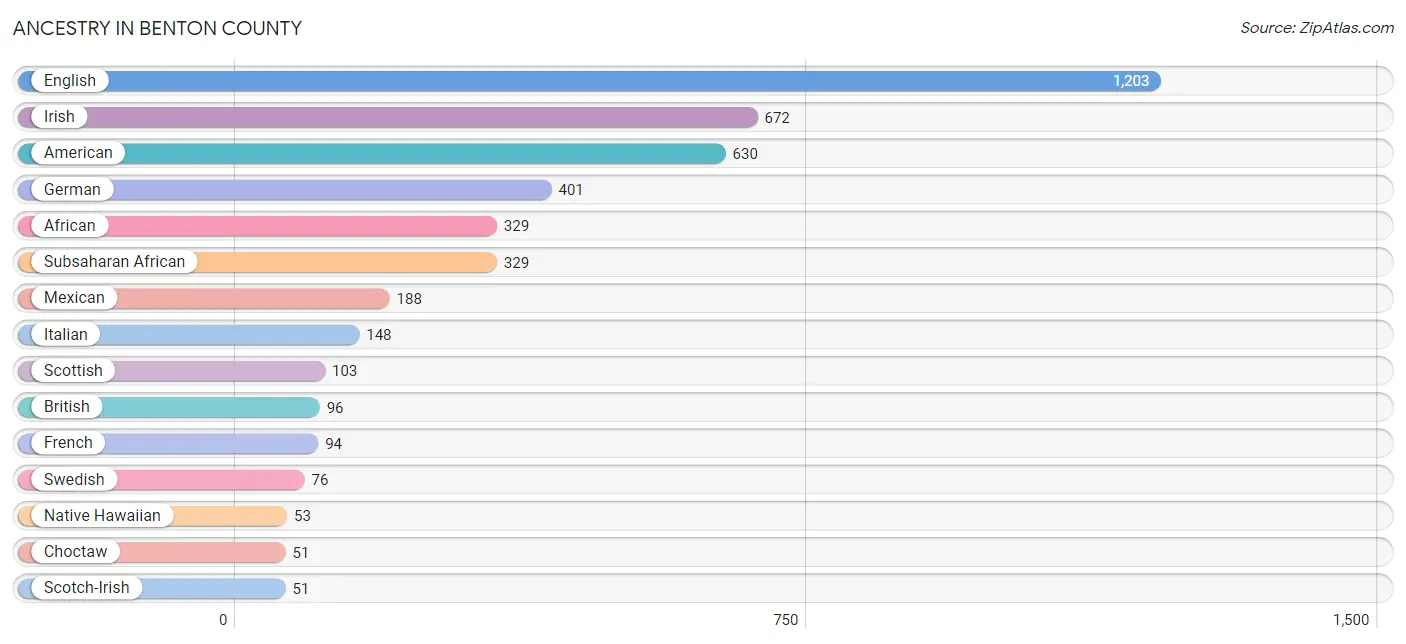
| Ancestry | # Population | % Population |
| African | 329 | 4.3% |
| American | 630 | 8.3% |
| Armenian | 9 | 0.1% |
| British | 96 | 1.3% |
| Burmese | 2 | 0.0% |
| Canadian | 6 | 0.1% |
| Cherokee | 11 | 0.1% |
| Choctaw | 51 | 0.7% |
| Cuban | 14 | 0.2% |
| Dutch | 10 | 0.1% |
| English | 1,203 | 15.8% |
| European | 10 | 0.1% |
| French | 94 | 1.2% |
| French Canadian | 3 | 0.0% |
| German | 401 | 5.2% |
| Greek | 6 | 0.1% |
| Irish | 672 | 8.8% |
| Italian | 148 | 1.9% |
| Korean | 30 | 0.4% |
| Luxembourger | 2 | 0.0% |
| Mexican | 188 | 2.5% |
| Native Hawaiian | 53 | 0.7% |
| Northern European | 3 | 0.0% |
| Norwegian | 9 | 0.1% |
| Polish | 12 | 0.2% |
| Portuguese | 33 | 0.4% |
| Puerto Rican | 33 | 0.4% |
| Russian | 14 | 0.2% |
| Scandinavian | 4 | 0.1% |
| Scotch-Irish | 51 | 0.7% |
| Scottish | 103 | 1.3% |
| Subsaharan African | 329 | 4.3% |
| Swedish | 76 | 1.0% |
| Welsh | 13 | 0.2% | View All 34 Rows |
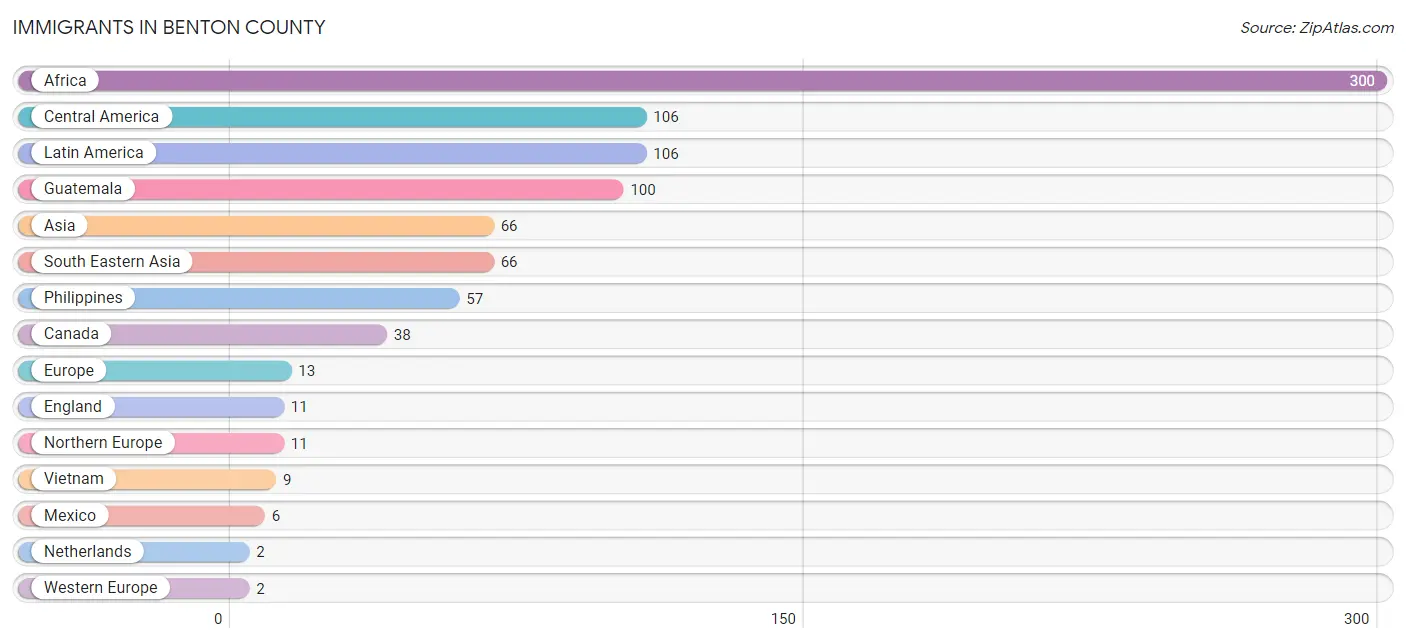
Immigrants in Benton County
The most numerous immigrant groups reported in Benton County came from Africa (300 | 3.9%), Central America (106 | 1.4%), Latin America (106 | 1.4%), Guatemala (100 | 1.3%), and Asia (66 | 0.9%), together accounting for 8.9% of all Benton County residents.
| Immigration Origin | # Population | % Population |
| Africa | 300 | 3.9% |
| Asia | 66 | 0.9% |
| Canada | 38 | 0.5% |
| Central America | 106 | 1.4% |
| England | 11 | 0.1% |
| Europe | 13 | 0.2% |
| Guatemala | 100 | 1.3% |
| Latin America | 106 | 1.4% |
| Mexico | 6 | 0.1% |
| Netherlands | 2 | 0.0% |
| Northern Europe | 11 | 0.1% |
| Philippines | 57 | 0.7% |
| South Eastern Asia | 66 | 0.9% |
| Vietnam | 9 | 0.1% |
| Western Europe | 2 | 0.0% | View All 15 Rows |
Sex and Age in Benton County
Sex and Age in Benton County
The most populous age groups in Benton County are 35 to 39 Years (578 | 15.3%) for men and 20 to 24 Years (352 | 9.1%) for women.
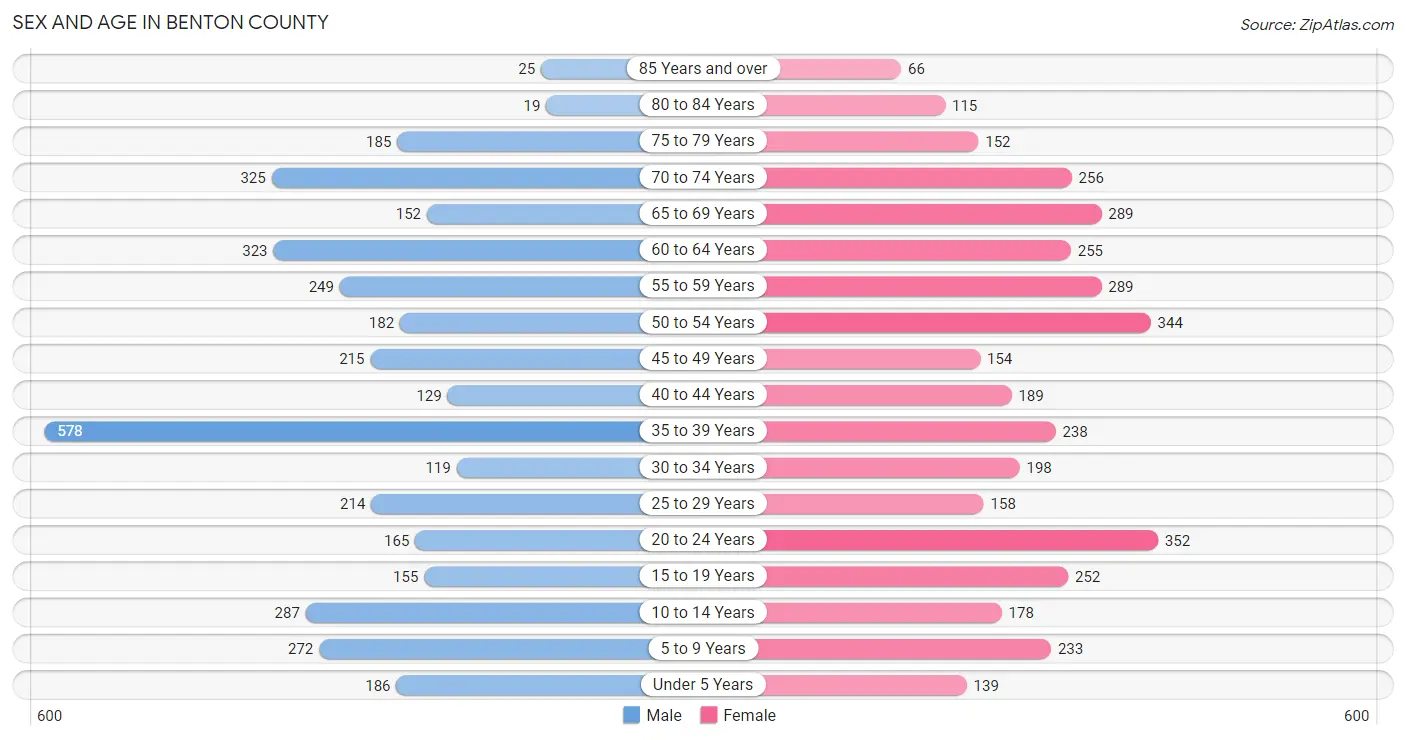
| Age Bracket | Male | Female |
| Under 5 Years | 186 (4.9%) | 139 (3.6%) |
| 5 to 9 Years | 272 (7.2%) | 233 (6.0%) |
| 10 to 14 Years | 287 (7.6%) | 178 (4.6%) |
| 15 to 19 Years | 155 (4.1%) | 252 (6.5%) |
| 20 to 24 Years | 165 (4.4%) | 352 (9.1%) |
| 25 to 29 Years | 214 (5.7%) | 158 (4.1%) |
| 30 to 34 Years | 119 (3.2%) | 198 (5.1%) |
| 35 to 39 Years | 578 (15.3%) | 238 (6.2%) |
| 40 to 44 Years | 129 (3.4%) | 189 (4.9%) |
| 45 to 49 Years | 215 (5.7%) | 154 (4.0%) |
| 50 to 54 Years | 182 (4.8%) | 344 (8.9%) |
| 55 to 59 Years | 249 (6.6%) | 289 (7.5%) |
| 60 to 64 Years | 323 (8.5%) | 255 (6.6%) |
| 65 to 69 Years | 152 (4.0%) | 289 (7.5%) |
| 70 to 74 Years | 325 (8.6%) | 256 (6.6%) |
| 75 to 79 Years | 185 (4.9%) | 152 (3.9%) |
| 80 to 84 Years | 19 (0.5%) | 115 (3.0%) |
| 85 Years and over | 25 (0.7%) | 66 (1.7%) |
| Total | 3,780 (100.0%) | 3,857 (100.0%) |
Families and Households in Benton County
Median Family Size in Benton County
The median family size in Benton County is 3.27 persons per family, with single female/mother families (363 | 18.9%) accounting for the largest median family size of 3.72 persons per family. On the other hand, single male/father families (150 | 7.8%) represent the smallest median family size with 2.67 persons per family.
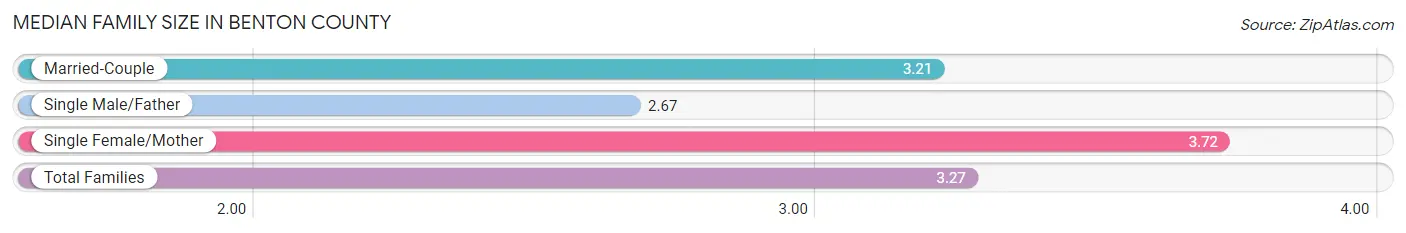
| Family Type | # Families | Family Size |
| Married-Couple | 1,409 (73.3%) | 3.21 |
| Single Male/Father | 150 (7.8%) | 2.67 |
| Single Female/Mother | 363 (18.9%) | 3.72 |
| Total Families | 1,922 (100.0%) | 3.27 |
Median Household Size in Benton County
The median household size in Benton County is 2.44 persons per household, with single female/mother households (363 | 11.8%) accounting for the largest median household size of 3.8 persons per household. non-family households (1,164 | 37.7%) represent the smallest median household size with 1.04 persons per household.
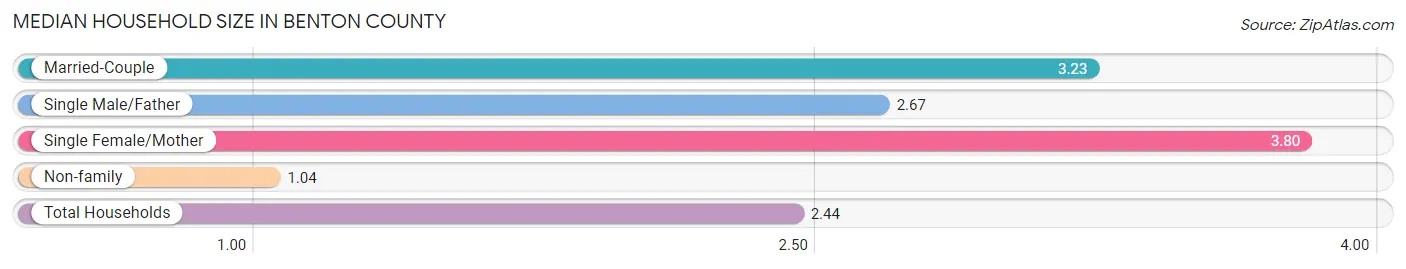
| Household Type | # Households | Household Size |
| Married-Couple | 1,409 (45.7%) | 3.23 |
| Single Male/Father | 150 (4.9%) | 2.67 |
| Single Female/Mother | 363 (11.8%) | 3.80 |
| Non-family | 1,164 (37.7%) | 1.04 |
| Total Households | 3,086 (100.0%) | 2.44 |
Household Size by Marriage Status in Benton County
Out of a total of 3,086 households in Benton County, 1,922 (62.3%) are family households, while 1,164 (37.7%) are nonfamily households. The most numerous type of family households are 2-person households, comprising 1,155, and the most common type of nonfamily households are 1-person households, comprising 1,117.
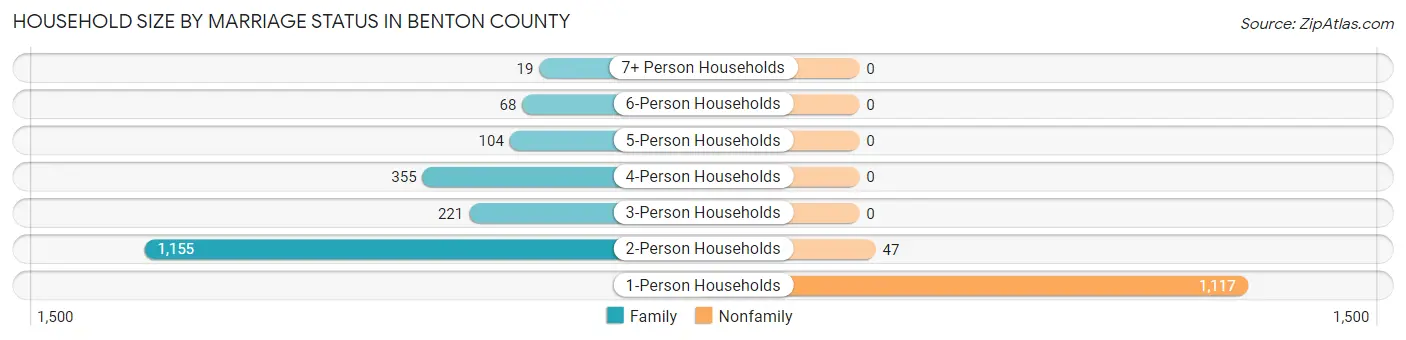
| Household Size | Family Households | Nonfamily Households |
| 1-Person Households | - | 1,117 (36.2%) |
| 2-Person Households | 1,155 (37.4%) | 47 (1.5%) |
| 3-Person Households | 221 (7.2%) | 0 (0.0%) |
| 4-Person Households | 355 (11.5%) | 0 (0.0%) |
| 5-Person Households | 104 (3.4%) | 0 (0.0%) |
| 6-Person Households | 68 (2.2%) | 0 (0.0%) |
| 7+ Person Households | 19 (0.6%) | 0 (0.0%) |
| Total | 1,922 (62.3%) | 1,164 (37.7%) |
Female Fertility in Benton County
Fertility by Age in Benton County
Average fertility rate in Benton County is 73.0 births per 1,000 women. Women in the age bracket of 20 to 34 years have the highest fertility rate with 154.0 births per 1,000 women. Women in the age bracket of 20 to 34 years acount for 95.6% of all women with births.
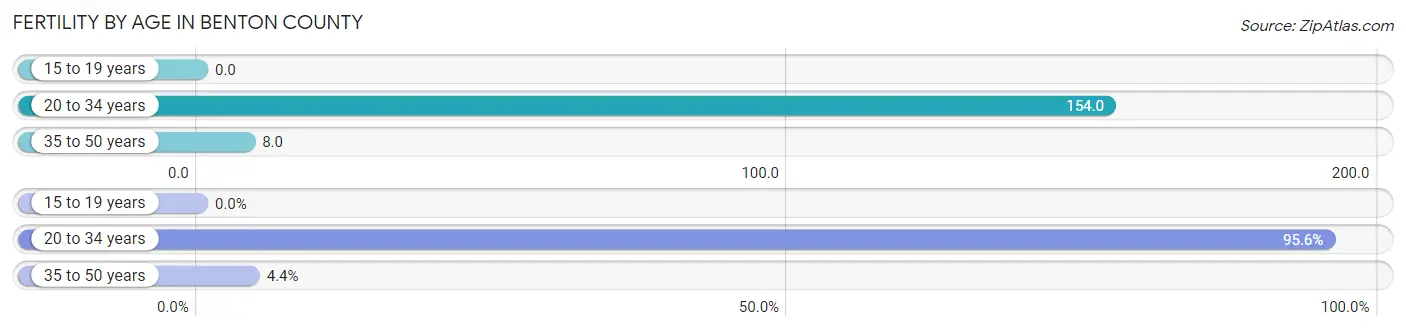
| Age Bracket | Women with Births | Births / 1,000 Women |
| 15 to 19 years | 0 (0.0%) | 0.0 |
| 20 to 34 years | 109 (95.6%) | 154.0 |
| 35 to 50 years | 5 (4.4%) | 8.0 |
| Total | 114 (100.0%) | 73.0 |
Fertility by Age by Marriage Status in Benton County
19.3% of women with births (114) in Benton County are married. The highest percentage of unmarried women with births falls into 35 to 50 years age bracket with 100.0% of them unmarried at the time of birth, while the lowest percentage of unmarried women with births belong to 20 to 34 years age bracket with 79.8% of them unmarried.
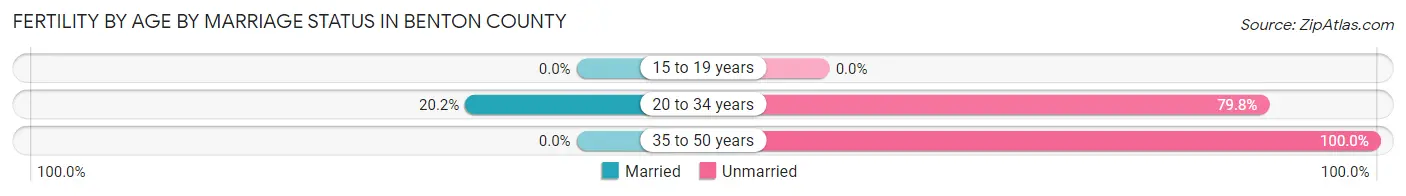
| Age Bracket | Married | Unmarried |
| 15 to 19 years | 0 (0.0%) | 0 (0.0%) |
| 20 to 34 years | 22 (20.2%) | 87 (79.8%) |
| 35 to 50 years | 0 (0.0%) | 5 (100.0%) |
| Total | 22 (19.3%) | 92 (80.7%) |
Fertility by Education in Benton County
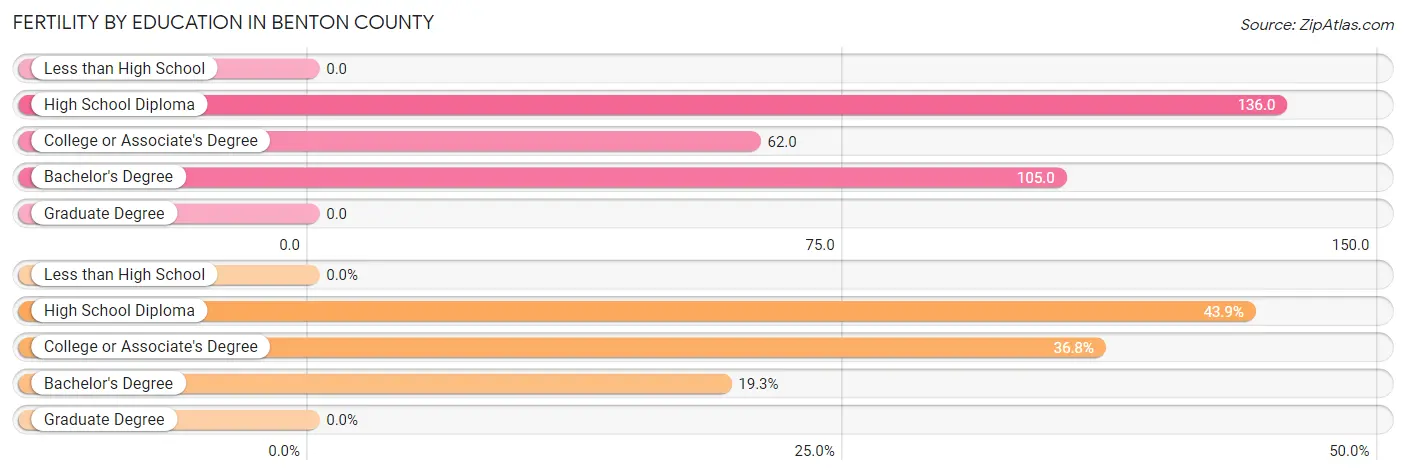
| Educational Attainment | Women with Births | Births / 1,000 Women |
| Less than High School | 0 (0.0%) | 0.0 |
| High School Diploma | 50 (43.9%) | 136.0 |
| College or Associate's Degree | 42 (36.8%) | 62.0 |
| Bachelor's Degree | 22 (19.3%) | 105.0 |
| Graduate Degree | 0 (0.0%) | 0.0 |
| Total | 114 (100.0%) | 73.0 |
Fertility by Education by Marriage Status in Benton County
80.7% of women with births in Benton County are unmarried. Women with the educational attainment of bachelor's degree are most likely to be married with 100.0% of them married at childbirth, while women with the educational attainment of high school diploma are least likely to be married with 100.0% of them unmarried at childbirth.
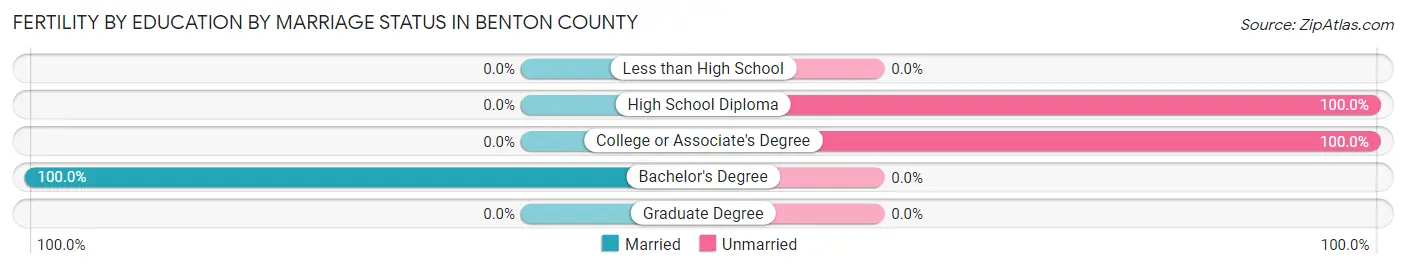
| Educational Attainment | Married | Unmarried |
| Less than High School | 0 (0.0%) | 0 (0.0%) |
| High School Diploma | 0 (0.0%) | 50 (100.0%) |
| College or Associate's Degree | 0 (0.0%) | 42 (100.0%) |
| Bachelor's Degree | 22 (100.0%) | 0 (0.0%) |
| Graduate Degree | 0 (0.0%) | 0 (0.0%) |
| Total | 22 (19.3%) | 92 (80.7%) |
Employment Characteristics in Benton County
Employment by Class of Employer in Benton County
Among the 3,225 employed individuals in Benton County, private company employees (2,494 | 77.3%), local government employees (197 | 6.1%), and state government employees (183 | 5.7%) make up the most common classes of employment.
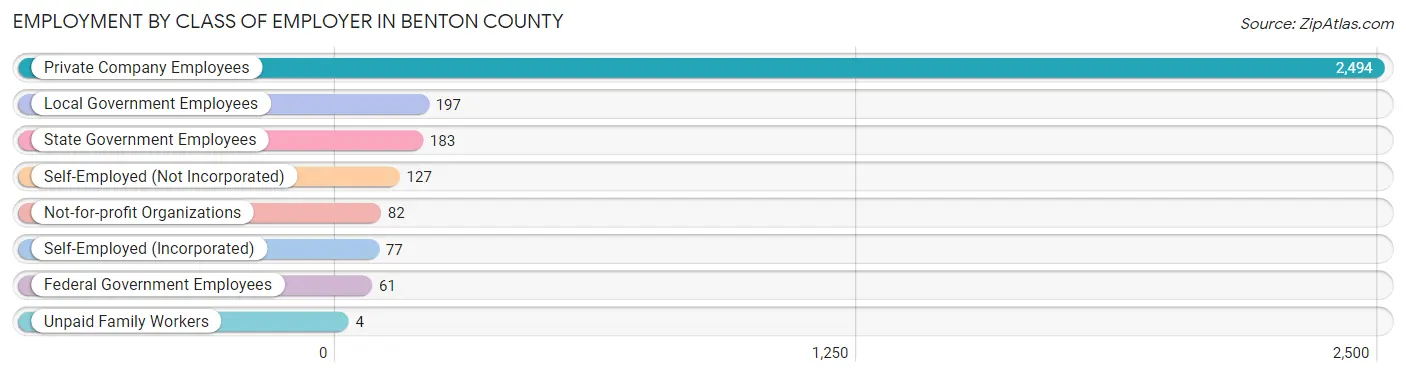
| Employer Class | # Employees | % Employees |
| Private Company Employees | 2,494 | 77.3% |
| Self-Employed (Incorporated) | 77 | 2.4% |
| Self-Employed (Not Incorporated) | 127 | 3.9% |
| Not-for-profit Organizations | 82 | 2.5% |
| Local Government Employees | 197 | 6.1% |
| State Government Employees | 183 | 5.7% |
| Federal Government Employees | 61 | 1.9% |
| Unpaid Family Workers | 4 | 0.1% |
| Total | 3,225 | 100.0% |
Employment Status by Age in Benton County
According to the labor force statistics for Benton County, out of the total population over 16 years of age (6,299), 54.0% or 3,401 individuals are in the labor force, with 4.4% or 150 of them unemployed. The age group with the highest labor force participation rate is 35 to 44 years, with 86.9% or 985 individuals in the labor force. Within the labor force, the 30 to 34 years age range has the highest percentage of unemployed individuals, with 19.7% or 44 of them being unemployed.
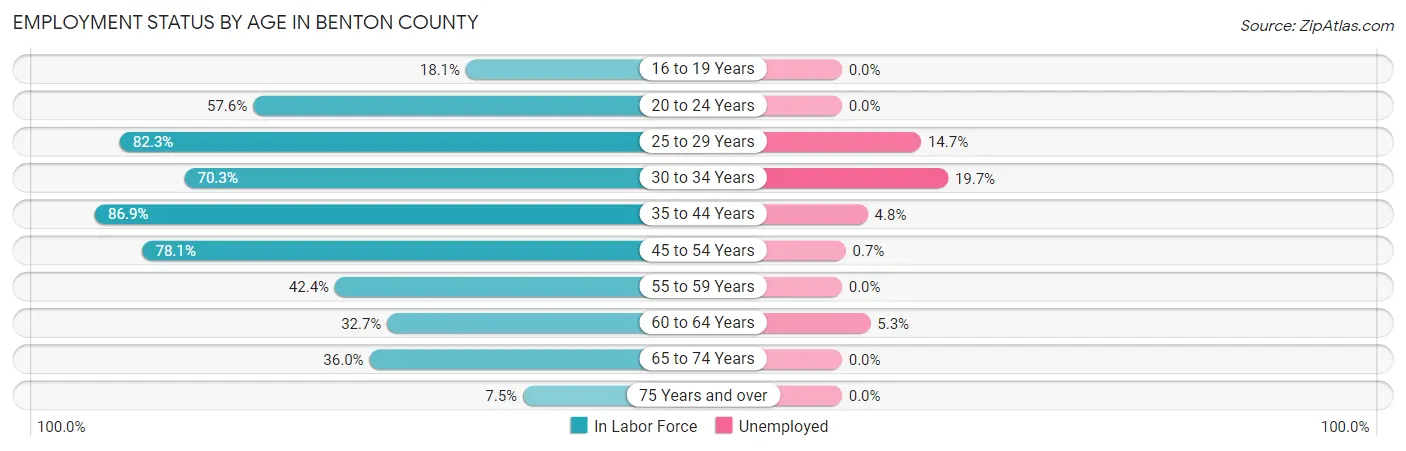
| Age Bracket | In Labor Force | Unemployed |
| 16 to 19 Years | 66 (18.1%) | 0 (0.0%) |
| 20 to 24 Years | 298 (57.6%) | 0 (0.0%) |
| 25 to 29 Years | 306 (82.3%) | 45 (14.7%) |
| 30 to 34 Years | 223 (70.3%) | 44 (19.7%) |
| 35 to 44 Years | 985 (86.9%) | 47 (4.8%) |
| 45 to 54 Years | 699 (78.1%) | 5 (0.7%) |
| 55 to 59 Years | 228 (42.4%) | 0 (0.0%) |
| 60 to 64 Years | 189 (32.7%) | 10 (5.3%) |
| 65 to 74 Years | 368 (36.0%) | 0 (0.0%) |
| 75 Years and over | 42 (7.5%) | 0 (0.0%) |
| Total | 3,401 (54.0%) | 150 (4.4%) |
Employment Status by Educational Attainment in Benton County
According to labor force statistics for Benton County, 68.6% of individuals (2,630) out of the total population between 25 and 64 years of age (3,834) are in the labor force, with 5.7% or 150 of them being unemployed. The group with the highest labor force participation rate are those with the educational attainment of bachelor's degree or higher, with 85.6% or 346 individuals in the labor force. Within the labor force, individuals with bachelor's degree or higher education have the highest percentage of unemployment, with 7.8% or 27 of them being unemployed.
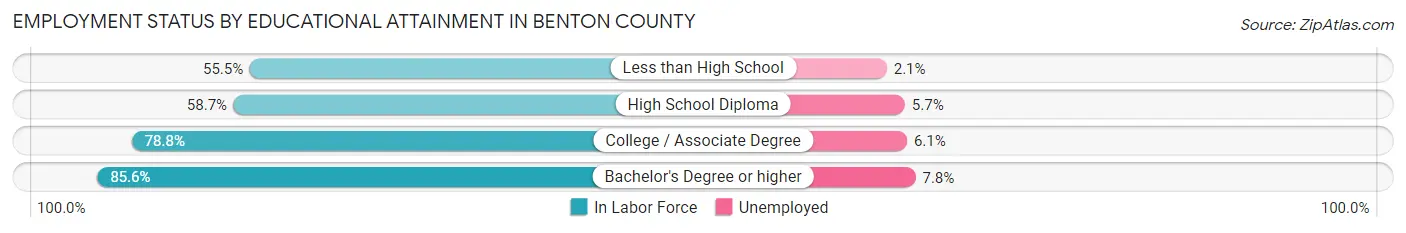
| Educational Attainment | In Labor Force | Unemployed |
| Less than High School | 292 (55.5%) | 11 (2.1%) |
| High School Diploma | 865 (58.7%) | 84 (5.7%) |
| College / Associate Degree | 1,128 (78.8%) | 87 (6.1%) |
| Bachelor's Degree or higher | 346 (85.6%) | 32 (7.8%) |
| Total | 2,630 (68.6%) | 219 (5.7%) |
Employment Occupations by Sex in Benton County
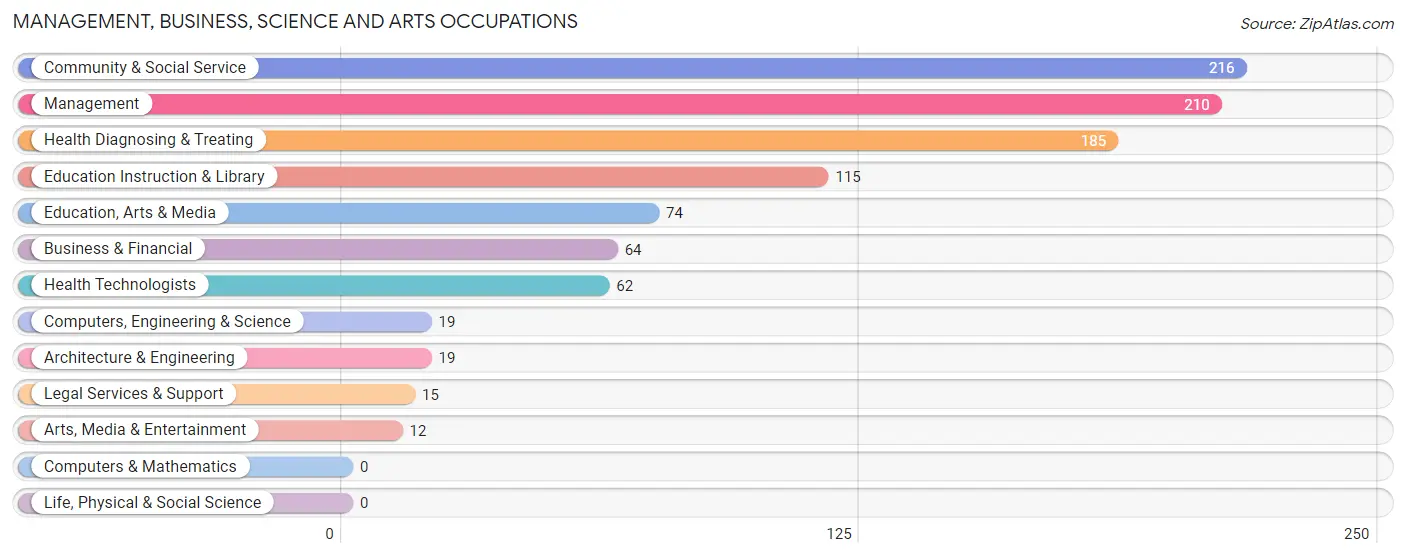
Management, Business, Science and Arts Occupations
The most common Management, Business, Science and Arts occupations in Benton County are Community & Social Service (216 | 6.6%), Management (210 | 6.5%), Health Diagnosing & Treating (185 | 5.7%), Education Instruction & Library (115 | 3.5%), and Education, Arts & Media (74 | 2.3%).
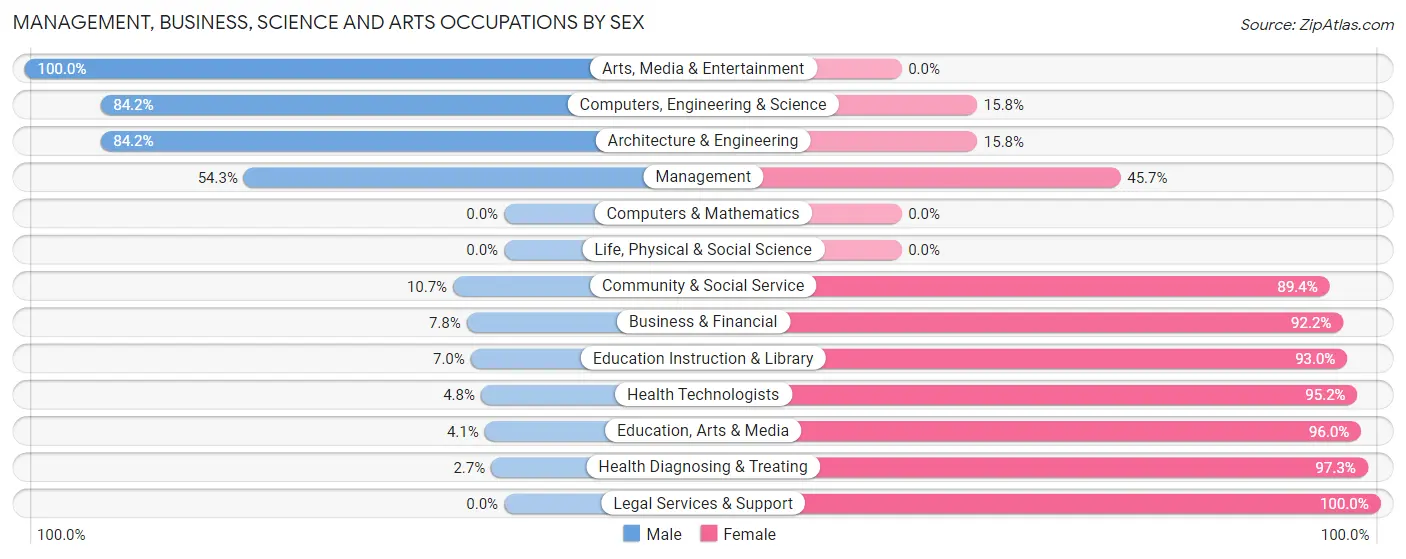
Management, Business, Science and Arts Occupations by Sex
Within the Management, Business, Science and Arts occupations in Benton County, the most male-oriented occupations are Arts, Media & Entertainment (100.0%), Computers, Engineering & Science (84.2%), and Architecture & Engineering (84.2%), while the most female-oriented occupations are Legal Services & Support (100.0%), Health Diagnosing & Treating (97.3%), and Education, Arts & Media (96.0%).
| Occupation | Male | Female |
| Management | 114 (54.3%) | 96 (45.7%) |
| Business & Financial | 5 (7.8%) | 59 (92.2%) |
| Computers, Engineering & Science | 16 (84.2%) | 3 (15.8%) |
| Computers & Mathematics | 0 (0.0%) | 0 (0.0%) |
| Architecture & Engineering | 16 (84.2%) | 3 (15.8%) |
| Life, Physical & Social Science | 0 (0.0%) | 0 (0.0%) |
| Community & Social Service | 23 (10.6%) | 193 (89.3%) |
| Education, Arts & Media | 3 (4.1%) | 71 (96.0%) |
| Legal Services & Support | 0 (0.0%) | 15 (100.0%) |
| Education Instruction & Library | 8 (7.0%) | 107 (93.0%) |
| Arts, Media & Entertainment | 12 (100.0%) | 0 (0.0%) |
| Health Diagnosing & Treating | 5 (2.7%) | 180 (97.3%) |
| Health Technologists | 3 (4.8%) | 59 (95.2%) |
| Total (Category) | 163 (23.5%) | 531 (76.5%) |
| Total (Overall) | 1,653 (50.8%) | 1,600 (49.2%) |
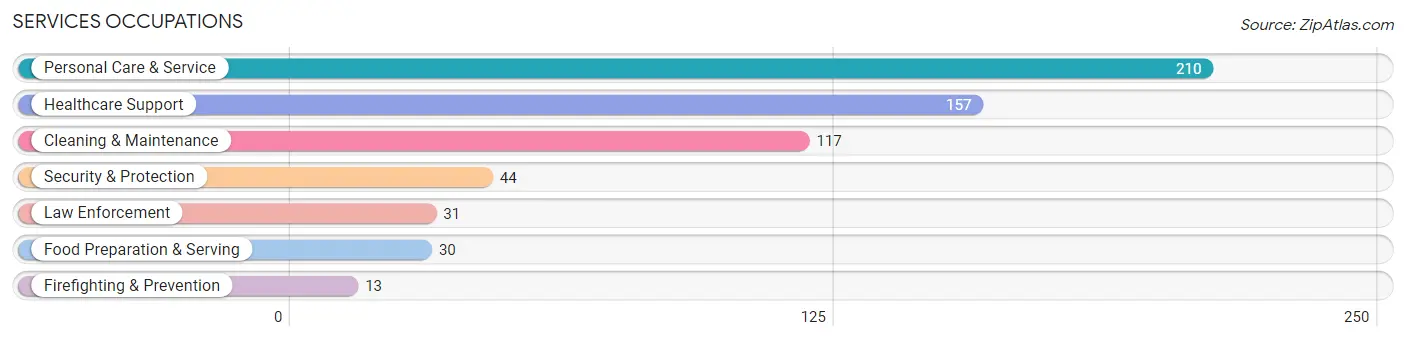
Services Occupations
The most common Services occupations in Benton County are Personal Care & Service (210 | 6.5%), Healthcare Support (157 | 4.8%), Cleaning & Maintenance (117 | 3.6%), Security & Protection (44 | 1.3%), and Law Enforcement (31 | 0.9%).
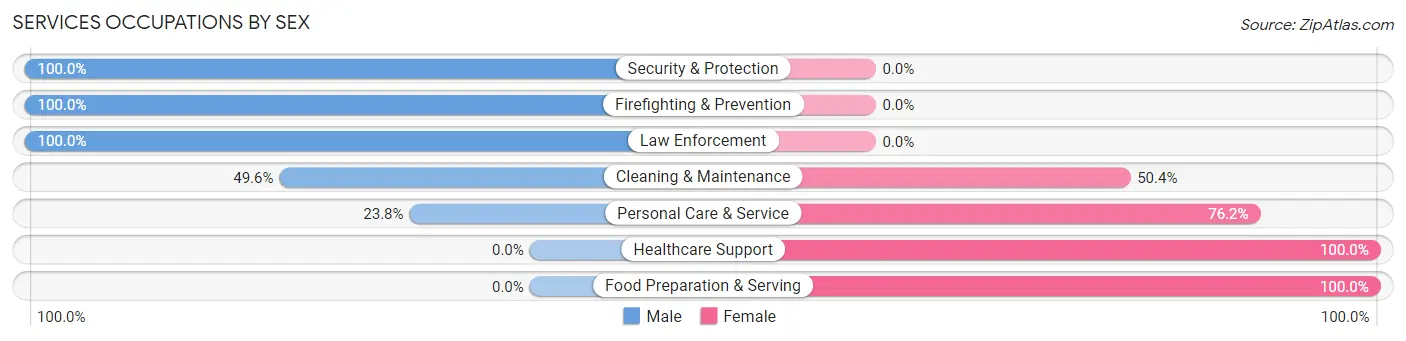
Services Occupations by Sex
Within the Services occupations in Benton County, the most male-oriented occupations are Security & Protection (100.0%), Firefighting & Prevention (100.0%), and Law Enforcement (100.0%), while the most female-oriented occupations are Healthcare Support (100.0%), Food Preparation & Serving (100.0%), and Personal Care & Service (76.2%).
| Occupation | Male | Female |
| Healthcare Support | 0 (0.0%) | 157 (100.0%) |
| Security & Protection | 44 (100.0%) | 0 (0.0%) |
| Firefighting & Prevention | 13 (100.0%) | 0 (0.0%) |
| Law Enforcement | 31 (100.0%) | 0 (0.0%) |
| Food Preparation & Serving | 0 (0.0%) | 30 (100.0%) |
| Cleaning & Maintenance | 58 (49.6%) | 59 (50.4%) |
| Personal Care & Service | 50 (23.8%) | 160 (76.2%) |
| Total (Category) | 152 (27.2%) | 406 (72.8%) |
| Total (Overall) | 1,653 (50.8%) | 1,600 (49.2%) |
Sales and Office Occupations
The most common Sales and Office occupations in Benton County are Office & Administration (331 | 10.2%), and Sales & Related (187 | 5.8%).
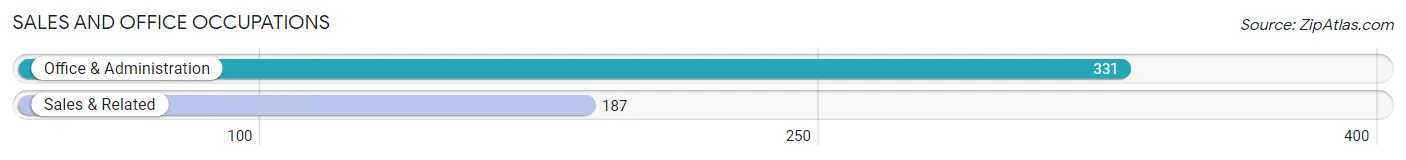
Sales and Office Occupations by Sex
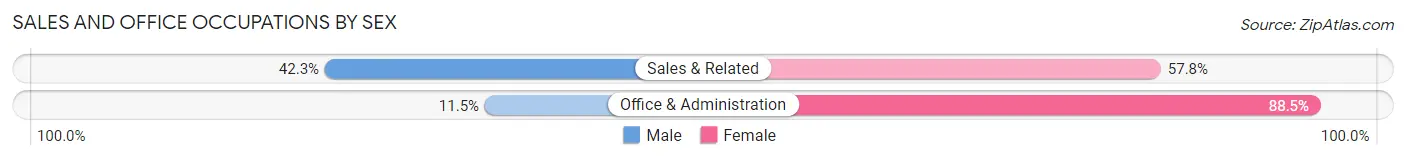
| Occupation | Male | Female |
| Sales & Related | 79 (42.2%) | 108 (57.8%) |
| Office & Administration | 38 (11.5%) | 293 (88.5%) |
| Total (Category) | 117 (22.6%) | 401 (77.4%) |
| Total (Overall) | 1,653 (50.8%) | 1,600 (49.2%) |
Natural Resources, Construction and Maintenance Occupations
The most common Natural Resources, Construction and Maintenance occupations in Benton County are Construction & Extraction (328 | 10.1%), Installation, Maintenance & Repair (153 | 4.7%), and Farming, Fishing & Forestry (27 | 0.8%).
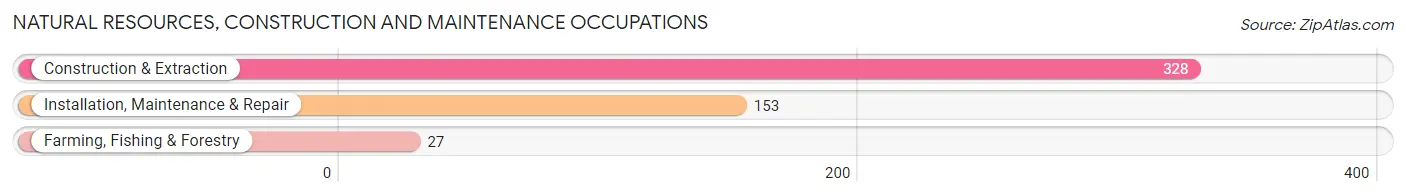
Natural Resources, Construction and Maintenance Occupations by Sex
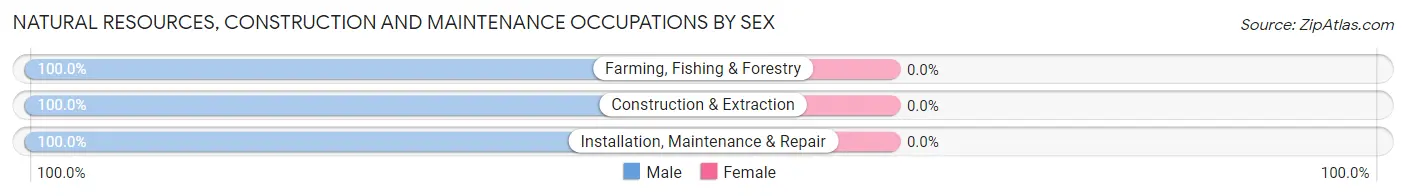
| Occupation | Male | Female |
| Farming, Fishing & Forestry | 27 (100.0%) | 0 (0.0%) |
| Construction & Extraction | 328 (100.0%) | 0 (0.0%) |
| Installation, Maintenance & Repair | 153 (100.0%) | 0 (0.0%) |
| Total (Category) | 508 (100.0%) | 0 (0.0%) |
| Total (Overall) | 1,653 (50.8%) | 1,600 (49.2%) |
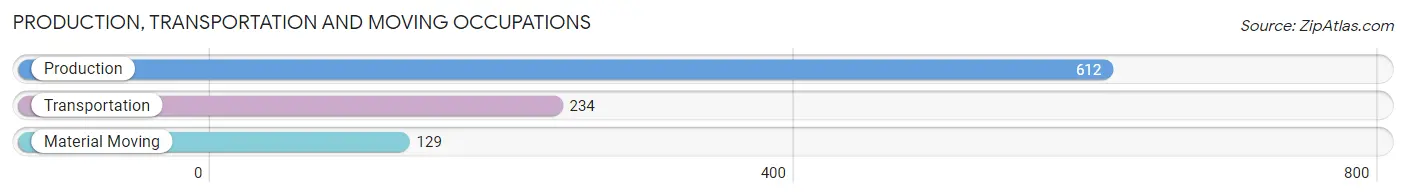
Production, Transportation and Moving Occupations
The most common Production, Transportation and Moving occupations in Benton County are Production (612 | 18.8%), Transportation (234 | 7.2%), and Material Moving (129 | 4.0%).
Production, Transportation and Moving Occupations by Sex
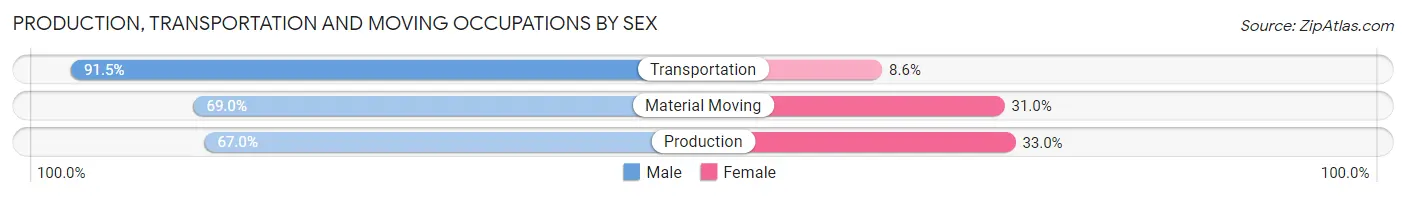
| Occupation | Male | Female |
| Production | 410 (67.0%) | 202 (33.0%) |
| Transportation | 214 (91.4%) | 20 (8.6%) |
| Material Moving | 89 (69.0%) | 40 (31.0%) |
| Total (Category) | 713 (73.1%) | 262 (26.9%) |
| Total (Overall) | 1,653 (50.8%) | 1,600 (49.2%) |
Employment Industries by Sex in Benton County
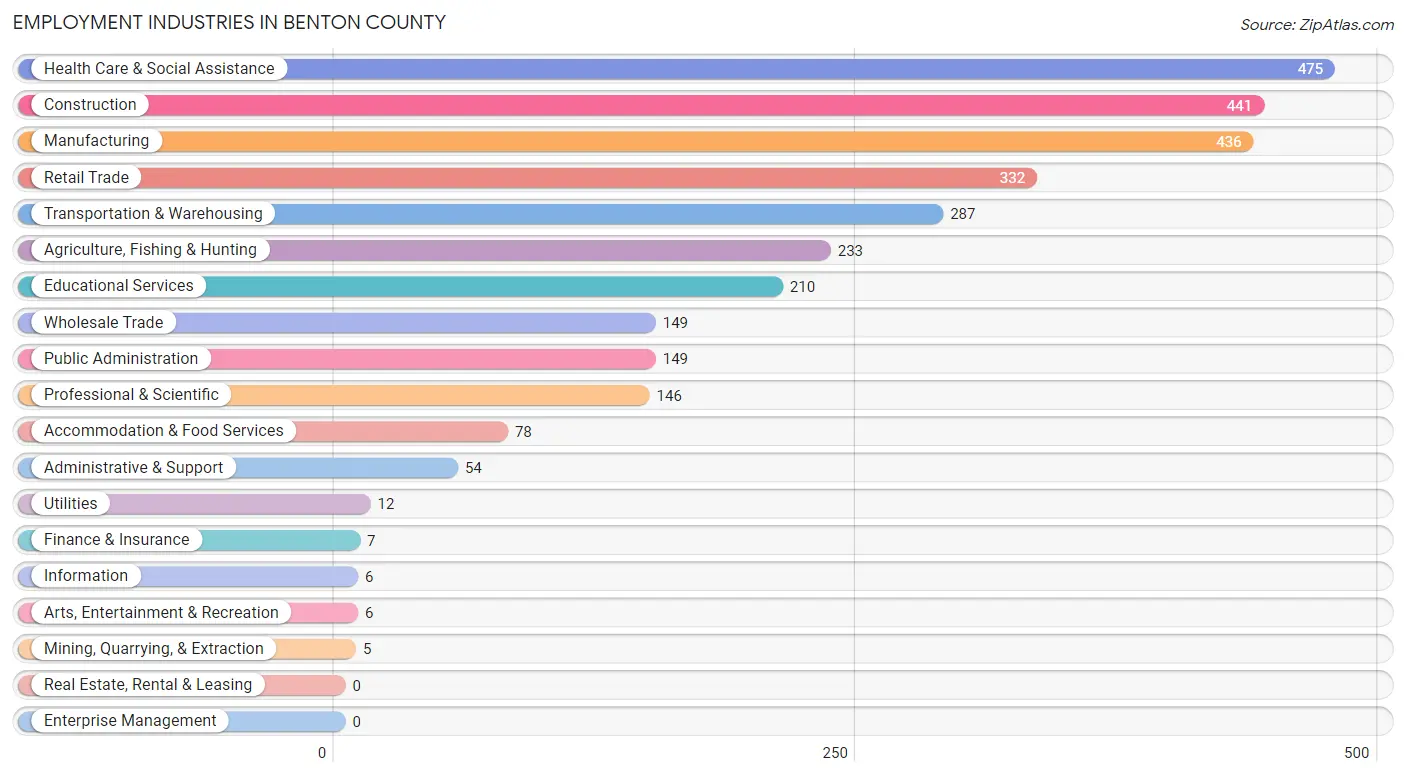
Employment Industries in Benton County
The major employment industries in Benton County include Health Care & Social Assistance (475 | 14.6%), Construction (441 | 13.6%), Manufacturing (436 | 13.4%), Retail Trade (332 | 10.2%), and Transportation & Warehousing (287 | 8.8%).
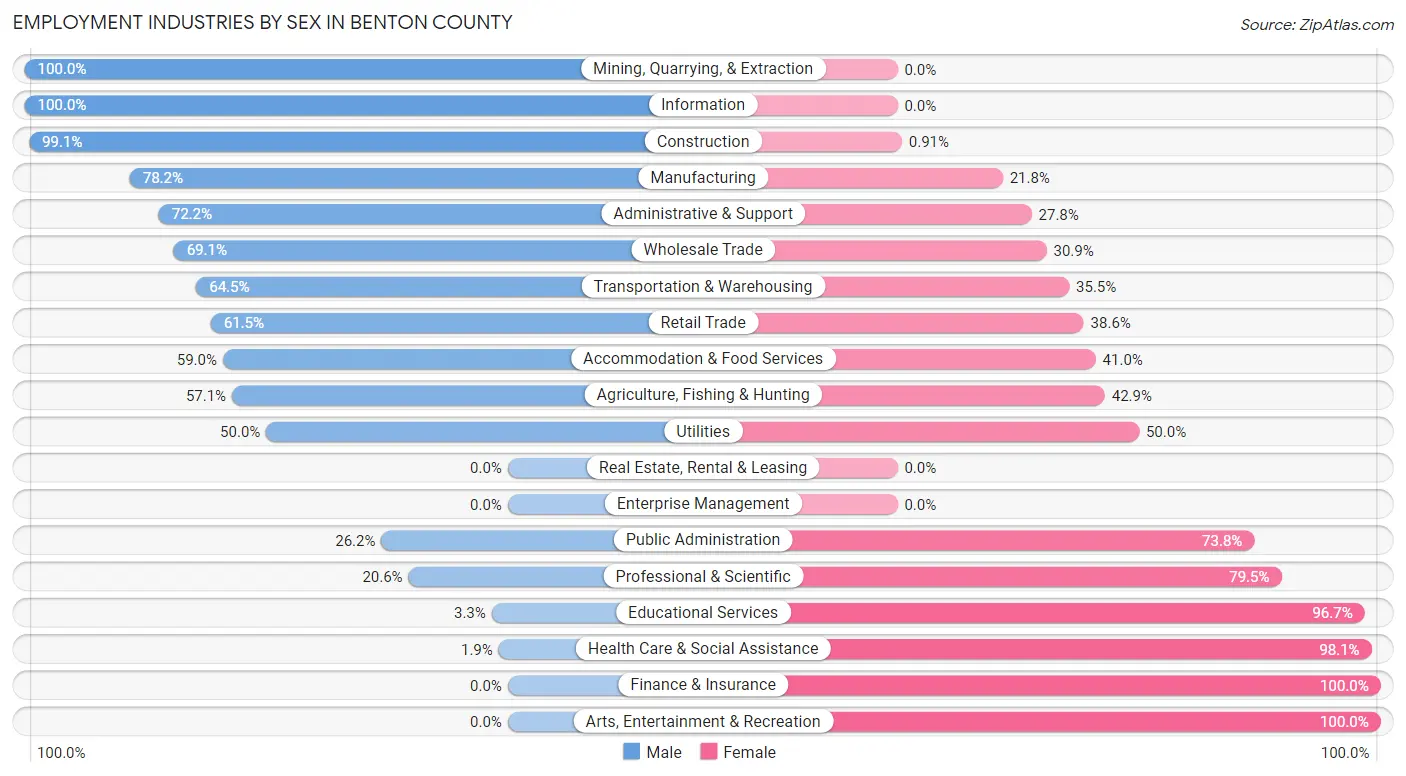
Employment Industries by Sex in Benton County
The Benton County industries that see more men than women are Mining, Quarrying, & Extraction (100.0%), Information (100.0%), and Construction (99.1%), whereas the industries that tend to have a higher number of women are Finance & Insurance (100.0%), Arts, Entertainment & Recreation (100.0%), and Health Care & Social Assistance (98.1%).
| Industry | Male | Female |
| Agriculture, Fishing & Hunting | 133 (57.1%) | 100 (42.9%) |
| Mining, Quarrying, & Extraction | 5 (100.0%) | 0 (0.0%) |
| Construction | 437 (99.1%) | 4 (0.9%) |
| Manufacturing | 341 (78.2%) | 95 (21.8%) |
| Wholesale Trade | 103 (69.1%) | 46 (30.9%) |
| Retail Trade | 204 (61.5%) | 128 (38.6%) |
| Transportation & Warehousing | 185 (64.5%) | 102 (35.5%) |
| Utilities | 6 (50.0%) | 6 (50.0%) |
| Information | 6 (100.0%) | 0 (0.0%) |
| Finance & Insurance | 0 (0.0%) | 7 (100.0%) |
| Real Estate, Rental & Leasing | 0 (0.0%) | 0 (0.0%) |
| Professional & Scientific | 30 (20.5%) | 116 (79.4%) |
| Enterprise Management | 0 (0.0%) | 0 (0.0%) |
| Administrative & Support | 39 (72.2%) | 15 (27.8%) |
| Educational Services | 7 (3.3%) | 203 (96.7%) |
| Health Care & Social Assistance | 9 (1.9%) | 466 (98.1%) |
| Arts, Entertainment & Recreation | 0 (0.0%) | 6 (100.0%) |
| Accommodation & Food Services | 46 (59.0%) | 32 (41.0%) |
| Public Administration | 39 (26.2%) | 110 (73.8%) |
| Total | 1,653 (50.8%) | 1,600 (49.2%) |
Education in Benton County
School Enrollment in Benton County
The most common levels of schooling among the 1,541 students in Benton County are elementary school (490 | 31.8%), high school (402 | 26.1%), and middle school (242 | 15.7%).
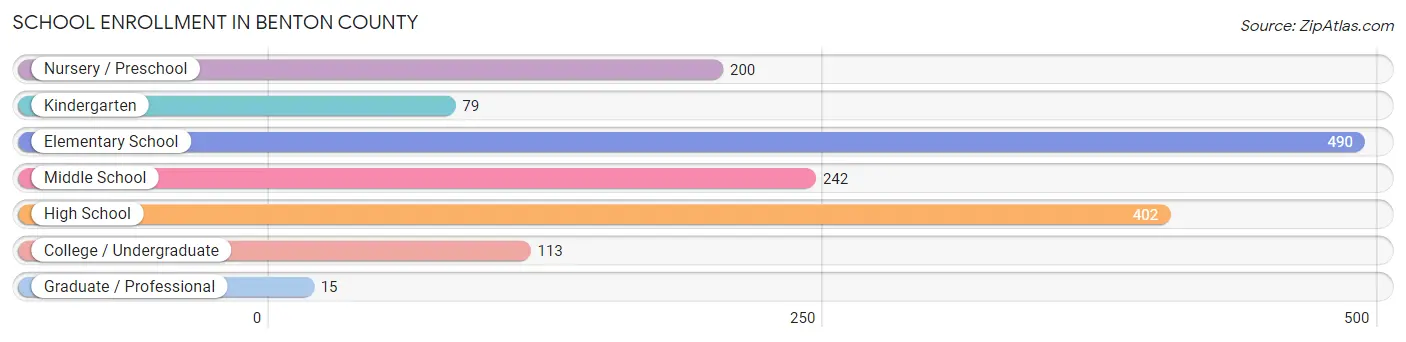
| School Level | # Students | % Students |
| Nursery / Preschool | 200 | 13.0% |
| Kindergarten | 79 | 5.1% |
| Elementary School | 490 | 31.8% |
| Middle School | 242 | 15.7% |
| High School | 402 | 26.1% |
| College / Undergraduate | 113 | 7.3% |
| Graduate / Professional | 15 | 1.0% |
| Total | 1,541 | 100.0% |
School Enrollment by Age by Funding Source in Benton County
Out of a total of 1,541 students who are enrolled in schools in Benton County, 59 (3.8%) attend a private institution, while the remaining 1,482 (96.2%) are enrolled in public schools. The age group of 25 to 34 year olds has the highest likelihood of being enrolled in private schools, with 14 (53.8% in the age bracket) enrolled. Conversely, the age group of 5 to 9 year old has the lowest likelihood of being enrolled in a private school, with 475 (100.0% in the age bracket) attending a public institution.
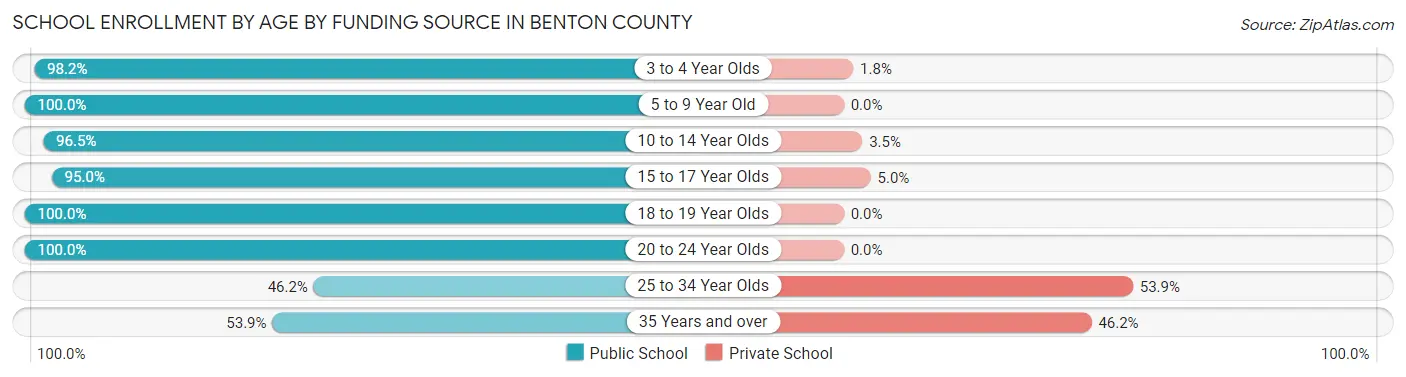
| Age Bracket | Public School | Private School |
| 3 to 4 Year Olds | 111 (98.2%) | 2 (1.8%) |
| 5 to 9 Year Old | 475 (100.0%) | 0 (0.0%) |
| 10 to 14 Year Olds | 447 (96.5%) | 16 (3.5%) |
| 15 to 17 Year Olds | 265 (95.0%) | 14 (5.0%) |
| 18 to 19 Year Olds | 94 (100.0%) | 0 (0.0%) |
| 20 to 24 Year Olds | 65 (100.0%) | 0 (0.0%) |
| 25 to 34 Year Olds | 12 (46.2%) | 14 (53.8%) |
| 35 Years and over | 14 (53.8%) | 12 (46.2%) |
| Total | 1,482 (96.2%) | 59 (3.8%) |
Educational Attainment by Field of Study in Benton County
Education (190 | 29.5%), science & technology (162 | 25.1%), business (112 | 17.4%), bio, nature & agricultural (54 | 8.4%), and engineering (45 | 7.0%) are the most common fields of study among 645 individuals in Benton County who have obtained a bachelor's degree or higher.
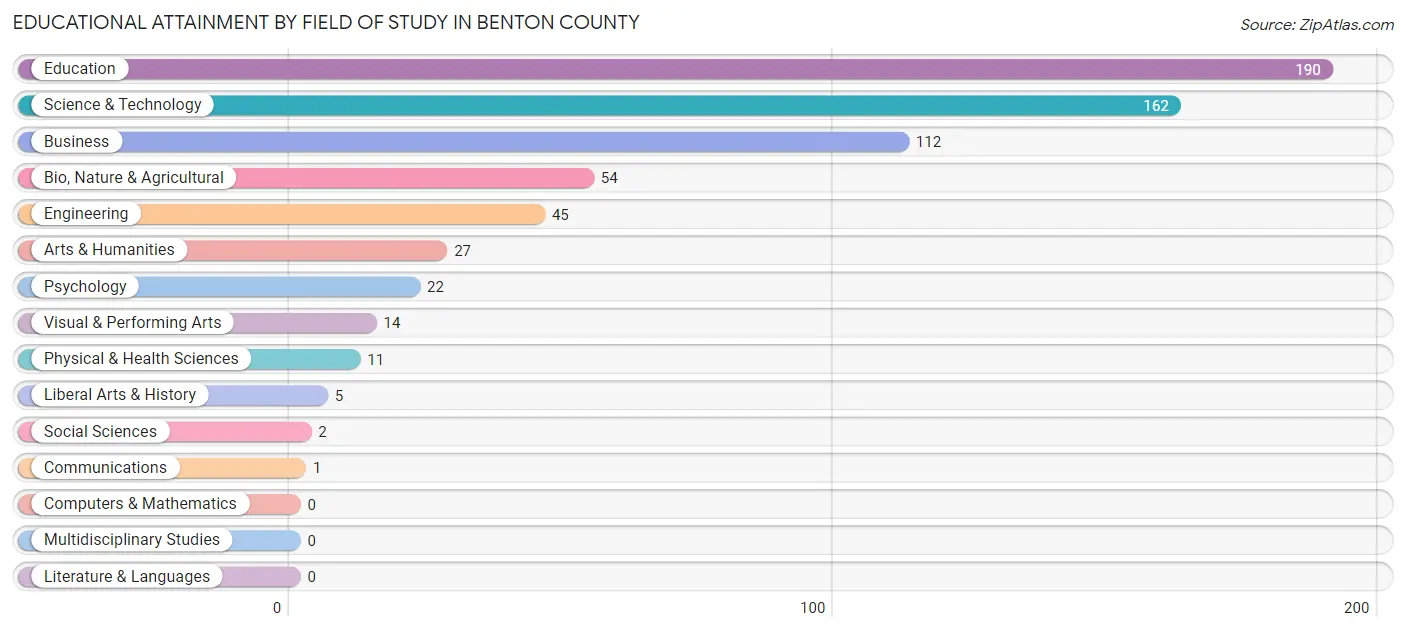
| Field of Study | # Graduates | % Graduates |
| Computers & Mathematics | 0 | 0.0% |
| Bio, Nature & Agricultural | 54 | 8.4% |
| Physical & Health Sciences | 11 | 1.7% |
| Psychology | 22 | 3.4% |
| Social Sciences | 2 | 0.3% |
| Engineering | 45 | 7.0% |
| Multidisciplinary Studies | 0 | 0.0% |
| Science & Technology | 162 | 25.1% |
| Business | 112 | 17.4% |
| Education | 190 | 29.5% |
| Literature & Languages | 0 | 0.0% |
| Liberal Arts & History | 5 | 0.8% |
| Visual & Performing Arts | 14 | 2.2% |
| Communications | 1 | 0.2% |
| Arts & Humanities | 27 | 4.2% |
| Total | 645 | 100.0% |
Transportation & Commute in Benton County
Vehicle Availability by Sex in Benton County
The most prevalent vehicle ownership categories in Benton County are males with 2 vehicles (917, accounting for 55.9%) and females with 2 vehicles (797, making up 57.8%).
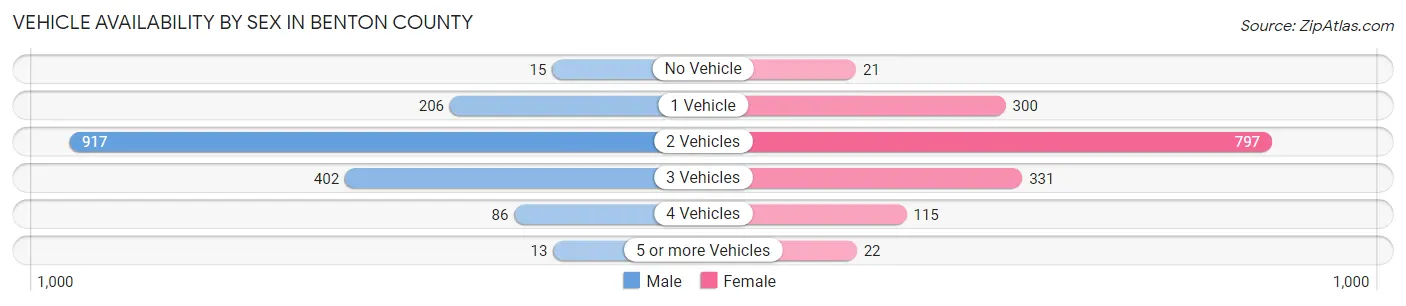
| Vehicles Available | Male | Female |
| No Vehicle | 15 (0.9%) | 21 (1.3%) |
| 1 Vehicle | 206 (12.6%) | 300 (18.9%) |
| 2 Vehicles | 917 (55.9%) | 797 (50.2%) |
| 3 Vehicles | 402 (24.5%) | 331 (20.9%) |
| 4 Vehicles | 86 (5.2%) | 115 (7.2%) |
| 5 or more Vehicles | 13 (0.8%) | 22 (1.4%) |
| Total | 1,639 (100.0%) | 1,586 (100.0%) |
Commute Time in Benton County
The most frequently occuring commute durations in Benton County are 60 to 89 minutes (550 commuters, 17.4%), 30 to 34 minutes (476 commuters, 15.0%), and 15 to 19 minutes (390 commuters, 12.3%).
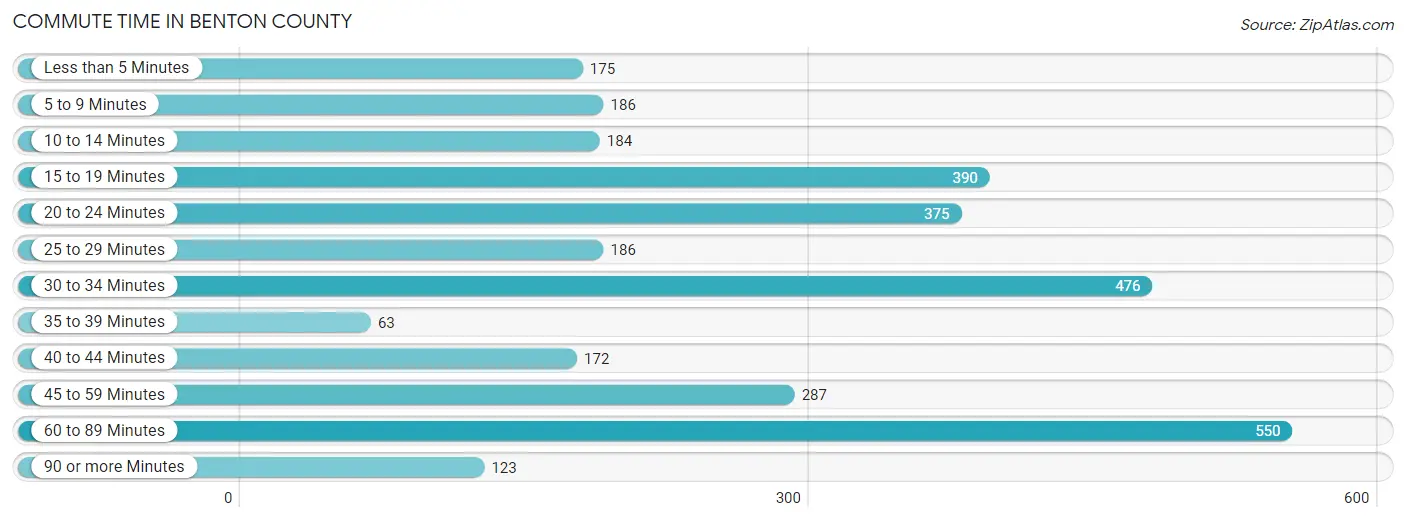
| Commute Time | # Commuters | % Commuters |
| Less than 5 Minutes | 175 | 5.5% |
| 5 to 9 Minutes | 186 | 5.9% |
| 10 to 14 Minutes | 184 | 5.8% |
| 15 to 19 Minutes | 390 | 12.3% |
| 20 to 24 Minutes | 375 | 11.8% |
| 25 to 29 Minutes | 186 | 5.9% |
| 30 to 34 Minutes | 476 | 15.0% |
| 35 to 39 Minutes | 63 | 2.0% |
| 40 to 44 Minutes | 172 | 5.4% |
| 45 to 59 Minutes | 287 | 9.1% |
| 60 to 89 Minutes | 550 | 17.4% |
| 90 or more Minutes | 123 | 3.9% |
Commute Time by Sex in Benton County
The most common commute times in Benton County are 60 to 89 minutes (488 commuters, 30.4%) for males and 30 to 34 minutes (385 commuters, 24.6%) for females.
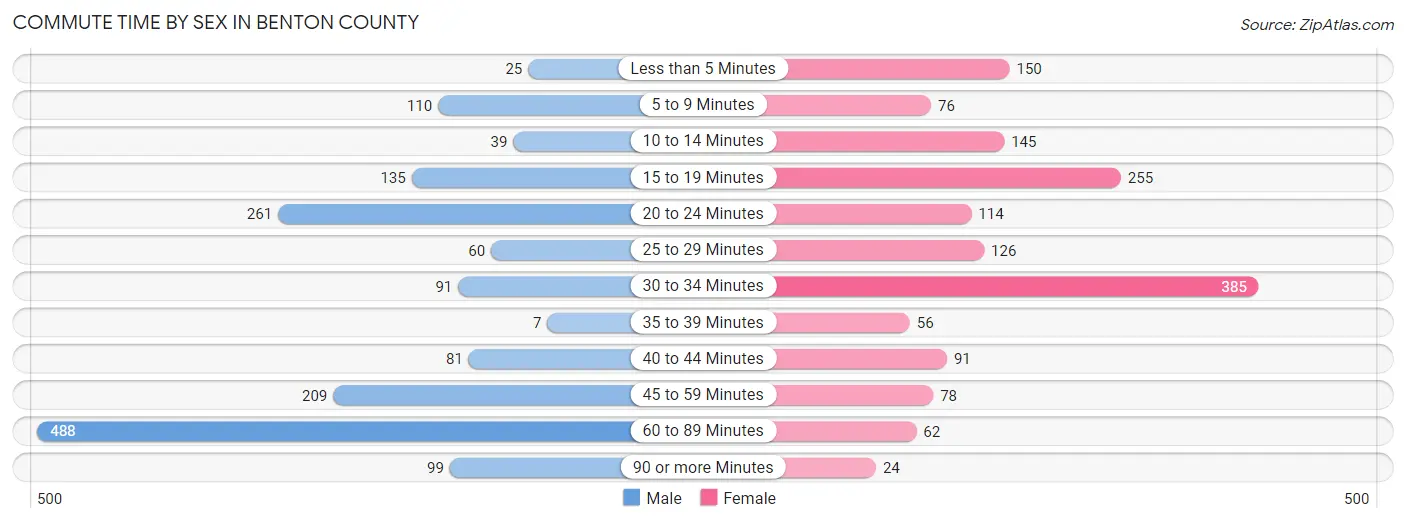
| Commute Time | Male | Female |
| Less than 5 Minutes | 25 (1.6%) | 150 (9.6%) |
| 5 to 9 Minutes | 110 (6.9%) | 76 (4.9%) |
| 10 to 14 Minutes | 39 (2.4%) | 145 (9.3%) |
| 15 to 19 Minutes | 135 (8.4%) | 255 (16.3%) |
| 20 to 24 Minutes | 261 (16.3%) | 114 (7.3%) |
| 25 to 29 Minutes | 60 (3.7%) | 126 (8.1%) |
| 30 to 34 Minutes | 91 (5.7%) | 385 (24.6%) |
| 35 to 39 Minutes | 7 (0.4%) | 56 (3.6%) |
| 40 to 44 Minutes | 81 (5.1%) | 91 (5.8%) |
| 45 to 59 Minutes | 209 (13.0%) | 78 (5.0%) |
| 60 to 89 Minutes | 488 (30.4%) | 62 (4.0%) |
| 90 or more Minutes | 99 (6.2%) | 24 (1.5%) |
Time of Departure to Work by Sex in Benton County
The most frequent times of departure to work in Benton County are 7:30 AM to 7:59 AM (316, 19.7%) for males and 6:00 AM to 6:29 AM (449, 28.7%) for females.
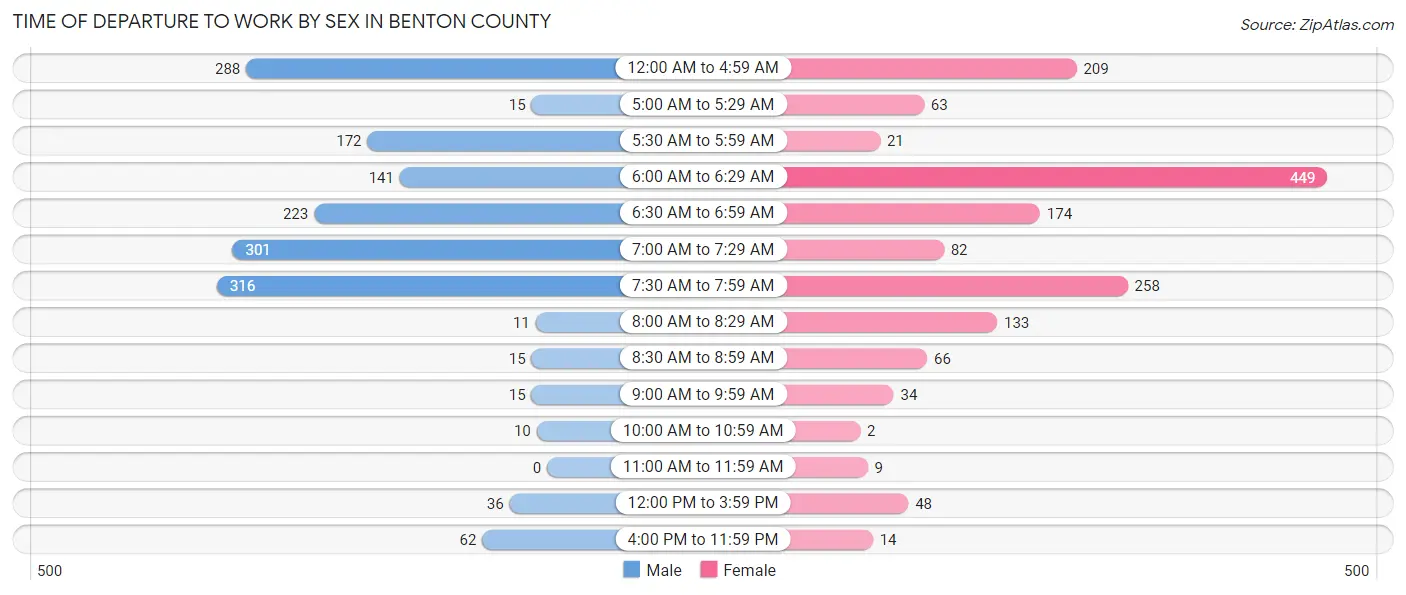
| Time of Departure | Male | Female |
| 12:00 AM to 4:59 AM | 288 (17.9%) | 209 (13.4%) |
| 5:00 AM to 5:29 AM | 15 (0.9%) | 63 (4.0%) |
| 5:30 AM to 5:59 AM | 172 (10.7%) | 21 (1.3%) |
| 6:00 AM to 6:29 AM | 141 (8.8%) | 449 (28.7%) |
| 6:30 AM to 6:59 AM | 223 (13.9%) | 174 (11.1%) |
| 7:00 AM to 7:29 AM | 301 (18.8%) | 82 (5.2%) |
| 7:30 AM to 7:59 AM | 316 (19.7%) | 258 (16.5%) |
| 8:00 AM to 8:29 AM | 11 (0.7%) | 133 (8.5%) |
| 8:30 AM to 8:59 AM | 15 (0.9%) | 66 (4.2%) |
| 9:00 AM to 9:59 AM | 15 (0.9%) | 34 (2.2%) |
| 10:00 AM to 10:59 AM | 10 (0.6%) | 2 (0.1%) |
| 11:00 AM to 11:59 AM | 0 (0.0%) | 9 (0.6%) |
| 12:00 PM to 3:59 PM | 36 (2.2%) | 48 (3.1%) |
| 4:00 PM to 11:59 PM | 62 (3.9%) | 14 (0.9%) |
| Total | 1,605 (100.0%) | 1,562 (100.0%) |
Housing Occupancy in Benton County
Occupancy by Ownership in Benton County
Of the total 3,086 dwellings in Benton County, owner-occupied units account for 2,499 (81.0%), while renter-occupied units make up 587 (19.0%).
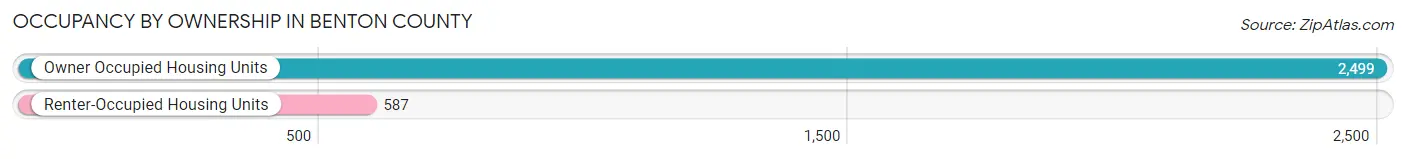
| Occupancy | # Housing Units | % Housing Units |
| Owner Occupied Housing Units | 2,499 | 81.0% |
| Renter-Occupied Housing Units | 587 | 19.0% |
| Total Occupied Housing Units | 3,086 | 100.0% |
Occupancy by Household Size in Benton County
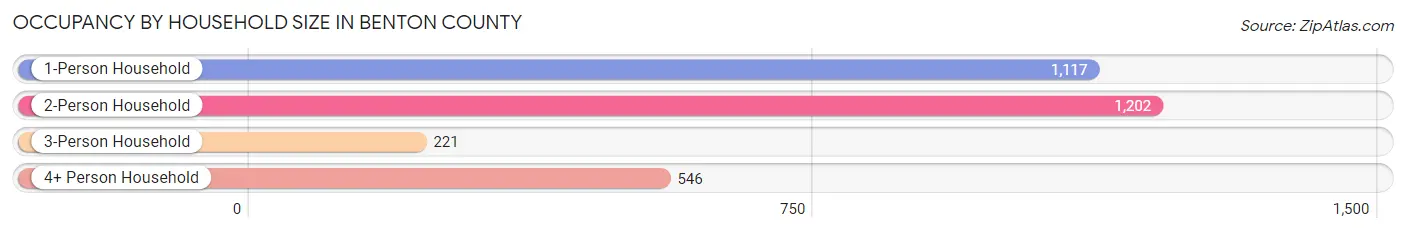
| Household Size | # Housing Units | % Housing Units |
| 1-Person Household | 1,117 | 36.2% |
| 2-Person Household | 1,202 | 39.0% |
| 3-Person Household | 221 | 7.2% |
| 4+ Person Household | 546 | 17.7% |
| Total Housing Units | 3,086 | 100.0% |
Occupancy by Ownership by Household Size in Benton County
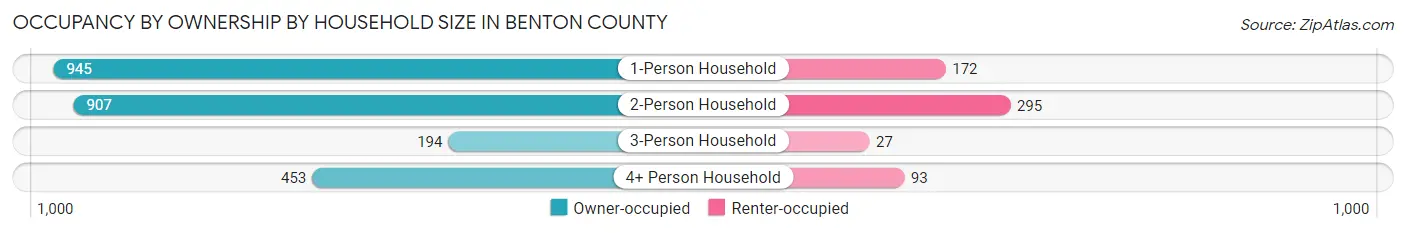
| Household Size | Owner-occupied | Renter-occupied |
| 1-Person Household | 945 (84.6%) | 172 (15.4%) |
| 2-Person Household | 907 (75.5%) | 295 (24.5%) |
| 3-Person Household | 194 (87.8%) | 27 (12.2%) |
| 4+ Person Household | 453 (83.0%) | 93 (17.0%) |
| Total Housing Units | 2,499 (81.0%) | 587 (19.0%) |
Occupancy by Educational Attainment in Benton County
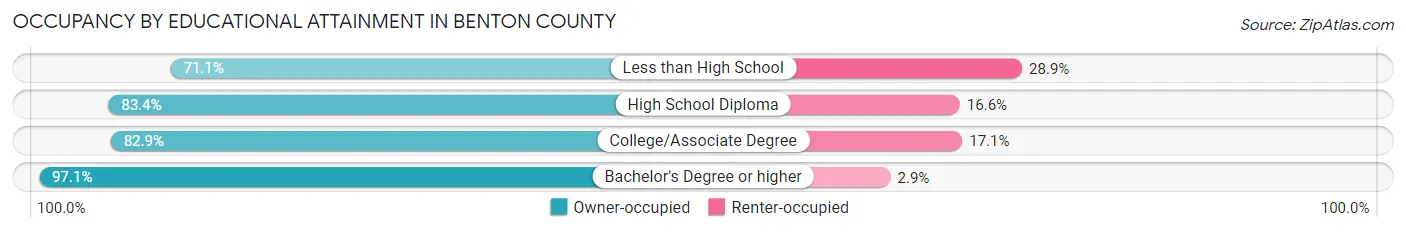
| Household Size | Owner-occupied | Renter-occupied |
| Less than High School | 626 (71.1%) | 255 (28.9%) |
| High School Diploma | 824 (83.4%) | 164 (16.6%) |
| College/Associate Degree | 777 (82.9%) | 160 (17.1%) |
| Bachelor's Degree or higher | 272 (97.1%) | 8 (2.9%) |
Occupancy by Age of Householder in Benton County
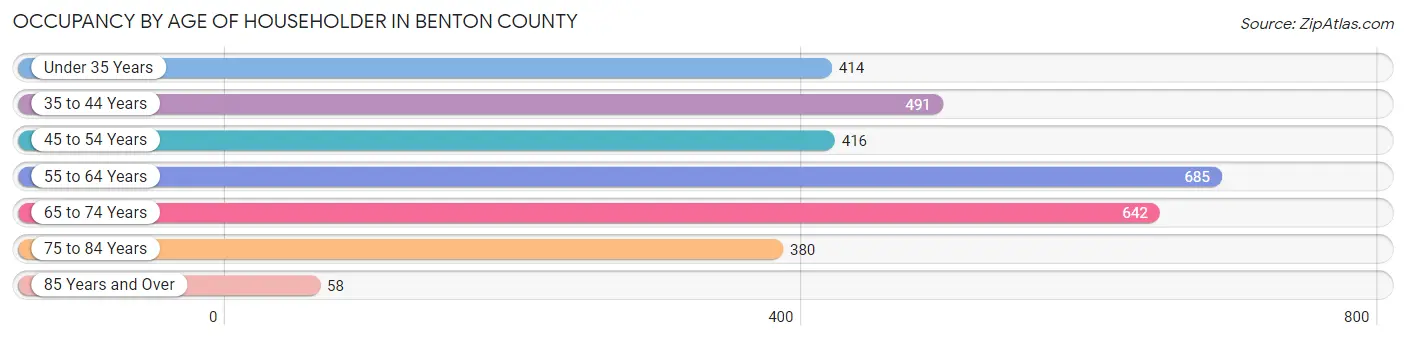
| Age Bracket | # Households | % Households |
| Under 35 Years | 414 | 13.4% |
| 35 to 44 Years | 491 | 15.9% |
| 45 to 54 Years | 416 | 13.5% |
| 55 to 64 Years | 685 | 22.2% |
| 65 to 74 Years | 642 | 20.8% |
| 75 to 84 Years | 380 | 12.3% |
| 85 Years and Over | 58 | 1.9% |
| Total | 3,086 | 100.0% |
Housing Finances in Benton County
Median Income by Occupancy in Benton County
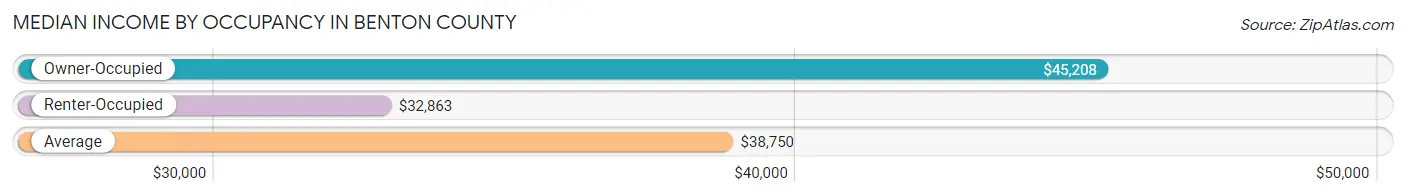
| Occupancy Type | # Households | Median Income |
| Owner-Occupied | 2,499 (81.0%) | $45,208 |
| Renter-Occupied | 587 (19.0%) | $32,863 |
| Average | 3,086 (100.0%) | $38,750 |
Occupancy by Householder Income Bracket in Benton County
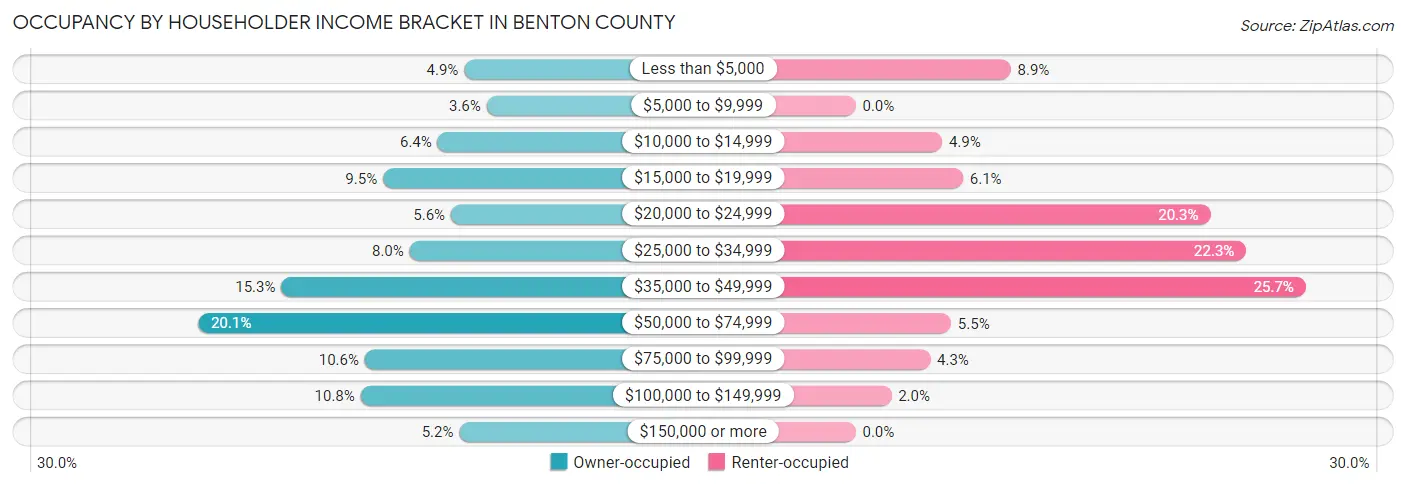
| Income Bracket | Owner-occupied | Renter-occupied |
| Less than $5,000 | 122 (4.9%) | 52 (8.9%) |
| $5,000 to $9,999 | 90 (3.6%) | 0 (0.0%) |
| $10,000 to $14,999 | 160 (6.4%) | 29 (4.9%) |
| $15,000 to $19,999 | 238 (9.5%) | 36 (6.1%) |
| $20,000 to $24,999 | 141 (5.6%) | 119 (20.3%) |
| $25,000 to $34,999 | 200 (8.0%) | 131 (22.3%) |
| $35,000 to $49,999 | 383 (15.3%) | 151 (25.7%) |
| $50,000 to $74,999 | 502 (20.1%) | 32 (5.4%) |
| $75,000 to $99,999 | 264 (10.6%) | 25 (4.3%) |
| $100,000 to $149,999 | 270 (10.8%) | 12 (2.0%) |
| $150,000 or more | 129 (5.2%) | 0 (0.0%) |
| Total | 2,499 (100.0%) | 587 (100.0%) |
Monthly Housing Cost Tiers in Benton County
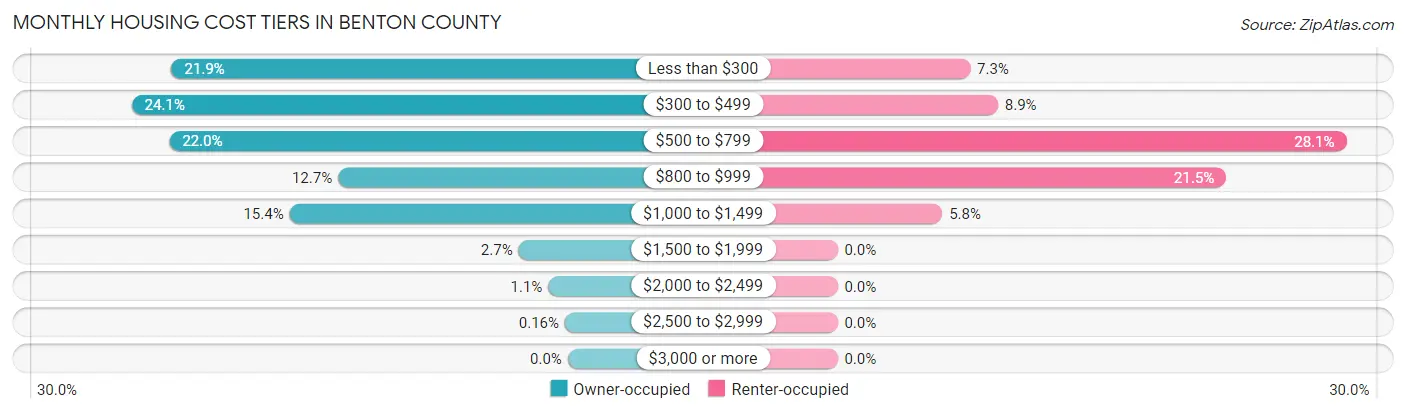
| Monthly Cost | Owner-occupied | Renter-occupied |
| Less than $300 | 547 (21.9%) | 43 (7.3%) |
| $300 to $499 | 602 (24.1%) | 52 (8.9%) |
| $500 to $799 | 550 (22.0%) | 165 (28.1%) |
| $800 to $999 | 317 (12.7%) | 126 (21.5%) |
| $1,000 to $1,499 | 384 (15.4%) | 34 (5.8%) |
| $1,500 to $1,999 | 68 (2.7%) | 0 (0.0%) |
| $2,000 to $2,499 | 27 (1.1%) | 0 (0.0%) |
| $2,500 to $2,999 | 4 (0.2%) | 0 (0.0%) |
| $3,000 or more | 0 (0.0%) | 0 (0.0%) |
| Total | 2,499 (100.0%) | 587 (100.0%) |
Physical Housing Characteristics in Benton County
Housing Structures in Benton County
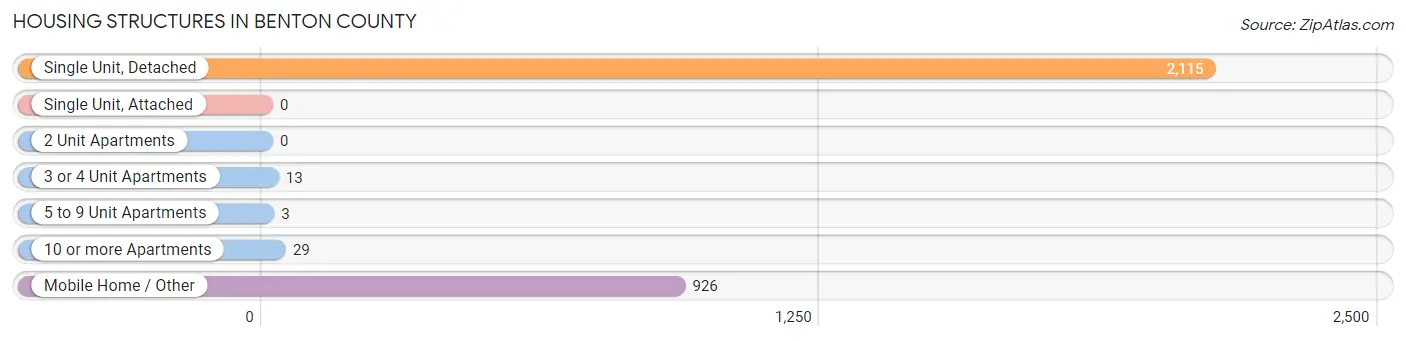
| Structure Type | # Housing Units | % Housing Units |
| Single Unit, Detached | 2,115 | 68.5% |
| Single Unit, Attached | 0 | 0.0% |
| 2 Unit Apartments | 0 | 0.0% |
| 3 or 4 Unit Apartments | 13 | 0.4% |
| 5 to 9 Unit Apartments | 3 | 0.1% |
| 10 or more Apartments | 29 | 0.9% |
| Mobile Home / Other | 926 | 30.0% |
| Total | 3,086 | 100.0% |
Housing Structures by Occupancy in Benton County
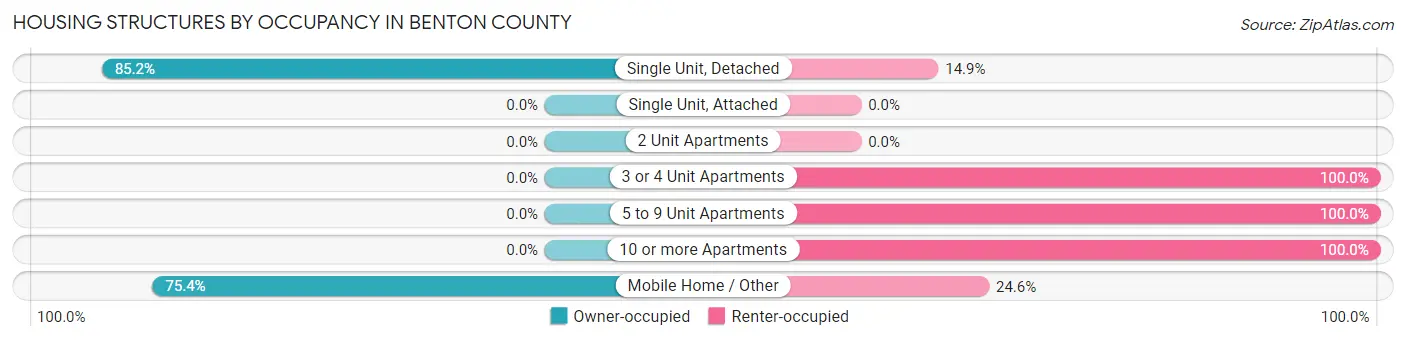
| Structure Type | Owner-occupied | Renter-occupied |
| Single Unit, Detached | 1,801 (85.2%) | 314 (14.8%) |
| Single Unit, Attached | 0 (0.0%) | 0 (0.0%) |
| 2 Unit Apartments | 0 (0.0%) | 0 (0.0%) |
| 3 or 4 Unit Apartments | 0 (0.0%) | 13 (100.0%) |
| 5 to 9 Unit Apartments | 0 (0.0%) | 3 (100.0%) |
| 10 or more Apartments | 0 (0.0%) | 29 (100.0%) |
| Mobile Home / Other | 698 (75.4%) | 228 (24.6%) |
| Total | 2,499 (81.0%) | 587 (19.0%) |
Housing Structures by Number of Rooms in Benton County
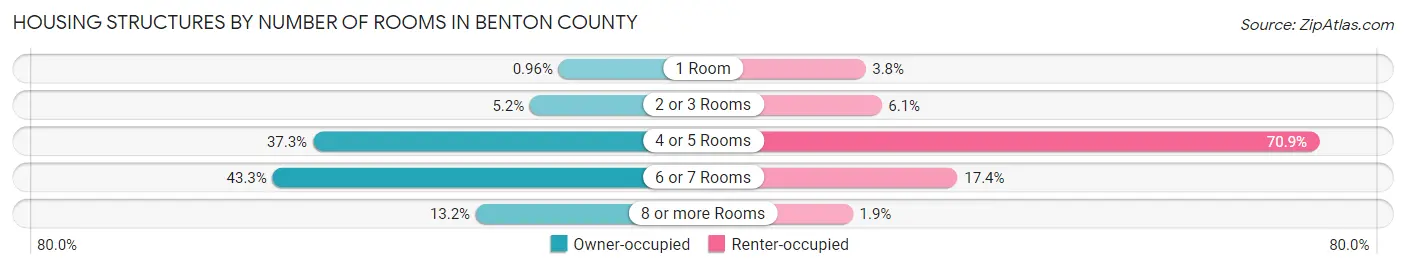
| Number of Rooms | Owner-occupied | Renter-occupied |
| 1 Room | 24 (1.0%) | 22 (3.7%) |
| 2 or 3 Rooms | 130 (5.2%) | 36 (6.1%) |
| 4 or 5 Rooms | 933 (37.3%) | 416 (70.9%) |
| 6 or 7 Rooms | 1,082 (43.3%) | 102 (17.4%) |
| 8 or more Rooms | 330 (13.2%) | 11 (1.9%) |
| Total | 2,499 (100.0%) | 587 (100.0%) |
Housing Structure by Heating Type in Benton County
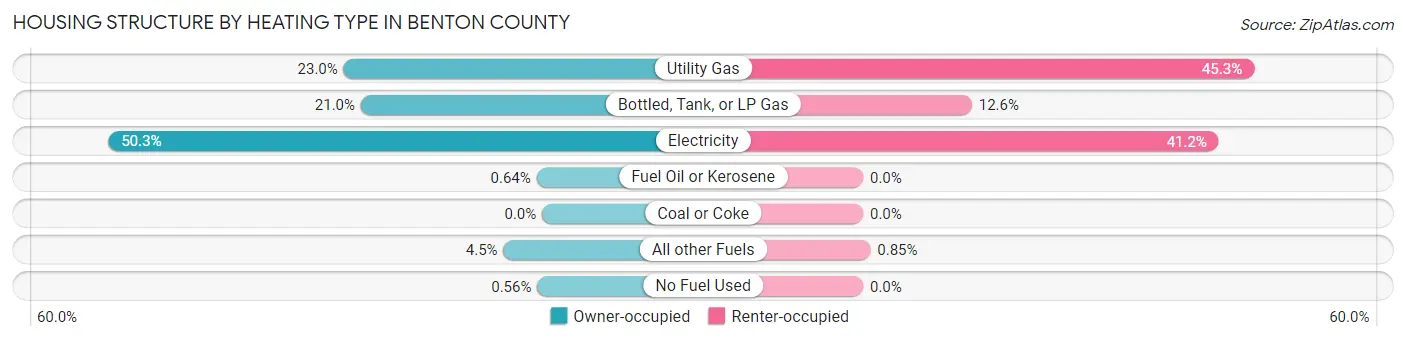
| Heating Type | Owner-occupied | Renter-occupied |
| Utility Gas | 575 (23.0%) | 266 (45.3%) |
| Bottled, Tank, or LP Gas | 525 (21.0%) | 74 (12.6%) |
| Electricity | 1,257 (50.3%) | 242 (41.2%) |
| Fuel Oil or Kerosene | 16 (0.6%) | 0 (0.0%) |
| Coal or Coke | 0 (0.0%) | 0 (0.0%) |
| All other Fuels | 112 (4.5%) | 5 (0.9%) |
| No Fuel Used | 14 (0.6%) | 0 (0.0%) |
| Total | 2,499 (100.0%) | 587 (100.0%) |
Household Vehicle Usage in Benton County
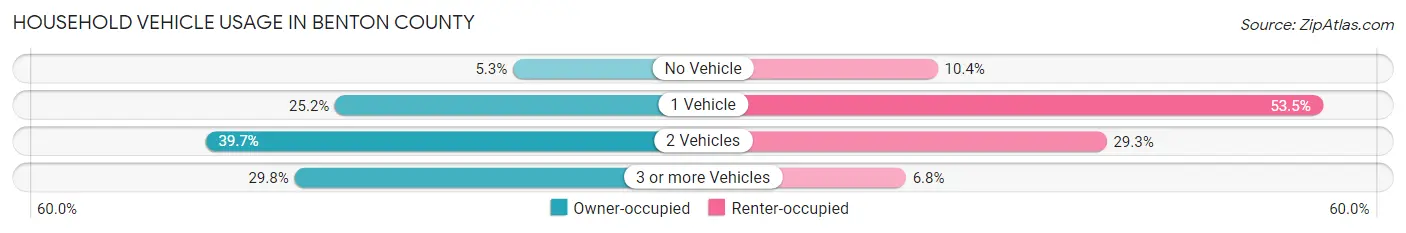
| Vehicles per Household | Owner-occupied | Renter-occupied |
| No Vehicle | 132 (5.3%) | 61 (10.4%) |
| 1 Vehicle | 630 (25.2%) | 314 (53.5%) |
| 2 Vehicles | 993 (39.7%) | 172 (29.3%) |
| 3 or more Vehicles | 744 (29.8%) | 40 (6.8%) |
| Total | 2,499 (100.0%) | 587 (100.0%) |
Real Estate & Mortgages in Benton County
Real Estate and Mortgage Overview in Benton County
| Characteristic | Without Mortgage | With Mortgage |
| Housing Units | 1,527 | 972 |
| Median Property Value | $96,900 | $95,900 |
| Median Household Income | $35,036 | $52 |
| Monthly Housing Costs | $373 | $0 |
| Real Estate Taxes | $747 | $226 |
Property Value by Mortgage Status in Benton County
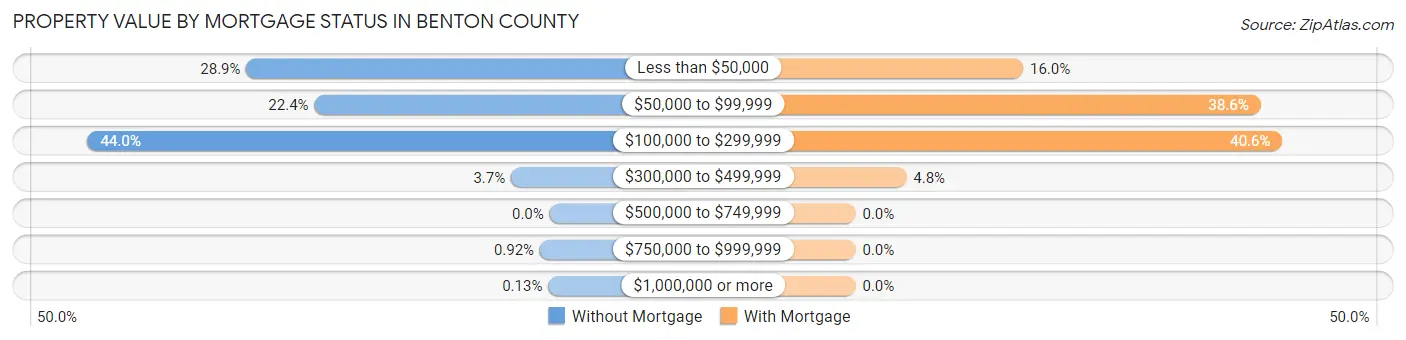
| Property Value | Without Mortgage | With Mortgage |
| Less than $50,000 | 441 (28.9%) | 155 (16.0%) |
| $50,000 to $99,999 | 342 (22.4%) | 375 (38.6%) |
| $100,000 to $299,999 | 672 (44.0%) | 395 (40.6%) |
| $300,000 to $499,999 | 56 (3.7%) | 47 (4.8%) |
| $500,000 to $749,999 | 0 (0.0%) | 0 (0.0%) |
| $750,000 to $999,999 | 14 (0.9%) | 0 (0.0%) |
| $1,000,000 or more | 2 (0.1%) | 0 (0.0%) |
| Total | 1,527 (100.0%) | 972 (100.0%) |
Household Income by Mortgage Status in Benton County
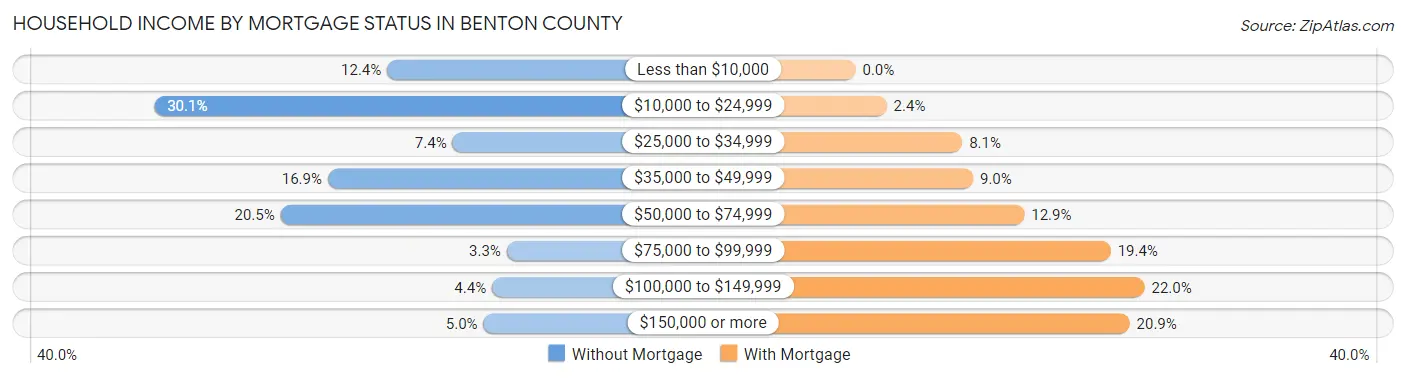
| Household Income | Without Mortgage | With Mortgage |
| Less than $10,000 | 189 (12.4%) | 0 (0.0%) |
| $10,000 to $24,999 | 460 (30.1%) | 23 (2.4%) |
| $25,000 to $34,999 | 113 (7.4%) | 79 (8.1%) |
| $35,000 to $49,999 | 258 (16.9%) | 87 (8.9%) |
| $50,000 to $74,999 | 313 (20.5%) | 125 (12.9%) |
| $75,000 to $99,999 | 50 (3.3%) | 189 (19.4%) |
| $100,000 to $149,999 | 67 (4.4%) | 214 (22.0%) |
| $150,000 or more | 77 (5.0%) | 203 (20.9%) |
| Total | 1,527 (100.0%) | 972 (100.0%) |
Property Value to Household Income Ratio in Benton County
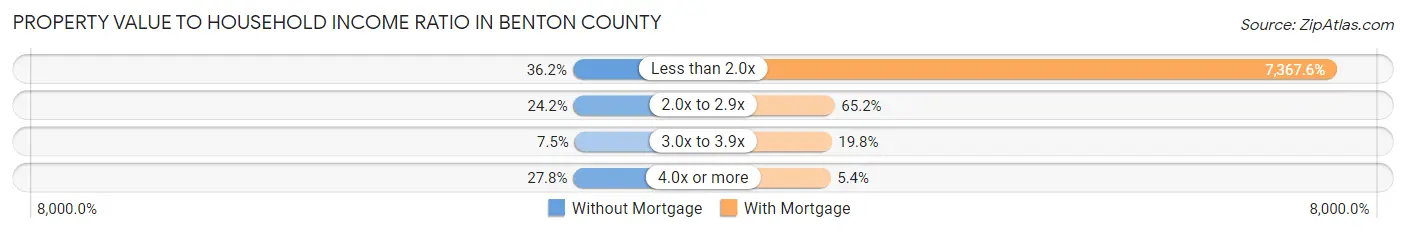
| Value-to-Income Ratio | Without Mortgage | With Mortgage |
| Less than 2.0x | 552 (36.1%) | 71,613 (7,367.6%) |
| 2.0x to 2.9x | 370 (24.2%) | 634 (65.2%) |
| 3.0x to 3.9x | 115 (7.5%) | 192 (19.8%) |
| 4.0x or more | 424 (27.8%) | 52 (5.3%) |
| Total | 1,527 (100.0%) | 972 (100.0%) |
Real Estate Taxes by Mortgage Status in Benton County
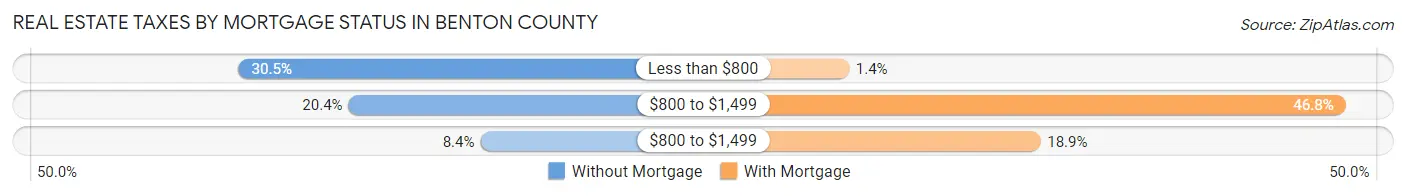
| Property Taxes | Without Mortgage | With Mortgage |
| Less than $800 | 465 (30.4%) | 14 (1.4%) |
| $800 to $1,499 | 312 (20.4%) | 455 (46.8%) |
| $800 to $1,499 | 128 (8.4%) | 184 (18.9%) |
| Total | 1,527 (100.0%) | 972 (100.0%) |
Health & Disability in Benton County
Health Insurance Coverage by Age in Benton County
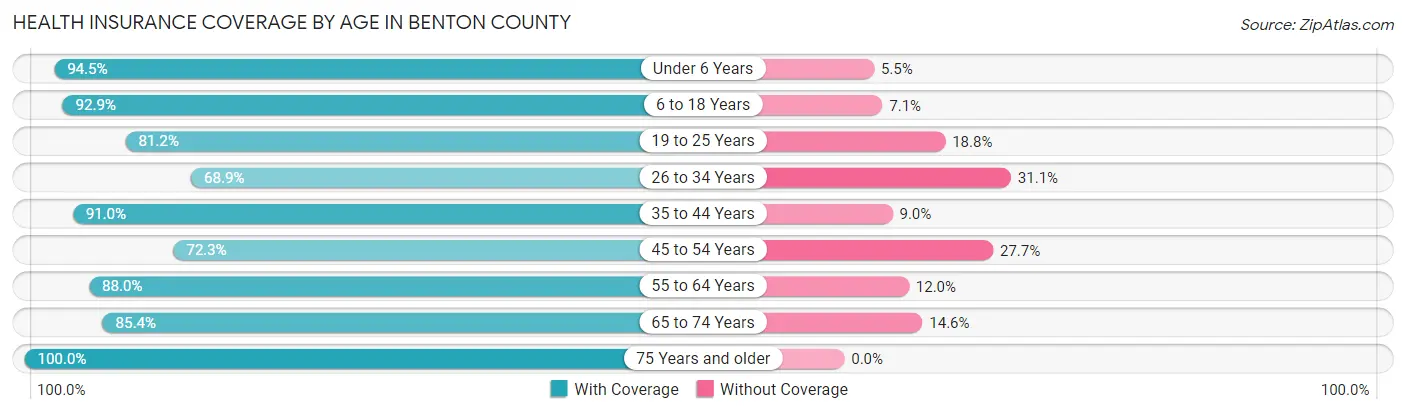
| Age Bracket | With Coverage | Without Coverage |
| Under 6 Years | 410 (94.5%) | 24 (5.5%) |
| 6 to 18 Years | 1,151 (92.9%) | 88 (7.1%) |
| 19 to 25 Years | 496 (81.2%) | 115 (18.8%) |
| 26 to 34 Years | 417 (68.9%) | 188 (31.1%) |
| 35 to 44 Years | 1,023 (91.0%) | 101 (9.0%) |
| 45 to 54 Years | 646 (72.3%) | 248 (27.7%) |
| 55 to 64 Years | 972 (88.0%) | 133 (12.0%) |
| 65 to 74 Years | 851 (85.4%) | 145 (14.6%) |
| 75 Years and older | 530 (100.0%) | 0 (0.0%) |
| Total | 6,496 (86.2%) | 1,042 (13.8%) |
Health Insurance Coverage by Citizenship Status in Benton County
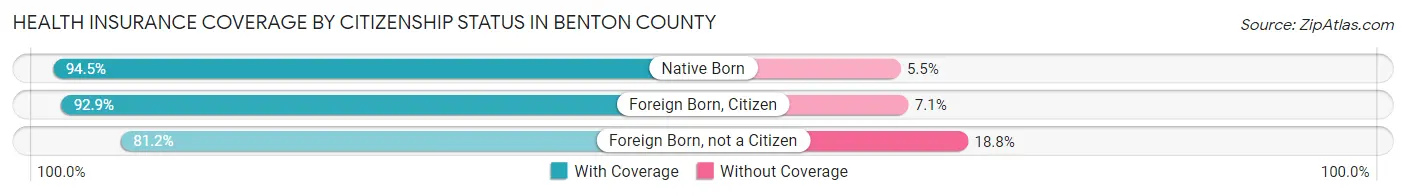
| Citizenship Status | With Coverage | Without Coverage |
| Native Born | 410 (94.5%) | 24 (5.5%) |
| Foreign Born, Citizen | 1,151 (92.9%) | 88 (7.1%) |
| Foreign Born, not a Citizen | 496 (81.2%) | 115 (18.8%) |
Health Insurance Coverage by Household Income in Benton County
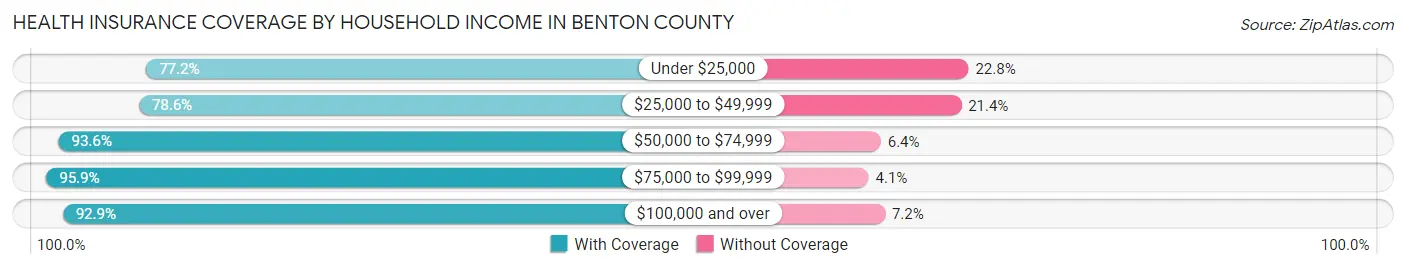
| Household Income | With Coverage | Without Coverage |
| Under $25,000 | 1,327 (77.2%) | 392 (22.8%) |
| $25,000 to $49,999 | 1,569 (78.6%) | 428 (21.4%) |
| $50,000 to $74,999 | 1,088 (93.6%) | 74 (6.4%) |
| $75,000 to $99,999 | 1,317 (95.9%) | 56 (4.1%) |
| $100,000 and over | 1,195 (92.8%) | 92 (7.1%) |
Public vs Private Health Insurance Coverage by Age in Benton County
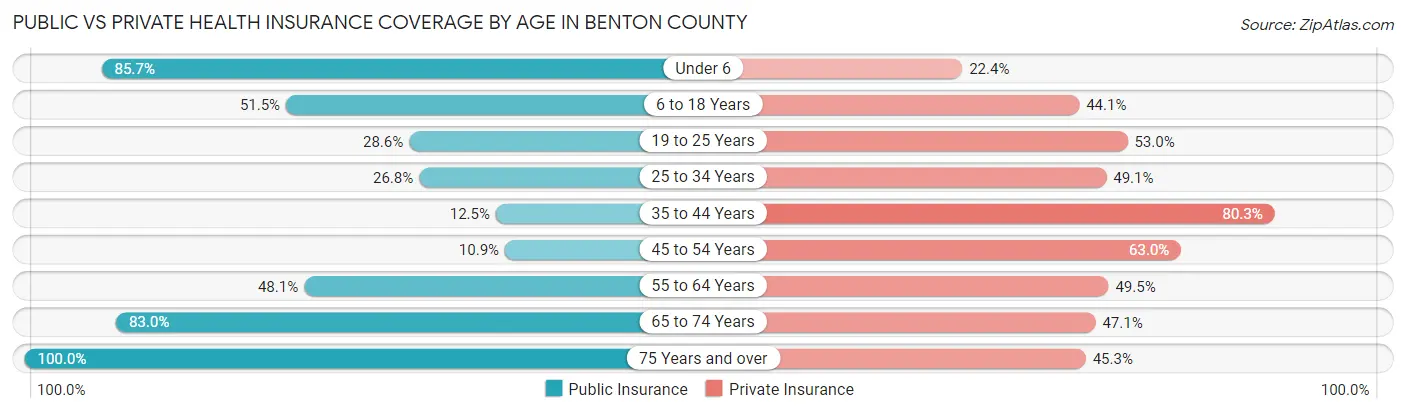
| Age Bracket | Public Insurance | Private Insurance |
| Under 6 | 372 (85.7%) | 97 (22.4%) |
| 6 to 18 Years | 638 (51.5%) | 546 (44.1%) |
| 19 to 25 Years | 175 (28.6%) | 324 (53.0%) |
| 25 to 34 Years | 162 (26.8%) | 297 (49.1%) |
| 35 to 44 Years | 141 (12.5%) | 903 (80.3%) |
| 45 to 54 Years | 97 (10.8%) | 563 (63.0%) |
| 55 to 64 Years | 532 (48.1%) | 547 (49.5%) |
| 65 to 74 Years | 827 (83.0%) | 469 (47.1%) |
| 75 Years and over | 530 (100.0%) | 240 (45.3%) |
| Total | 3,474 (46.1%) | 3,986 (52.9%) |
Disability Status by Sex by Age in Benton County
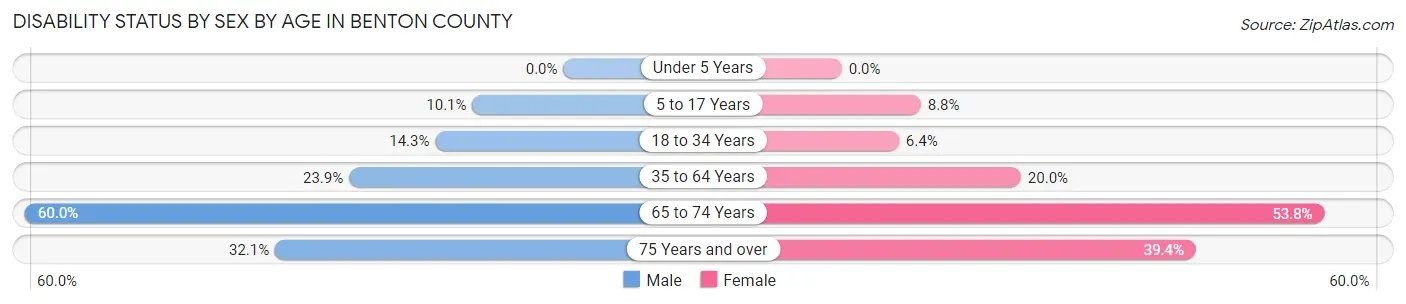
| Age Bracket | Male | Female |
| Under 5 Years | 0 (0.0%) | 0 (0.0%) |
| 5 to 17 Years | 64 (10.1%) | 57 (8.8%) |
| 18 to 34 Years | 80 (14.3%) | 46 (6.4%) |
| 35 to 64 Years | 396 (23.9%) | 292 (20.0%) |
| 65 to 74 Years | 277 (60.0%) | 287 (53.7%) |
| 75 Years and over | 70 (32.1%) | 123 (39.4%) |
Disability Class by Sex by Age in Benton County
Disability Class: Hearing Difficulty
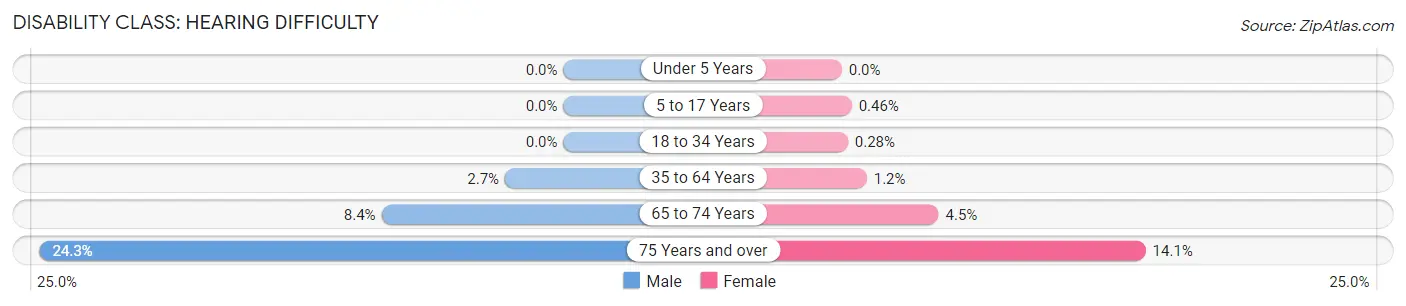
| Age Bracket | Male | Female |
| Under 5 Years | 0 (0.0%) | 0 (0.0%) |
| 5 to 17 Years | 0 (0.0%) | 3 (0.5%) |
| 18 to 34 Years | 0 (0.0%) | 2 (0.3%) |
| 35 to 64 Years | 45 (2.7%) | 17 (1.2%) |
| 65 to 74 Years | 39 (8.4%) | 24 (4.5%) |
| 75 Years and over | 53 (24.3%) | 44 (14.1%) |
Disability Class: Vision Difficulty
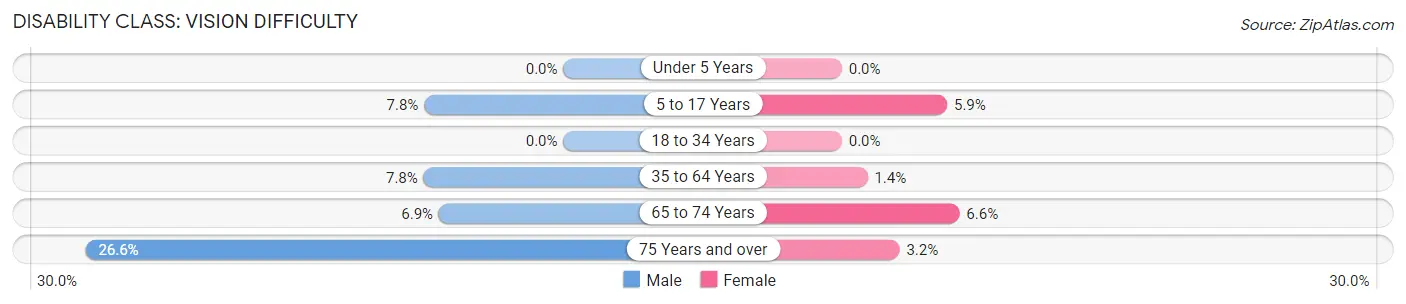
| Age Bracket | Male | Female |
| Under 5 Years | 0 (0.0%) | 0 (0.0%) |
| 5 to 17 Years | 49 (7.7%) | 38 (5.9%) |
| 18 to 34 Years | 0 (0.0%) | 0 (0.0%) |
| 35 to 64 Years | 129 (7.8%) | 21 (1.4%) |
| 65 to 74 Years | 32 (6.9%) | 35 (6.6%) |
| 75 Years and over | 58 (26.6%) | 10 (3.2%) |
Disability Class: Cognitive Difficulty
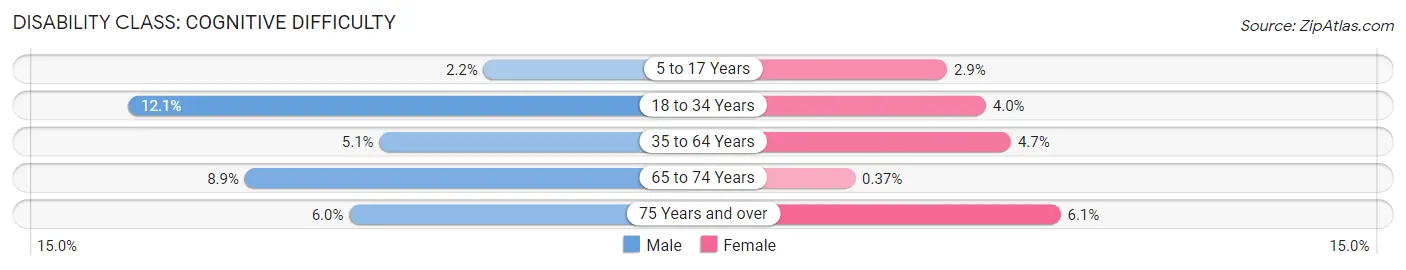
| Age Bracket | Male | Female |
| 5 to 17 Years | 14 (2.2%) | 19 (2.9%) |
| 18 to 34 Years | 68 (12.1%) | 29 (4.0%) |
| 35 to 64 Years | 85 (5.1%) | 69 (4.7%) |
| 65 to 74 Years | 41 (8.9%) | 2 (0.4%) |
| 75 Years and over | 13 (6.0%) | 19 (6.1%) |
Disability Class: Ambulatory Difficulty
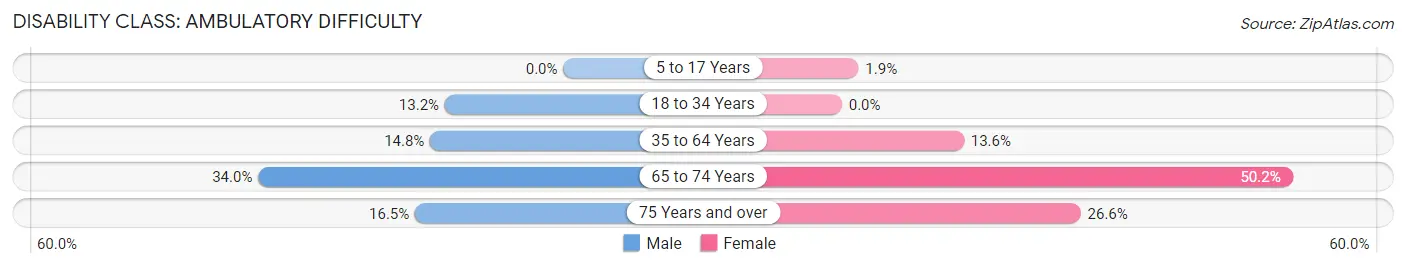
| Age Bracket | Male | Female |
| 5 to 17 Years | 0 (0.0%) | 12 (1.8%) |
| 18 to 34 Years | 74 (13.2%) | 0 (0.0%) |
| 35 to 64 Years | 246 (14.8%) | 199 (13.6%) |
| 65 to 74 Years | 157 (34.0%) | 268 (50.2%) |
| 75 Years and over | 36 (16.5%) | 83 (26.6%) |
Disability Class: Self-Care Difficulty
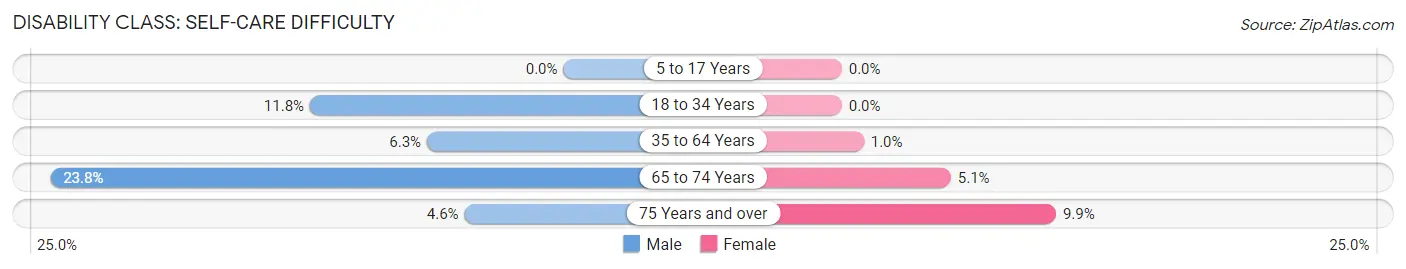
| Age Bracket | Male | Female |
| 5 to 17 Years | 0 (0.0%) | 0 (0.0%) |
| 18 to 34 Years | 66 (11.8%) | 0 (0.0%) |
| 35 to 64 Years | 105 (6.3%) | 15 (1.0%) |
| 65 to 74 Years | 110 (23.8%) | 27 (5.1%) |
| 75 Years and over | 10 (4.6%) | 31 (9.9%) |
Technology Access in Benton County
Computing Device Access in Benton County
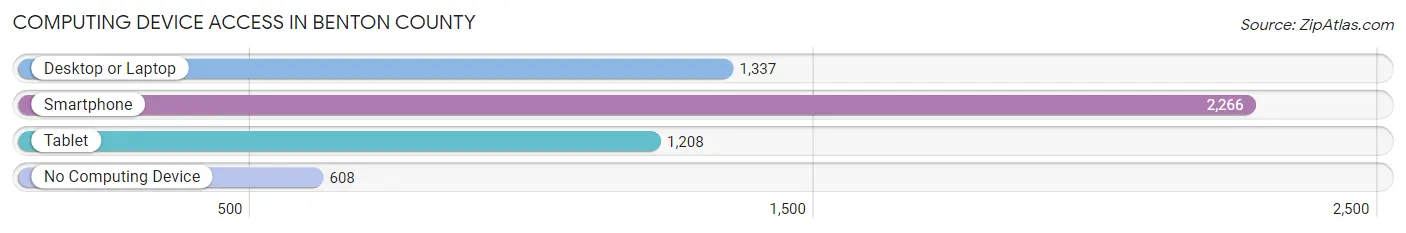
| Device Type | # Households | % Households |
| Desktop or Laptop | 1,337 | 43.3% |
| Smartphone | 2,266 | 73.4% |
| Tablet | 1,208 | 39.1% |
| No Computing Device | 608 | 19.7% |
| Total | 3,086 | 100.0% |
Internet Access in Benton County
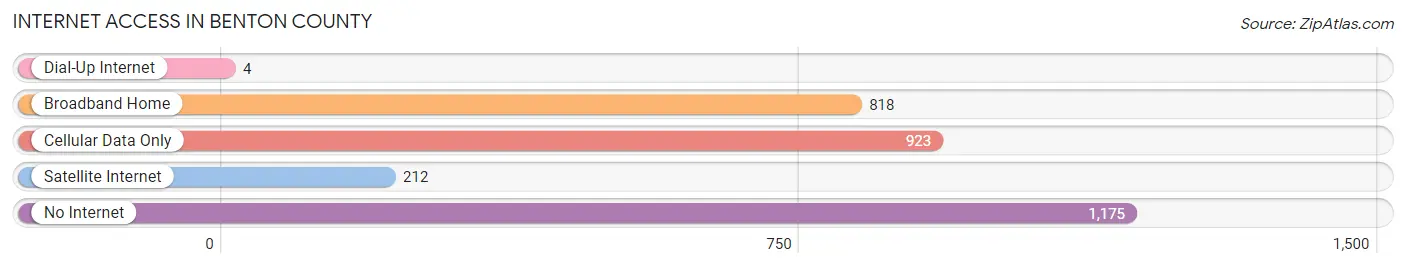
| Internet Type | # Households | % Households |
| Dial-Up Internet | 4 | 0.1% |
| Broadband Home | 818 | 26.5% |
| Cellular Data Only | 923 | 29.9% |
| Satellite Internet | 212 | 6.9% |
| No Internet | 1,175 | 38.1% |
| Total | 3,086 | 100.0% |
Benton County Summary
Benton County, Mississippi is located in the northwest corner of the state and is bordered by Tippah County to the north, Union County to the east, Marshall County to the south, and Alcorn County to the west. The county seat is Ashland, and the county has a total area of 517 square miles. As of the 2010 census, the population was 8,729, making it the second least populous county in Mississippi.
History
Benton County was established in 1836 and named for Thomas Hart Benton, a U.S. Senator from Missouri. The county was originally part of Tippah County, but was split off in 1836. The first county seat was located in the town of Benton, which was established in 1837. The county seat was moved to Ashland in 1854.
During the Civil War, Benton County was a hotbed of Confederate activity. The county was home to several Confederate regiments, including the 11th Mississippi Infantry Regiment, the 17th Mississippi Infantry Regiment, and the 18th Mississippi Infantry Regiment. The county was also the site of several skirmishes and battles, including the Battle of Ashland in 1863.
Geography
Benton County is located in the northwest corner of Mississippi and is bordered by Tippah County to the north, Union County to the east, Marshall County to the south, and Alcorn County to the west. The county has a total area of 517 square miles, of which 515 square miles is land and 2 square miles is water. The county is mostly flat, with some rolling hills in the northern part of the county. The highest point in the county is located in the northern part of the county, near the town of Ashland, and is approximately 500 feet above sea level.
The county is drained by several creeks and rivers, including the Tippah River, which forms the northern border of the county, and the Tallahatchie River, which forms the western border of the county. The county is also home to several small lakes, including Lake Ashland and Lake Benton.
Economy
Benton County is a largely rural county, and the economy is largely based on agriculture. The county is home to several large farms, and the main crops grown in the county are cotton, soybeans, corn, and wheat. The county is also home to several timber companies, and timber is one of the county’s main industries.
The county is also home to several manufacturing companies, including a furniture factory, a paper mill, and a plastics factory. The county is also home to several small businesses, including restaurants, retail stores, and service businesses.
Demographics
As of the 2010 census, the population of Benton County was 8,729, making it the second least populous county in Mississippi. The population is spread out across the county, with the largest population centers being Ashland, Hickory Flat, and New Albany.
The racial makeup of the county is 87.3% White, 10.3% African American, 0.4% Native American, 0.2% Asian, 0.1% Pacific Islander, 0.7% from other races, and 0.9% from two or more races. The median household income in the county is $31,945, and the median family income is $41,945. The per capita income in the county is $17,845.
Common Questions
What is Per Capita Income in Benton County?
Per Capita income in Benton County is $24,690.
What is the Median Family Income in Benton County?
Median Family Income in Benton County is $53,118.
What is the Median Household income in Benton County?
Median Household Income in Benton County is $38,750.
What is Income or Wage Gap in Benton County?
Income or Wage Gap in Benton County is 7.0%.
Women in Benton County earn 93.0 cents for every dollar earned by a man.
What is Inequality or Gini Index in Benton County?
Inequality or Gini Index in Benton County is 0.47.
What is the Total Population of Benton County?
Total Population of Benton County is 7,637.
What is the Total Male Population of Benton County?
Total Male Population of Benton County is 3,780.
What is the Total Female Population of Benton County?
Total Female Population of Benton County is 3,857.
What is the Ratio of Males per 100 Females in Benton County?
There are 98.00 Males per 100 Females in Benton County.
What is the Ratio of Females per 100 Males in Benton County?
There are 102.04 Females per 100 Males in Benton County.
What is the Median Population Age in Benton County?
Median Population Age in Benton County is 41.7 Years.
What is the Average Family Size in Benton County
Average Family Size in Benton County is 3.3 People.
What is the Average Household Size in Benton County
Average Household Size in Benton County is 2.4 People.
How Large is the Labor Force in Benton County?
There are 3,401 People in the Labor Forcein in Benton County.
What is the Percentage of People in the Labor Force in Benton County?
54.0% of People are in the Labor Force in Benton County.
What is the Unemployment Rate in Benton County?
Unemployment Rate in Benton County is 4.4%.