Attala County, MS Map & Demographics
Attala County Map
Attala County Overview
$27,625
PER CAPITA INCOME
$51,463
AVG FAMILY INCOME
$42,680
AVG HOUSEHOLD INCOME
32.0%
WAGE / INCOME GAP [ % ]
68.0¢/ $1
WAGE / INCOME GAP [ $ ]
$12,247
FAMILY INCOME DEFICIT
0.54
INEQUALITY / GINI INDEX
17,842
TOTAL POPULATION
8,537
MALE POPULATION
9,305
FEMALE POPULATION
91.75
MALES / 100 FEMALES
109.00
FEMALES / 100 MALES
39.1
MEDIAN AGE
3.6
AVG FAMILY SIZE
2.8
AVG HOUSEHOLD SIZE
7,567
LABOR FORCE [ PEOPLE ]
55.0%
PERCENT IN LABOR FORCE
7.2%
UNEMPLOYMENT RATE
Attala County Area Codes
Income in Attala County
Income Overview in Attala County
Per Capita Income in Attala County is $27,625, while median incomes of families and households are $51,463 and $42,680 respectively.
| Characteristic | Number | Measure |
| Per Capita Income | 17,842 | $27,625 |
| Median Family Income | 4,086 | $51,463 |
| Mean Family Income | 4,086 | $83,940 |
| Median Household Income | 6,311 | $42,680 |
| Mean Household Income | 6,311 | $68,671 |
| Income Deficit | 4,086 | $12,247 |
| Wage / Income Gap (%) | 17,842 | 32.01% |
| Wage / Income Gap ($) | 17,842 | 67.99¢ per $1 |
| Gini / Inequality Index | 17,842 | 0.54 |
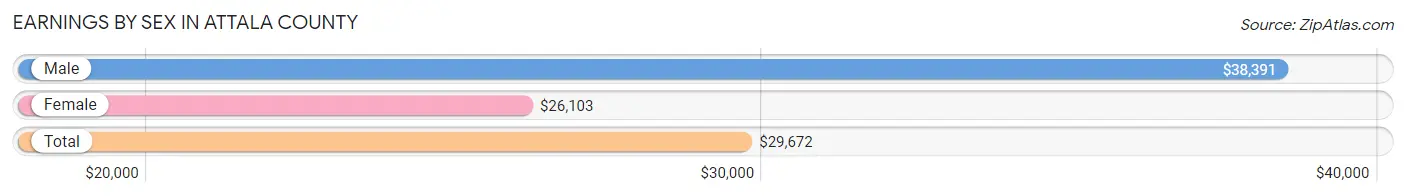
Earnings by Sex in Attala County
Average Earnings in Attala County are $29,672, $38,391 for men and $26,103 for women, a difference of 32.0%.
| Sex | Number | Average Earnings |
| Male | 3,892 (49.3%) | $38,391 |
| Female | 3,999 (50.7%) | $26,103 |
| Total | 7,891 (100.0%) | $29,672 |
Earnings by Sex by Income Bracket in Attala County
The most common earnings brackets in Attala County are $75,000 to $99,999 for men (508 | 13.1%) and $25,000 to $29,999 for women (490 | 12.2%).
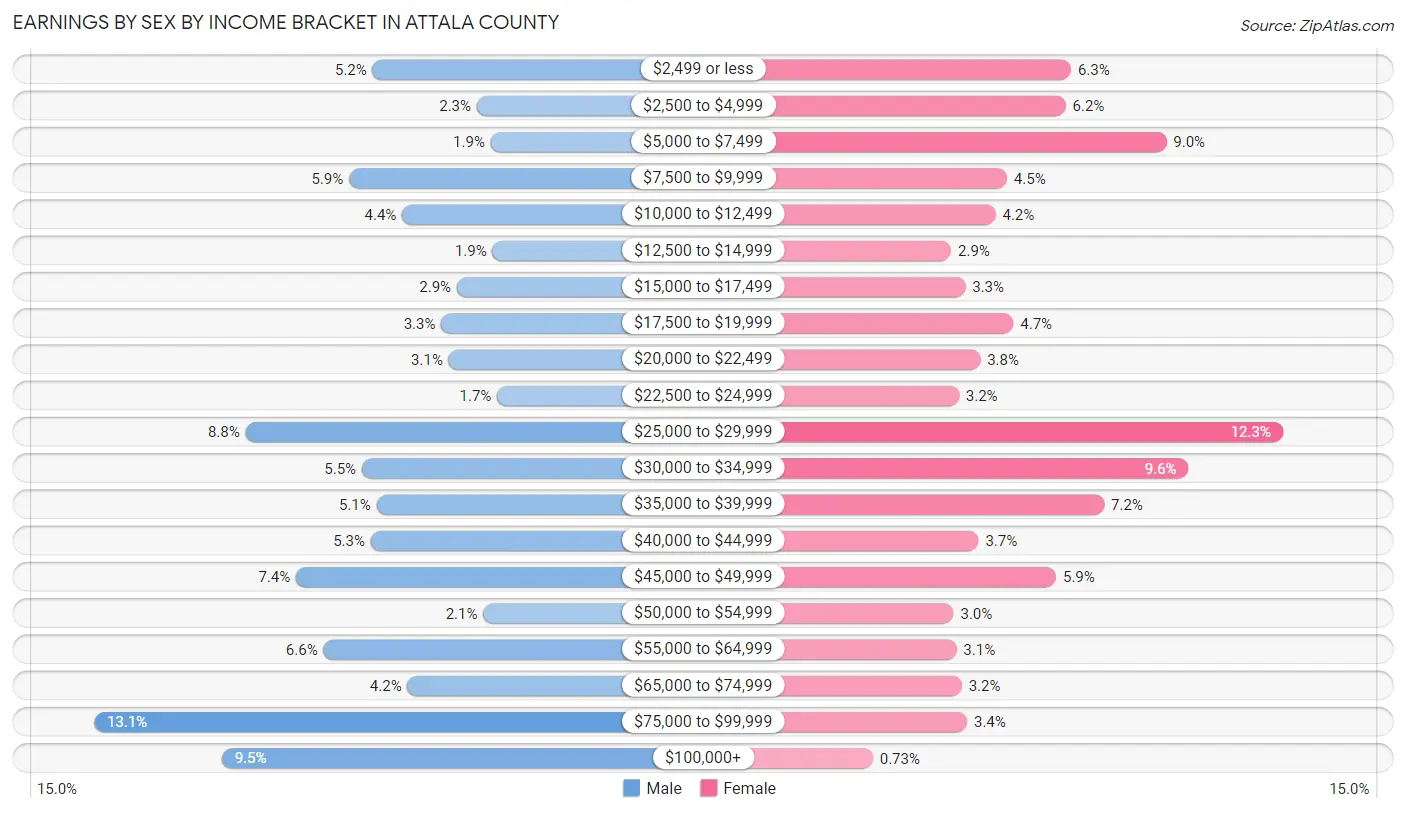
| Income | Male | Female |
| $2,499 or less | 203 (5.2%) | 252 (6.3%) |
| $2,500 to $4,999 | 89 (2.3%) | 246 (6.1%) |
| $5,000 to $7,499 | 74 (1.9%) | 359 (9.0%) |
| $7,500 to $9,999 | 229 (5.9%) | 180 (4.5%) |
| $10,000 to $12,499 | 171 (4.4%) | 167 (4.2%) |
| $12,500 to $14,999 | 72 (1.8%) | 117 (2.9%) |
| $15,000 to $17,499 | 111 (2.9%) | 133 (3.3%) |
| $17,500 to $19,999 | 128 (3.3%) | 187 (4.7%) |
| $20,000 to $22,499 | 120 (3.1%) | 150 (3.7%) |
| $22,500 to $24,999 | 67 (1.7%) | 126 (3.2%) |
| $25,000 to $29,999 | 342 (8.8%) | 490 (12.2%) |
| $30,000 to $34,999 | 215 (5.5%) | 384 (9.6%) |
| $35,000 to $39,999 | 199 (5.1%) | 289 (7.2%) |
| $40,000 to $44,999 | 205 (5.3%) | 148 (3.7%) |
| $45,000 to $49,999 | 287 (7.4%) | 235 (5.9%) |
| $50,000 to $54,999 | 82 (2.1%) | 120 (3.0%) |
| $55,000 to $64,999 | 257 (6.6%) | 123 (3.1%) |
| $65,000 to $74,999 | 165 (4.2%) | 129 (3.2%) |
| $75,000 to $99,999 | 508 (13.1%) | 135 (3.4%) |
| $100,000+ | 368 (9.5%) | 29 (0.7%) |
| Total | 3,892 (100.0%) | 3,999 (100.0%) |
Earnings by Sex by Educational Attainment in Attala County
Average earnings in Attala County are $46,212 for men and $28,045 for women, a difference of 39.3%. Men with an educational attainment of graduate degree enjoy the highest average annual earnings of $105,000, while those with less than high school education earn the least with $24,643. Women with an educational attainment of graduate degree earn the most with the average annual earnings of $48,603, while those with less than high school education have the smallest earnings of $11,660.
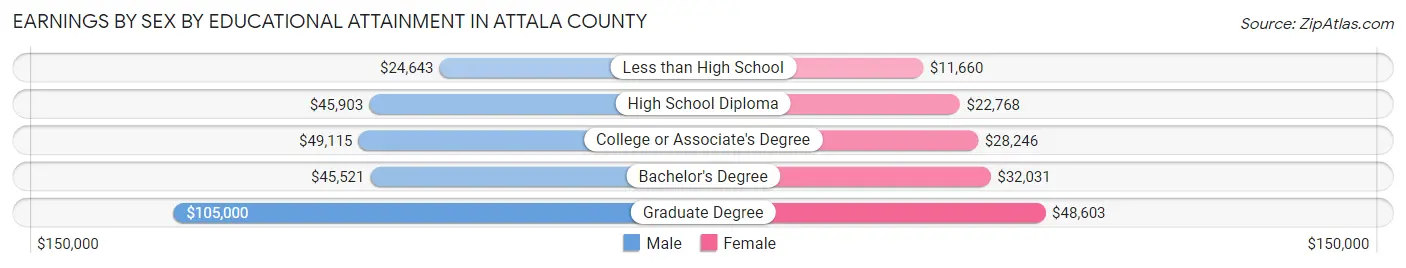
| Educational Attainment | Male Income | Female Income |
| Less than High School | $24,643 | $11,660 |
| High School Diploma | $45,903 | $22,768 |
| College or Associate's Degree | $49,115 | $28,246 |
| Bachelor's Degree | $45,521 | $32,031 |
| Graduate Degree | $105,000 | $48,603 |
| Total | $46,212 | $28,045 |
Family Income in Attala County
Family Income Brackets in Attala County
According to the Attala County family income data, there are 735 families falling into the $100,000 to $149,999 income range, which is the most common income bracket and makes up 18.0% of all families. Conversely, the $10,000 to $14,999 income bracket is the least frequent group with only 155 families (3.8%) belonging to this category.
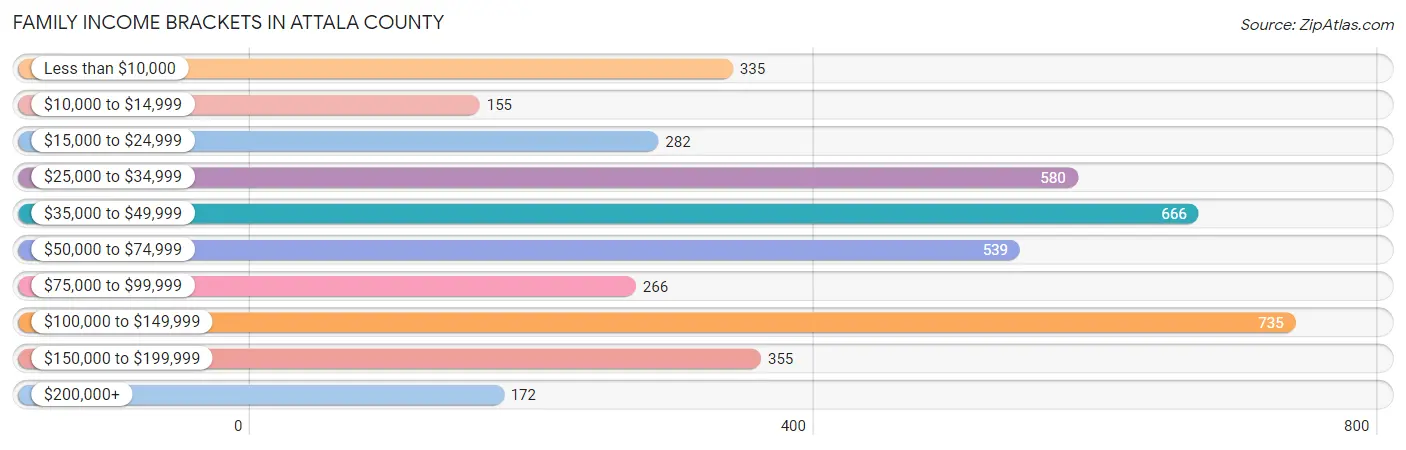
| Income Bracket | # Families | % Families |
| Less than $10,000 | 335 | 8.2% |
| $10,000 to $14,999 | 155 | 3.8% |
| $15,000 to $24,999 | 282 | 6.9% |
| $25,000 to $34,999 | 580 | 14.2% |
| $35,000 to $49,999 | 666 | 16.3% |
| $50,000 to $74,999 | 539 | 13.2% |
| $75,000 to $99,999 | 266 | 6.5% |
| $100,000 to $149,999 | 735 | 18.0% |
| $150,000 to $199,999 | 355 | 8.7% |
| $200,000+ | 172 | 4.2% |
Family Income by Famaliy Size in Attala County
5-person families (383 | 9.4%) account for the highest median family income in Attala County with $108,242 per family, while 2-person families (2,158 | 52.8%) have the highest median income of $23,446 per family member.
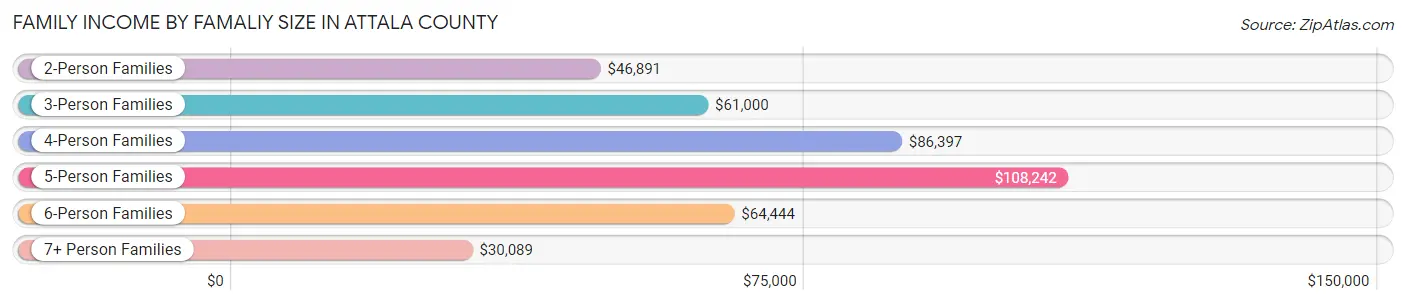
| Income Bracket | # Families | Median Income |
| 2-Person Families | 2,158 (52.8%) | $46,891 |
| 3-Person Families | 884 (21.6%) | $61,000 |
| 4-Person Families | 485 (11.9%) | $86,397 |
| 5-Person Families | 383 (9.4%) | $108,242 |
| 6-Person Families | 88 (2.1%) | $64,444 |
| 7+ Person Families | 88 (2.1%) | $30,089 |
| Total | 4,086 (100.0%) | $51,463 |
Family Income by Number of Earners in Attala County
The median family income in Attala County is $51,463, with families comprising 3+ earners (309) having the highest median family income of $145,469, while families with no earners (810) have the lowest median family income of $33,418, accounting for 7.6% and 19.8% of families, respectively.
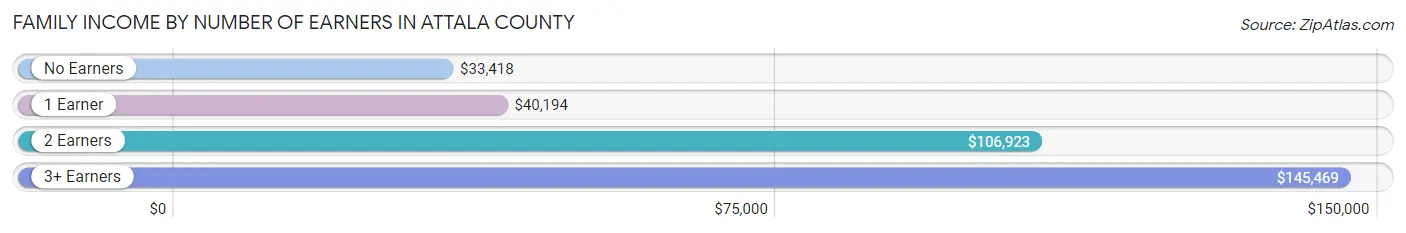
| Number of Earners | # Families | Median Income |
| No Earners | 810 (19.8%) | $33,418 |
| 1 Earner | 1,523 (37.3%) | $40,194 |
| 2 Earners | 1,444 (35.3%) | $106,923 |
| 3+ Earners | 309 (7.6%) | $145,469 |
| Total | 4,086 (100.0%) | $51,463 |
Household Income in Attala County
Household Income Brackets in Attala County
With 959 households falling in the category, the $25,000 to $34,999 income range is the most frequent in Attala County, accounting for 15.2% of all households. In contrast, only 196 households (3.1%) fall into the $200,000+ income bracket, making it the least populous group.
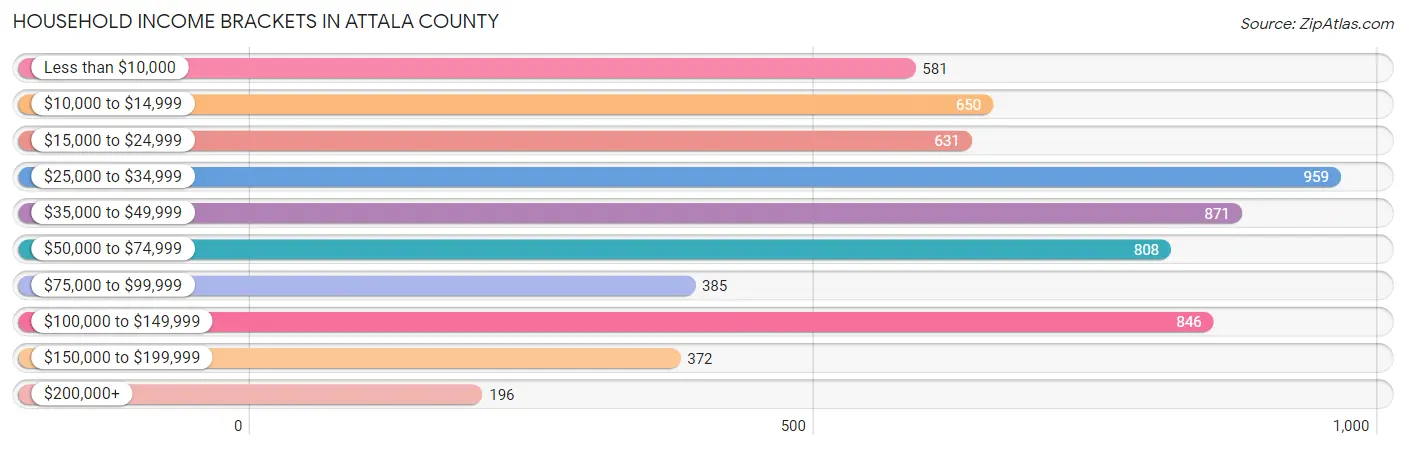
| Income Bracket | # Households | % Households |
| Less than $10,000 | 581 | 9.2% |
| $10,000 to $14,999 | 650 | 10.3% |
| $15,000 to $24,999 | 631 | 10.0% |
| $25,000 to $34,999 | 959 | 15.2% |
| $35,000 to $49,999 | 871 | 13.8% |
| $50,000 to $74,999 | 808 | 12.8% |
| $75,000 to $99,999 | 385 | 6.1% |
| $100,000 to $149,999 | 846 | 13.4% |
| $150,000 to $199,999 | 372 | 5.9% |
| $200,000+ | 196 | 3.1% |
Household Income by Householder Age in Attala County
The median household income in Attala County is $42,680, with the highest median household income of $47,733 found in the 45 to 64 years age bracket for the primary householder. A total of 2,585 households (41.0%) fall into this category. Meanwhile, the 15 to 24 years age bracket for the primary householder has the lowest median household income of $32,131, with 129 households (2.0%) in this group.
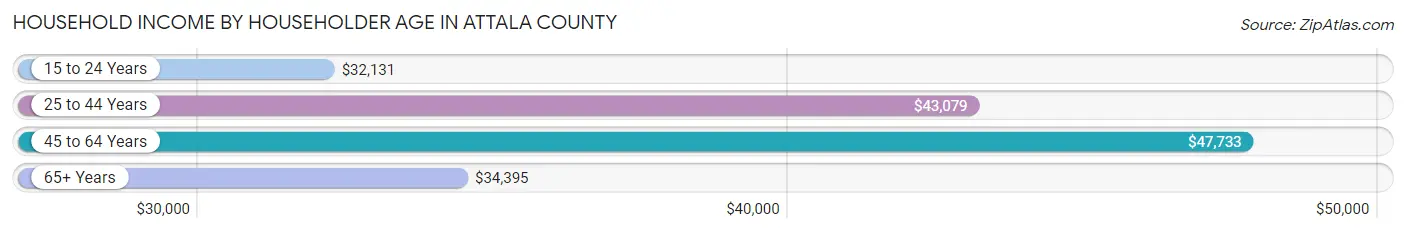
| Income Bracket | # Households | Median Income |
| 15 to 24 Years | 129 (2.0%) | $32,131 |
| 25 to 44 Years | 1,577 (25.0%) | $43,079 |
| 45 to 64 Years | 2,585 (41.0%) | $47,733 |
| 65+ Years | 2,020 (32.0%) | $34,395 |
| Total | 6,311 (100.0%) | $42,680 |
Poverty in Attala County
Income Below Poverty by Sex and Age in Attala County
With 19.1% poverty level for males and 27.6% for females among the residents of Attala County, 5 year old males and 5 year old females are the most vulnerable to poverty, with 47 males (62.7%) and 34 females (100.0%) in their respective age groups living below the poverty level.
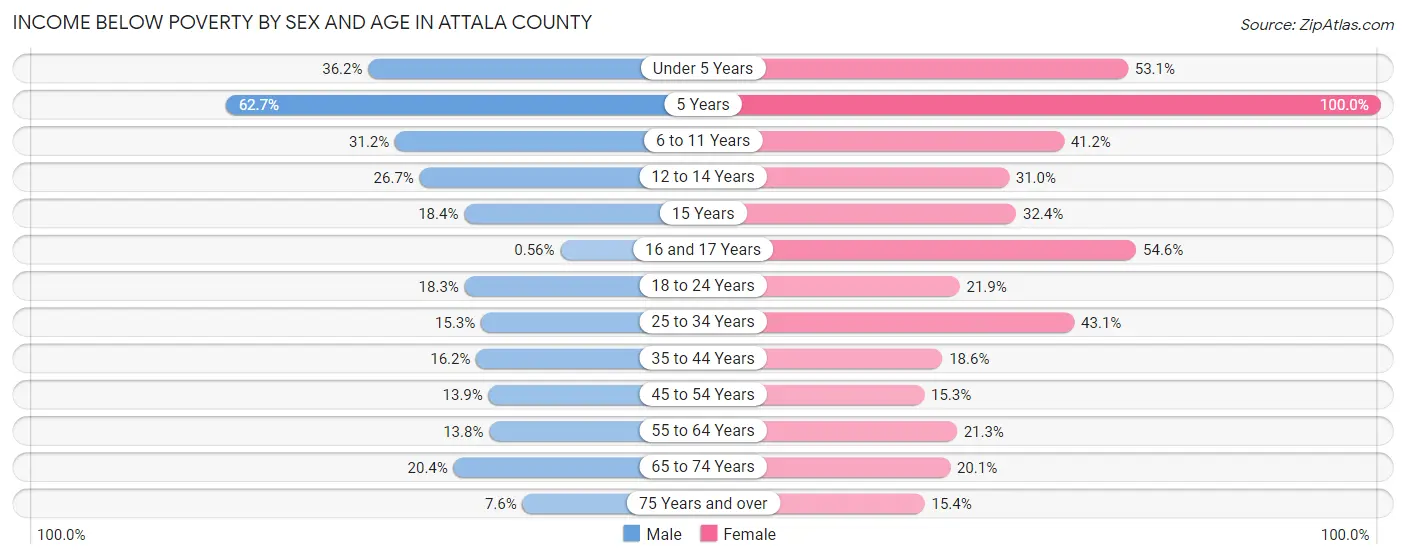
| Age Bracket | Male | Female |
| Under 5 Years | 214 (36.2%) | 250 (53.1%) |
| 5 Years | 47 (62.7%) | 34 (100.0%) |
| 6 to 11 Years | 193 (31.2%) | 393 (41.2%) |
| 12 to 14 Years | 148 (26.7%) | 106 (31.0%) |
| 15 Years | 23 (18.4%) | 77 (32.4%) |
| 16 and 17 Years | 1 (0.6%) | 124 (54.6%) |
| 18 to 24 Years | 166 (18.3%) | 158 (21.8%) |
| 25 to 34 Years | 121 (15.3%) | 446 (43.1%) |
| 35 to 44 Years | 160 (16.2%) | 197 (18.6%) |
| 45 to 54 Years | 134 (13.9%) | 170 (15.3%) |
| 55 to 64 Years | 152 (13.8%) | 250 (21.3%) |
| 65 to 74 Years | 178 (20.4%) | 205 (20.1%) |
| 75 Years and over | 35 (7.6%) | 121 (15.4%) |
| Total | 1,572 (19.1%) | 2,531 (27.6%) |
Income Above Poverty by Sex and Age in Attala County
According to the poverty statistics in Attala County, males aged 16 and 17 years and females aged 45 to 54 years are the age groups that are most secure financially, with 99.4% of males and 84.7% of females in these age groups living above the poverty line.
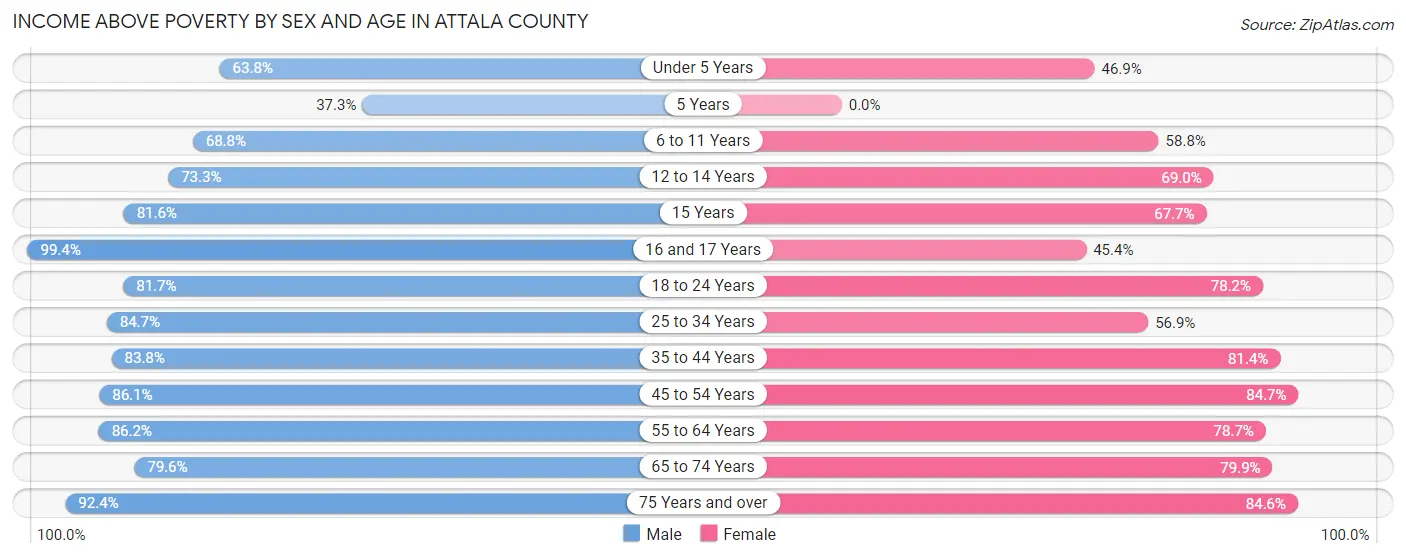
| Age Bracket | Male | Female |
| Under 5 Years | 377 (63.8%) | 221 (46.9%) |
| 5 Years | 28 (37.3%) | 0 (0.0%) |
| 6 to 11 Years | 425 (68.8%) | 561 (58.8%) |
| 12 to 14 Years | 407 (73.3%) | 236 (69.0%) |
| 15 Years | 102 (81.6%) | 161 (67.6%) |
| 16 and 17 Years | 178 (99.4%) | 103 (45.4%) |
| 18 to 24 Years | 740 (81.7%) | 565 (78.1%) |
| 25 to 34 Years | 672 (84.7%) | 588 (56.9%) |
| 35 to 44 Years | 830 (83.8%) | 860 (81.4%) |
| 45 to 54 Years | 832 (86.1%) | 944 (84.7%) |
| 55 to 64 Years | 953 (86.2%) | 922 (78.7%) |
| 65 to 74 Years | 696 (79.6%) | 816 (79.9%) |
| 75 Years and over | 427 (92.4%) | 667 (84.6%) |
| Total | 6,667 (80.9%) | 6,644 (72.4%) |
Income Below Poverty Among Married-Couple Families in Attala County
The poverty statistics for married-couple families in Attala County show that 6.0% or 155 of the total 2,567 families live below the poverty line. Families with 3 or 4 children have the highest poverty rate of 21.0%, comprising of 40 families. On the other hand, families with 1 or 2 children have the lowest poverty rate of 1.9%, which includes 13 families.
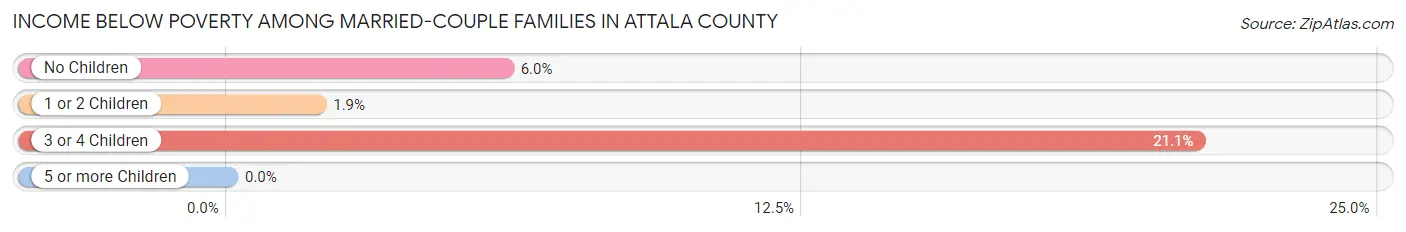
| Children | Above Poverty | Below Poverty |
| No Children | 1,599 (94.0%) | 102 (6.0%) |
| 1 or 2 Children | 663 (98.1%) | 13 (1.9%) |
| 3 or 4 Children | 150 (78.9%) | 40 (21.0%) |
| 5 or more Children | 0 (0.0%) | 0 (0.0%) |
| Total | 2,412 (94.0%) | 155 (6.0%) |
Income Below Poverty Among Single-Parent Households in Attala County
According to the poverty data in Attala County, 22.5% or 79 single-father households and 46.8% or 546 single-mother households are living below the poverty line. Among single-father households, those with 3 or 4 children have the highest poverty rate, with 56 households (100.0%) experiencing poverty. Likewise, among single-mother households, those with 5 or more children have the highest poverty rate, with 21 households (100.0%) falling below the poverty line.
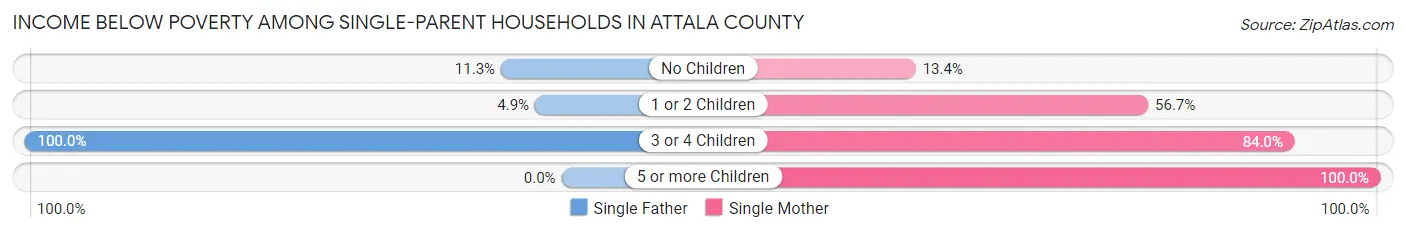
| Children | Single Father | Single Mother |
| No Children | 15 (11.3%) | 49 (13.4%) |
| 1 or 2 Children | 8 (4.9%) | 376 (56.7%) |
| 3 or 4 Children | 56 (100.0%) | 100 (84.0%) |
| 5 or more Children | 0 (0.0%) | 21 (100.0%) |
| Total | 79 (22.5%) | 546 (46.8%) |
Income Below Poverty Among Married-Couple vs Single-Parent Households in Attala County
The poverty data for Attala County shows that 155 of the married-couple family households (6.0%) and 625 of the single-parent households (41.1%) are living below the poverty level. Within the married-couple family households, those with 3 or 4 children have the highest poverty rate, with 40 households (21.0%) falling below the poverty line. Among the single-parent households, those with 5 or more children have the highest poverty rate, with 21 household (100.0%) living below poverty.
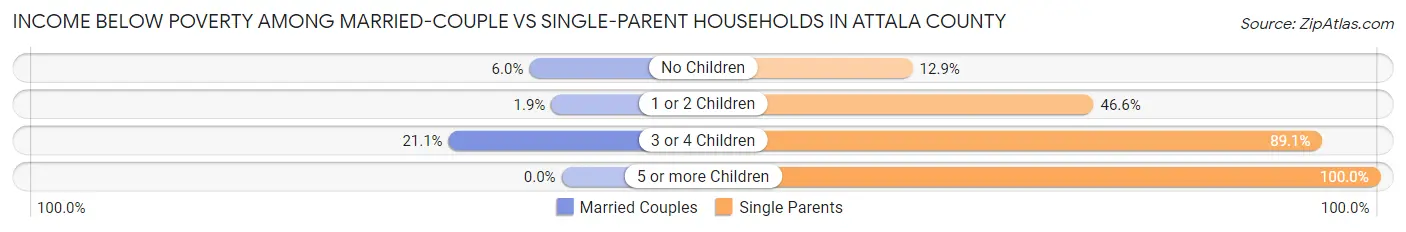
| Children | Married-Couple Families | Single-Parent Households |
| No Children | 102 (6.0%) | 64 (12.9%) |
| 1 or 2 Children | 13 (1.9%) | 384 (46.6%) |
| 3 or 4 Children | 40 (21.0%) | 156 (89.1%) |
| 5 or more Children | 0 (0.0%) | 21 (100.0%) |
| Total | 155 (6.0%) | 625 (41.1%) |
Race in Attala County
The most populous races in Attala County are White / Caucasian (9,480 | 53.1%), Black / African American (7,528 | 42.2%), and Two or more Races (593 | 3.3%).
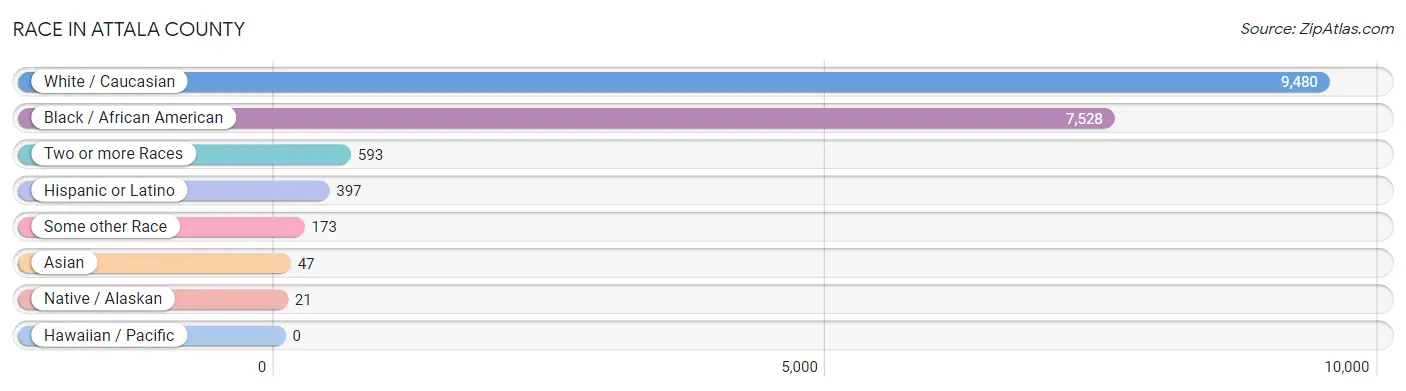
| Race | # Population | % Population |
| Asian | 47 | 0.3% |
| Black / African American | 7,528 | 42.2% |
| Hawaiian / Pacific | 0 | 0.0% |
| Hispanic or Latino | 397 | 2.2% |
| Native / Alaskan | 21 | 0.1% |
| White / Caucasian | 9,480 | 53.1% |
| Two or more Races | 593 | 3.3% |
| Some other Race | 173 | 1.0% |
| Total | 17,842 | 100.0% |
Ancestry in Attala County
The most populous ancestries reported in Attala County are English (2,024 | 11.3%), American (1,715 | 9.6%), Irish (1,281 | 7.2%), German (571 | 3.2%), and African (489 | 2.7%), together accounting for 34.1% of all Attala County residents.
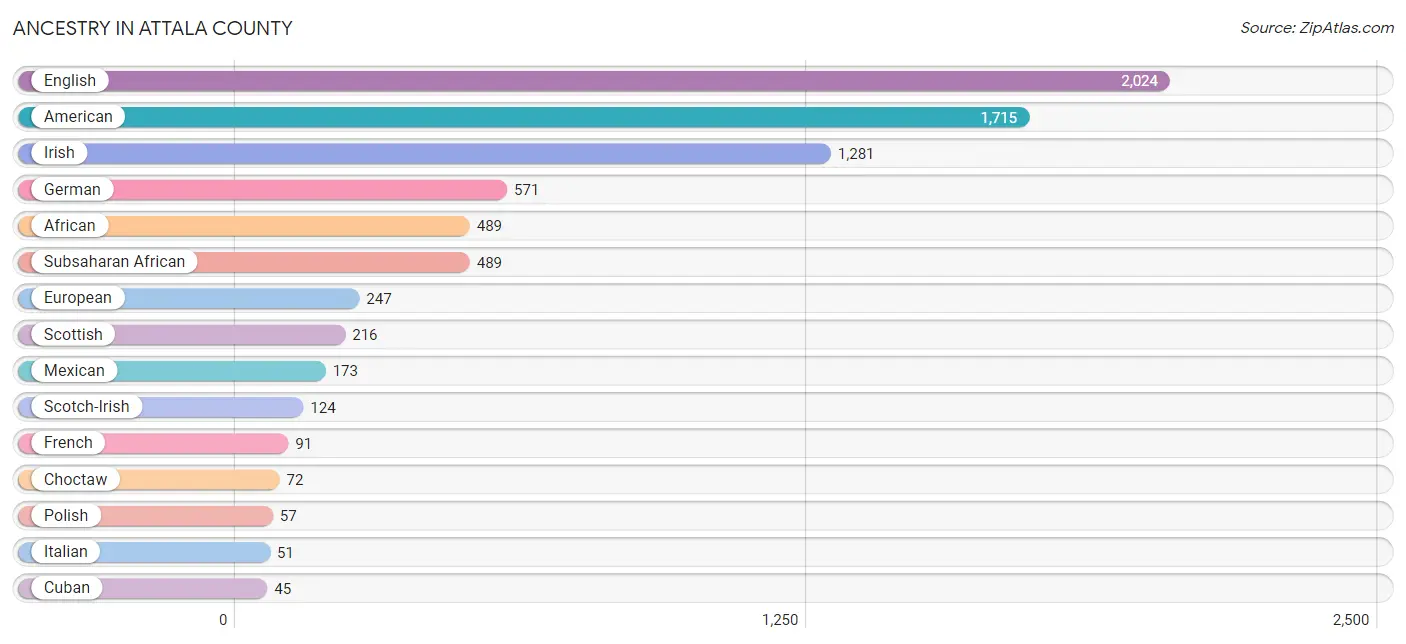
| Ancestry | # Population | % Population |
| African | 489 | 2.7% |
| American | 1,715 | 9.6% |
| Austrian | 11 | 0.1% |
| Bhutanese | 35 | 0.2% |
| British | 35 | 0.2% |
| Cajun | 36 | 0.2% |
| Cherokee | 4 | 0.0% |
| Choctaw | 72 | 0.4% |
| Colombian | 28 | 0.2% |
| Cuban | 45 | 0.3% |
| Dutch | 24 | 0.1% |
| English | 2,024 | 11.3% |
| European | 247 | 1.4% |
| Finnish | 41 | 0.2% |
| French | 91 | 0.5% |
| German | 571 | 3.2% |
| Greek | 4 | 0.0% |
| Indian (Asian) | 26 | 0.2% |
| Irish | 1,281 | 7.2% |
| Italian | 51 | 0.3% |
| Mexican | 173 | 1.0% |
| Pakistani | 21 | 0.1% |
| Polish | 57 | 0.3% |
| Puerto Rican | 32 | 0.2% |
| Scotch-Irish | 124 | 0.7% |
| Scottish | 216 | 1.2% |
| Sioux | 4 | 0.0% |
| South American | 28 | 0.2% |
| Spaniard | 36 | 0.2% |
| Spanish | 35 | 0.2% |
| Subsaharan African | 489 | 2.7% |
| Swiss | 17 | 0.1% |
| Welsh | 4 | 0.0% | View All 33 Rows |
Immigrants in Attala County
The most numerous immigrant groups reported in Attala County came from Central America (33 | 0.2%), Latin America (33 | 0.2%), Mexico (33 | 0.2%), Asia (26 | 0.2%), and China (26 | 0.2%), together accounting for 0.8% of all Attala County residents.
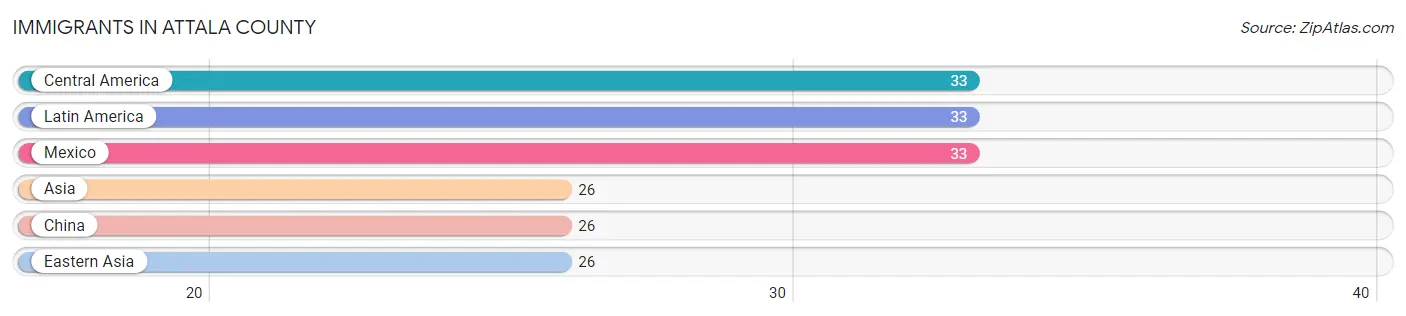
| Immigration Origin | # Population | % Population |
| Asia | 26 | 0.2% |
| Central America | 33 | 0.2% |
| China | 26 | 0.2% |
| Eastern Asia | 26 | 0.2% |
| Latin America | 33 | 0.2% |
| Mexico | 33 | 0.2% | View All 6 Rows |
Sex and Age in Attala County
Sex and Age in Attala County
The most populous age groups in Attala County are 10 to 14 Years (800 | 9.4%) for men and 15 to 19 Years (747 | 8.0%) for women.
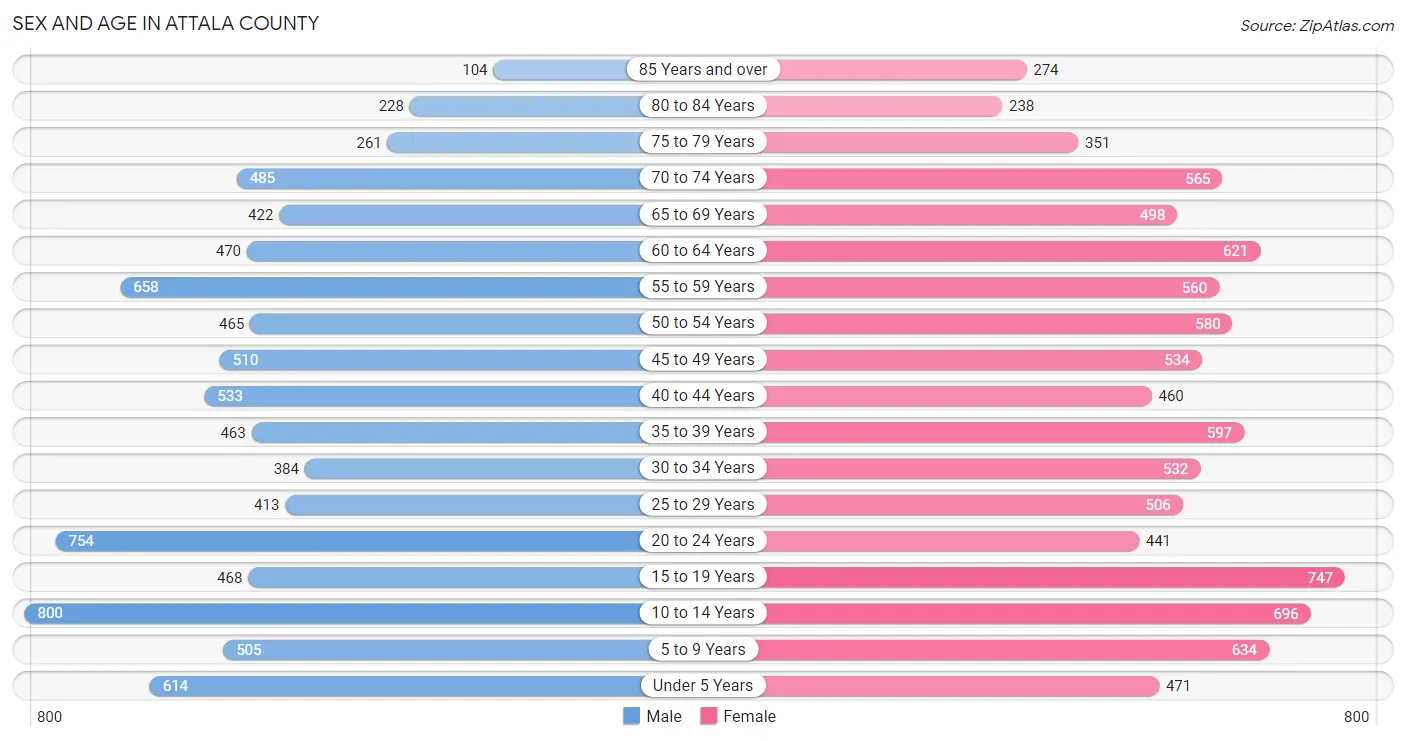
| Age Bracket | Male | Female |
| Under 5 Years | 614 (7.2%) | 471 (5.1%) |
| 5 to 9 Years | 505 (5.9%) | 634 (6.8%) |
| 10 to 14 Years | 800 (9.4%) | 696 (7.5%) |
| 15 to 19 Years | 468 (5.5%) | 747 (8.0%) |
| 20 to 24 Years | 754 (8.8%) | 441 (4.7%) |
| 25 to 29 Years | 413 (4.8%) | 506 (5.4%) |
| 30 to 34 Years | 384 (4.5%) | 532 (5.7%) |
| 35 to 39 Years | 463 (5.4%) | 597 (6.4%) |
| 40 to 44 Years | 533 (6.2%) | 460 (4.9%) |
| 45 to 49 Years | 510 (6.0%) | 534 (5.7%) |
| 50 to 54 Years | 465 (5.4%) | 580 (6.2%) |
| 55 to 59 Years | 658 (7.7%) | 560 (6.0%) |
| 60 to 64 Years | 470 (5.5%) | 621 (6.7%) |
| 65 to 69 Years | 422 (4.9%) | 498 (5.3%) |
| 70 to 74 Years | 485 (5.7%) | 565 (6.1%) |
| 75 to 79 Years | 261 (3.1%) | 351 (3.8%) |
| 80 to 84 Years | 228 (2.7%) | 238 (2.6%) |
| 85 Years and over | 104 (1.2%) | 274 (2.9%) |
| Total | 8,537 (100.0%) | 9,305 (100.0%) |
Families and Households in Attala County
Median Family Size in Attala County
The median family size in Attala County is 3.56 persons per family, with single female/mother families (1,168 | 28.6%) accounting for the largest median family size of 4.36 persons per family. On the other hand, married-couple families (2,567 | 62.8%) represent the smallest median family size with 3.24 persons per family.
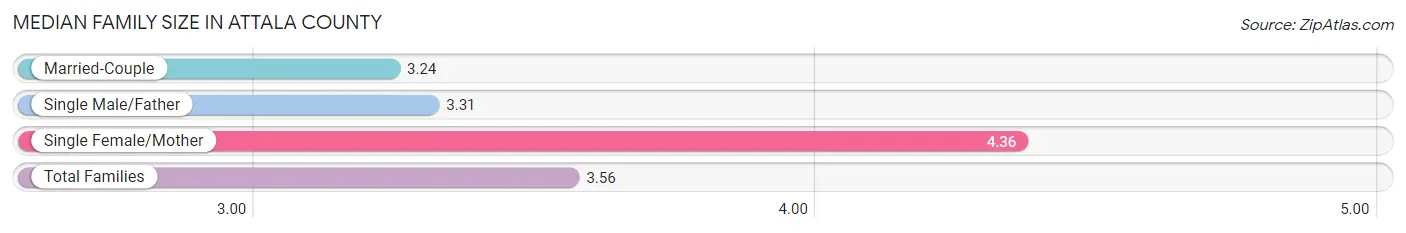
| Family Type | # Families | Family Size |
| Married-Couple | 2,567 (62.8%) | 3.24 |
| Single Male/Father | 351 (8.6%) | 3.31 |
| Single Female/Mother | 1,168 (28.6%) | 4.36 |
| Total Families | 4,086 (100.0%) | 3.56 |
Median Household Size in Attala County
The median household size in Attala County is 2.77 persons per household, with single female/mother households (1,168 | 18.5%) accounting for the largest median household size of 4.52 persons per household. non-family households (2,225 | 35.3%) represent the smallest median household size with 1.13 persons per household.
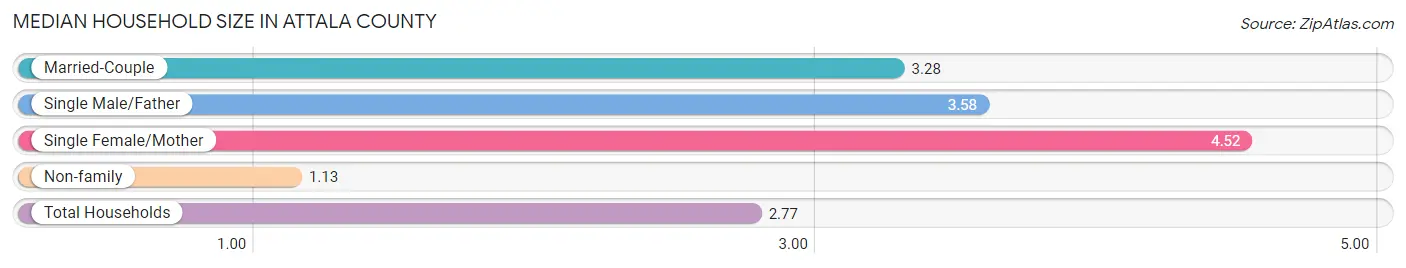
| Household Type | # Households | Household Size |
| Married-Couple | 2,567 (40.7%) | 3.28 |
| Single Male/Father | 351 (5.6%) | 3.58 |
| Single Female/Mother | 1,168 (18.5%) | 4.52 |
| Non-family | 2,225 (35.3%) | 1.13 |
| Total Households | 6,311 (100.0%) | 2.77 |
Household Size by Marriage Status in Attala County
Out of a total of 6,311 households in Attala County, 4,086 (64.7%) are family households, while 2,225 (35.3%) are nonfamily households. The most numerous type of family households are 2-person households, comprising 2,039, and the most common type of nonfamily households are 1-person households, comprising 1,992.
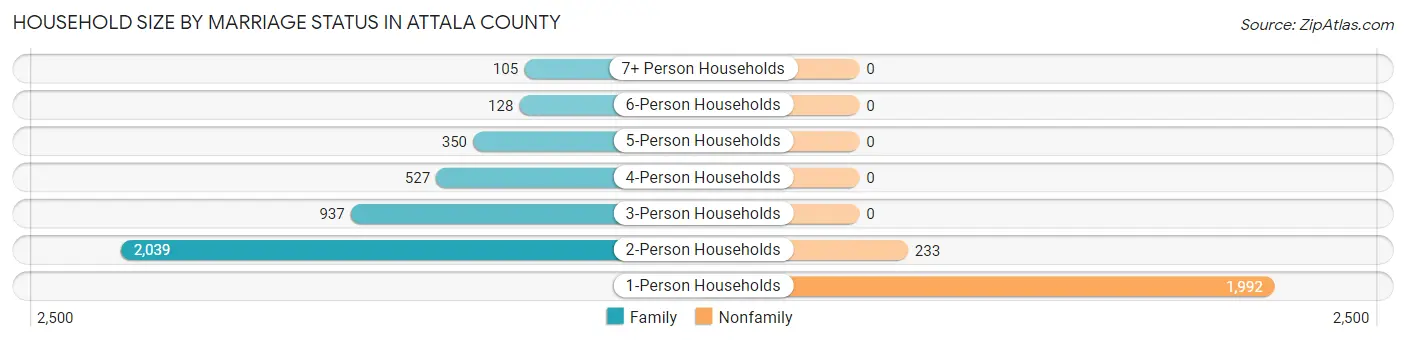
| Household Size | Family Households | Nonfamily Households |
| 1-Person Households | - | 1,992 (31.6%) |
| 2-Person Households | 2,039 (32.3%) | 233 (3.7%) |
| 3-Person Households | 937 (14.8%) | 0 (0.0%) |
| 4-Person Households | 527 (8.4%) | 0 (0.0%) |
| 5-Person Households | 350 (5.6%) | 0 (0.0%) |
| 6-Person Households | 128 (2.0%) | 0 (0.0%) |
| 7+ Person Households | 105 (1.7%) | 0 (0.0%) |
| Total | 4,086 (64.7%) | 2,225 (35.3%) |
Female Fertility in Attala County
Fertility by Age in Attala County
Average fertility rate in Attala County is 60.0 births per 1,000 women. Women in the age bracket of 20 to 34 years have the highest fertility rate with 108.0 births per 1,000 women. Women in the age bracket of 20 to 34 years acount for 68.4% of all women with births.
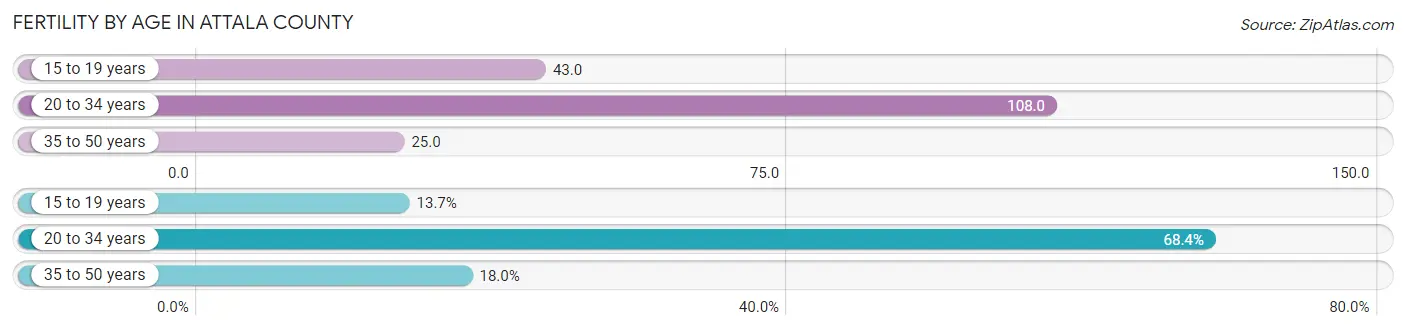
| Age Bracket | Women with Births | Births / 1,000 Women |
| 15 to 19 years | 32 (13.7%) | 43.0 |
| 20 to 34 years | 160 (68.4%) | 108.0 |
| 35 to 50 years | 42 (17.9%) | 25.0 |
| Total | 234 (100.0%) | 60.0 |
Fertility by Age by Marriage Status in Attala County
32.5% of women with births (234) in Attala County are married. The highest percentage of unmarried women with births falls into 15 to 19 years age bracket with 100.0% of them unmarried at the time of birth, while the lowest percentage of unmarried women with births belong to 20 to 34 years age bracket with 59.4% of them unmarried.
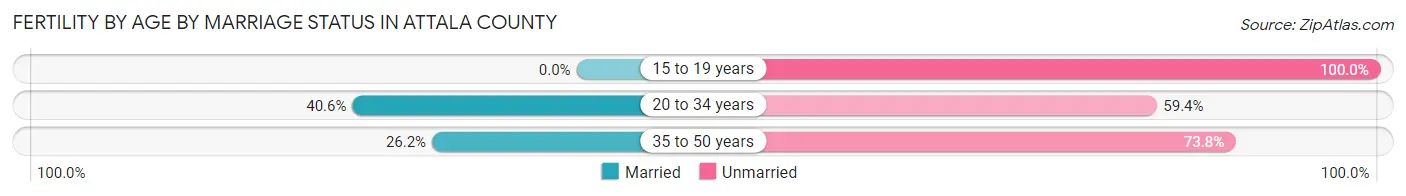
| Age Bracket | Married | Unmarried |
| 15 to 19 years | 0 (0.0%) | 32 (100.0%) |
| 20 to 34 years | 65 (40.6%) | 95 (59.4%) |
| 35 to 50 years | 11 (26.2%) | 31 (73.8%) |
| Total | 76 (32.5%) | 158 (67.5%) |
Fertility by Education in Attala County
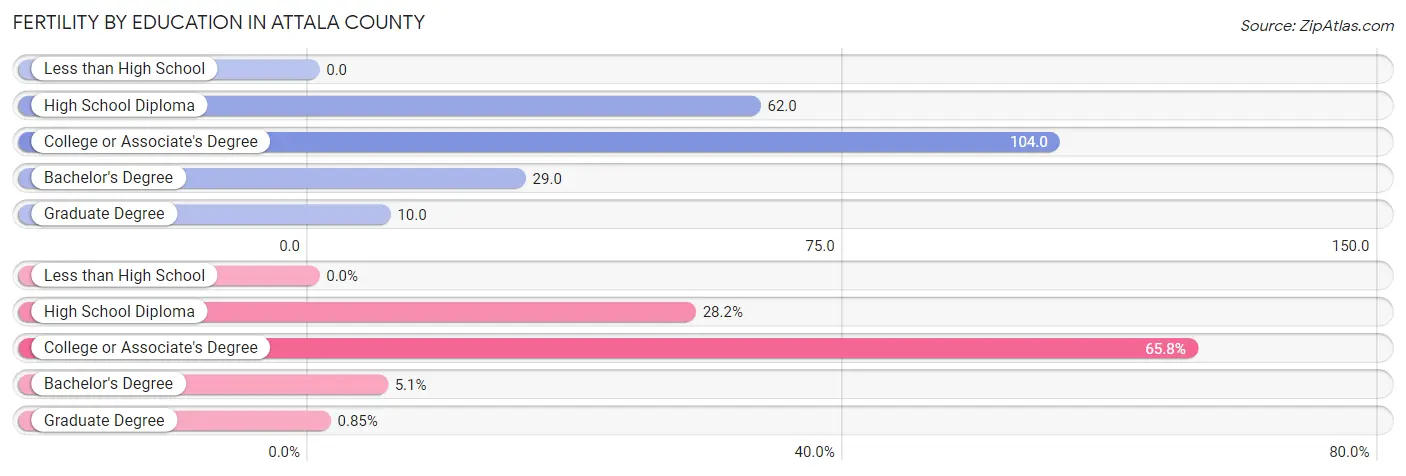
| Educational Attainment | Women with Births | Births / 1,000 Women |
| Less than High School | 0 (0.0%) | 0.0 |
| High School Diploma | 66 (28.2%) | 62.0 |
| College or Associate's Degree | 154 (65.8%) | 104.0 |
| Bachelor's Degree | 12 (5.1%) | 29.0 |
| Graduate Degree | 2 (0.9%) | 10.0 |
| Total | 234 (100.0%) | 60.0 |
Fertility by Education by Marriage Status in Attala County
67.5% of women with births in Attala County are unmarried. Women with the educational attainment of bachelor's degree are most likely to be married with 100.0% of them married at childbirth, while women with the educational attainment of high school diploma are least likely to be married with 84.9% of them unmarried at childbirth.
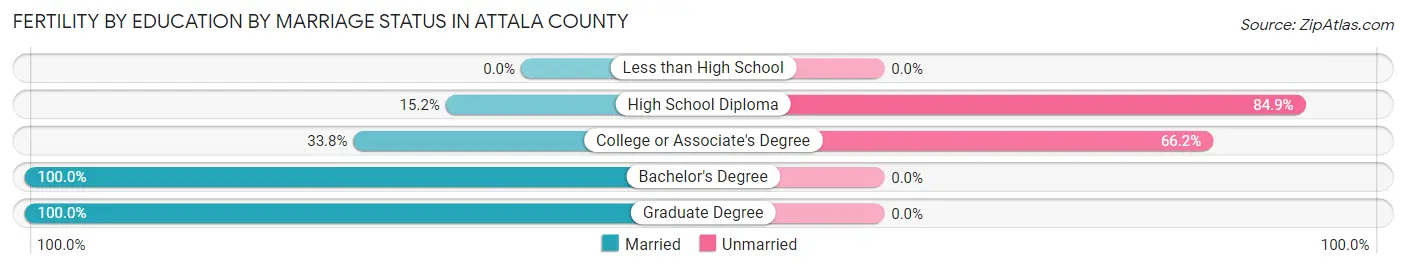
| Educational Attainment | Married | Unmarried |
| Less than High School | 0 (0.0%) | 0 (0.0%) |
| High School Diploma | 10 (15.1%) | 56 (84.9%) |
| College or Associate's Degree | 52 (33.8%) | 102 (66.2%) |
| Bachelor's Degree | 12 (100.0%) | 0 (0.0%) |
| Graduate Degree | 2 (100.0%) | 0 (0.0%) |
| Total | 76 (32.5%) | 158 (67.5%) |
Employment Characteristics in Attala County
Employment by Class of Employer in Attala County
Among the 6,886 employed individuals in Attala County, private company employees (4,654 | 67.6%), state government employees (557 | 8.1%), and local government employees (449 | 6.5%) make up the most common classes of employment.
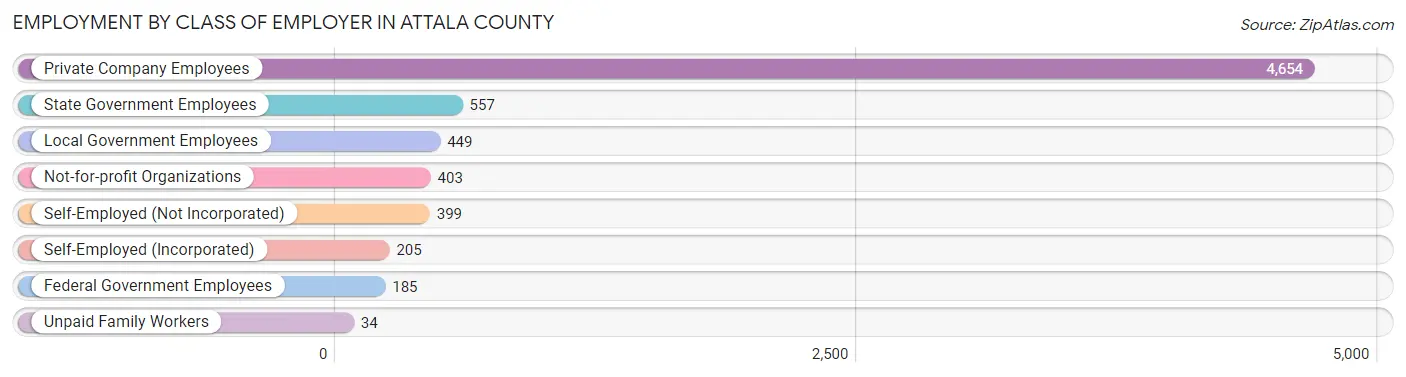
| Employer Class | # Employees | % Employees |
| Private Company Employees | 4,654 | 67.6% |
| Self-Employed (Incorporated) | 205 | 3.0% |
| Self-Employed (Not Incorporated) | 399 | 5.8% |
| Not-for-profit Organizations | 403 | 5.9% |
| Local Government Employees | 449 | 6.5% |
| State Government Employees | 557 | 8.1% |
| Federal Government Employees | 185 | 2.7% |
| Unpaid Family Workers | 34 | 0.5% |
| Total | 6,886 | 100.0% |
Employment Status by Age in Attala County
According to the labor force statistics for Attala County, out of the total population over 16 years of age (13,759), 55.0% or 7,567 individuals are in the labor force, with 7.2% or 545 of them unemployed. The age group with the highest labor force participation rate is 30 to 34 years, with 84.3% or 772 individuals in the labor force. Within the labor force, the 16 to 19 years age range has the highest percentage of unemployed individuals, with 34.5% or 40 of them being unemployed.
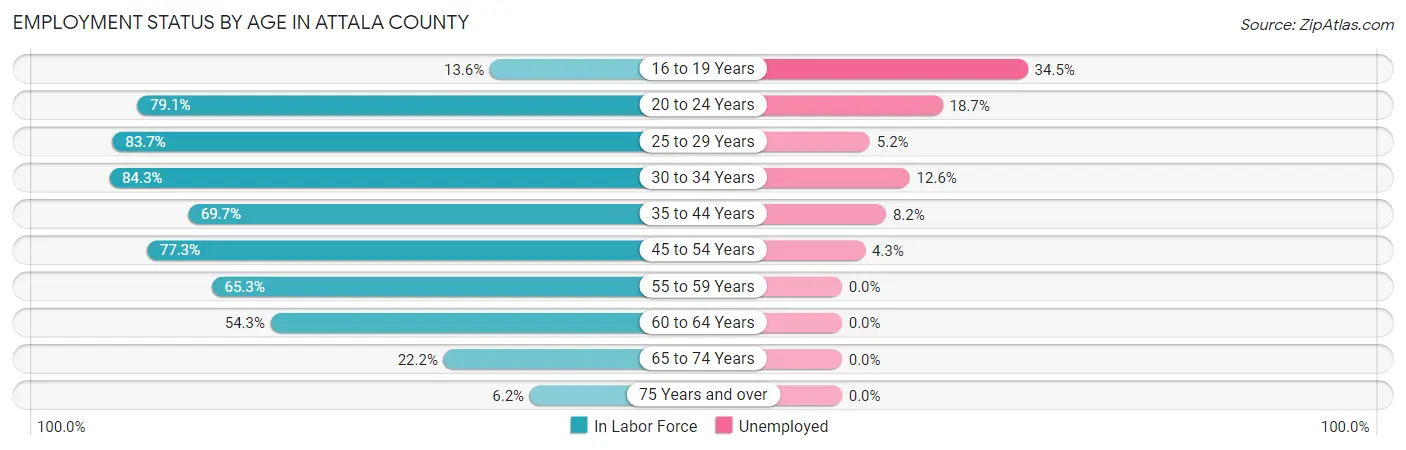
| Age Bracket | In Labor Force | Unemployed |
| 16 to 19 Years | 116 (13.6%) | 40 (34.5%) |
| 20 to 24 Years | 945 (79.1%) | 177 (18.7%) |
| 25 to 29 Years | 769 (83.7%) | 40 (5.2%) |
| 30 to 34 Years | 772 (84.3%) | 97 (12.6%) |
| 35 to 44 Years | 1,431 (69.7%) | 117 (8.2%) |
| 45 to 54 Years | 1,615 (77.3%) | 69 (4.3%) |
| 55 to 59 Years | 795 (65.3%) | 0 (0.0%) |
| 60 to 64 Years | 592 (54.3%) | 0 (0.0%) |
| 65 to 74 Years | 437 (22.2%) | 0 (0.0%) |
| 75 Years and over | 90 (6.2%) | 0 (0.0%) |
| Total | 7,567 (55.0%) | 545 (7.2%) |
Employment Status by Educational Attainment in Attala County
According to labor force statistics for Attala County, 72.1% of individuals (5,974) out of the total population between 25 and 64 years of age (8,286) are in the labor force, with 5.4% or 323 of them being unemployed. The group with the highest labor force participation rate are those with the educational attainment of bachelor's degree or higher, with 87.1% or 1,197 individuals in the labor force. Within the labor force, individuals with college / associate degree education have the highest percentage of unemployment, with 7.2% or 153 of them being unemployed.
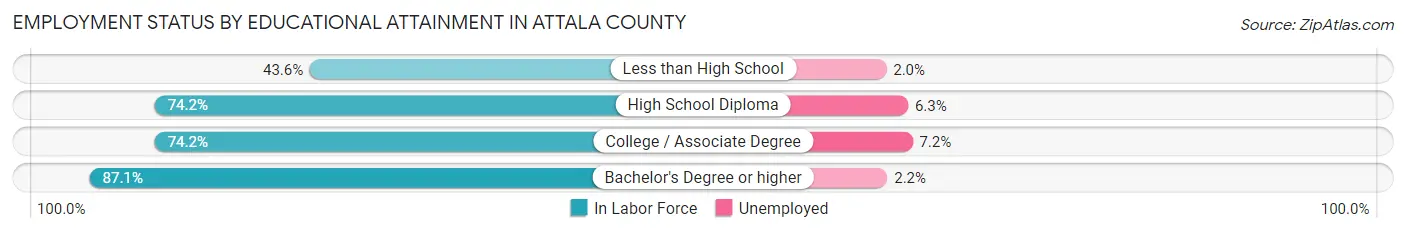
| Educational Attainment | In Labor Force | Unemployed |
| Less than High School | 501 (43.6%) | 23 (2.0%) |
| High School Diploma | 2,154 (74.2%) | 183 (6.3%) |
| College / Associate Degree | 2,122 (74.2%) | 206 (7.2%) |
| Bachelor's Degree or higher | 1,197 (87.1%) | 30 (2.2%) |
| Total | 5,974 (72.1%) | 447 (5.4%) |
Employment Occupations by Sex in Attala County
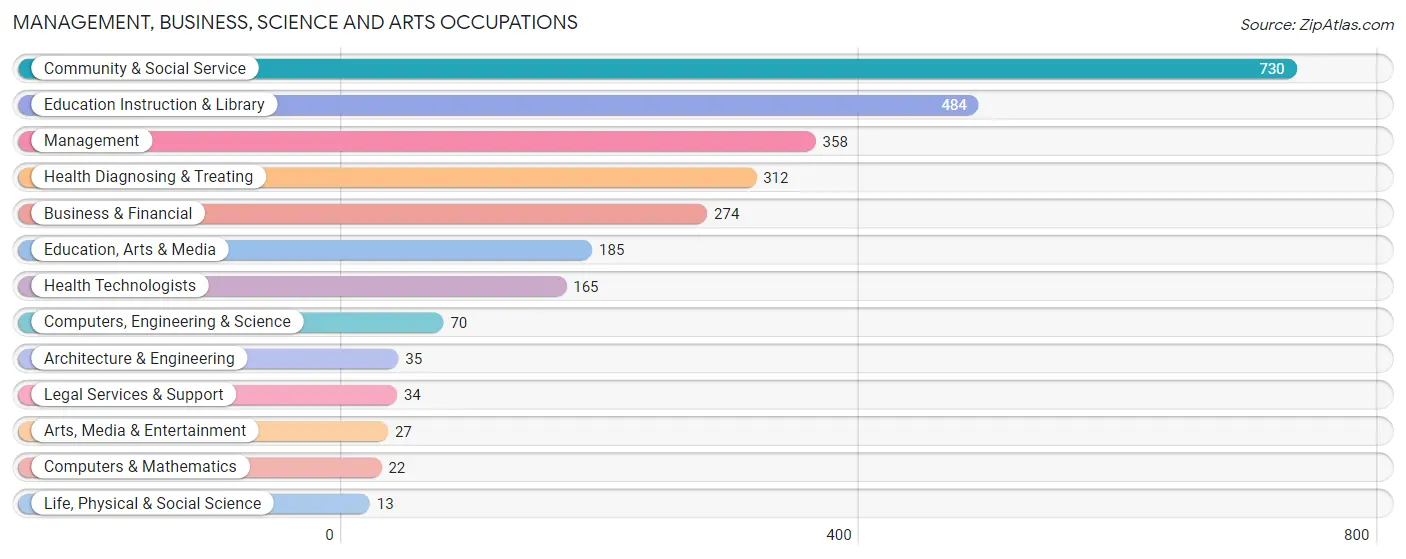
Management, Business, Science and Arts Occupations
The most common Management, Business, Science and Arts occupations in Attala County are Community & Social Service (730 | 10.4%), Education Instruction & Library (484 | 6.9%), Management (358 | 5.1%), Health Diagnosing & Treating (312 | 4.4%), and Business & Financial (274 | 3.9%).
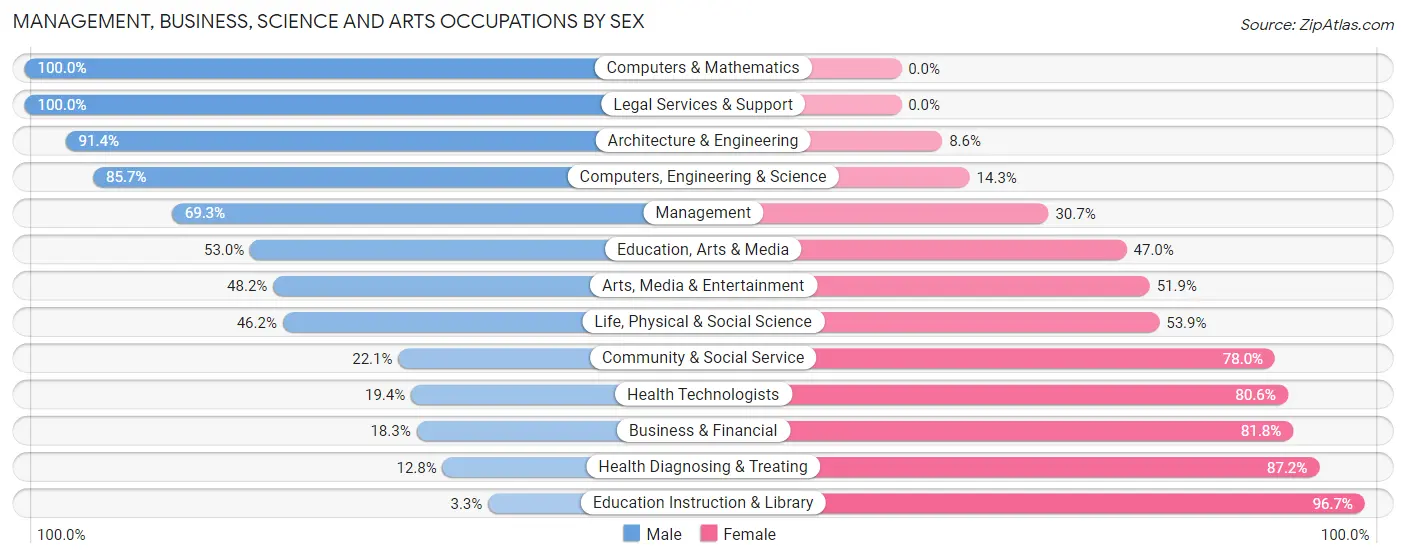
Management, Business, Science and Arts Occupations by Sex
Within the Management, Business, Science and Arts occupations in Attala County, the most male-oriented occupations are Computers & Mathematics (100.0%), Legal Services & Support (100.0%), and Architecture & Engineering (91.4%), while the most female-oriented occupations are Education Instruction & Library (96.7%), Health Diagnosing & Treating (87.2%), and Business & Financial (81.8%).
| Occupation | Male | Female |
| Management | 248 (69.3%) | 110 (30.7%) |
| Business & Financial | 50 (18.2%) | 224 (81.8%) |
| Computers, Engineering & Science | 60 (85.7%) | 10 (14.3%) |
| Computers & Mathematics | 22 (100.0%) | 0 (0.0%) |
| Architecture & Engineering | 32 (91.4%) | 3 (8.6%) |
| Life, Physical & Social Science | 6 (46.2%) | 7 (53.8%) |
| Community & Social Service | 161 (22.1%) | 569 (77.9%) |
| Education, Arts & Media | 98 (53.0%) | 87 (47.0%) |
| Legal Services & Support | 34 (100.0%) | 0 (0.0%) |
| Education Instruction & Library | 16 (3.3%) | 468 (96.7%) |
| Arts, Media & Entertainment | 13 (48.1%) | 14 (51.8%) |
| Health Diagnosing & Treating | 40 (12.8%) | 272 (87.2%) |
| Health Technologists | 32 (19.4%) | 133 (80.6%) |
| Total (Category) | 559 (32.1%) | 1,185 (67.9%) |
| Total (Overall) | 3,362 (47.9%) | 3,660 (52.1%) |
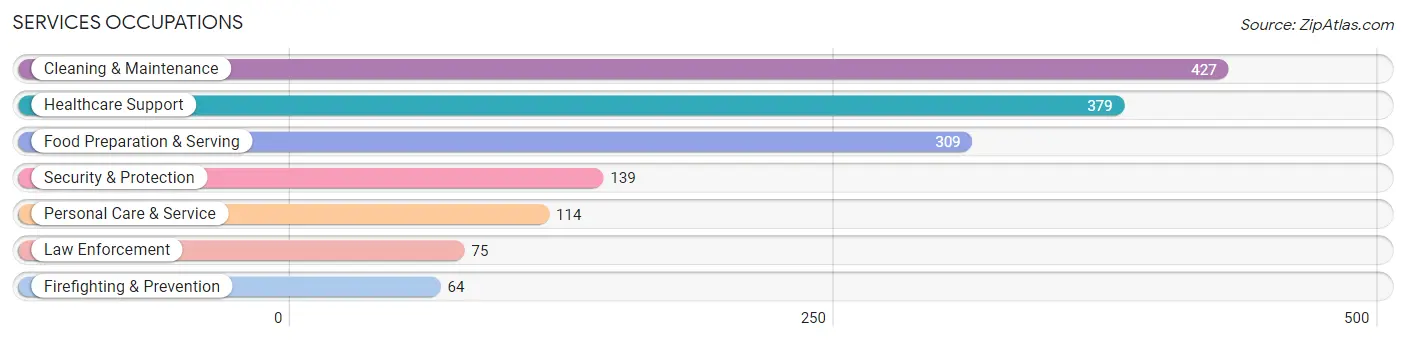
Services Occupations
The most common Services occupations in Attala County are Cleaning & Maintenance (427 | 6.1%), Healthcare Support (379 | 5.4%), Food Preparation & Serving (309 | 4.4%), Security & Protection (139 | 2.0%), and Personal Care & Service (114 | 1.6%).
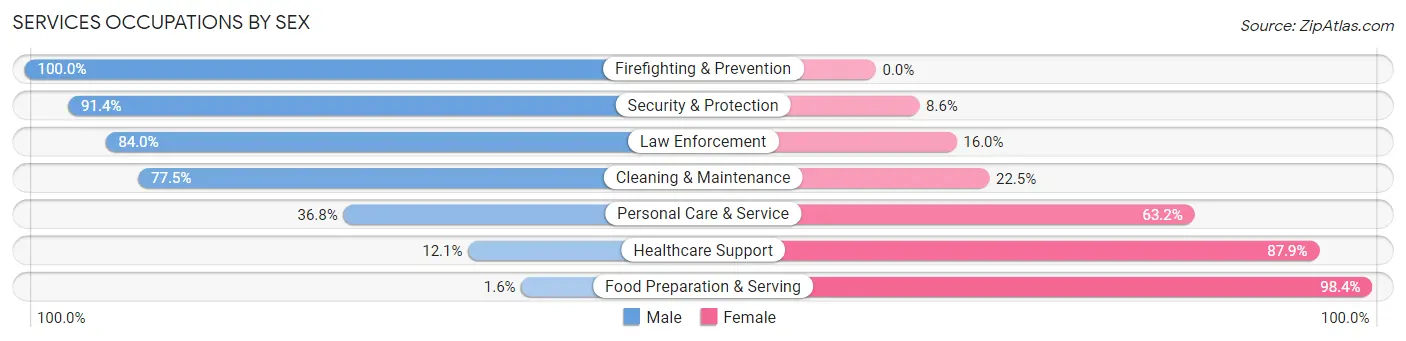
Services Occupations by Sex
Within the Services occupations in Attala County, the most male-oriented occupations are Firefighting & Prevention (100.0%), Security & Protection (91.4%), and Law Enforcement (84.0%), while the most female-oriented occupations are Food Preparation & Serving (98.4%), Healthcare Support (87.9%), and Personal Care & Service (63.2%).
| Occupation | Male | Female |
| Healthcare Support | 46 (12.1%) | 333 (87.9%) |
| Security & Protection | 127 (91.4%) | 12 (8.6%) |
| Firefighting & Prevention | 64 (100.0%) | 0 (0.0%) |
| Law Enforcement | 63 (84.0%) | 12 (16.0%) |
| Food Preparation & Serving | 5 (1.6%) | 304 (98.4%) |
| Cleaning & Maintenance | 331 (77.5%) | 96 (22.5%) |
| Personal Care & Service | 42 (36.8%) | 72 (63.2%) |
| Total (Category) | 551 (40.3%) | 817 (59.7%) |
| Total (Overall) | 3,362 (47.9%) | 3,660 (52.1%) |
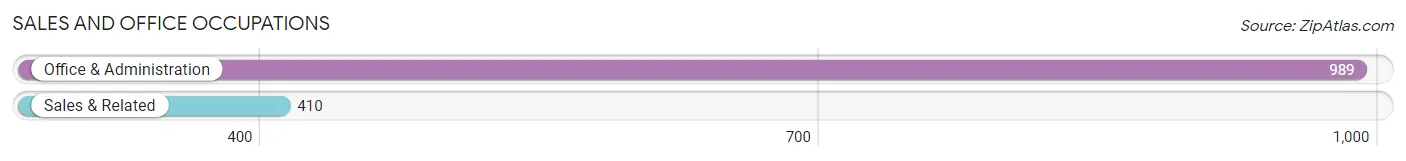
Sales and Office Occupations
The most common Sales and Office occupations in Attala County are Office & Administration (989 | 14.1%), and Sales & Related (410 | 5.8%).
Sales and Office Occupations by Sex
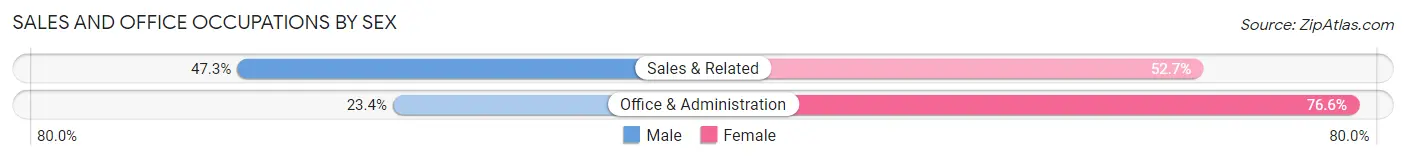
| Occupation | Male | Female |
| Sales & Related | 194 (47.3%) | 216 (52.7%) |
| Office & Administration | 231 (23.4%) | 758 (76.6%) |
| Total (Category) | 425 (30.4%) | 974 (69.6%) |
| Total (Overall) | 3,362 (47.9%) | 3,660 (52.1%) |
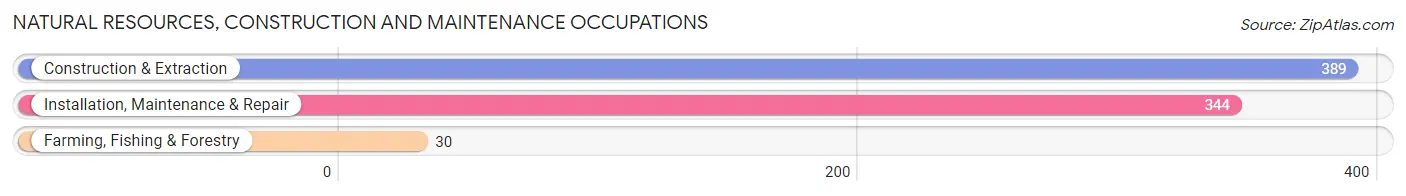
Natural Resources, Construction and Maintenance Occupations
The most common Natural Resources, Construction and Maintenance occupations in Attala County are Construction & Extraction (389 | 5.5%), Installation, Maintenance & Repair (344 | 4.9%), and Farming, Fishing & Forestry (30 | 0.4%).
Natural Resources, Construction and Maintenance Occupations by Sex
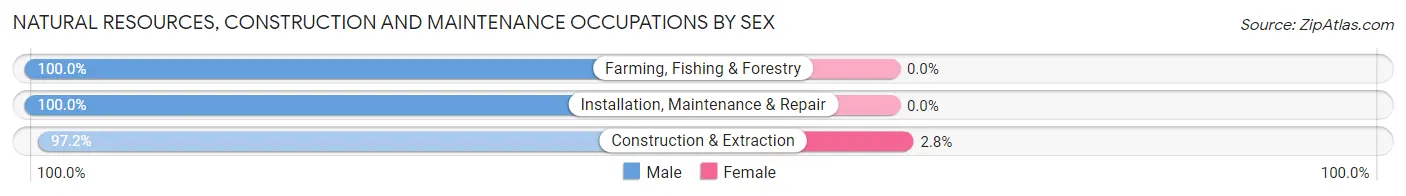
| Occupation | Male | Female |
| Farming, Fishing & Forestry | 30 (100.0%) | 0 (0.0%) |
| Construction & Extraction | 378 (97.2%) | 11 (2.8%) |
| Installation, Maintenance & Repair | 344 (100.0%) | 0 (0.0%) |
| Total (Category) | 752 (98.6%) | 11 (1.4%) |
| Total (Overall) | 3,362 (47.9%) | 3,660 (52.1%) |
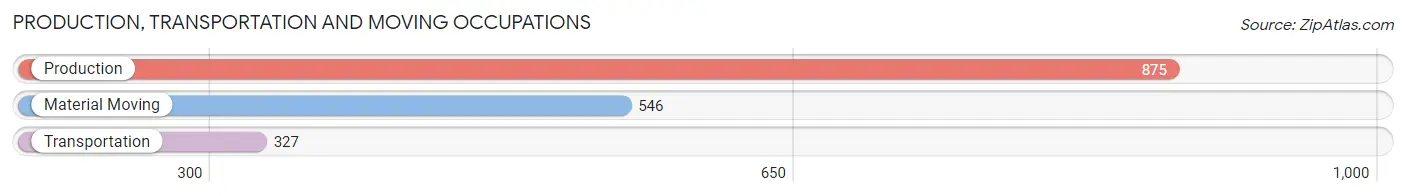
Production, Transportation and Moving Occupations
The most common Production, Transportation and Moving occupations in Attala County are Production (875 | 12.5%), Material Moving (546 | 7.8%), and Transportation (327 | 4.7%).
Production, Transportation and Moving Occupations by Sex
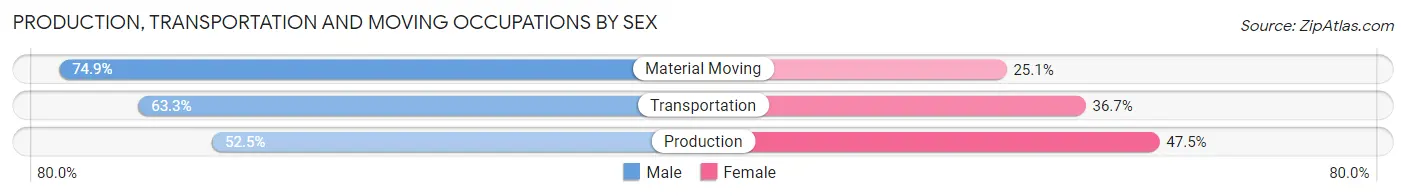
| Occupation | Male | Female |
| Production | 459 (52.5%) | 416 (47.5%) |
| Transportation | 207 (63.3%) | 120 (36.7%) |
| Material Moving | 409 (74.9%) | 137 (25.1%) |
| Total (Category) | 1,075 (61.5%) | 673 (38.5%) |
| Total (Overall) | 3,362 (47.9%) | 3,660 (52.1%) |
Employment Industries by Sex in Attala County
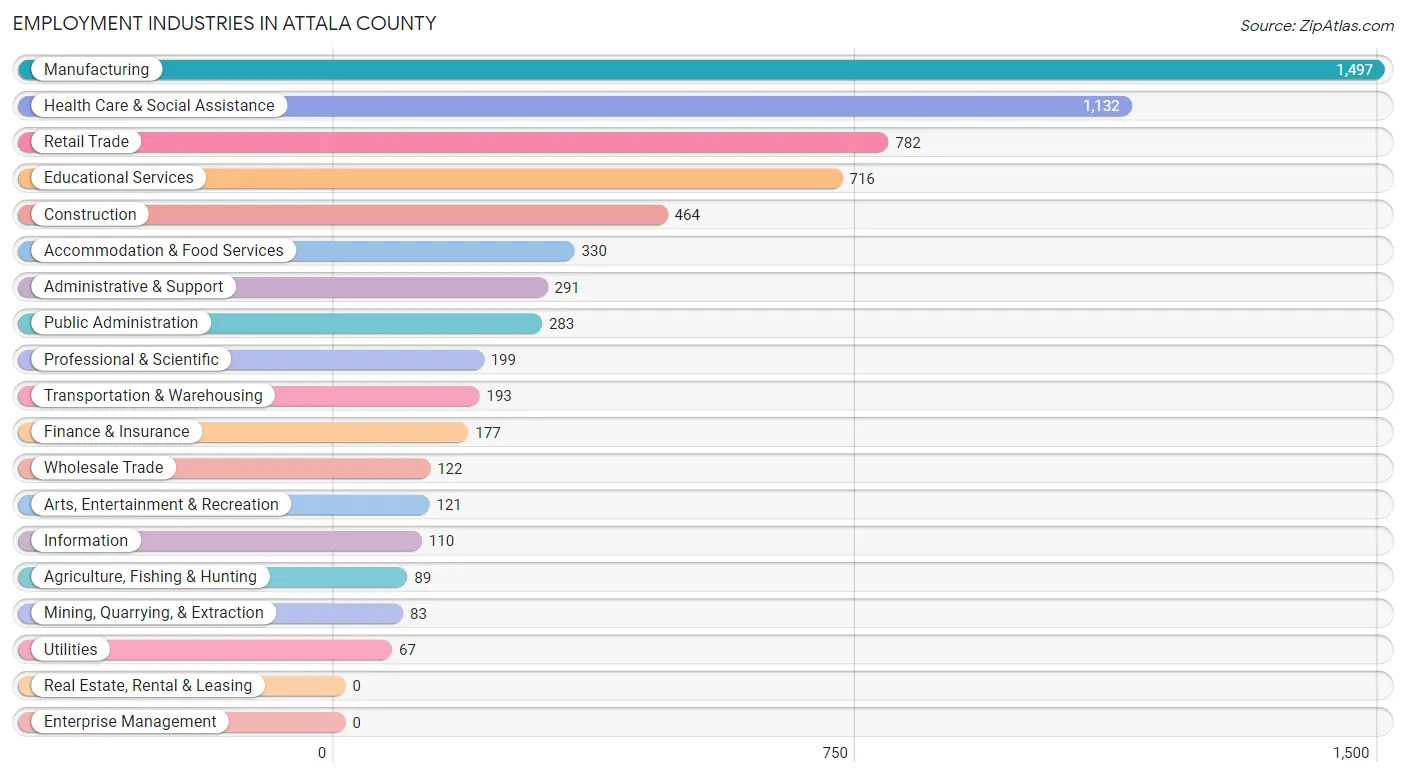
Employment Industries in Attala County
The major employment industries in Attala County include Manufacturing (1,497 | 21.3%), Health Care & Social Assistance (1,132 | 16.1%), Retail Trade (782 | 11.1%), Educational Services (716 | 10.2%), and Construction (464 | 6.6%).
Employment Industries by Sex in Attala County
The Attala County industries that see more men than women are Agriculture, Fishing & Hunting (100.0%), Mining, Quarrying, & Extraction (100.0%), and Utilities (100.0%), whereas the industries that tend to have a higher number of women are Finance & Insurance (96.6%), Health Care & Social Assistance (85.3%), and Accommodation & Food Services (83.9%).
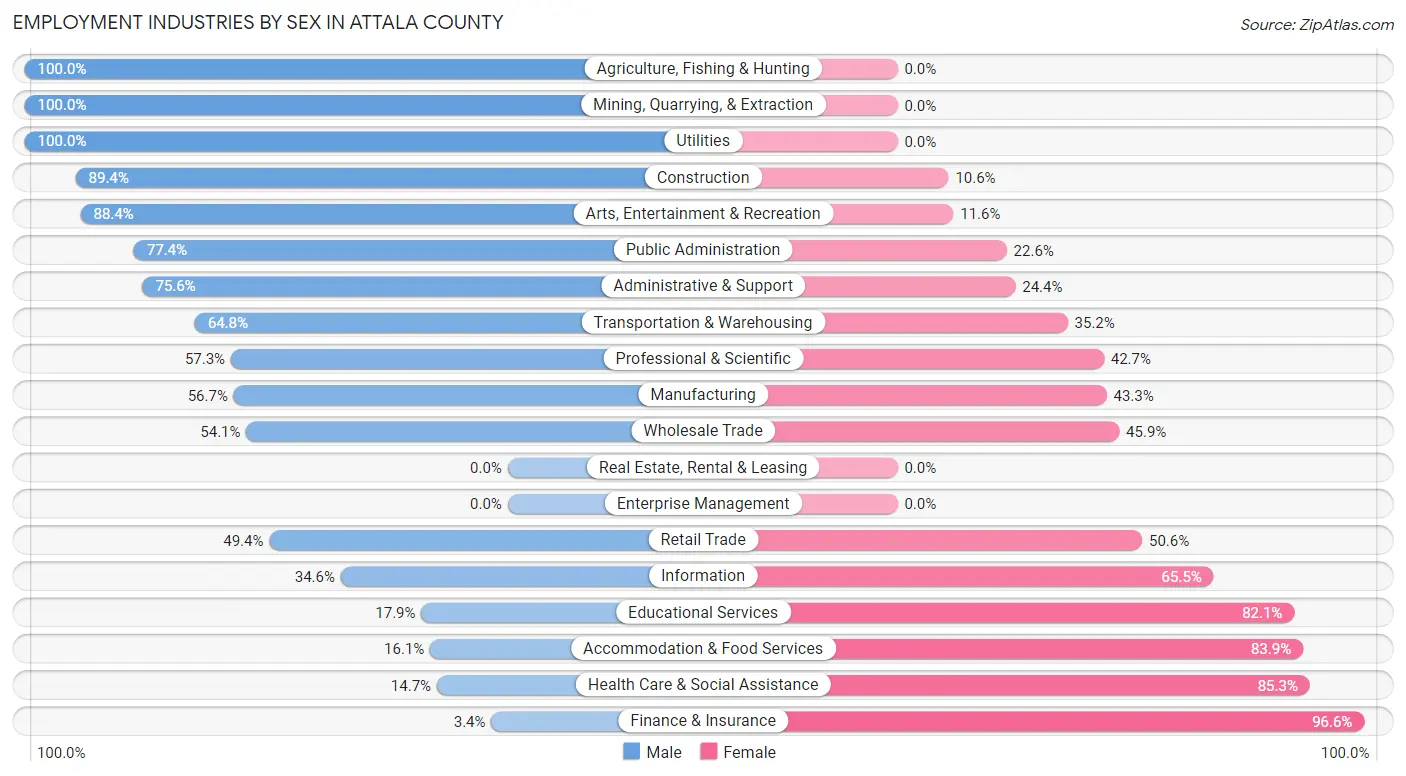
| Industry | Male | Female |
| Agriculture, Fishing & Hunting | 89 (100.0%) | 0 (0.0%) |
| Mining, Quarrying, & Extraction | 83 (100.0%) | 0 (0.0%) |
| Construction | 415 (89.4%) | 49 (10.6%) |
| Manufacturing | 849 (56.7%) | 648 (43.3%) |
| Wholesale Trade | 66 (54.1%) | 56 (45.9%) |
| Retail Trade | 386 (49.4%) | 396 (50.6%) |
| Transportation & Warehousing | 125 (64.8%) | 68 (35.2%) |
| Utilities | 67 (100.0%) | 0 (0.0%) |
| Information | 38 (34.5%) | 72 (65.4%) |
| Finance & Insurance | 6 (3.4%) | 171 (96.6%) |
| Real Estate, Rental & Leasing | 0 (0.0%) | 0 (0.0%) |
| Professional & Scientific | 114 (57.3%) | 85 (42.7%) |
| Enterprise Management | 0 (0.0%) | 0 (0.0%) |
| Administrative & Support | 220 (75.6%) | 71 (24.4%) |
| Educational Services | 128 (17.9%) | 588 (82.1%) |
| Health Care & Social Assistance | 166 (14.7%) | 966 (85.3%) |
| Arts, Entertainment & Recreation | 107 (88.4%) | 14 (11.6%) |
| Accommodation & Food Services | 53 (16.1%) | 277 (83.9%) |
| Public Administration | 219 (77.4%) | 64 (22.6%) |
| Total | 3,362 (47.9%) | 3,660 (52.1%) |
Education in Attala County
School Enrollment in Attala County
The most common levels of schooling among the 4,397 students in Attala County are elementary school (1,200 | 27.3%), high school (1,037 | 23.6%), and middle school (1,011 | 23.0%).
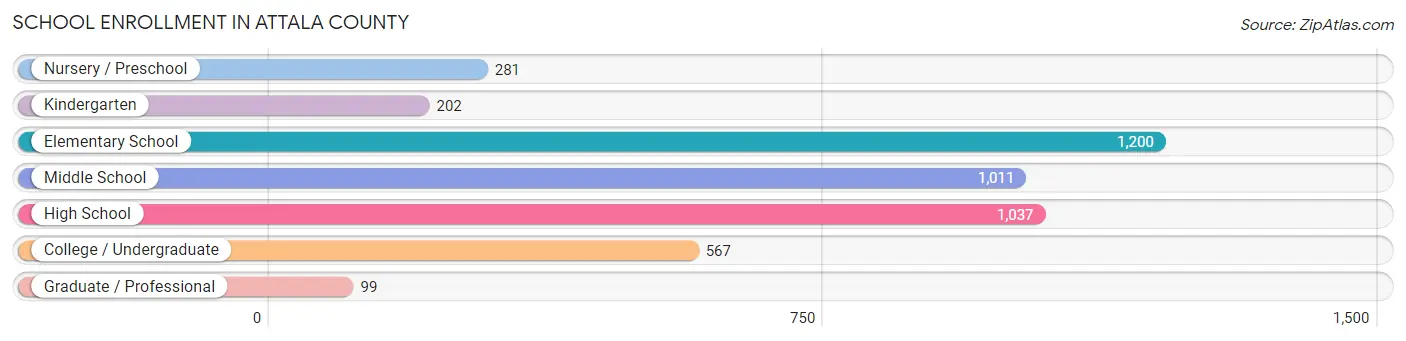
| School Level | # Students | % Students |
| Nursery / Preschool | 281 | 6.4% |
| Kindergarten | 202 | 4.6% |
| Elementary School | 1,200 | 27.3% |
| Middle School | 1,011 | 23.0% |
| High School | 1,037 | 23.6% |
| College / Undergraduate | 567 | 12.9% |
| Graduate / Professional | 99 | 2.2% |
| Total | 4,397 | 100.0% |
School Enrollment by Age by Funding Source in Attala County
Out of a total of 4,397 students who are enrolled in schools in Attala County, 712 (16.2%) attend a private institution, while the remaining 3,685 (83.8%) are enrolled in public schools. The age group of 35 years and over has the highest likelihood of being enrolled in private schools, with 48 (32.0% in the age bracket) enrolled. Conversely, the age group of 15 to 17 year olds has the lowest likelihood of being enrolled in a private school, with 679 (91.5% in the age bracket) attending a public institution.
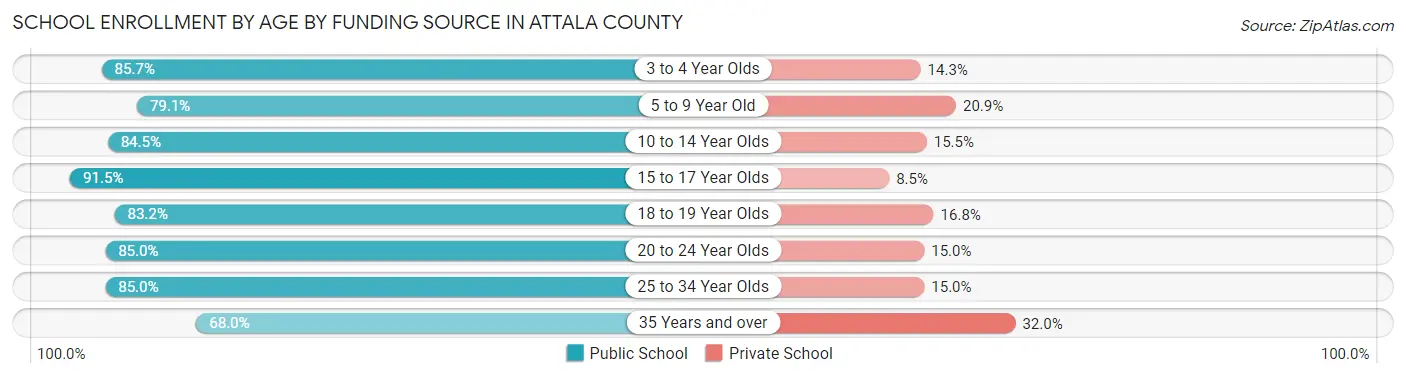
| Age Bracket | Public School | Private School |
| 3 to 4 Year Olds | 215 (85.7%) | 36 (14.3%) |
| 5 to 9 Year Old | 888 (79.1%) | 235 (20.9%) |
| 10 to 14 Year Olds | 1,244 (84.5%) | 228 (15.5%) |
| 15 to 17 Year Olds | 679 (91.5%) | 63 (8.5%) |
| 18 to 19 Year Olds | 144 (83.2%) | 29 (16.8%) |
| 20 to 24 Year Olds | 266 (85.0%) | 47 (15.0%) |
| 25 to 34 Year Olds | 147 (85.0%) | 26 (15.0%) |
| 35 Years and over | 102 (68.0%) | 48 (32.0%) |
| Total | 3,685 (83.8%) | 712 (16.2%) |
Educational Attainment by Field of Study in Attala County
Education (710 | 36.4%), business (433 | 22.2%), science & technology (243 | 12.4%), arts & humanities (125 | 6.4%), and bio, nature & agricultural (100 | 5.1%) are the most common fields of study among 1,952 individuals in Attala County who have obtained a bachelor's degree or higher.
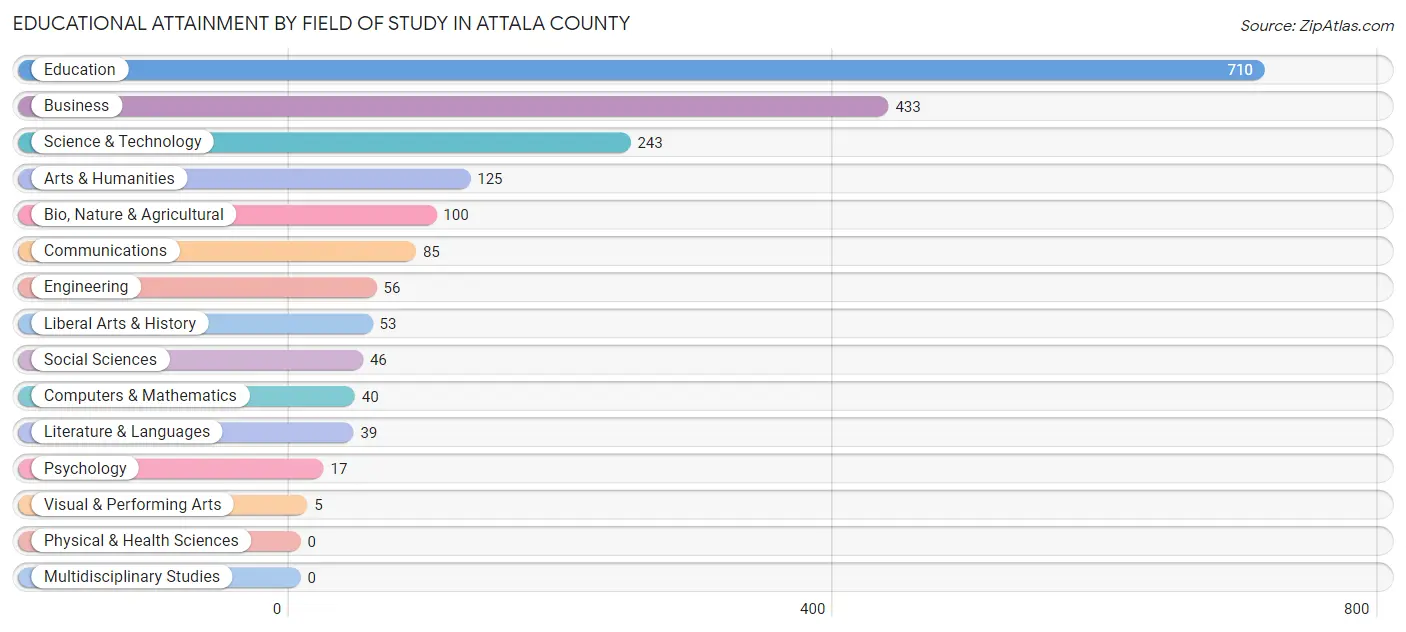
| Field of Study | # Graduates | % Graduates |
| Computers & Mathematics | 40 | 2.1% |
| Bio, Nature & Agricultural | 100 | 5.1% |
| Physical & Health Sciences | 0 | 0.0% |
| Psychology | 17 | 0.9% |
| Social Sciences | 46 | 2.4% |
| Engineering | 56 | 2.9% |
| Multidisciplinary Studies | 0 | 0.0% |
| Science & Technology | 243 | 12.4% |
| Business | 433 | 22.2% |
| Education | 710 | 36.4% |
| Literature & Languages | 39 | 2.0% |
| Liberal Arts & History | 53 | 2.7% |
| Visual & Performing Arts | 5 | 0.3% |
| Communications | 85 | 4.3% |
| Arts & Humanities | 125 | 6.4% |
| Total | 1,952 | 100.0% |
Transportation & Commute in Attala County
Vehicle Availability by Sex in Attala County
The most prevalent vehicle ownership categories in Attala County are males with 2 vehicles (1,271, accounting for 38.7%) and females with 2 vehicles (1,024, making up 35.3%).
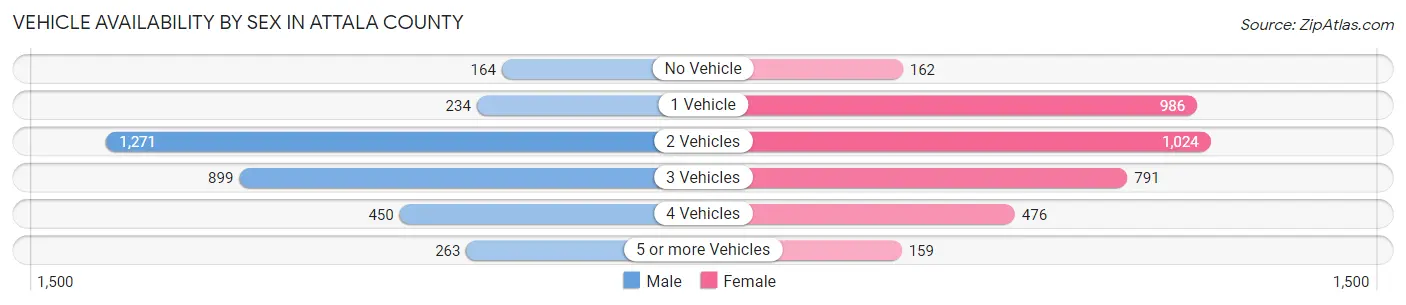
| Vehicles Available | Male | Female |
| No Vehicle | 164 (5.0%) | 162 (4.5%) |
| 1 Vehicle | 234 (7.1%) | 986 (27.4%) |
| 2 Vehicles | 1,271 (38.7%) | 1,024 (28.5%) |
| 3 Vehicles | 899 (27.4%) | 791 (22.0%) |
| 4 Vehicles | 450 (13.7%) | 476 (13.2%) |
| 5 or more Vehicles | 263 (8.0%) | 159 (4.4%) |
| Total | 3,281 (100.0%) | 3,598 (100.0%) |
Commute Time in Attala County
The most frequently occuring commute durations in Attala County are 20 to 24 minutes (1,199 commuters, 17.9%), 10 to 14 minutes (834 commuters, 12.4%), and 5 to 9 minutes (795 commuters, 11.8%).
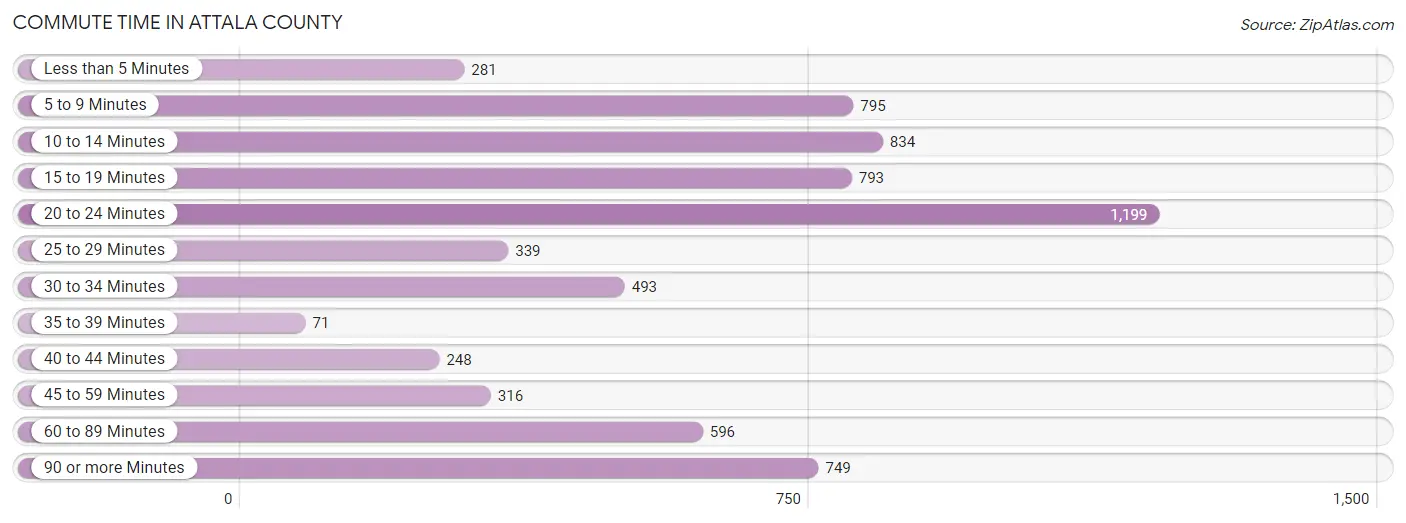
| Commute Time | # Commuters | % Commuters |
| Less than 5 Minutes | 281 | 4.2% |
| 5 to 9 Minutes | 795 | 11.8% |
| 10 to 14 Minutes | 834 | 12.4% |
| 15 to 19 Minutes | 793 | 11.8% |
| 20 to 24 Minutes | 1,199 | 17.9% |
| 25 to 29 Minutes | 339 | 5.1% |
| 30 to 34 Minutes | 493 | 7.3% |
| 35 to 39 Minutes | 71 | 1.1% |
| 40 to 44 Minutes | 248 | 3.7% |
| 45 to 59 Minutes | 316 | 4.7% |
| 60 to 89 Minutes | 596 | 8.9% |
| 90 or more Minutes | 749 | 11.2% |
Commute Time by Sex in Attala County
The most common commute times in Attala County are 10 to 14 minutes (471 commuters, 14.8%) for males and 20 to 24 minutes (767 commuters, 21.7%) for females.
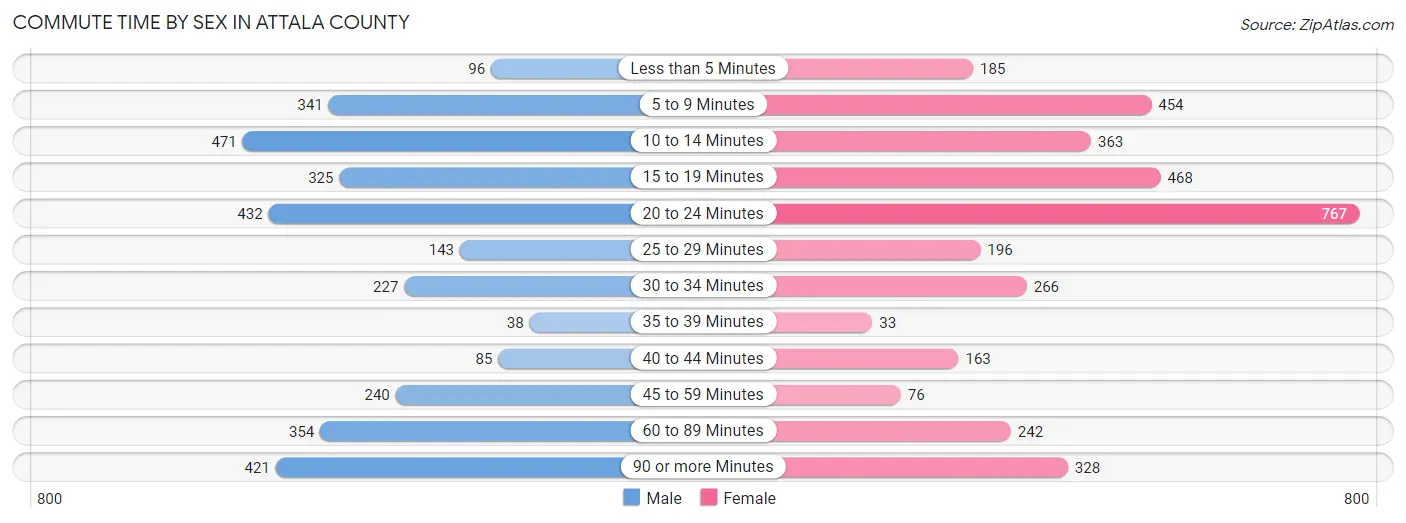
| Commute Time | Male | Female |
| Less than 5 Minutes | 96 (3.0%) | 185 (5.2%) |
| 5 to 9 Minutes | 341 (10.7%) | 454 (12.8%) |
| 10 to 14 Minutes | 471 (14.8%) | 363 (10.2%) |
| 15 to 19 Minutes | 325 (10.2%) | 468 (13.2%) |
| 20 to 24 Minutes | 432 (13.6%) | 767 (21.7%) |
| 25 to 29 Minutes | 143 (4.5%) | 196 (5.5%) |
| 30 to 34 Minutes | 227 (7.1%) | 266 (7.5%) |
| 35 to 39 Minutes | 38 (1.2%) | 33 (0.9%) |
| 40 to 44 Minutes | 85 (2.7%) | 163 (4.6%) |
| 45 to 59 Minutes | 240 (7.6%) | 76 (2.1%) |
| 60 to 89 Minutes | 354 (11.2%) | 242 (6.8%) |
| 90 or more Minutes | 421 (13.3%) | 328 (9.3%) |
Time of Departure to Work by Sex in Attala County
The most frequent times of departure to work in Attala County are 7:00 AM to 7:29 AM (677, 21.3%) for males and 7:00 AM to 7:29 AM (841, 23.7%) for females.
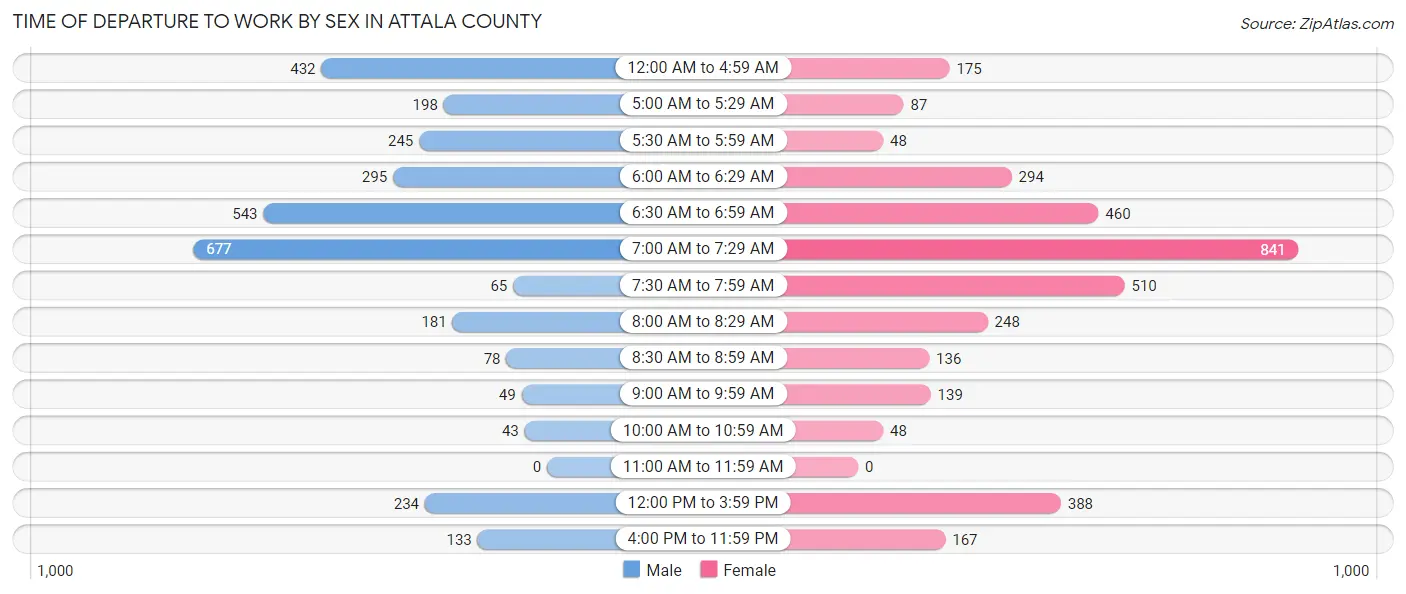
| Time of Departure | Male | Female |
| 12:00 AM to 4:59 AM | 432 (13.6%) | 175 (4.9%) |
| 5:00 AM to 5:29 AM | 198 (6.2%) | 87 (2.5%) |
| 5:30 AM to 5:59 AM | 245 (7.7%) | 48 (1.4%) |
| 6:00 AM to 6:29 AM | 295 (9.3%) | 294 (8.3%) |
| 6:30 AM to 6:59 AM | 543 (17.1%) | 460 (13.0%) |
| 7:00 AM to 7:29 AM | 677 (21.3%) | 841 (23.7%) |
| 7:30 AM to 7:59 AM | 65 (2.1%) | 510 (14.4%) |
| 8:00 AM to 8:29 AM | 181 (5.7%) | 248 (7.0%) |
| 8:30 AM to 8:59 AM | 78 (2.5%) | 136 (3.8%) |
| 9:00 AM to 9:59 AM | 49 (1.5%) | 139 (3.9%) |
| 10:00 AM to 10:59 AM | 43 (1.4%) | 48 (1.4%) |
| 11:00 AM to 11:59 AM | 0 (0.0%) | 0 (0.0%) |
| 12:00 PM to 3:59 PM | 234 (7.4%) | 388 (11.0%) |
| 4:00 PM to 11:59 PM | 133 (4.2%) | 167 (4.7%) |
| Total | 3,173 (100.0%) | 3,541 (100.0%) |
Housing Occupancy in Attala County
Occupancy by Ownership in Attala County
Of the total 6,311 dwellings in Attala County, owner-occupied units account for 4,746 (75.2%), while renter-occupied units make up 1,565 (24.8%).
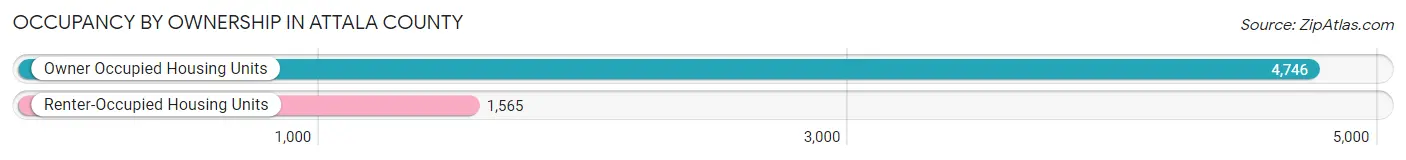
| Occupancy | # Housing Units | % Housing Units |
| Owner Occupied Housing Units | 4,746 | 75.2% |
| Renter-Occupied Housing Units | 1,565 | 24.8% |
| Total Occupied Housing Units | 6,311 | 100.0% |
Occupancy by Household Size in Attala County
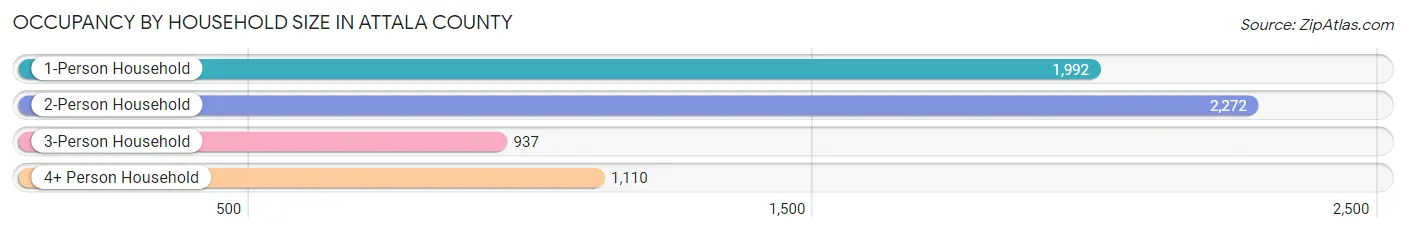
| Household Size | # Housing Units | % Housing Units |
| 1-Person Household | 1,992 | 31.6% |
| 2-Person Household | 2,272 | 36.0% |
| 3-Person Household | 937 | 14.8% |
| 4+ Person Household | 1,110 | 17.6% |
| Total Housing Units | 6,311 | 100.0% |
Occupancy by Ownership by Household Size in Attala County
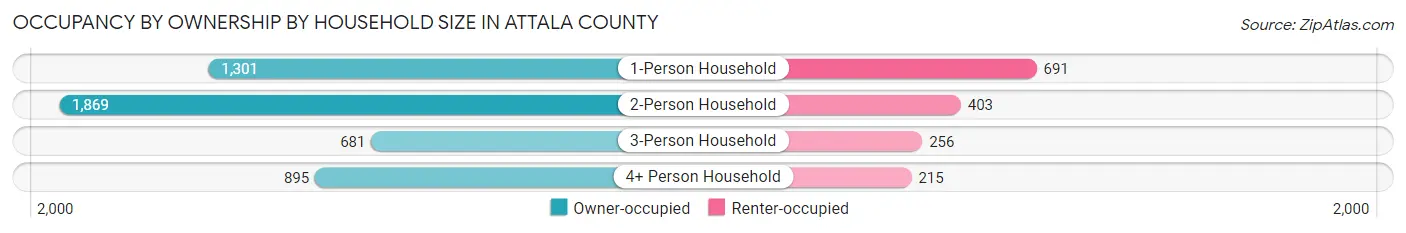
| Household Size | Owner-occupied | Renter-occupied |
| 1-Person Household | 1,301 (65.3%) | 691 (34.7%) |
| 2-Person Household | 1,869 (82.3%) | 403 (17.7%) |
| 3-Person Household | 681 (72.7%) | 256 (27.3%) |
| 4+ Person Household | 895 (80.6%) | 215 (19.4%) |
| Total Housing Units | 4,746 (75.2%) | 1,565 (24.8%) |
Occupancy by Educational Attainment in Attala County
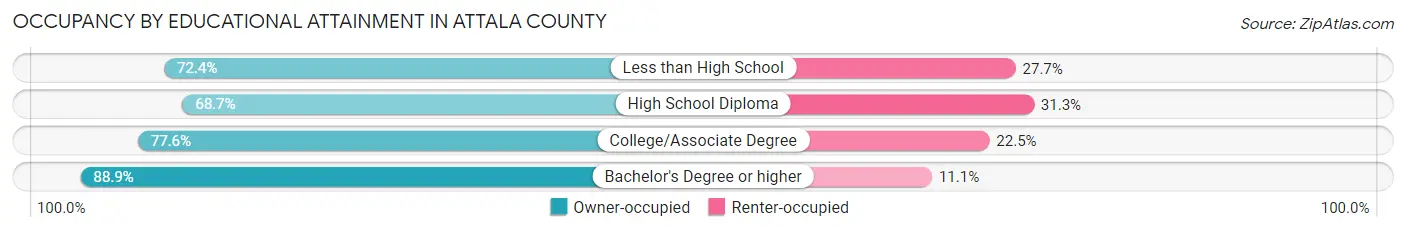
| Household Size | Owner-occupied | Renter-occupied |
| Less than High School | 717 (72.4%) | 274 (27.7%) |
| High School Diploma | 1,620 (68.7%) | 737 (31.3%) |
| College/Associate Degree | 1,541 (77.5%) | 446 (22.5%) |
| Bachelor's Degree or higher | 868 (88.9%) | 108 (11.1%) |
Occupancy by Age of Householder in Attala County
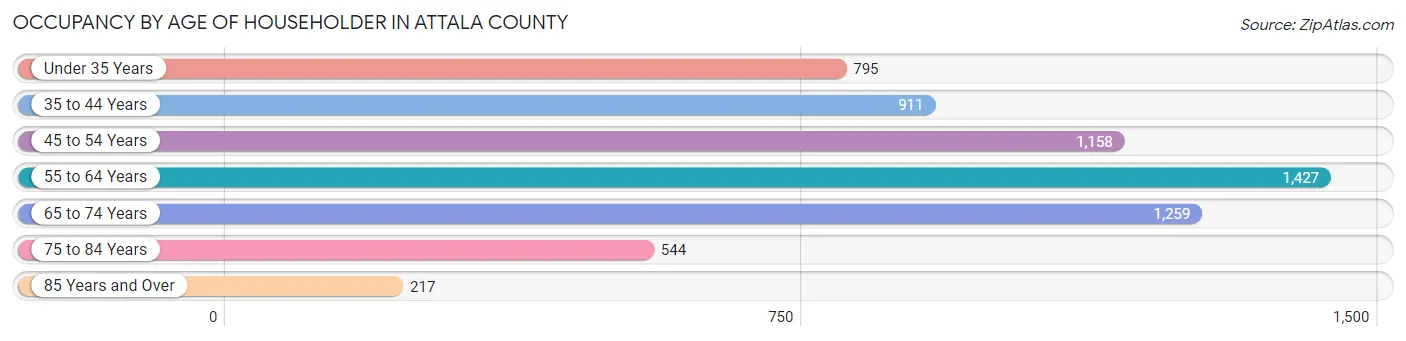
| Age Bracket | # Households | % Households |
| Under 35 Years | 795 | 12.6% |
| 35 to 44 Years | 911 | 14.4% |
| 45 to 54 Years | 1,158 | 18.3% |
| 55 to 64 Years | 1,427 | 22.6% |
| 65 to 74 Years | 1,259 | 20.0% |
| 75 to 84 Years | 544 | 8.6% |
| 85 Years and Over | 217 | 3.4% |
| Total | 6,311 | 100.0% |
Housing Finances in Attala County
Median Income by Occupancy in Attala County
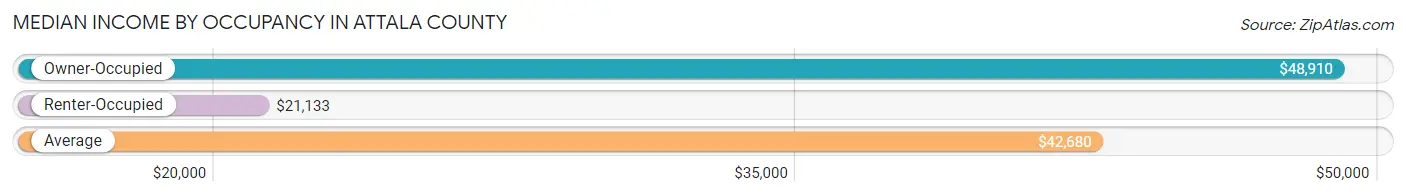
| Occupancy Type | # Households | Median Income |
| Owner-Occupied | 4,746 (75.2%) | $48,910 |
| Renter-Occupied | 1,565 (24.8%) | $21,133 |
| Average | 6,311 (100.0%) | $42,680 |
Occupancy by Householder Income Bracket in Attala County
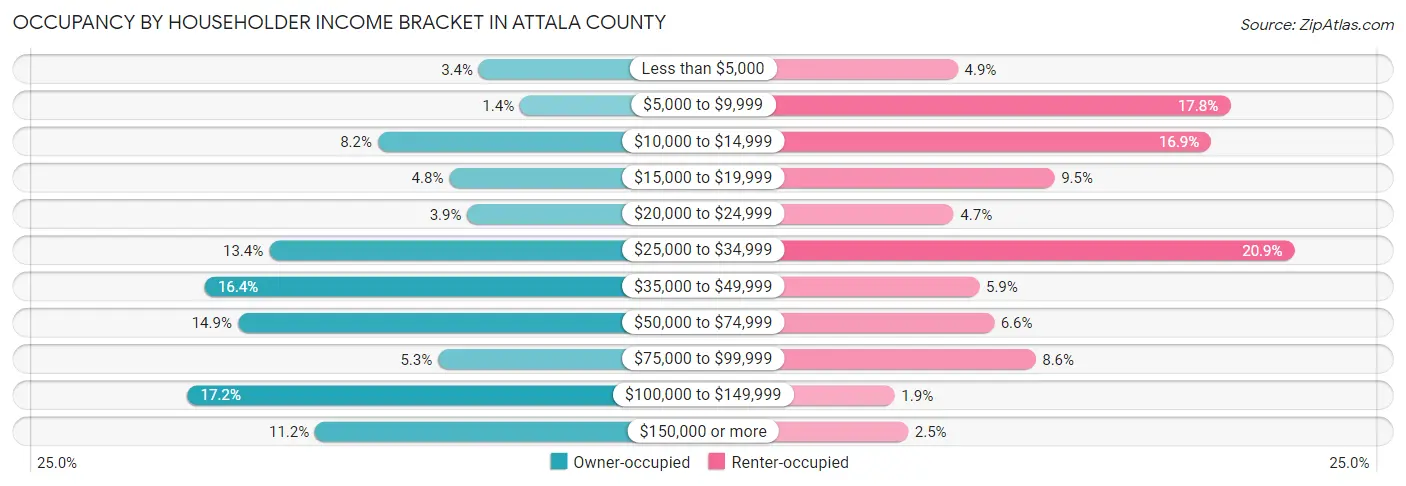
| Income Bracket | Owner-occupied | Renter-occupied |
| Less than $5,000 | 160 (3.4%) | 76 (4.9%) |
| $5,000 to $9,999 | 67 (1.4%) | 279 (17.8%) |
| $10,000 to $14,999 | 388 (8.2%) | 265 (16.9%) |
| $15,000 to $19,999 | 227 (4.8%) | 148 (9.5%) |
| $20,000 to $24,999 | 186 (3.9%) | 73 (4.7%) |
| $25,000 to $34,999 | 634 (13.4%) | 327 (20.9%) |
| $35,000 to $49,999 | 779 (16.4%) | 92 (5.9%) |
| $50,000 to $74,999 | 705 (14.8%) | 103 (6.6%) |
| $75,000 to $99,999 | 252 (5.3%) | 134 (8.6%) |
| $100,000 to $149,999 | 818 (17.2%) | 29 (1.8%) |
| $150,000 or more | 530 (11.2%) | 39 (2.5%) |
| Total | 4,746 (100.0%) | 1,565 (100.0%) |
Monthly Housing Cost Tiers in Attala County
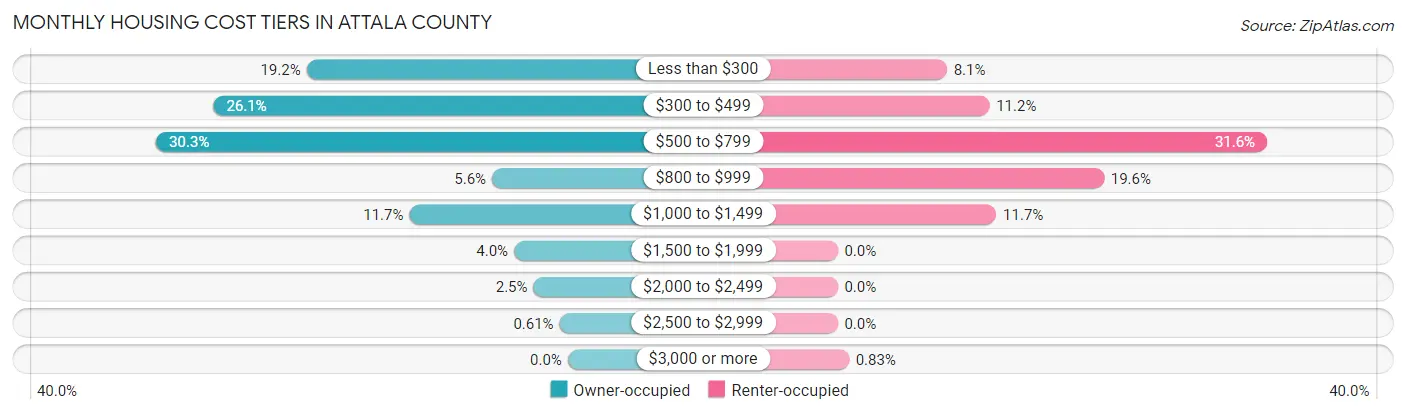
| Monthly Cost | Owner-occupied | Renter-occupied |
| Less than $300 | 913 (19.2%) | 126 (8.1%) |
| $300 to $499 | 1,238 (26.1%) | 175 (11.2%) |
| $500 to $799 | 1,439 (30.3%) | 495 (31.6%) |
| $800 to $999 | 265 (5.6%) | 307 (19.6%) |
| $1,000 to $1,499 | 554 (11.7%) | 183 (11.7%) |
| $1,500 to $1,999 | 188 (4.0%) | 0 (0.0%) |
| $2,000 to $2,499 | 120 (2.5%) | 0 (0.0%) |
| $2,500 to $2,999 | 29 (0.6%) | 0 (0.0%) |
| $3,000 or more | 0 (0.0%) | 13 (0.8%) |
| Total | 4,746 (100.0%) | 1,565 (100.0%) |
Physical Housing Characteristics in Attala County
Housing Structures in Attala County
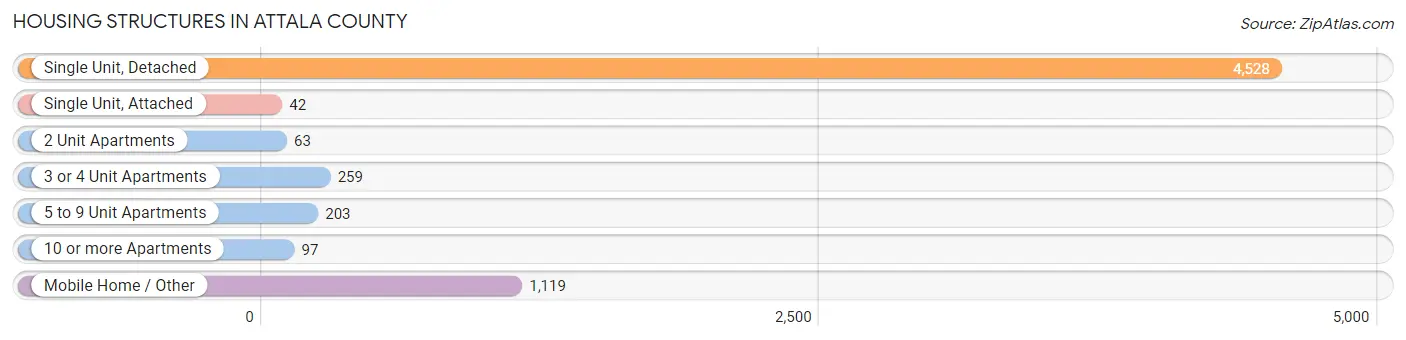
| Structure Type | # Housing Units | % Housing Units |
| Single Unit, Detached | 4,528 | 71.8% |
| Single Unit, Attached | 42 | 0.7% |
| 2 Unit Apartments | 63 | 1.0% |
| 3 or 4 Unit Apartments | 259 | 4.1% |
| 5 to 9 Unit Apartments | 203 | 3.2% |
| 10 or more Apartments | 97 | 1.5% |
| Mobile Home / Other | 1,119 | 17.7% |
| Total | 6,311 | 100.0% |
Housing Structures by Occupancy in Attala County
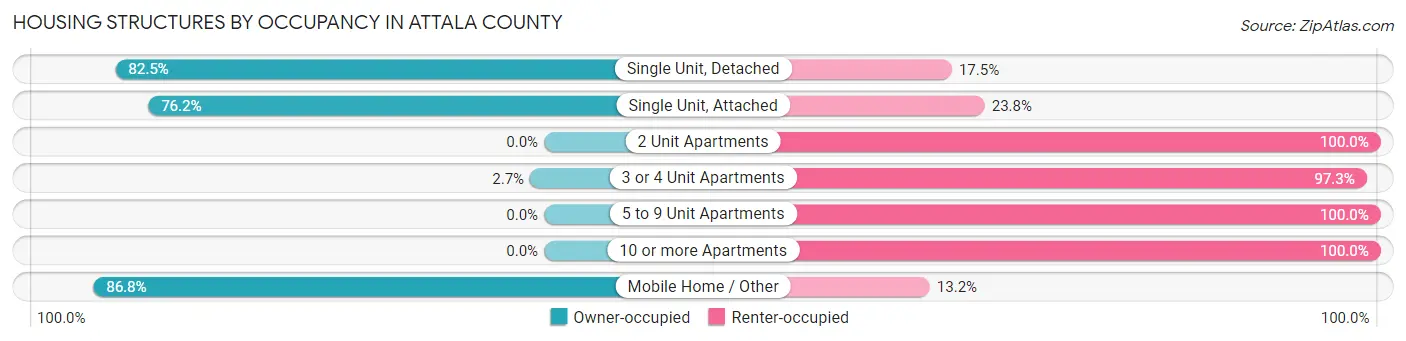
| Structure Type | Owner-occupied | Renter-occupied |
| Single Unit, Detached | 3,736 (82.5%) | 792 (17.5%) |
| Single Unit, Attached | 32 (76.2%) | 10 (23.8%) |
| 2 Unit Apartments | 0 (0.0%) | 63 (100.0%) |
| 3 or 4 Unit Apartments | 7 (2.7%) | 252 (97.3%) |
| 5 to 9 Unit Apartments | 0 (0.0%) | 203 (100.0%) |
| 10 or more Apartments | 0 (0.0%) | 97 (100.0%) |
| Mobile Home / Other | 971 (86.8%) | 148 (13.2%) |
| Total | 4,746 (75.2%) | 1,565 (24.8%) |
Housing Structures by Number of Rooms in Attala County
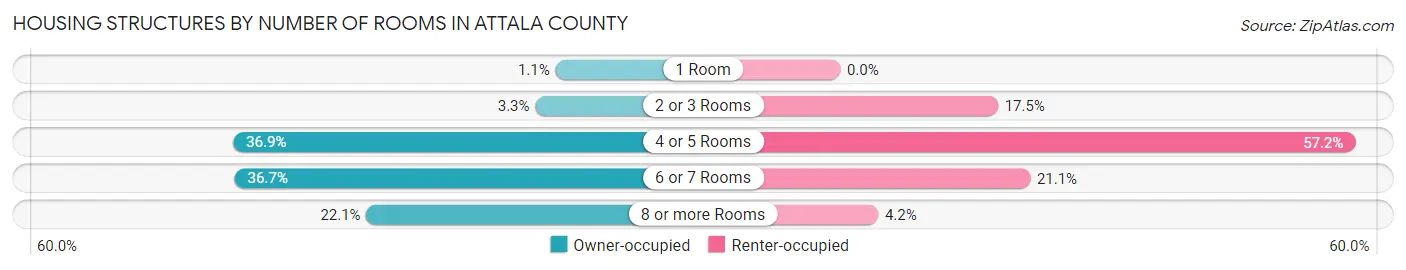
| Number of Rooms | Owner-occupied | Renter-occupied |
| 1 Room | 51 (1.1%) | 0 (0.0%) |
| 2 or 3 Rooms | 157 (3.3%) | 274 (17.5%) |
| 4 or 5 Rooms | 1,749 (36.8%) | 895 (57.2%) |
| 6 or 7 Rooms | 1,742 (36.7%) | 330 (21.1%) |
| 8 or more Rooms | 1,047 (22.1%) | 66 (4.2%) |
| Total | 4,746 (100.0%) | 1,565 (100.0%) |
Housing Structure by Heating Type in Attala County
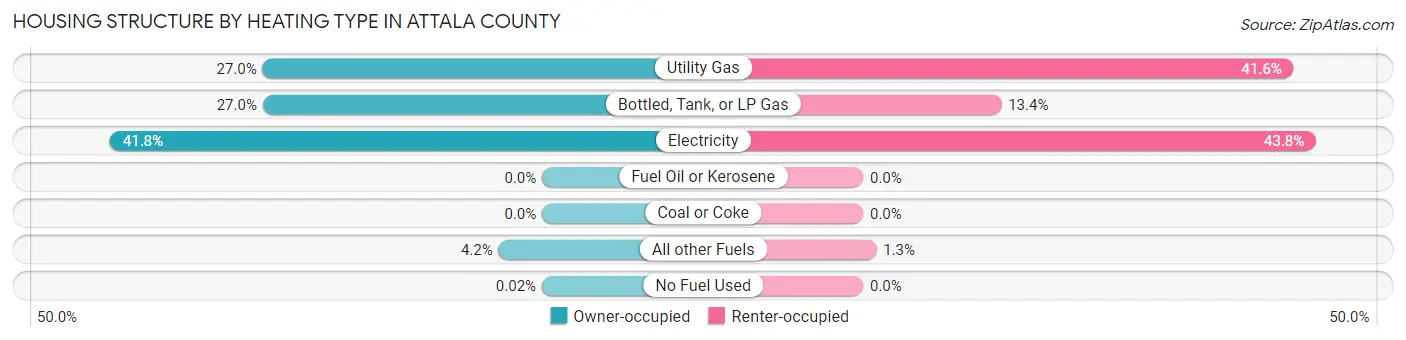
| Heating Type | Owner-occupied | Renter-occupied |
| Utility Gas | 1,282 (27.0%) | 651 (41.6%) |
| Bottled, Tank, or LP Gas | 1,281 (27.0%) | 209 (13.4%) |
| Electricity | 1,982 (41.8%) | 685 (43.8%) |
| Fuel Oil or Kerosene | 0 (0.0%) | 0 (0.0%) |
| Coal or Coke | 0 (0.0%) | 0 (0.0%) |
| All other Fuels | 200 (4.2%) | 20 (1.3%) |
| No Fuel Used | 1 (0.0%) | 0 (0.0%) |
| Total | 4,746 (100.0%) | 1,565 (100.0%) |
Household Vehicle Usage in Attala County
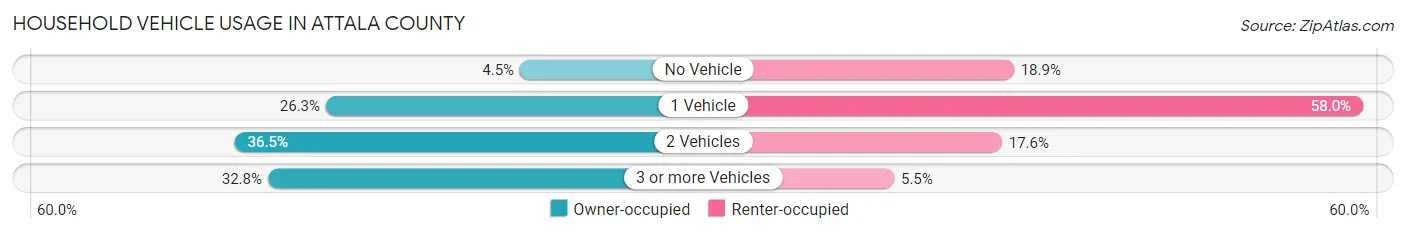
| Vehicles per Household | Owner-occupied | Renter-occupied |
| No Vehicle | 214 (4.5%) | 296 (18.9%) |
| 1 Vehicle | 1,246 (26.3%) | 908 (58.0%) |
| 2 Vehicles | 1,731 (36.5%) | 275 (17.6%) |
| 3 or more Vehicles | 1,555 (32.8%) | 86 (5.5%) |
| Total | 4,746 (100.0%) | 1,565 (100.0%) |
Real Estate & Mortgages in Attala County
Real Estate and Mortgage Overview in Attala County
| Characteristic | Without Mortgage | With Mortgage |
| Housing Units | 3,117 | 1,629 |
| Median Property Value | $89,300 | $123,200 |
| Median Household Income | $46,921 | $260 |
| Monthly Housing Costs | $394 | $0 |
| Real Estate Taxes | $594 | $393 |
Property Value by Mortgage Status in Attala County
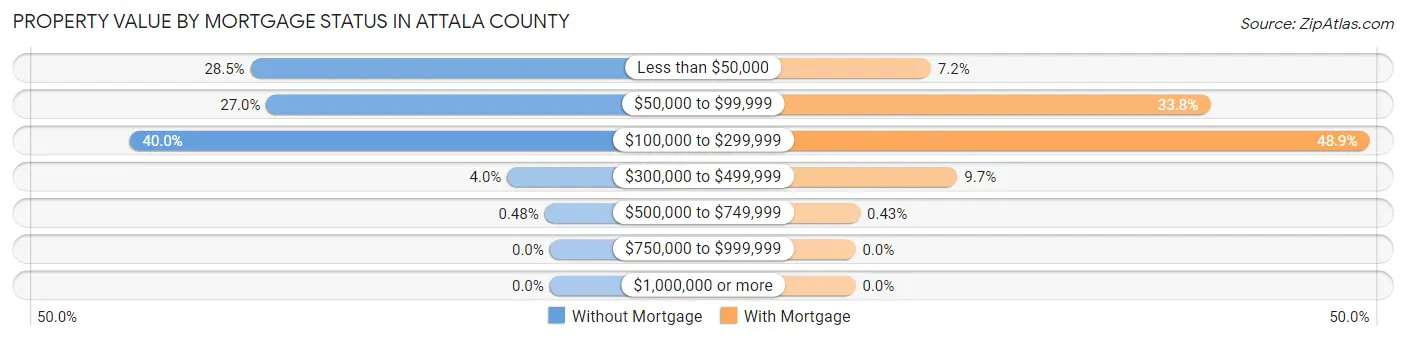
| Property Value | Without Mortgage | With Mortgage |
| Less than $50,000 | 888 (28.5%) | 117 (7.2%) |
| $50,000 to $99,999 | 841 (27.0%) | 550 (33.8%) |
| $100,000 to $299,999 | 1,247 (40.0%) | 797 (48.9%) |
| $300,000 to $499,999 | 126 (4.0%) | 158 (9.7%) |
| $500,000 to $749,999 | 15 (0.5%) | 7 (0.4%) |
| $750,000 to $999,999 | 0 (0.0%) | 0 (0.0%) |
| $1,000,000 or more | 0 (0.0%) | 0 (0.0%) |
| Total | 3,117 (100.0%) | 1,629 (100.0%) |
Household Income by Mortgage Status in Attala County
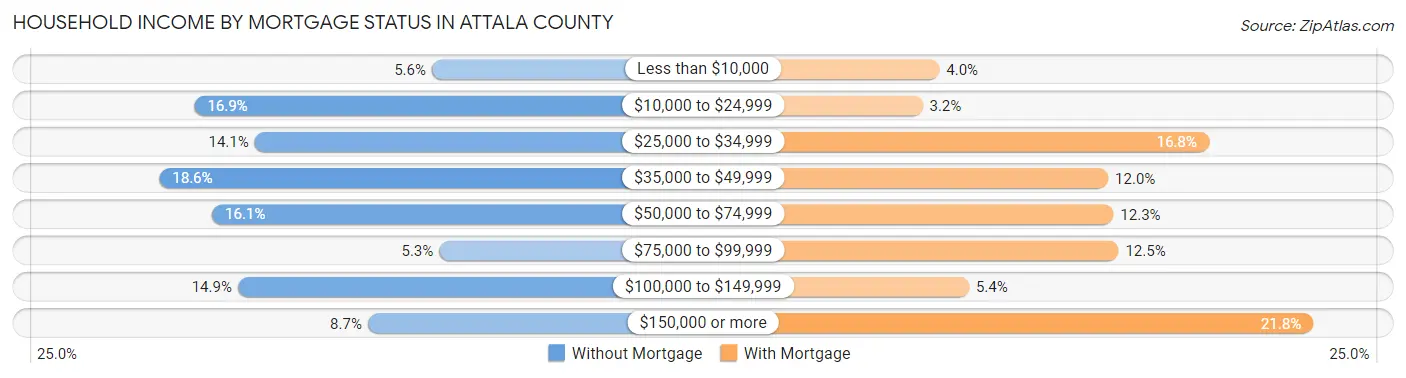
| Household Income | Without Mortgage | With Mortgage |
| Less than $10,000 | 175 (5.6%) | 65 (4.0%) |
| $10,000 to $24,999 | 527 (16.9%) | 52 (3.2%) |
| $25,000 to $34,999 | 438 (14.1%) | 274 (16.8%) |
| $35,000 to $49,999 | 579 (18.6%) | 196 (12.0%) |
| $50,000 to $74,999 | 501 (16.1%) | 200 (12.3%) |
| $75,000 to $99,999 | 164 (5.3%) | 204 (12.5%) |
| $100,000 to $149,999 | 463 (14.8%) | 88 (5.4%) |
| $150,000 or more | 270 (8.7%) | 355 (21.8%) |
| Total | 3,117 (100.0%) | 1,629 (100.0%) |
Property Value to Household Income Ratio in Attala County
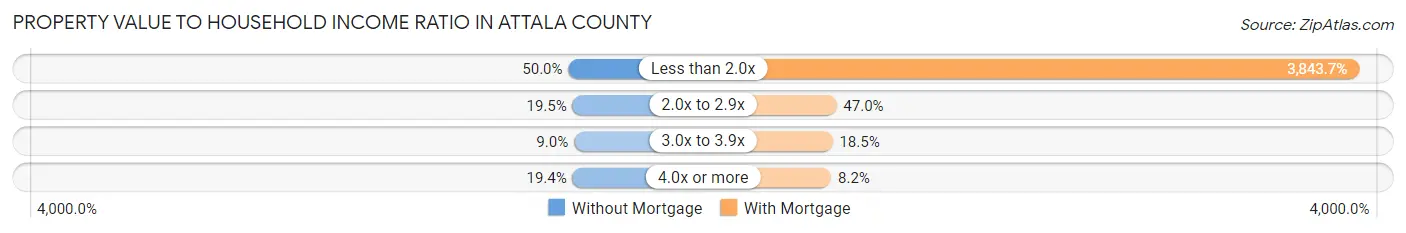
| Value-to-Income Ratio | Without Mortgage | With Mortgage |
| Less than 2.0x | 1,558 (50.0%) | 62,614 (3,843.7%) |
| 2.0x to 2.9x | 609 (19.5%) | 766 (47.0%) |
| 3.0x to 3.9x | 279 (8.9%) | 302 (18.5%) |
| 4.0x or more | 605 (19.4%) | 134 (8.2%) |
| Total | 3,117 (100.0%) | 1,629 (100.0%) |
Real Estate Taxes by Mortgage Status in Attala County
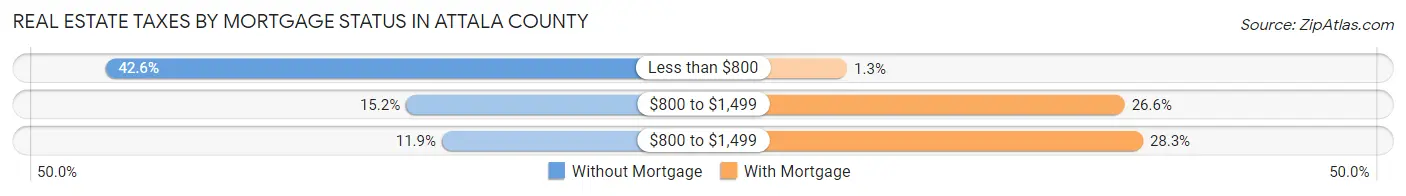
| Property Taxes | Without Mortgage | With Mortgage |
| Less than $800 | 1,328 (42.6%) | 21 (1.3%) |
| $800 to $1,499 | 473 (15.2%) | 434 (26.6%) |
| $800 to $1,499 | 371 (11.9%) | 461 (28.3%) |
| Total | 3,117 (100.0%) | 1,629 (100.0%) |
Health & Disability in Attala County
Health Insurance Coverage by Age in Attala County
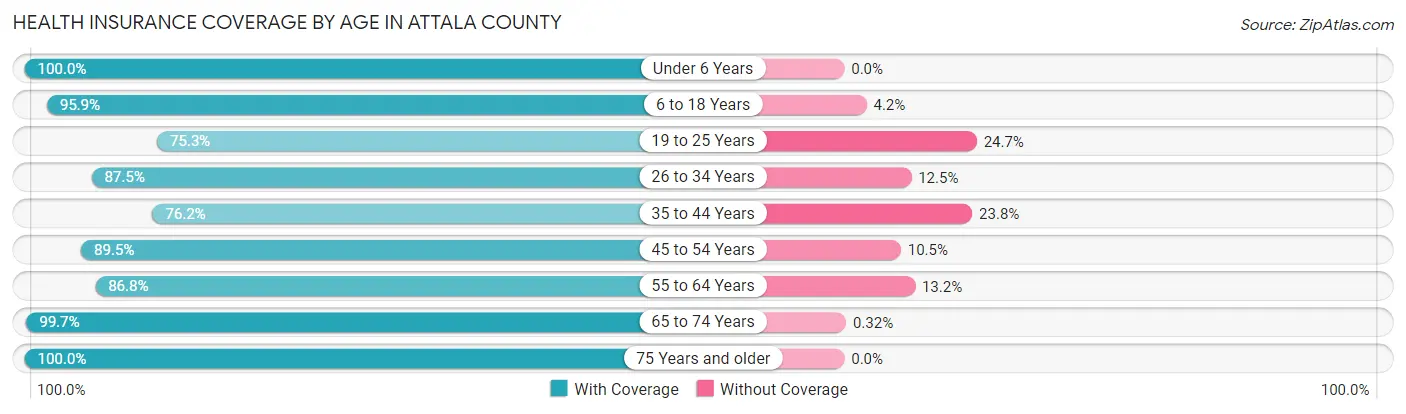
| Age Bracket | With Coverage | Without Coverage |
| Under 6 Years | 1,251 (100.0%) | 0 (0.0%) |
| 6 to 18 Years | 3,420 (95.9%) | 148 (4.2%) |
| 19 to 25 Years | 1,165 (75.3%) | 382 (24.7%) |
| 26 to 34 Years | 1,382 (87.5%) | 197 (12.5%) |
| 35 to 44 Years | 1,559 (76.2%) | 488 (23.8%) |
| 45 to 54 Years | 1,861 (89.5%) | 219 (10.5%) |
| 55 to 64 Years | 1,977 (86.8%) | 300 (13.2%) |
| 65 to 74 Years | 1,889 (99.7%) | 6 (0.3%) |
| 75 Years and older | 1,250 (100.0%) | 0 (0.0%) |
| Total | 15,754 (90.0%) | 1,740 (10.0%) |
Health Insurance Coverage by Citizenship Status in Attala County
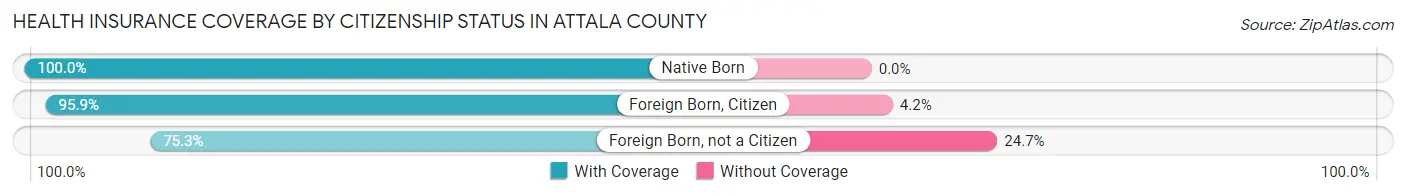
| Citizenship Status | With Coverage | Without Coverage |
| Native Born | 1,251 (100.0%) | 0 (0.0%) |
| Foreign Born, Citizen | 3,420 (95.9%) | 148 (4.2%) |
| Foreign Born, not a Citizen | 1,165 (75.3%) | 382 (24.7%) |
Health Insurance Coverage by Household Income in Attala County
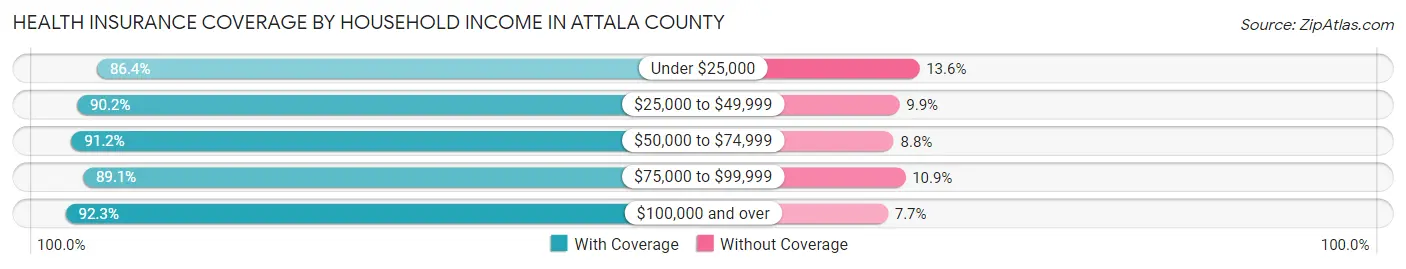
| Household Income | With Coverage | Without Coverage |
| Under $25,000 | 3,191 (86.4%) | 501 (13.6%) |
| $25,000 to $49,999 | 4,266 (90.1%) | 466 (9.9%) |
| $50,000 to $74,999 | 2,019 (91.2%) | 194 (8.8%) |
| $75,000 to $99,999 | 1,237 (89.1%) | 152 (10.9%) |
| $100,000 and over | 5,014 (92.3%) | 417 (7.7%) |
Public vs Private Health Insurance Coverage by Age in Attala County
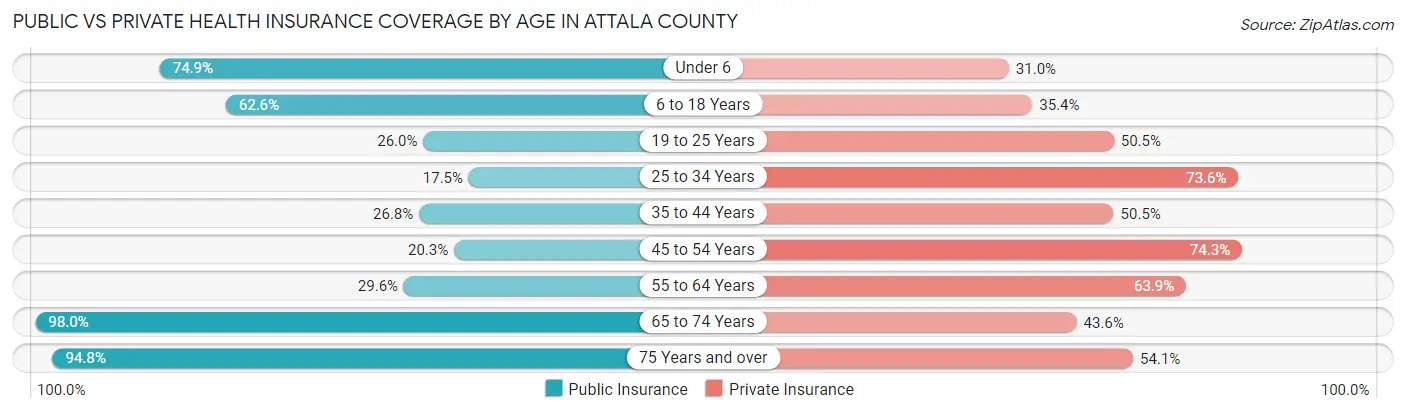
| Age Bracket | Public Insurance | Private Insurance |
| Under 6 | 937 (74.9%) | 388 (31.0%) |
| 6 to 18 Years | 2,235 (62.6%) | 1,262 (35.4%) |
| 19 to 25 Years | 402 (26.0%) | 781 (50.5%) |
| 25 to 34 Years | 277 (17.5%) | 1,162 (73.6%) |
| 35 to 44 Years | 548 (26.8%) | 1,033 (50.5%) |
| 45 to 54 Years | 422 (20.3%) | 1,545 (74.3%) |
| 55 to 64 Years | 674 (29.6%) | 1,455 (63.9%) |
| 65 to 74 Years | 1,857 (98.0%) | 826 (43.6%) |
| 75 Years and over | 1,185 (94.8%) | 676 (54.1%) |
| Total | 8,537 (48.8%) | 9,128 (52.2%) |
Disability Status by Sex by Age in Attala County
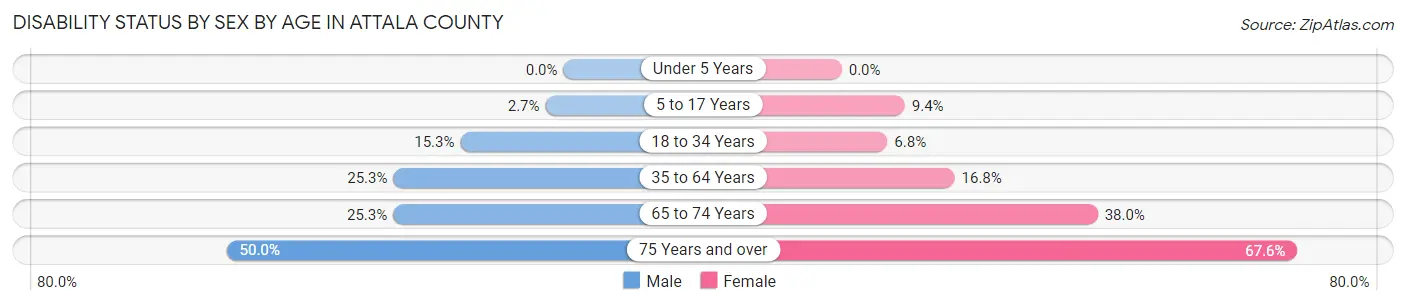
| Age Bracket | Male | Female |
| Under 5 Years | 0 (0.0%) | 0 (0.0%) |
| 5 to 17 Years | 43 (2.7%) | 168 (9.4%) |
| 18 to 34 Years | 260 (15.3%) | 119 (6.8%) |
| 35 to 64 Years | 773 (25.3%) | 560 (16.8%) |
| 65 to 74 Years | 221 (25.3%) | 388 (38.0%) |
| 75 Years and over | 231 (50.0%) | 533 (67.6%) |
Disability Class by Sex by Age in Attala County
Disability Class: Hearing Difficulty
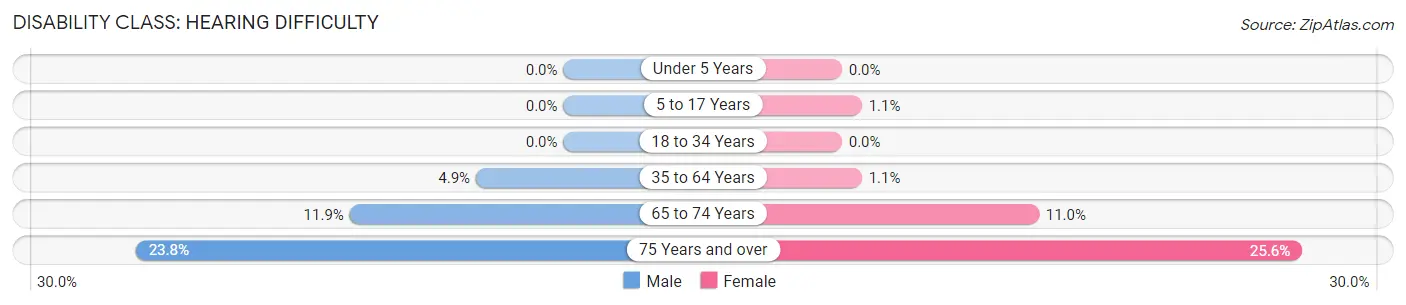
| Age Bracket | Male | Female |
| Under 5 Years | 0 (0.0%) | 0 (0.0%) |
| 5 to 17 Years | 0 (0.0%) | 20 (1.1%) |
| 18 to 34 Years | 0 (0.0%) | 0 (0.0%) |
| 35 to 64 Years | 149 (4.9%) | 37 (1.1%) |
| 65 to 74 Years | 104 (11.9%) | 112 (11.0%) |
| 75 Years and over | 110 (23.8%) | 202 (25.6%) |
Disability Class: Vision Difficulty
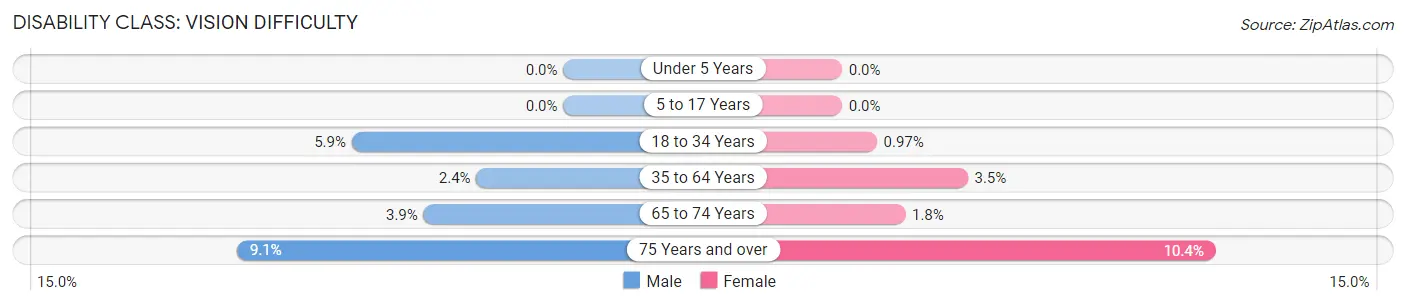
| Age Bracket | Male | Female |
| Under 5 Years | 0 (0.0%) | 0 (0.0%) |
| 5 to 17 Years | 0 (0.0%) | 0 (0.0%) |
| 18 to 34 Years | 100 (5.9%) | 17 (1.0%) |
| 35 to 64 Years | 74 (2.4%) | 117 (3.5%) |
| 65 to 74 Years | 34 (3.9%) | 18 (1.8%) |
| 75 Years and over | 42 (9.1%) | 82 (10.4%) |
Disability Class: Cognitive Difficulty
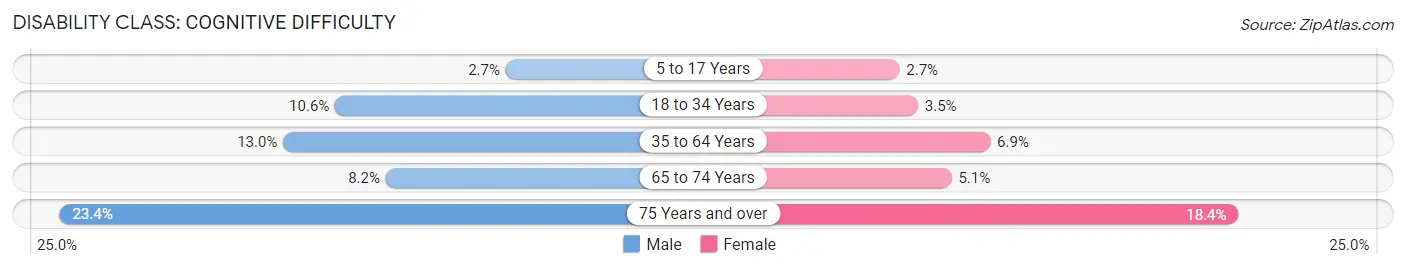
| Age Bracket | Male | Female |
| 5 to 17 Years | 43 (2.7%) | 48 (2.7%) |
| 18 to 34 Years | 180 (10.6%) | 62 (3.5%) |
| 35 to 64 Years | 398 (13.0%) | 230 (6.9%) |
| 65 to 74 Years | 72 (8.2%) | 52 (5.1%) |
| 75 Years and over | 108 (23.4%) | 145 (18.4%) |
Disability Class: Ambulatory Difficulty
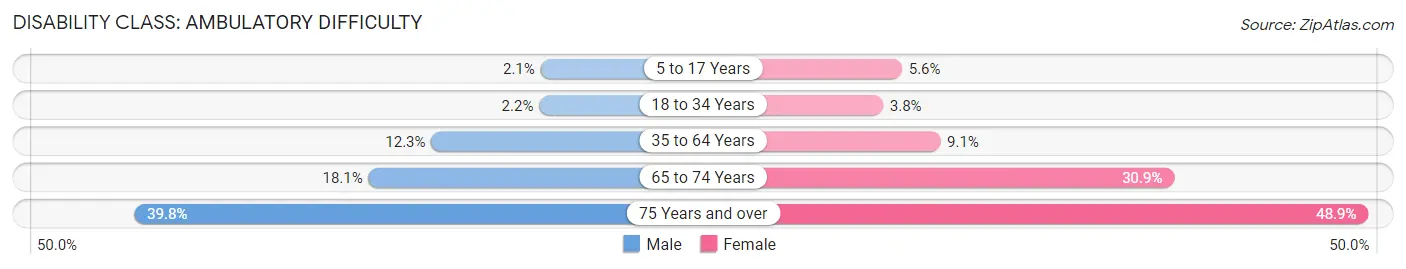
| Age Bracket | Male | Female |
| 5 to 17 Years | 34 (2.1%) | 100 (5.6%) |
| 18 to 34 Years | 38 (2.2%) | 67 (3.8%) |
| 35 to 64 Years | 375 (12.2%) | 305 (9.1%) |
| 65 to 74 Years | 158 (18.1%) | 315 (30.8%) |
| 75 Years and over | 184 (39.8%) | 385 (48.9%) |
Disability Class: Self-Care Difficulty
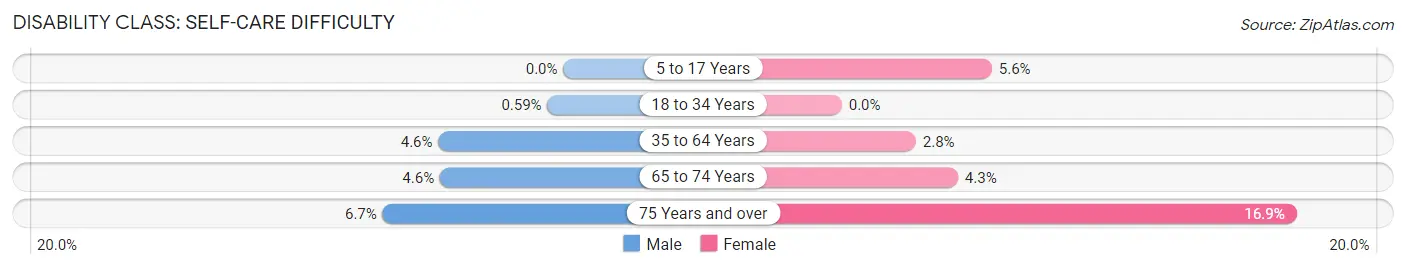
| Age Bracket | Male | Female |
| 5 to 17 Years | 0 (0.0%) | 100 (5.6%) |
| 18 to 34 Years | 10 (0.6%) | 0 (0.0%) |
| 35 to 64 Years | 142 (4.6%) | 92 (2.8%) |
| 65 to 74 Years | 40 (4.6%) | 44 (4.3%) |
| 75 Years and over | 31 (6.7%) | 133 (16.9%) |
Technology Access in Attala County
Computing Device Access in Attala County
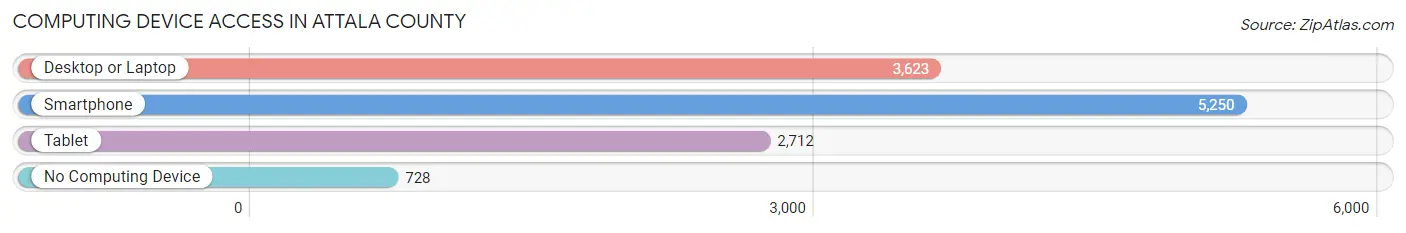
| Device Type | # Households | % Households |
| Desktop or Laptop | 3,623 | 57.4% |
| Smartphone | 5,250 | 83.2% |
| Tablet | 2,712 | 43.0% |
| No Computing Device | 728 | 11.5% |
| Total | 6,311 | 100.0% |
Internet Access in Attala County
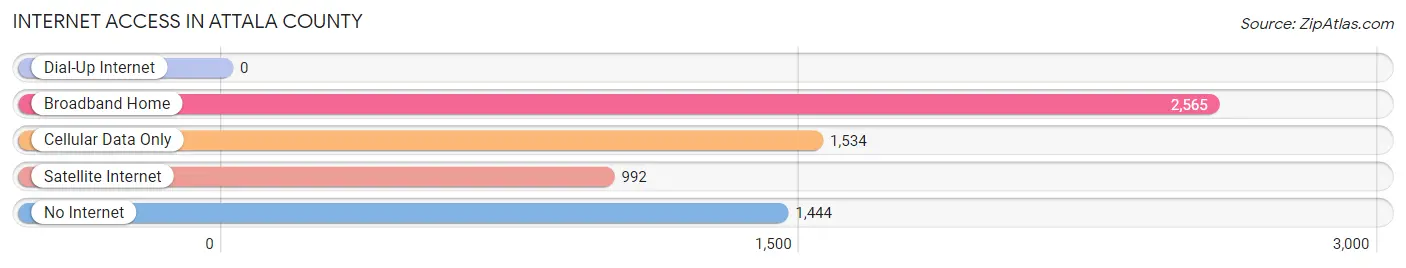
| Internet Type | # Households | % Households |
| Dial-Up Internet | 0 | 0.0% |
| Broadband Home | 2,565 | 40.6% |
| Cellular Data Only | 1,534 | 24.3% |
| Satellite Internet | 992 | 15.7% |
| No Internet | 1,444 | 22.9% |
| Total | 6,311 | 100.0% |
Attala County Summary
Attala County is located in the central part of Mississippi, in the United States. It is bordered by Holmes County to the north, Leake County to the east, Winston County to the south, and Carroll County to the west. The county seat is Kosciusko, and the county has a total area of 545 square miles.
History
Attala County was established in 1833, and was named after the Choctaw chief, Attala. The county was originally part of the Choctaw Nation, and was part of the Chickasaw Cession of 1832. The county was formed from parts of Carroll, Holmes, and Leake counties.
The first settlers in the area were mostly Scotch-Irish and German immigrants. The first county seat was established in 1834 in the town of Kosciusko, which was named after the Polish patriot, Tadeusz Kosciuszko. The county was largely agricultural, and cotton was the main crop.
Geography
Attala County is located in the central part of Mississippi, and is bordered by Holmes County to the north, Leake County to the east, Winston County to the south, and Carroll County to the west. The county has a total area of 545 square miles, and is mostly flat, with some rolling hills. The terrain is mostly covered in pine and hardwood forests. The county is drained by the Yockanookany and Big Black Rivers.
Economy
The economy of Attala County is largely based on agriculture. The main crops are cotton, soybeans, corn, and wheat. Livestock production is also important, with cattle, hogs, and poultry being the main animals raised.
The county also has a number of manufacturing and industrial businesses, including furniture, textiles, and wood products. Tourism is also an important part of the economy, with the Natchez Trace Parkway running through the county.
Demographics
As of the 2010 census, Attala County had a population of 19,564. The population was 53.3% White, 44.2% African American, 0.5% Native American, 0.3% Asian, 0.2% from other races, and 1.5% from two or more races. Hispanic or Latino of any race were 1.2% of the population.
The median income for a household in the county was $30,945, and the median income for a family was $37,945. The per capita income for the county was $16,845. About 22.2% of the population was below the poverty line.
Common Questions
What is Per Capita Income in Attala County?
Per Capita income in Attala County is $27,625.
What is the Median Family Income in Attala County?
Median Family Income in Attala County is $51,463.
What is the Median Household income in Attala County?
Median Household Income in Attala County is $42,680.
What is Income or Wage Gap in Attala County?
Income or Wage Gap in Attala County is 32.0%.
Women in Attala County earn 68.0 cents for every dollar earned by a man.
What is Family Income Deficit in Attala County?
Family Income Deficit in Attala County is $12,247.
Families that are below poverty line in Attala County earn $12,247 less on average than the poverty threshold level.
What is Inequality or Gini Index in Attala County?
Inequality or Gini Index in Attala County is 0.54.
What is the Total Population of Attala County?
Total Population of Attala County is 17,842.
What is the Total Male Population of Attala County?
Total Male Population of Attala County is 8,537.
What is the Total Female Population of Attala County?
Total Female Population of Attala County is 9,305.
What is the Ratio of Males per 100 Females in Attala County?
There are 91.75 Males per 100 Females in Attala County.
What is the Ratio of Females per 100 Males in Attala County?
There are 109.00 Females per 100 Males in Attala County.
What is the Median Population Age in Attala County?
Median Population Age in Attala County is 39.1 Years.
What is the Average Family Size in Attala County
Average Family Size in Attala County is 3.6 People.
What is the Average Household Size in Attala County
Average Household Size in Attala County is 2.8 People.
How Large is the Labor Force in Attala County?
There are 7,567 People in the Labor Forcein in Attala County.
What is the Percentage of People in the Labor Force in Attala County?
55.0% of People are in the Labor Force in Attala County.
What is the Unemployment Rate in Attala County?
Unemployment Rate in Attala County is 7.2%.