Zip Codes with the Highest Percentage of Self-Employed / Not Incorporated in Pontiac, MI
RELATED REPORTS & OPTIONS
Self-Employed / Not Incorporated
Pontiac
Compare Zip Codes
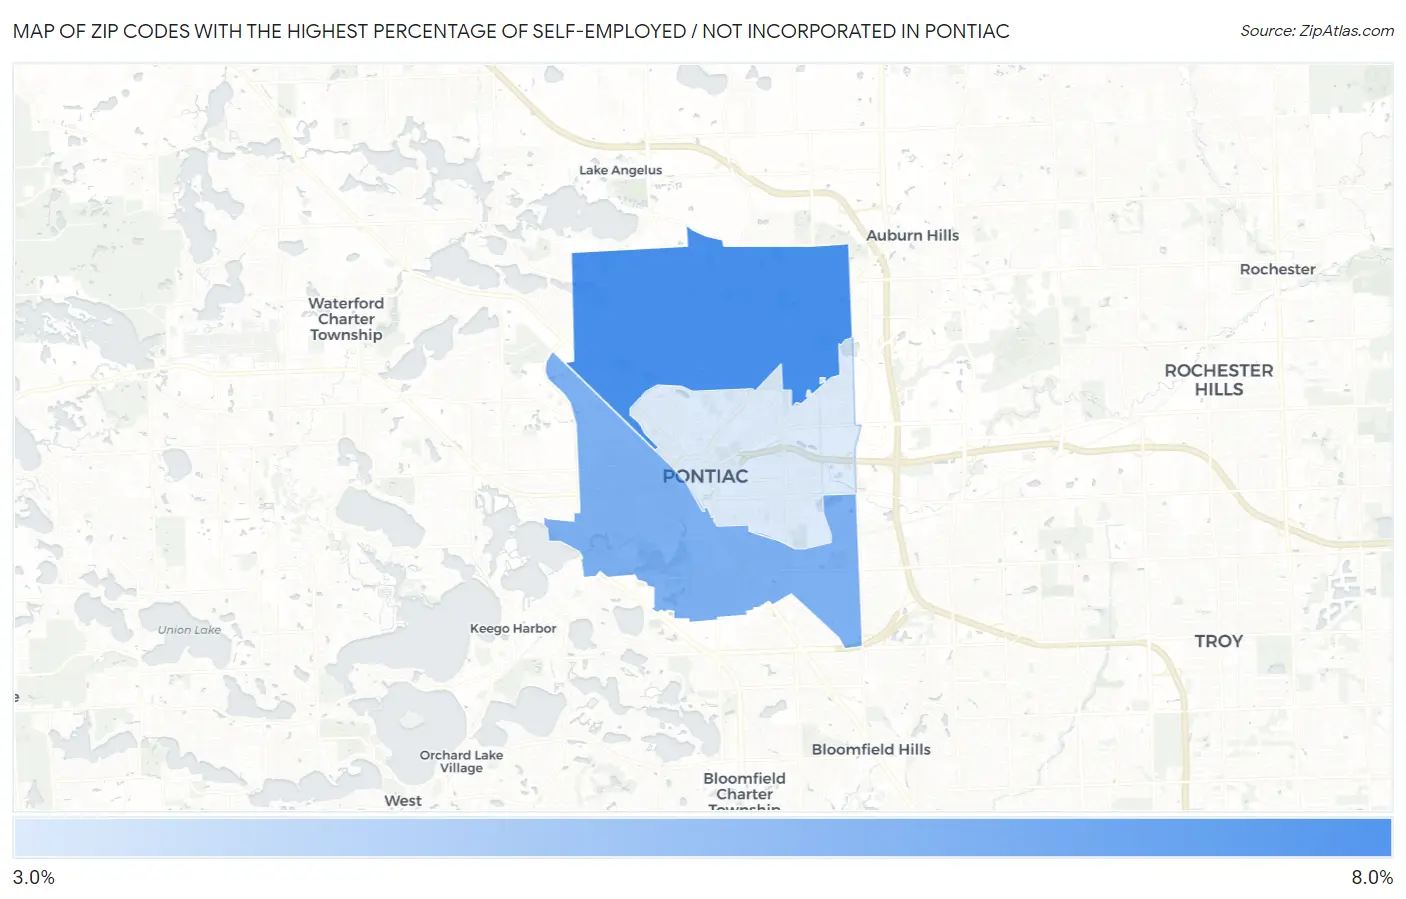
Map of Zip Codes with the Highest Percentage of Self-Employed / Not Incorporated in Pontiac
0.0%
8.0%
Zip Codes with the Highest Percentage of Self-Employed / Not Incorporated in Pontiac, MI
| Zip Code | % Self-Employed / Not Incorporated | vs State | vs National | |
| 1. | 48340 | 6.1% | 4.9%(+1.13)#402 | 5.8%(+0.243)#15,878 |
| 2. | 48341 | 5.2% | 4.9%(+0.306)#501 | 5.8%(-0.578)#18,764 |
| 3. | 48342 | 3.7% | 4.9%(-1.19)#749 | 5.8%(-2.07)#24,266 |
1
Common Questions
What are the Top Zip Codes with the Highest Percentage of Self-Employed / Not Incorporated in Pontiac, MI?
Top Zip Codes with the Highest Percentage of Self-Employed / Not Incorporated in Pontiac, MI are:
What zip code has the Highest Percentage of Self-Employed / Not Incorporated in Pontiac, MI?
48340 has the Highest Percentage of Self-Employed / Not Incorporated in Pontiac, MI with 6.1%.
What is the Percentage of Self-Employed / Not Incorporated in Pontiac, MI?
Percentage of Self-Employed / Not Incorporated in Pontiac is 5.1%.
What is the Percentage of Self-Employed / Not Incorporated in Michigan?
Percentage of Self-Employed / Not Incorporated in Michigan is 4.9%.
What is the Percentage of Self-Employed / Not Incorporated in the United States?
Percentage of Self-Employed / Not Incorporated in the United States is 5.8%.